

Submitted:
11 September 2026
Posted:
14 September 2026
You are already at the latest version
Abstract
We report on our experimental study of polycrystalline Ge2Sb2Te5 including crystal structure (through x-ray diffraction and Raman spectroscopy), electrical resistivity ρ(T) (with applied magnetic field up to 35 Tesla), thermal conductivity κ(T), Seebeck coefficient S(T), and magnetic susceptibility in a wide temperature range. We find a residual resistivity ratio ρ(300 K)/ρ(1.8 K) of approximately 1.2 and a power-law, ρ(T) ∝ Tⁿ temperature dependent metallic behavior; where n ≈ 2 for1.8 K ≤ T ≤ 50 K and n ≈ 1.22 for 50 K < T ≤ 400 K. These results indicate that electron-phonon scattering dominates charge transport above 50 K, whereas electron-electron scattering becomes significant at lower temperatures. In applied magnetic fields B (up to 35 T) magnetoresistance is positive with an approximately linear √B dependence. Although at room temperature, thermal conductivity κ(T) is relatively low, about 2.5 W m⁻¹ K⁻¹ the Seebeck coefficient S(T) is also small. The implications of these findings are discussed.
Keywords:
electrical resistivity
; magneto-resistance
; thermal conductivity
; Seebeck coefficient
; electron scattering
1. Introduction
Chalcogenide-based materials have attracted extensive attention over a century due to their unique properties with potential for use in a variety of applications like solar cells [1], photocatalysis [2], thermoelectric devices [3], optoelectronics [4], and topological insulation [5]. These properties largely stem from the tunable chemical environment, allow for change of electronic and optical properties without drastic changes in chemical composition. A representative class of the chalcogenide is that undergoes crystalline-amorphous phase change, accompanied by the changes in bond lengths, bond angles, and coordination numbers [6]. These phase change materials (PCMs) can serve as switches between two distinct phases [7].
Among PCMs, Ge2Sb2Te5 (GST225) has been patented [8]. However, its structural and physical properties have never been reported. In this article, we report experimental investigation of bulk GST225 including the crystalline structure (through x-ray diffraction and Raman spectroscopy), electrical resistivity ρ(T) (with applied magnetic field up to 35 Tesla), thermal conductivity κ(T), Seebeck coefficient S(T), and magnetic susceptibility in a wide temperature range (1.8 K and 400 K). Our results suggest that the hexagonally structured GST225 exhibits interesting thermoelectric and magneto transport properties.
2. Structural Characterization
The polycrystalline bulk samples were purchased from a commercial vender (Columbia International). Figure 1(a) shows the crystalline structure of Ge2Sb2Te5 at room temperature, based on the x-ray diffraction pattern (XRD) presented in Figure 1(b). The major peaks in this XRD are in alignment with published reports [9,10] for the hexagonal crystalline phase and are indexed in the figure. Based on this, we obtain the lattice parameters a = 4.22Å, and c = 17.0Å.
As shown in Figure 1(c), the room-temperature scanning electron microscope (SEM) image shows (1) crystallinity and (2) a layered structure, consistent with that illustrated in Figure 1(a). According to energy dispersive x-ray (EDX) spectrum shown in Figure 1(e), major peaks are from Ge, Sb, and Te, with a small amounts of trace elements like O and Al. The atomic ratio Ge : Sb : Te are 2:2:5. Consistent result is also obtained from the Raman spectrum of GST225 shown in Figure 1(f). The peaks at ~124 cm-1, ~150 cm-1, ~160 cm-1, and 300 cm-1 are associated with the Ge-Te, Sb-Te, Sb-Sb, and Ge-Ge vibration modes, respectively, and the peak at 441.5 cm-1 with the modes of GeO2 [11,12,13,14,15].
3. Magnetic Susceptibility
Given that our GST225 is crystallized with the hexagonal structure at room temperature, it is not clear if there is any abnormal behavior above the room temperature. Figure 1(d) shows the temperature dependence of the magnetic susceptibility χ(T) between 350 K and 800 K, measured by a vibrating sample magnetometer in a magnetic field of 3 Tesla. The small diamagnetic susceptibility reflects the dominant core contribution diamagnetism over the entire measured temperature range. There is a noticeable jump in χ(T) at Tx ~ 575 K. Also, above Tx, the magnitude of χ(T) decreases with increasing temperature. While the origin is presently unknown, such a change in magnetic susceptibility is likely due to a change in the electronic structure.
4. Electrical Resistivity and Magneto Transport
Figure 2(a) shows the temperature dependence of the electrical resistivity ρ(T) between 1.8 K to 400 K. With increasing temperature, ρ(T) smoothly increases with the positive slope dρ/dT without any anomaly. The residual resistivity ratio (RRR) defined as ρ(300 K)/ρ(1.8 K) ~ 1.2. This indicates that there is no phase transition below 400 K, implying the possible hexagonal-cubic-amorphous transitions are absent in our samples.
To quantitatively analyze the resistivity behavior, we plot the low temperature ρ(T) in Figure 2(b). The observed T2 dependence of ρ(T) implies that the low-temperature electrical transport is dominant with electron-electron scattering. As shown in Figure 2(b), the data can be well described by ρ(T) = ρ0 + AT2. Here, ρ0 is the residual resistivity and A is a constant. The green line in Figure 2(b) represents the best fit with ρ0 = 1.2068ⅹ10-5Ω•m and A = 9.036x10⁻¹¹Ω•m•k-2. Above ~50 K, ρ(T) gradually departs from the T2 behavior but retains power-law temperature dependence. As demonstrated in Figure 2(c), ρ(T) plotted as a function of T1.22 is linear between 50 K and 400 K. Such power-law dependence with 1 < n < 2 suggests that the electrical transport is mixed with both electron-electron and electron-phonon scattering, the latter is expected to give linear temperature dependence in this temperature range.
Through the above analysis, the electrical transport seems conventional with both electron-electron and electron-phonon scattering. In such a scenario, the magnetoresistance (MR), = is usually small. According to the band theory for a single-band solid at the Fermi energy, MR is expected to depend quadratically on H at low fields and saturate at high fields. For systems with multiple bands at the Fermi energy involving two types of charge carriers, the magnetoresistance can be described by = αB2/ (β + γB2) (where α, β, and γ are positive constants). In either case, a linear-- dependent is unexpected. We recall that - dependence of was observed in single-layer graphene [16]. Theoretical explanation is that the behavior can occur when a material with a linear dispersion such as graphene and short-range disorder (i.e., the electron wavelength is much longer than the correlation radius) [17,18]. From this point of view, GST225 may contain linear dispersive bands. Due to the polycrystalline nature, short-range disorder surely exists. Recently, Leahy et al. have provided [19] a refined theoretical analysis including Kohler’s rule of experimental magnetoresistance data. For similar levels of refinement, both band structure calculations and single-crystal samples of GST225 will be needed.
We measured the magnetoresistance in magnetic fields (B) up to 35 Tesla. As B increases is observed to increase up to nearly 50%. Below 20K, the temperature and field dependence of scales universally as a function of following Kohler rule. The Kohler plot T = 0.52K, 1.8K, 5.0 K, 10 K, 20 K, 30 K, and 40 K is shown in Figure 2(d). Several features are worth mentioning: (1) is positive at all measured temperatures, (2) The field dependence of is similar between 5 K and 40 K, and (3) exhibits linear dependence with over a wide field range without the sign of saturation.
5. Thermal
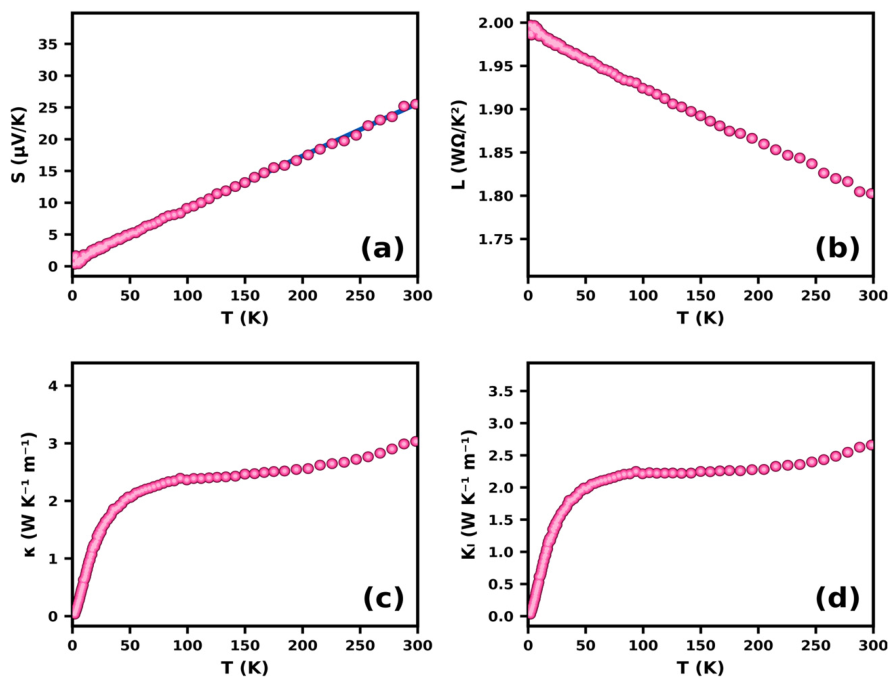
Figure 3(a) shows the temperature dependence of the thermal conductivity (κ), which was measured using the four-probe method without radiation correction. At T = 300 K, κ ~ 3.0 W/K-m, close to that obtained in Ge2Sb2Te5 [20]. Due to the polycrystalline nature, the characteristic thermal conductivity peak is absent at low temperatures. Since the electrical resistivity is low (see Figure 2(a)), the electronic thermal conductivity may not be negligible, which can be estimated via the Wiedemann-Franz law . Here, L = 2.44 × 10⁻⁸ WΩ/K2.
Figure 3(d) shows the temperature dependence of the Seebeck coefficient S(T). The positive S suggests that GST225 is hole dominant. Interestingly, S shows linear temperature dependence between 1.8 K and 320 K. According to Mott formula, [21], where is the density of states at the Fermi level. Our observation of the linear behavior suggests that the density of the states remains temperature independent over a wide temperature range.
Conclusions
Our experimental investigation of Ge2Sb2Te5 reveals metallic behavior with electron-phonon scattering dominant between 50 K and 400 K and electron-electron scattering below 50 K. Interestingly, exhibits a dependence over a wide field range without sign of saturation, likely reflecting a unique band structure and/or short-range disorder. While the thermal conductivity is ~ 3 W/K-m at room temperature, positive Seebeck coefficient with linear temperature dependence in a wide temperature range is worth further investigation.
Acknowledgments
The work is supported in part by DOE award DE-NA0002630.; The work by R.J. is supported by the grant No. DE-SC0024501 funded by the U.S. Department of Energy, Office of Science.
References
- Resalati, S.; Okoroafor, T.; Maalouf, A.; Saucedo, E.; Placidi, M. Appl. Energy 2022, 313, 118888.
- Rahman; Khan, M. M. New J. Chem. 2021, 45, 19622.
- Bhukesh, S. K.; Kumar, A.; Gaware, S. K. Mater. Proc. 2020, 26, 3131. [CrossRef]
- Kolobov; Fons, P.; Frenkel, A. I. Jpn. J. Appl. Phys. 2005, 93, 3345.
- Mazumder, K.; P. M. Shirage, J. 2021, 888, 161492.
- Islam, S. M.; Sangwan, V. K.; Buchholz, D. B. JACS 2021, 143, 6221.
- Lazarenko, P.I. AIP Conf. Proc. 1727. 2016, 020023. [Google Scholar]
- Available online: https://www.freepatentsonline.com/y2023/0240081.html#google_vignette.
- Tsafack, Thierry; al, J. Appl. Phys. 2011, 110, 063716.
- Kumar, S. Vacuum 2012, 86, 1443.
- Tominaga, Junji; Atoda, Nobufumi. Jpn. J. Appl. Phys. 1999, 38, L322.
- Sosso, Gabriele C. Phys. Rev. B 2011, 83, 134201.
- Kozyukhin, S. Phys. Procedia 2013, 44, 82.
- Bo, Liu. Chin. Phys. 2004, 13, 1947.
- Scott, J.F. Raman Spectra of GeO2. Phys. Rev. B 1970, 1, 3488. [Google Scholar]
- Vasileva, G. Phys. Status Solidi B 2019, 256, 1800525.
- Alexseev, P. S.; Dmitriev, A. P.; Gornyi, I. V. Phys. Rev. B 2013, 87, 165432.
- Vasileva, G.; al, P.J. Exp. Theo. Phys. 2019, 129, 438.
- Leahy, Ian A. PNAS 2018, 115, 10570. [PubMed]
- Du, Wenbing. Ann. Phys. 2020, 532, 1900390.
- Jonson, M.; Mahan, G. D. Phys. Rev. B 1980, 59, 4223.
Figure 1.
(a) Crystal structure of Ge2Sb2Te5; (b) XRD pattern for our sample at room temperature indexed based on the hexagonal crystal structure; (c) SEM image showing the layered structure; (d) Temperature dependence of the magnetic susceptibility between 350 K and 800 K measured by applying 3 Tesla magnetic field; (e) EDX pattern showing major peaks corresponding to Ge, Sb, and Te; (f) Raman spectrum.
Figure 1.
(a) Crystal structure of Ge2Sb2Te5; (b) XRD pattern for our sample at room temperature indexed based on the hexagonal crystal structure; (c) SEM image showing the layered structure; (d) Temperature dependence of the magnetic susceptibility between 350 K and 800 K measured by applying 3 Tesla magnetic field; (e) EDX pattern showing major peaks corresponding to Ge, Sb, and Te; (f) Raman spectrum.
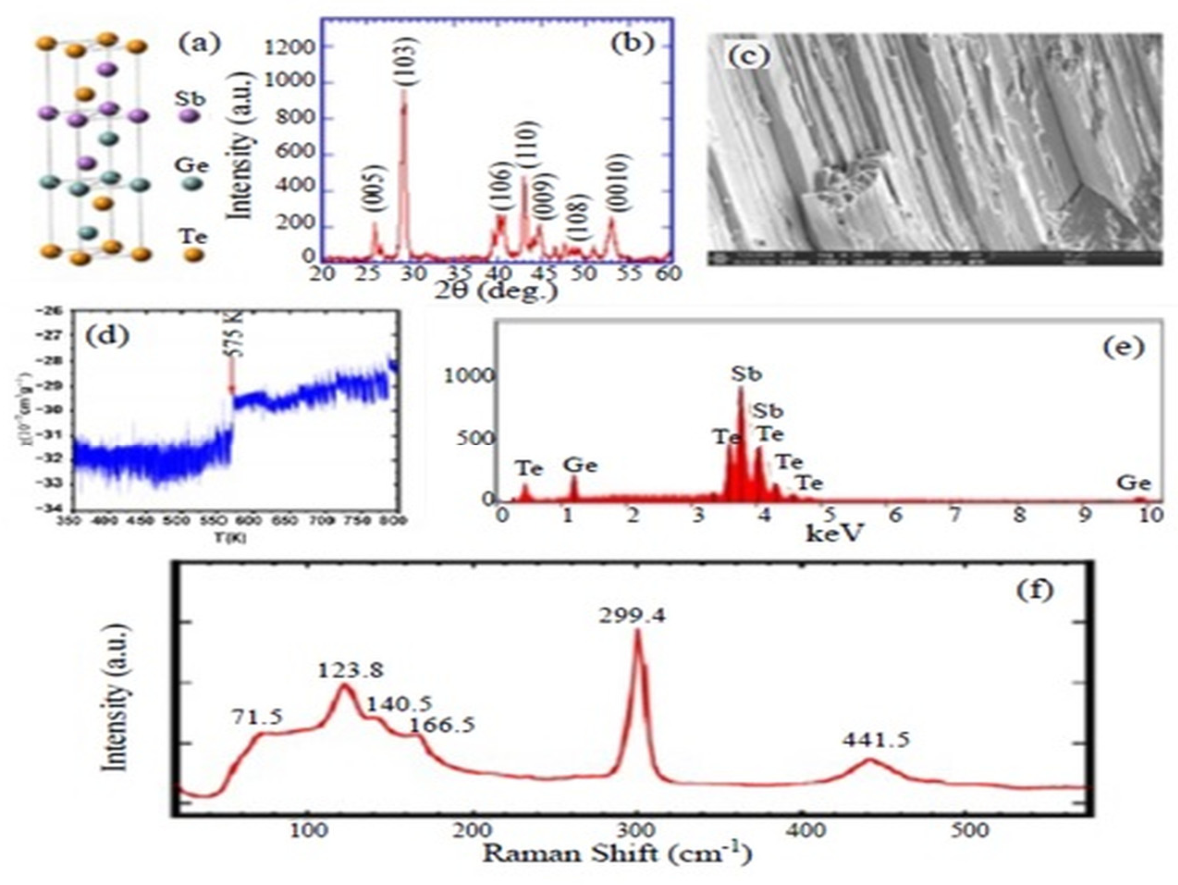
Figure 2.
(a) Resistivity vs temperature between 1.8 and 400 K; (b) Resistivity vs. T2 up to 50 K; (c) Resistivity plotted as ρ vs. T1.22 above 50 K; (d) Kohler’s plot (∆R/R0 vs. ) of magnetoresistance.
Figure 2.
(a) Resistivity vs temperature between 1.8 and 400 K; (b) Resistivity vs. T2 up to 50 K; (c) Resistivity plotted as ρ vs. T1.22 above 50 K; (d) Kohler’s plot (∆R/R0 vs. ) of magnetoresistance.
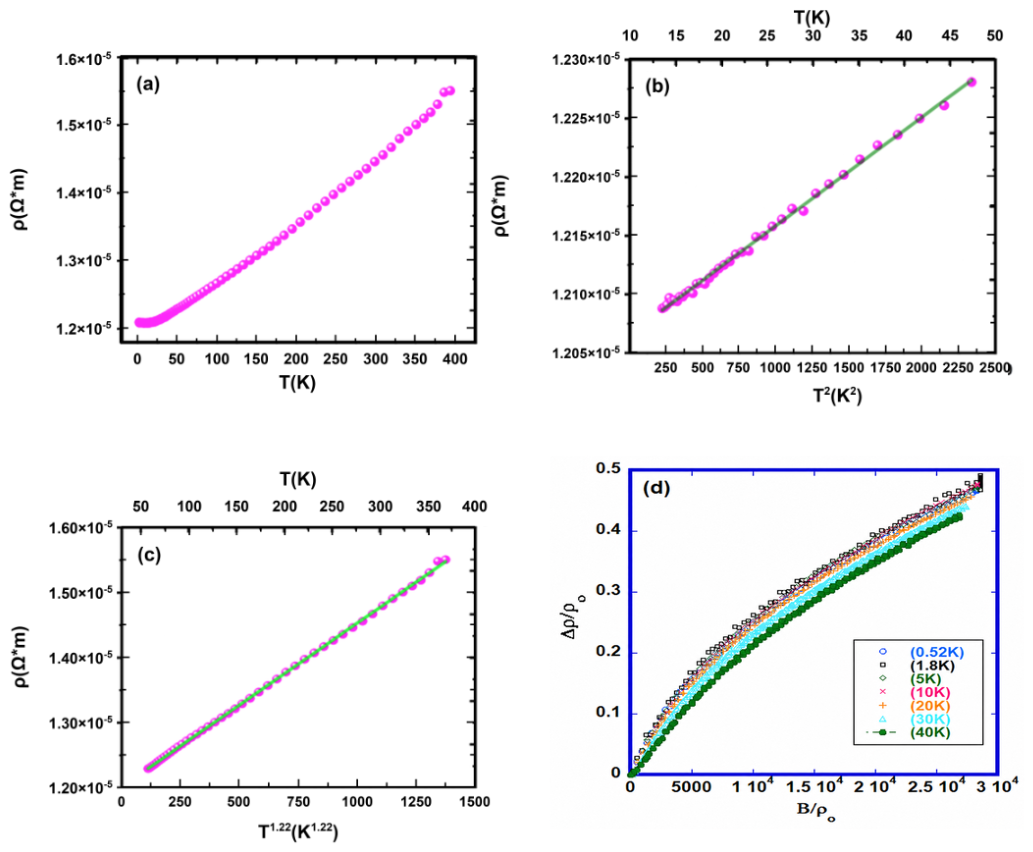
Figure 3.
(a) Temperature dependence of the thermal conductivity (κ); (b) Estimated electronic thermal conductivity (κe) via the Wiedemann-Franz law; (c) Temperature dependence of the phonon thermal conductivity (κL); (d) Temperature dependence of the Seebeck coefficient (S).Figure 3(b) displays the temperature dependence of which increases with increasing temperature. The phonon thermal conductivity κL can thus be estimated via κL = κ - κe. The temperature dependence of κL is shown in Figure 3(c). It seems that phonons carry about five times than the charge carries.
Figure 3.
(a) Temperature dependence of the thermal conductivity (κ); (b) Estimated electronic thermal conductivity (κe) via the Wiedemann-Franz law; (c) Temperature dependence of the phonon thermal conductivity (κL); (d) Temperature dependence of the Seebeck coefficient (S).Figure 3(b) displays the temperature dependence of which increases with increasing temperature. The phonon thermal conductivity κL can thus be estimated via κL = κ - κe. The temperature dependence of κL is shown in Figure 3(c). It seems that phonons carry about five times than the charge carries.
Disclaimer/Publisher’s Note: The statements, opinions and data contained in all publications are solely those of the individual author(s) and contributor(s) and not of MDPI and/or the editor(s). MDPI and/or the editor(s) disclaim responsibility for any injury to people or property resulting from any ideas, methods, instructions or products referred to in the content. |
© 2026 by the authors. Licensee MDPI, Basel, Switzerland. This article is an open access article distributed under the terms and conditions of the Creative Commons Attribution (CC BY) license (http://creativecommons.org/licenses/by/4.0/).
Copyright: This open access article is published under a Creative Commons CC BY 4.0 license, which permit the free download, distribution, and reuse, provided that the author and preprint are cited in any reuse.