

Submitted:
10 September 2026
Posted:
11 September 2026
You are already at the latest version
Abstract
By averaging the sizes of metal nanoparticles capable of merging at different concentrations of elements in the alloy, the size dependence of ultrafine particles on the melting point of the corresponding bulk elements was determined: dMe = 2RMe = 1.46 − 7.3 × 10⁻⁵T0. It was found that the particle size is the predominant factor in the formation of alloys from nanosized particles at low temperatures, regardless of their physical properties and crystal structure. Based on the Thomson equation and the average sizes of metal nanoparticles, the values of interfacial tension at the crystal–melt interface for like metals were derived and found to satisfactorily follow a linear dependence. An approximate calculation of the interfacial tension for nanoparticles of like elements in the range of (100 − dMe) nm revealed no dependence on cluster size in this range. The study of size-dependent properties of dissimilar nanoparticles during the formation of solid solutions requires separate investigation. The obtained results can be used to produce new alloys from other elements not considered in this study.
Keywords:
nanoparticles
; boundaries
; crystal
; liquid
; interfacial tension
; thermodynamics
1. Introduction
The formation of materials via the deposition of sputtered metal nanoparticles has attracted considerable research interest, resulting in a large number of studies in this field. Many of these works have investigated the size dependence of the melting temperature of small particles and clusters [1,2,3,4,5,6,7,8,9,10,11,12].
In Ref. [1], the generalized Thomson formula for the melting temperature of a small object is analyzed from the perspective of thermodynamic similarity. However, it is noted that the limited amount of experimental data still does not allow a reliable conclusion regarding the accuracy of melting-temperature predictions for metal nanoparticles. In Ref. [2], a three-phase model of a simple substance and a nanocrystal model were used to derive an expression for the Helmholtz free energy, which accounts for both lattice vacancies and interstitial atoms. It was shown that for a certain number of atoms in the nanosystem, the S-shaped hysteresis loop of the crystal–liquid phase transition disappears; below this number, the transition does not occur. Various authors have modeled the melting-point depression of Sn and Pb [3], Al [4], V and Ni [5,6], Au, Pd and Pt [7,8], silver [9], and copper [10] using different approaches. The author of Ref. [11] calculated the melting points of nanoparticles of 48 metals and found that most of them with a size of 1 nm are unstable at room temperature.
A significant number of publications have focused on the thermodynamics of small systems. In Refs. [12,13,14], the heat of melting of nanoparticles, the vacancy formation energy, and the prediction of phase transitions were examined. It was found that at a certain number of atoms, the hysteresis between the melting point and the crystallization onset temperature vanishes, and that the vacancy concentration increases with decreasing particle size. The authors of Refs. [15,16,17] devoted considerable attention to modeling the thermodynamic functions of melting of nanocrystals and found that both the enthalpy and entropy of melting decrease with decreasing nanoparticle size. Moreover, surface atoms dominate the size-dependent effects on thermodynamic properties.
The size dependences and thermodynamic functions of melting have been studied for Ag, Pb and Al in Ref. [18], for Fe, Sn, Ag and In in Ref. [19], for Si in Ref. [20], for Sn, Ag, Cu and In in Ref. [21], and for Cu in Ref. [22].
A review of the aforementioned studies reveals that the vast majority are devoted to the melting point and thermodynamic properties of single-metal nanoparticles. Published results on bimetallic systems remain sparse. For instance, in Ref. [5], the melting point of Ti nanoparticles embedded in V and Ni matrices was studied using computational simulations, and it was found that the melting point of Ti nanoparticles increases with decreasing particle size. This was attributed to a stronger interaction of Ti atoms with the surrounding matrix than among Ti atoms themselves.
The melting-point depression of dissimilar nanoparticles was investigated in Ref. [23] for the Ni–Pt system, using classical molecular dynamics simulations. Various coalescence mechanisms were identified, depending on the conditions; in particular, a sharper melting-point decrease was observed for Pt than for Ni. This indicates a change in the melting sequence for nanoparticles of two metals of the same size, which is a characteristic feature of the coalescence of ultrafine particles of dissimilar metals.
Roduner [24], in his discussion of the thermodynamics of small systems, highlighted several key points: for sufficiently small systems, the concepts of phase state and phase transitions lose their meaning; for very small and isolated systems, fluctuations play a dominant role; a reasonable definition of temperature becomes impossible; and the melting and boiling points of liquid nanodroplets are always lower than the corresponding values for the bulk phase of the same material.
In our previous work [25], we examined 20 binary metastable alloys of non-ferrous and rare metals obtained by co-precipitation of ultrafine particles. From the perspective of the Hume–Rothery rules (which apply to equilibrium systems), we observed a significant increase in the solubility of the second element in the matrix metal. In many cases, the 15% limit on the atomic size difference was not observed for metals with either similar or different lattice types. Furthermore, non-compliance with the rules concerning valence values prevailed, and only isolated exceptions were found regarding differences in Pauling electronegativity.
In the present study, we attempted to establish the critical size of metal nanoparticles capable of forming binary alloys and to determine the surface tension at the crystal–melt interface for these elements. The obtained data will allow a preliminary assessment of the particle sizes required for potential alloys without the need for additional experimental trials.
2. Methods and Calculations
Thirty-four binary alloys with various elemental compositions were produced by depositing nanoparticles of co-sputtered dissimilar metals. The total coating thickness was applied as sublayers of each metal onto a moving substrate, with the sublayer thickness corresponding to island films (). This was done to determine the average metal film thickness (particle size) at which coalescence of nanoparticles of dissimilar metals occurs, expressed as , where is the bulk melting temperature of the metal (K). A comprehensive description of this method for producing binary coatings from dissimilar metals is given in Ref. [26].
The alloys were prepared by simultaneous ion-plasma sputtering of two metal targets in magnetron sputtering sources mounted on opposite walls of a vacuum chamber, followed by deposition of ultrafine particles onto a moving unheated substrate. The transit time from one magnetron to the other was 3 s, which is substantially longer than the characteristic time for nanoparticle formation/coalescence. The formation of a solid solution of dissimilar metals was taken as evidence that the metal nanoparticles were in a quasi-liquid state and capable of coalescing.
The sublayer thickness of each metal was used as the size factor, calculated by dividing the total coating thickness by the number of substrate passes relative to the plasma flux of the sputtered metal. The use of sublayer thickness as a size factor is justified because the melting-temperature depression of thin films with decreasing thickness is analogous to that of small particles [24], since their growth follows the “island” mode.
The alloys were synthesized using a custom-designed ion-plasma system with two independent magnetron sputtering units, the schematic of which is shown in Figure 1.
The setup consists of a vacuum chamber with planar DC magnetrons equipped with water-cooled targets mounted on its walls. A rotatable cylinder is installed inside the chamber to hold substrates and move them relative to the magnetrons. High-purity argon was used as the plasma-forming gas. The alloys were obtained by co-sputtering of dissimilar metals onto a substrate moving relative to the plasma flows. The targets were disks of the corresponding metals, 40 mm in diameter and 4 mm thick.
The substrate temperature during sample preparation did not exceed 373 K. The metal concentration ratio in the samples was controlled by the sputtering rate of the targets, i.e., by the electric power supplied to the magnetrons. The ratio of deposited components was monitored gravimetrically, based on the amounts of sputtered and deposited metal, and in parallel by Rutherford backscattering spectrometry (RBS) with protons at the UKP-2-1 tandem accelerator of the Institute of Nuclear Physics (Almaty).
To obtain coatings in the form of solid solutions, polycor (-Al2O3) and single-crystal silicon substrates were used. X-ray diffraction (XRD) analysis was performed using a Bruker D8 Advance diffractometer with Cu K radiation ( nm) and a graphite monochromator. The lattice parameter was calculated as the average value from all diffraction lines of the corresponding phase.
It is known that the melting temperature of metals is influenced by the atomic ionic radius, crystal structure, particle size, alloy composition, the presence of other elements, surface properties, etc. Based on measurements of the critical particle size of metals, and because the melting-point depression () of small metal particles is in most cases well described by a hyperbola:
where is the particle size (m) and k is a coefficient (K·m), we determined the coefficient (k) for the melting-point depression from the bulk value (for niobium) down to 373 K (substrate temperature). This dependence allows one to determine the surface tension at a given nanoparticle size (e.g., 100 nm) and to calculate the linear size dependence of the surface tension [27] at the crystal–melt interface in the range from to 100 nm.
The surface tension at the crystal–melt interface was calculated from the Thomson equation, neglecting the Laplace pressure correction because of its small magnitude:
Here, is the bulk melting point (K), T is the melting point of a particle of radius R (m), is the latent heat of fusion per unit mass (J/kg), is the density of the crystalline particle (kg/m3), and is the surface tension at the crystal–melt interface (N/m). The density and heat of fusion values were taken from Ref. [28] and converted to units of J/kg.
3. Results and Discussion
The binary alloys obtained and the maximum nanoparticle sizes at which coalescence occurred are listed in Table 1. The different values of for alloys of two dissimilar metals arise from the fact that they were determined during the preparation of solid solutions with different compositions.
When plotting the nanoparticle size data against the melting point of the corresponding bulk samples (Figure 2), a linear relationship was established:
The above dependence indicates that the size effect is the determining factor in the transition of metal nanoparticles to a quasi-liquid state.
Based on the average particle size estimated using Equation (3), the surface tension values at the crystal–liquid interface were calculated for nanoparticles of each metal forming the alloy (but not for dissimilar metals; the latter requires additional investigation). The surface tension values, melting point, heat of fusion (), and density of the crystalline particles are given in Table 2.
Analysis of the surface tension values reveals a correlation with the melting point of the bulk samples: as the melting point increases, increases by almost two orders of magnitude. It is noteworthy that the interfacial tension for lead ( N/m) is close to the value calculated in Ref. [29] and determined experimentally in Ref. [30] (0.04 N/m). As shown in Figure 3, the temperature dependence is close to linear and corresponds to the expression . The greatest deviation from the linear dependence is observed for beryllium, hafnium, and molybdenum, which is possibly due to inaccuracies in the determination of the heat of fusion.
Based on Equation (1), the coefficient k was estimated approximately, the melting-point depression was calculated, and the surface tension values for 100 nm nanoparticles were determined. The resulting linear dependences of on particle size in the range from to 100 nm [27] are given in Table 3. It is evident that in this size range, the interfacial tension at the crystal–liquid interface does not depend on nanoparticle size. The change in the sign of the coefficient A in the equation is apparently associated with the approximate determination of the coefficient k in Equation (1).
4. Conclusions
In the present study, by averaging the sizes of nanoparticles of like metals during the formation of bimetallic alloys, the temperature dependence of the particle size on the melting point of the bulk samples was estimated, represented by the expression . The obtained expression indicates that the transition of ultrafine clusters to a quasi-liquid state capable of coalescence does not depend on the physical properties of the material but is governed solely by size. The derived equation allows a preliminary assessment of the particle sizes of potential alloys without the need for additional experimental trials. Determining the feasibility of alloy formation and the size of particles of dissimilar metals requires further investigation.
Based on the Thomson equation and the average sizes of metal nanoparticles, the values of interfacial tension at the crystal–liquid interface for like metals were derived and found to correspond satisfactorily to the linear dependence , with the maximum deviation from it observed for beryllium, hafnium, and molybdenum. An approximate calculation of the interfacial tension for nanoparticles of like elements in the range of nm indicates that it is independent of size within this range of cluster sizes.
The data on particle sizes, their dependence on the melting point under normal conditions, and the surface tension at the crystal–liquid interface, obtained from the technological results of alloy production by deposition of sputtered nanoparticles, can be used for the fabrication of new alloys from other metals and elements. The determination of the interfacial tension at the crystal–liquid interface for dissimilar elements requires a separate study.
References
- Samsonov, V.M.; Vasiliev, S.A.; Bembel, A.G. Size dependence of melting of metallic nanoclusters from the position of thermodynamic similarity. Phys. Met. Metall. 2016, 117, 775–781. [Google Scholar] [CrossRef]
- Magomedov, M.N. On the disappearance of the phase transition crystal–liquid at the reduction of the number of atoms in the system. Surface. X-Ray Synchrotron Neutron Stud. 2019, 9, 103–112. [Google Scholar] [CrossRef]
- Qi, W.H. Size effect on melting temperature of nanosolids. Physica B Condens. Matter 2005, 368, 46–50. [Google Scholar] [CrossRef]
- Sun, J.; Simon, S.L. The melting behaviour of aluminium nanoparticles. Thermochim. Acta 2007, 463, 32–40. [Google Scholar] [CrossRef]
- Bandin, A.E.; Beznosyuk, S.A. Dependence of nanoparticles melting temperature on its shape on the example of titanium nanoparticles. Proc. AltSU. Chem. 2011, 71, 127–130. [Google Scholar]
- van Teijlingen, A.; Davis, S.A.; Hall, S.R. Size-dependent melting point depression of nickel nanoparticles. Nanoscale Adv. 2020, 2, 2347–2351. [Google Scholar] [CrossRef]
- Guenther, G.; Guillon, O. Models of size-dependent nanoparticle melting tested on gold. J. Mater. Sci. 2014, 49, 7915–7932. [Google Scholar] [CrossRef]
- Paytov, V.V.; Romanov, A.A.; Talyzin, I.V.; Samsonov, V.M. Features and mechanisms of coalescence of nanodroplets and sintering of metal nanoparticles: Molecular dynamics simulation. Russ. Chem. Bull. 2022, 71, 686–693. [Google Scholar] [CrossRef]
- Feng, D.; Feng, Y.; Yuan, S.; Zhang, X.; Wang, G. Melting behaviour of Ag nanoparticles and their clusters. Appl. Therm. Eng. 2017, 111, 1457–1463. [Google Scholar] [CrossRef]
- Wu, R.; Zhao, X.; Liu, Y. Atomic insights of Cu nanoparticles melting and sintering behaviour in Cu–Cu direct bonding. Mater. Des. 2021, 197, 109240. [Google Scholar] [CrossRef]
- Yurov, V.M. Melting point of nanoparticles of pure metals. Vestn. Karaganda Univ. Ser. Phys. 2012, 67, 27–35. [Google Scholar]
- Magomedov, M.N. Heat of melting of nanoparticle. J. Tech. Phys. 2011, 81, 57–62. [Google Scholar]
- Gladkikh, N.T.; Kryshtal, A.P.; Bogatyrenko, S.I. Melting temperature of nanoparticles and energy of vacancy formation in them. J. Tech. Phys. 2010, 80, 111–114. [Google Scholar]
- Sheng, H.; Xiao, B.; Jiang, X. Size dependence of the phase transition temperature of metal nanocrystals. Physica B Condens. Matter 2023, 667, 415193. [Google Scholar] [CrossRef]
- Zhang, Z.; Lü, X.X.; Jiang, Q. Finite size effect on melting enthalpy and melting entropy of nanocrystals. Physica B Condens. Matter 1999, 270, 249–254. [Google Scholar] [CrossRef]
- Luo, W.; Hu, W.; Xiao, S. Size effect on the thermodynamic properties of silver nanoparticles. J. Phys. Chem. C 2008, 112, 2359–2369. [Google Scholar] [CrossRef]
- Luo, W.; Hu, W. Gibbs free energy, surface stress and melting point of nanoparticle. Physica B Condens. Matter 2013, 425, 90–94. [Google Scholar] [CrossRef]
- Safaei, A.; Shandiz, M.A. Size-dependent thermal stability and the smallest nanocrystal. Physica E Low.-Dimens. Syst. Nanostructures 2009, 41, 359–364. [Google Scholar] [CrossRef]
- Kumar, R.; Sharma, G.; Kumar, M. Effect of size and shape on the vibrational and thermodynamic properties of nanomaterials. J. Thermodyn. 2013, 328051. [Google Scholar] [CrossRef]
- Talyzin, I.V.; Samsonov, M.V.; Pushkar, M.Y.; Dronnikov, V.V. Size dependence of the melting temperature of silicon nanoparticles: Molecular dynamics and thermodynamic modelling. Microcryst. Nanocrystalline Porous Compos. Semicond. 2019, 53, 947–953. [Google Scholar] [CrossRef]
- Qiu, Y.; Liu, W.; Zhang, W.; Zhai, C. Theoretical study on the effect of size factor on entropy and enthalpy of melting for tin, silver, copper and indium nanoparticles. Met. Phys. Metall. 2019, 120, 451–456. [Google Scholar] [CrossRef]
- Cui, Z.; Ji, B.; Fu, Q.; Duan, H.; Xue, Y.; Li, Z. Research on size dependent integral melting thermodynamic properties of Cu nanoparticles. J. Chem. Thermodyn. 2020, 149, 106148. [Google Scholar] [CrossRef]
- Toulkeridou, E.; Kioseoglou, J.; Grammatikopoulos, P. On the melting, coalescence, and chemical ordering of bimetallic nanoparticles: The miscible Ni–Pt system. Nanoscale Adv. 2022, 4, 4819–4828. [Google Scholar] [CrossRef] [PubMed]
- Roduner, E. Size Effects in Nanomaterials; Technosphere: Moscow, Russia, 2010; p. 192. [Google Scholar]
- Volodin, V.N.; Tuleushev, Yu.Zh.; Zhakanbaev, E.A.; Kalieva, A.K. Metastable solid solutions formed by metal nanoparticles. Phys. Met. Metallogr. 2023, 124, 479–486. [Google Scholar] [CrossRef]
- Tuleushev, Yu.Zh.; Volodin, V.N.; Zhakanbayev, E.A.; Gorlachyov, I.D.; Suslov, E.E. Magnetron technology for preparation of tape superconductors with Nb3Ge coating. Vacuum 2023, 208, 111711. [Google Scholar] [CrossRef]
- Samsonov, V.M. Size dependence of the surface tension of nanoparticles. Bull. Russ. Acad. Sci. Phys. 2019, 83, 784–787. [Google Scholar] [CrossRef]
- Babichev, A.N.; Babushkina, N.A. Physical Quantities. Reference Book; Grigoriev, I.S., Meilikhov, E.Z., Eds.; Energoatomizdat: Moscow, Russia, 1991; p. 99, 289. [Google Scholar]
- Peters, K.F.; Cohen, J.B.; Chung, Y.W. Melting of Pb nanocrystals. Phys. Rev. B 1998, 57, 13430–13438. [Google Scholar] [CrossRef]
- Eustathopoulos, N. Energetics of solid/liquid interfaces of metals and alloys. Int. Met. Rev. 1983, 28, 189–210. [Google Scholar] [CrossRef]
Figure 1.
Scheme of the ion-plasma setup: 1–vacuum chamber body; 2–magnetrons; 3–cylinder; 4–substrate; 5–gas evacuation port; 6–housing.
Figure 1.
Scheme of the ion-plasma setup: 1–vacuum chamber body; 2–magnetrons; 3–cylinder; 4–substrate; 5–gas evacuation port; 6–housing.
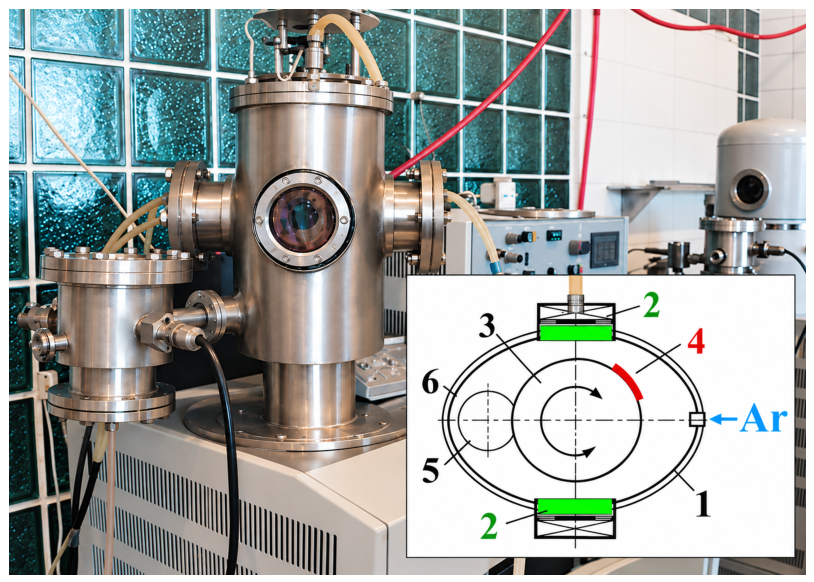
Figure 2.
Dependence of metal particle size on their melting temperature.
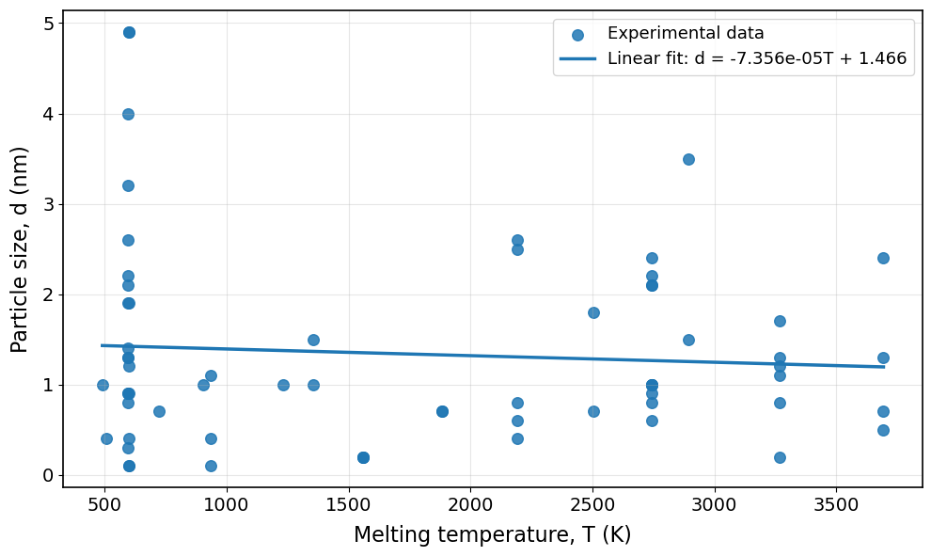
Figure 3.
Dependence of the interfacial surface tension of elements on the melting temperature of the bulk sample.
Figure 3.
Dependence of the interfacial surface tension of elements on the melting temperature of the bulk sample.
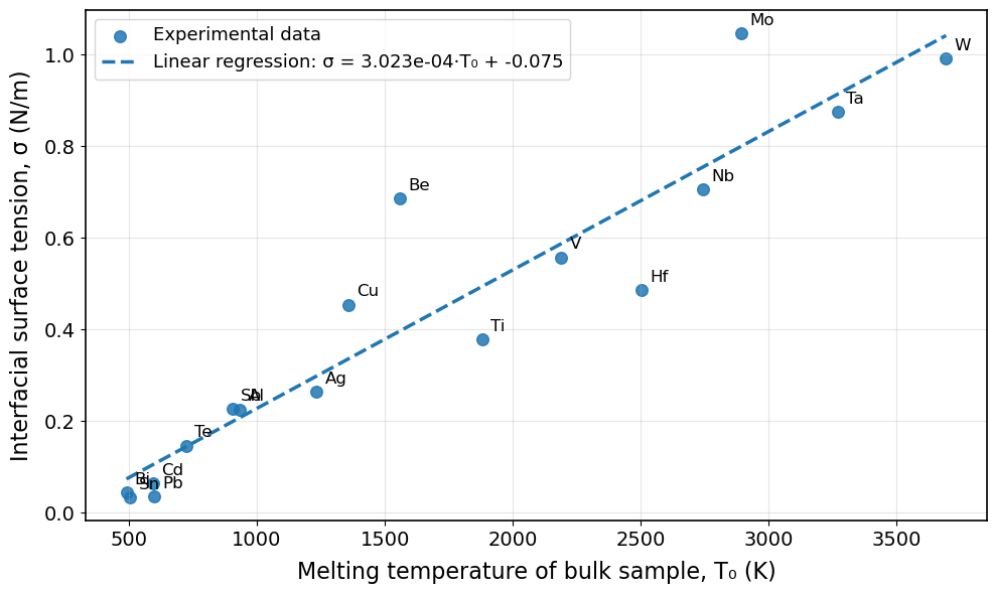

Table 1.
Particle sizes of metals at which alloys were formed.
| No. | Alloy A–B | , nm | , nm | No. | Alloy A–B | , nm | , nm |
|---|---|---|---|---|---|---|---|
| 1 | Ta–Cd | 1.7 | 2.1 | 19 | Nb–Cd | 2.2 | 3.2 |
| 2 | Ta–Cd | 1.2 | 2.6 | 20 | Nb–Cd | 0.6 | 1.3 |
| 3 | Ta–Cd | 0.2 | 4.0 | 21 | Nb–Cd | 2.1 | 1.4 |
| 4 | Ta–Al | 0.8 | 1.1 | 22 | Hf–Cd | 1.8 | 0.9 |
| 5 | Ta–Be | 1.1 | 0.2 | 23 | Hf–Cd | 0.7 | 0.9 |
| 6 | Ta–Be | 1.3 | 0.2 | 24 | V–Pb | 2.6 | 0.9 |
| 7 | W–Pb | 2.4 | 1.9 | 25 | V–Pb | 2.5 | 0.4 |
| 8 | W–Nb | 0.5 | 0.9 | 26 | V–Pb | 0.8 | 0.1 |
| 9 | W–Nb | 1.3 | 2.4 | 27 | V–Pb | 0.4 | 0.1 |
| 10 | W–Cd | 0.7 | 1.3 | 28 | V–Cd | 0.6 | 0.3 |
| 11 | Mo–Cd | 1.5 | 2.2 | 29 | Ti–Al | 0.7 | 0.1 |
| 12 | Mo–Cd | 3.5 | – | 30 | Cu–Ag | 1.0 | 1.0 |
| 13 | Nb–Sn | 1.0 | 0.4 | 31 | Pb–C | 1.2 | 0.1 |
| 14 | Nb–Be | 1.0 | 0.2 | 32 | Pb–Sb | 4.9 | 1.0 |
| 15 | Nb–Al | 1.0 | 0.4 | 33 | Pb–Bi | 4.9 | 1.0 |
| 16 | Nb–Cu | 1.0 | 1.5 | 34 | Te–Cd | 0.7 | 0.8 |
| 17 | Nb–Ti | 0.8 | 0.8 | ||||
| 18 | Nb–Cd | 2.1 | 1.9 |
Table 2.
Surface tension of metals at the crystal–liquid interface.
| Metal | Melting point, K | , kJ/mol | , kJ/kg | Density, kg/m3 | , N/m |
|---|---|---|---|---|---|
| Bi | 490 | 11.00 | 52.637 | 9780 | 0.04 |
| Sn | 505 | 7.20 | 60.652 | 5850 | 0.03 |
| Cd | 594 | 6.20 | 55.155 | 8650 | 0.06 |
| Pb | 600 | 4.77 | 23.021 | 11336 | 0.03 |
| Te | 723 | 17.50 | 137.147 | 6240 | 0.14 |
| Sb | 904 | 20.10 | 165.079 | 6691 | 0.22 |
| Al | 933 | 10.80 | 400.297 | 2689 | 0.22 |
| Ag | 1233 | 11.30 | 104.756 | 10500 | 0.26 |
| Cu | 1356 | 13.00 | 204.563 | 8960 | 0.45 |
| Be | 1560 | 13.00 | 1442.841 | 1848 | 0.68 |
| Ti | 1881 | 15.10 | 315.438 | 4505 | 0.37 |
| V | 2190 | 17.60 | 345.505 | 5960 | 0.55 |
| Hf | 2503 | 23.90 | 133.901 | 13310 | 0.48 |
| Nb | 2742 | 28.00 | 301.367 | 8570 | 0.70 |
| Mo | 2893 | 36.00 | 375.235 | 10220 | 1.04 |
| Ta | 3269 | 35.00 | 193.424 | 16654 | 0.87 |
| W | 3693 | 35.10 | 190.927 | 19350 | 0.99 |
Table 3.
Size dependences of interfacial surface tension at the crystal–liquid interface for nanoparticles in the range nm.
Table 3.
Size dependences of interfacial surface tension at the crystal–liquid interface for nanoparticles in the range nm.
| Metal | A, N/(m·nm) | B, N/m | Metal | A, N/(m·nm) | B, N/m |
|---|---|---|---|---|---|
| Bi | 0.0746 | Be | 0.4025 | ||
| Sn | 0.0792 | Ti | 0.5007 | ||
| Cd | 0.1065 | V | 0.5953 | ||
| Pb | 0.1083 | Hf | 0.6910 | ||
| Te | 0.1460 | Nb | 0.7640 | ||
| Sb | 0.2015 | Mo | 0.8102 | ||
| Al | 0.2104 | Ta | 0.9251 | ||
| Ag | 0.3023 | W | 1.0545 | ||
| Cu | 0.3400 | – | – | – |
Disclaimer/Publisher’s Note: The statements, opinions and data contained in all publications are solely those of the individual author(s) and contributor(s) and not of MDPI and/or the editor(s). MDPI and/or the editor(s) disclaim responsibility for any injury to people or property resulting from any ideas, methods, instructions or products referred to in the content. |
© 2026 by the authors. Licensee MDPI, Basel, Switzerland. This article is an open access article distributed under the terms and conditions of the Creative Commons Attribution (CC BY) license (http://creativecommons.org/licenses/by/4.0/).
Copyright: This open access article is published under a Creative Commons CC BY 4.0 license, which permit the free download, distribution, and reuse, provided that the author and preprint are cited in any reuse.