
Submitted:
10 September 2026
Posted:
11 September 2026
You are already at the latest version
Abstract
This paper evaluates the technical and economic feasibility of retrofitting the Tendaho Dam in Ethiopia for hydropower generation while preserving its primary function of irrigation water delivery. The study responds to the widespread underutilization of large irrigation dams that possess substantial untapped energy potential. An integrated analytical framework combining hydrological assessment, hydraulic modeling, and techno-economic evaluation is applied to three retrofit configurations: a Dedicated Waterway Strategy, a Bifurcation Strategy integrated with the existing irrigation tunnel, and a low-head Channel Utilization Strategy at the downstream regulator. Flow-duration analysis indicates that dependable Q30 discharge conditions can sustain installed capacities exceeding 16 MW for the principal retrofit options, yielding annual electricity generation above 111,000 MWh. Economic performance is evaluated using RETScreen and discounted cash-flow analysis, demonstrating levelized costs of energy between 0.013 and 0.017 USD/kWh, substantially below international benchmark values. Comparative assessment shows that the Bifurcation Strategy offers the most favorable balance between capital efficiency, operational flexibility, and hydraulic compatibility with irrigation requirements. The findings confirm that hydropower retrofitting at Tendaho Dam represents a technically and economically competitive pathway for expanding renewable electricity supply while safeguarding agricultural water allocation in regulated river basins.
Keywords:
hydropower retrofitting
; levelized costs
; RETScreen
; hydraulic modeling
; economic performance
1. Introduction
Hydropower remains the backbone of Ethiopia’s electricity system, contributing more than 90% of national electricity generation and forming the foundation of the country’s long-term energy security and industrialization strategy [1]. Despite this dominance, a significant share of Ethiopia’s hydraulic infrastructure was designed primarily for irrigation and flood control, with limited consideration for energy recovery. Consequently, large volumes of regulated water are released without harnessing the associated hydraulic head, resulting in persistent underutilization of capital-intensive public investments. The Tendaho Dam, located in the Awash River Basin, exemplifies this challenge. Although constructed to support large-scale irrigation development, the dam has not achieved its full economic potential, particularly with respect to energy production.
International experience demonstrates that retrofitting non-powered dams is among the most cost-effective pathways for expanding renewable electricity generation. By leveraging existing reservoirs, embankments, tunnels, and transmission corridors, retrofit projects significantly reduce capital costs, environmental impacts, and social displacement compared to green field hydropower development [2]. Global assessments indicate that a substantial proportion of future hydropower expansion can be achieved through upgrades to existing dams, often at levelized costs of energy considerably lower than those of newly constructed plants [3,4]. In this context, hydropower retrofitting represents not only an opportunity for clean energy expansion but also a corrective intervention that enhances the overall productivity of legacy water infrastructure.
The integration of hydropower into irrigation systems presents technical and operational challenges, particularly in basins characterized by competing water demands. In the Awash Basin, irrigation water supply for sugarcane estates and downstream communities constitutes a critical socio-economic priority. Any modification to dam operations must therefore ensure strict compliance with established irrigation release requirements. This constraint places hydropower development within the broader Water–Energy–Food nexus, where energy generation must remain subordinate to agricultural water security [5]. Advances in turbine technology, particularly low-head Kaplan turbines with double regulation, have improved the feasibility of such integration by enabling efficient operation across wide flow ranges without disrupting downstream releases [6].
Despite its relevance, the existing literature on Ethiopian dams has focused predominantly on dam safety, spillway hydraulics, and structural performance [7,8], with limited attention given to site-specific hydropower retrofit design and rigorous economic evaluation. Where hydropower potential has been assessed, studies often rely on generalized assumptions, inflated unit costs, or incomplete hydraulic modeling, limiting their usefulness for investment and policy decisions [9,10]. Comprehensive analyses that integrate dependable flow assessment, engineering layout optimization, and discounted cash-flow evaluation remain scarce.
This study addresses these gaps by conducting an integrated technical and economic assessment of hydropower retrofit options at the Tendaho Dam. By evaluating multiple engineering configurations under realistic hydraulic and financial assumptions, the research aims to identify retrofit strategies that maximize energy recovery while fully safeguarding irrigation requirements. The findings provide practical evidence for transforming underperforming irrigation dams into efficient multipurpose assets that support renewable energy expansion without compromising agricultural productivity.
2. Materials and Methods
The assessment adopts a structured three-phase analytical framework to capture the interdependencies between irrigation operations and hydropower generation. The first phase establishes the hydrological, structural, and operational baseline of the Tendaho Dam using historical inflow data, reservoir operation records, and original design documentation [11]. The second phase focuses on engineering feasibility; including head availability, turbine selection, hydraulic loss estimation, and layout optimization for alternative retrofit configurations. The third phase evaluates energy production and economic performance using standardized financial indicators.
Hydrological analysis is based on long-term inflow records and reservoir water level data obtained from the Ministry of Water and Energy and project consultants [11]. Flow-duration curves are constructed to determine dependable discharge levels, with particular emphasis on Q30 and Q95 flows to ensure compatibility with irrigation requirements. Net head is calculated by subtracting friction and minor losses from the available gross head. Power output is computed using the standard hydropower equation:
P = ρgQH η,
Where P is the power output, ρ is water density, g is gravitational acceleration, Q is discharge, H is net head, and η is overall efficiency. Energy generation and capacity factor are determined by integrating power output over the flow-duration curve while accounting for turbine efficiency, shaft-to-wire losses, and plant availability. Financial evaluation is conducted using RET Screen software, supported by discounted cash-flow analysis to compute Net Present Value (NPV), Internal Rate of Return (IRR), and Levelized Cost of Energy (LCOE) [12,13].
3. Results
This section may be divided by subheadings. It should provide a concise and precise description of the experimental results, their interpretation, as well as the experimental conclusions that can be drawn.
3.1. Site and Hydrological Characteristics
The Tendaho Dam is a zoned earth-fill embankment with a storage capacity of approximately 1.9 billion m³, serving more than 60,000 ha of irrigated land in the Afar Depression [11]. The dam regulates flows in a highly variable hydrological regime characterized by strong seasonal and inter annual variability. Flow-duration analysis confirms the availability of dependable discharge suitable for power generation without compromising irrigation releases. Long-term operation is influenced by sedimentation, estimated at 20–30 million m³ per year, which is incorporated into assumptions regarding sustainable power generation potential [11].
3.2. Engineering Retrofit Options
Three retrofit configurations are developed to utilize the available head and flow at the dam.
3.2.1. Option I: Dedicated Waterway Strategy (Maximum Isolation)
The first option pursues a fully independent hydraulic route reserved exclusively for power production, thereby removing any possibility of conflict with ongoing irrigation tunnel operation. The design philosophy centres on isolating the hydropower system and providing it with its own reservoir head-utilization path. Achieving this configuration requires a major civil intervention: a new tunnel approximately 247m long and 6m in diameter must be excavated through the abutment so that the powerhouse can be positioned at the base of the mountainside, physically detached from existing irrigation tunnel Electromechanical features include a specific valve installed at the outlet of the current irrigation tunnel (see Figure 1).
Water is then conveyed through the new penstock to two Kaplan turbine-generator units. This solution reduces hydraulic complications where the systems connect, but it does so at the expense of extensive underground construction.
3.2.2. Option II: Bifurcation Strategy (Integrated Flow Management)
The second option takes an integrative approach by linking the hydropower intake directly downstream of the existing irrigation release point. Here, the emphasis is on coordinating flows and enabling sequential use, while ensuring that the irrigation demand remains fully protected. Implementing this strategy requires the removal and excavation of about 60 meters of the existing concrete tunnel to establish a bifurcation zone where the original conduit divides into two steel penstocks (refer Figure 2). Although some excavation into the abutment is still necessary, it is limited mainly to accommodating the powerhouse and the shorter penstock. The principal hydraulic task is managing two adjacent dedicated to irrigation and the other to hydropower. An isolation valve located at the powerhouse allows hydropower maintenance activities without affecting irrigation releases, and a three-meter butterfly valve regulates irrigation flow after a diameter reduction. Compared with the first option, this arrangement depends on a much shorter penstock of roughly 47 m to supply the two Kaplan turbine-generator units.
3.2.3. Option III: Channel Utilization Strategy (Low-Head Adaptation)
The third option adopts a more flexible, low-head configuration by making direct use of the flow already available in the open channel, rather than relying on the higher-pressure head from reservoir and long penstock required in the previous alternatives. This design places a premium on simplicity, modular construction, and the ability to deploy equipment relatively quickly. Its civil works are concentrated almost entirely on refurbishing the existing channel, including the formation of an integrated intake arrangement within the channel itself, which guides water efficiently toward the turbine modules (refer Figure 3). Because the design does not depend on tunnels or major structural changes near the dam, the civil footprint is considerably reduced. On the electromechanical side, the scheme employs one S type Kaplan turbine units, selected because their hydraulic characteristics match the behaviour of open-channel flow. The control room will undergo full refurbishment and automation so that intake regulation and generation processes for the modular units can be managed with improved precision and reduced operator workload.
3.3. Modeling and Technical Design
3.3.1. Turbine Selection
Selecting the optimal turbine for this project aims to create an economically balanced design that maximizes power extraction while minimizing initial investment. This balance necessitates a multi-layered evaluation of hydraulic performance, economic suitability, and operational durability. A critical factor, given the project’s dependence on irrigation releases, is the turbine’s ability to remain efficient under highly variable flow. The turbine must sustain stable performance across a broad range to ensure electricity generation never compromises downstream water delivery requirements.
Within this context, the Kaplan turbine is uniquely appropriate. Its primary advantage is its double-regulation system, where guide vanes and runner blades adjust simultaneously. This mechanical flexibility ensures optimal hydraulic angles are maintained as flows fluctuate. Remarkably, the Kaplan turbine maintains a flat and stable efficiency profile from 30% to 100% of the design flow illustrated in Figure 4, enabling it to deliver consistently high output even during dramatic seasonal changes in water availability
While the final selection involves iterative refinement, the decisive first step is calculating the Specific Speed (Ns). This non-dimensional parameter links head and power to rotational speed, serving as the most reliable indicator for identifying the turbine family best suited to the site’s hydraulic regime.
3.3.2. Unit Determination and Configuration
A deliberate strategy of installing two identical units (Z=2) was adopted for Option I & II. This configuration enhances operational flexibility; when inflow or demand decreases; one unit can be deactivated, allowing the second to operate near peak efficiency. Furthermore, identical units streamline maintenance and reduce spare-part inventory. The decision is also constrained by the powerhouse's physical footprint and the diminishing economic returns of adding a third unit. Due to a consistent, 100% dependable environmental flow, a single-unit configuration is sufficient and cost-effective for Option III.
3.3.3. Power Computation
Based on a preliminary Kaplan efficiency of 90% and the specific hydraulic parameters for each option, the calculated outputs of Total Power for Option I, II and III are 18.5 MW (approx. 9.25 MW per unit), 17.7 MW (approx. 8.86 MW per unit) and 220 kW (single unit) respectively.
3.3.4. Determining the Initial Trend Specific Speed
The process begins by using established empirical trend curves derived from operational data of successful existing turbines. The study utilizes the trend specific speed curves published by Siervo and de Leva (1978) [5] to estimate an initial value based on the design net head (Hnet):
Ns (Trend) =2419/H0.489
For Option I (Hnet = 28.72m), this resulted in a trend specific speed of 468.4.
For Option II (Hnet = 27.53 m), the trend value was 478.
3.3.5. Recalculating Actual Specific Speed
First with this the trend N trend, the turbine's theoretical best rotational speed (N) based on the design power (P) has been calculated .Then the calculated speed is rounded to the nearest synchronous speed that matches the 50 Hz grid frequency. For the Tendaho project, a speed of 300 rpm was selected for Options I and II, as it corresponds to a 20-pole generator (a multiple of four for optimal balance).
Final synchronous speed (Nfinal) is chosen, the actual operating specific speed is recalculated to verify it falls within the standard range for the selected turbine type:
The final result shows:
For Option I: N = 300 rpm, Ns = 434 rpm,
For Option II: N = 300 rpm, Ns = 447.4 rpm,
For option III: N = 500 rpm, Ns = 993 rpm,
In conclusion, the calculated specific speeds for all three scenarios fall decisively within the Kaplan turbine range, validating the preliminary selection. While the turbine type remains consistent to provide necessary hydraulic flexibility, the configurations are strategically differentiated to align with site-specific constraints
Vertical Kaplan of two-unit configuration is designated for Option I and II. A vertical orientation is adopted to address significant spatial limitations and maximize the use of available space during the retrofit of existing systems. This ensures a compact powerhouse footprint that integrates seamlessly with existing infrastructure and topography.
Horizontal S-Type Kaplan configuration is selected as the superior technical solution for Option III site. Utilizing a single-unit horizontal S-type arrangement offers higher hydraulic efficiency and drastically reduces civil costs by eliminating the need for penstocks. Since the power output is lower and one unit, the equipment is naturally smaller, meaning there is no space requirement for this installation. Furthermore, given the 100% dependable flow, a single-unit configuration is the most streamlined and cost-effective choice for small-drop structures at crosses regulators.
3.3.6. Energy Generation and Determination of Capacity Factor
The energy generation and corresponding power factor for the proposed design were initially determined via a manual calculation method utilizing Microsoft Excel, incorporating specific operational assumptions optimized for the selected Kaplan turbines.
The core assumption to do manual calculation of capacity factor is based on the superior constant efficiency characteristics of the Kaplan turbine across variable flow regimes and further since Option I and II are connected the effect of load factor is neglected on the calculation of capacity factor:
Flow Constraint and Operational Efficiency:
The Kaplan turbine is assumed to operate at its peak design efficiency (approximated here at 90%) across a wide flow range from 30% to 100% of the design flow (Qd) as shown on the Figure 4 onsequently, for sake of simplicity only flow analysis to the operational range where the Kaplan turbine's efficiency remains at an optimum 90% is considered..
Flow Management Strategy: To sustain this high efficiency, the system is engineered to actively manage flow extremes With the following assumption :
- High Flow Management: Any flow exceeding 100% of the design flow is tripped or bypassed.
- Low Flow Management: Any flow dropping below the 30% threshold is managed by shutting down one of the two installed units
Shaft-to-Wire Efficiency Recommendations after Turbine
Since the turbine powers have been already calculated, next is to define the “Shaft-to-Wire” efficiency to find the power at the grid connection. Based on industry standards (such as IEC 60041 and ASME PTC 18), here are the reference values the study considered:
Generator (hgen) 95.0% – 98.5%, let us take 97.0% (Standard for synchronous units)
Step-up Transformer (ht) 98.0% – 99.5%, let us take 99.0%
Station Service/Auxiliary (hs) 0.5% – 1.0%, let take loss 0.99 (Multiplier)
Therefore
Combined efficiency (Shaft-to-Wire) = 0.97*0.99*0.99 = 0.95 or
Total combined efficiency =hturbine* h(shat-to-wire) = 0.9*0.95 = 0.855
The availability is 95% according IFC (World Bank Group) [5] data then the energy can be calculated with product on power calculation combined efficiency and the availabity with time.
Annual Energy: The total annual energy production and capacity factor was calculated for Option I and II by integrating the computed power output over the entire period defined from design flow generated from Duration Curve as shown in the following formula.
The Capacity Factor (Cf) is then formally calculated using the Annual Energy output and the maximum Installed Capacity (Pins)
Following the above steps the actual energy produced are 113,344,188KWh and 122,267,161KWh for option I and option II respectively
Therefore for Option I
The Capacity Factor (Cf) is then formally calculated using the Annual Energy output and the maximum Installed Capacity (Pins)
Cf =113,344,118 / (17,579*8760) = 0.736,
Likewise for option II
Cf =111,267,161 / (16840.8*8760) = 0.754
For Option III
Given that Option III benefits from 100% flow dependability, the capacity factor is projected to align directly with the plant’s availability (95%). The final installed capacity will be formally determined after accounting for all cumulative mechanical and electrical efficiency losses which has installed capacity after 209.7kw after all efficiency considered. The energy is 1,739,298KWh.
3.3.7. Engineering Dimensioning and Civil Quantification
The technical sizing of the powerhouse and turbine components for option I and II is conducted through a proportionality-based methodology, where the outer runner diameter (DM) serves as the primary benchmark for all subsequent spatial and civil requirements. Following the methodology established by Siervo and De Leva (1978), [22] the runner diameter is derived from the peripheral velocity coefficient (Ku), which ensures the turbine's physical dimensions are optimized for the site’s specific hydraulic head and flow. For Option I, with a net head of 28.72m and a specific speed of 434, the calculated DM is 2.27m. Similarly, for Option II, with a head of 27.53m and a specific speed of 447.9, the diameter is 2.23m. These foundational dimensions allow for the precise determination of the spiral casing and draft tube geometries, revealing that the physical differences between the two primary options are minimal and allow for standardized equipment selection. The sizing of the powerhouse structure itself is determined by applying J.J. Donald’s formula for unit spacing, which suggests a center-to-center distance of approximately 4.75 x DM. Based on these calculations, the powerhouse for both Option I and Option II is designed with a total length of 40m, a width of 25m, and a height of 13m. This footprint accommodates two generating unit bays, an erection bay for maintenance, and a dedicated control bay. The height is specifically dictated by the vertical clearance required for a crane to lift the generator rotor safely above the floor level. By establishing these dimensions, the study provides a concrete basis for the subsequent quantification of civil materials and structural costs. Civil work quantities were estimated using empirical formulas [21], which link material volumes to plant flow (Q = 73 m³/s) and effective head. For the combined powerhouse and tailrace structures in Options I and II, the total concrete volume is estimated at approximately 8,465m³, with reinforcement requirements totaling 359tons. Beyond the structure itself, significant site preparation is required at the dam toe. Option I requires 13,000m³ of mountain abutment excavation to create the necessary footprint, while Option II requires a larger volume of 25,200m³ due to the wider area needed for the hydraulic bifurcation layout. These quantifications demonstrate that while Option II utilizes more existing tunnel infrastructure, it requires more extensive surface excavation to accommodate the bifurcated penstock system
3.4. Financial and Economic Results
3.4.1. Investment Cost Derivation
The preliminary capital expenditure (CAPEX) for the Tendaho retrofit was derived using standardized unit rates from the Norwegian Water Resources and Energy Directorate (NVE) and Net Present Value (NPV) reference benchmarks. Civil works were valued based on volumetric excavation and concrete placement rates, with a 20% contingency for ancillary fixtures.
Civil and Tunnel Works Assessment option I and II
- Powerhouse (PH): Option II requires higher abutment excavation (25,200m³) compared to Option I (13,000 m³), resulting in a PH cost of USD 1.32M vs USD 1.21M.
- Tunneling: Option I incurs a massive USD 3.75M expense for a new tunnel, modeled on historical Tendaho construction data (2005). Option II eliminates this cost by repurposing existing infrastructure.
- Tailrace: Costs are identical for both options at USD 232,903.
- Electromechanical (EM) and Hydro mechanical (HM) Costs for option I and II
- The EM base cost (Y) was calculated using the NVE power-law formula for two units:
Y = 1.4722X0.6195,
Where X is the installed capacity (9.25 MW). Including a 30% tolerance for infrastructure and telecom, the total EM cost is USD 7.57M.
HM costs include a 3m butterfly valve (USD 462,000) and draft tube gates calculated via the NPV correlation:
YHM = 10,500.2 A0.7035,
Where A is the total gate area (36.4 m2).
Option III: Micro-Hydro Benchmarking
Option III (220 kW) cost determination follows model for micro-scale hydropower [19]. The total cost (TC) per kW is formulated as:
TC = 1.13X (CPH + CEM) = 3,002 USD/Kw,
This higher unit cost reflects the loss of economies of scale inherent in micro-turbine installations.
3.4.2. Consolidated Cost Comparison
The cost of power production for the three option s are presented with Table 6
3.4.3. Feasibility and Emission Analysis (RETScreen Output)
Using a 70:30 debt-to-equity ratio and a 0.06 USD/kWh tariff [14 and 15], all options proved financially robust.

Table 7.
Comparisons of Option I, II & III.
| Criterion | Indicator | Option I | Option II | Option III |
| Technical Performance | Installed capacity (kW) | 17,579 | 16,840 | 209 |
| Annual Generation (MWh) | 113,338 | 111,229 | 1,739 | |
| Capital/Investment | Total initial cost (USD) | 17,491,105 | 12,630,000 | 627,418 |
| Revenue | Annual Revenue (USD/year) | 6,800,288 | 6,673,732 | 104,358 |
| Financial Feasibility | NPV (USD) | 68,677,947 | 72,785,345 | 629,927 |
| Pre-tax IRR – Assets (%) | 32.5 | 46.5 | 11.2 | |
| Benefit–Cost ratio | 14.1 | 20.2 | 4.3 | |
| Debt service coverage ratio | 4.9 | 6.7 | 1.9 | |
| Energy Cost Competitiveness | LCOE (USD/kWh) | 0.017 | 0.013 | 0.04 |
| Environmental Performance | Annual GHG Reduction (tCO₂) | 34 | 33.4 | 0.5 |
Note: the three option are evaluated against an export tariff of 0.06 USD/kWh.
4. Discussion
The study assessed the technical and economic feasibility of retrofitting the Tendaho Dam to enhance hydropower generation while maintaining its primary irrigation function. Findings indicate that retrofitting is technically viable, with Options I and II achieving installed capacities above 16 MW and annual generation exceeding 111,000 MWh, without compromising existing discharge requirements. These results align with global evidence showing that non-powered dams can integrate hydropower facilities while preserving water distribution functions [18] Advanced hydraulic modeling further supports the safe integration of power generation into existing infrastructure [7]
Economic analysis demonstrates that engineering choices significantly influence project performance. Option II attains the highest Net Present Value (NPV), followed by Option I, while Option III delivers marginal returns, reflecting scale and capital efficiency rather than tariff conditions. These outcomes correspond with literature showing that retrofitting existing hydropower infrastructure maximizes NPV by leveraging sunken investments and avoiding new construction costs [14 and 15].
All options achieve Levelized Cost of Energy (LCOE) within IRENA’s benchmark of 0.01–0.05 USD/kWh; with Options I and II performing best (0.017 and 0.013 USD/kWh, respectively). A discounted cash flow framework incorporating NPV, IRR, and LCOE effectively captures economic benefits, demonstrating competitiveness relative to high national generation costs [2, 5, and 15].
Overall, Options I and II consistently outperform Option III across technical, economic, and cost-competitiveness criteria, confirming that well-optimized retrofits can enhance energy production while preserving irrigation functions, supporting the broader feasibility of upgrading non-powered dams for renewable energy generation.
5. Conclusions
The study confirms that hydropower retrofitting at the Tendaho Dam is both technically feasible and economically attractive. Among the evaluated configurations, the Bifurcation Strategy emerges as the optimal solution, offering superior financial performance while fully preserving irrigation operations. The results demonstrate that retrofitting existing irrigation dams can provide low-cost renewable energy and enhance the overall productivity of water infrastructure. The analytical framework and findings offer a scalable reference for similar multipurpose dam retrofits in Ethiopia and other water-stressed regions.
Option II is the definitive superior choice, providing the highest NPV and lowest LCOE by leveraging existing civil structures, while achieving a 93% reduction in greenhouse gas emissions compared to the baseline
Author Contributions
“Conceptualization, T.N. and A.S.; methodology, A.S.; software, A.S.; validation, A.S. and T.N.; formal analysis, A.S.; investigation, A.S.; resources, T.N.; data curation, A.S.; writing—original draft preparation, A.S.; writing—review and editing, A.S. and T.N.; visualization, A.S.; supervision, T.N.; project administration, T.N.;
Funding
This research received no external funding.
Data Availability Statement
The data used in this study can be found in (https://etd.aau.edu.et/ master thesis by Abiy Selish, supervisor: Tilahun Nigussie)
Conflicts of Interest
The authors declare no conflicts of interest.
Abbreviations
The following abbreviations are used in this manuscript:
| LCOE MDPI |
Levelized Cost of Energy Multidisciplinary Digital Publishing Institute |
| DOAJ | Directory of open access journals |
| TLA | Three letter acronym |
| LD | Linear dichroism |
References
- Tiruye, G.A.; Besha, A.T.; Mekonnen, Y.S.; Benti, N.E.; Gebreslase, G.A.; Tufa, R.A. ‘Opportunities and challenges of renewable energy production in Ethiopia’. Sustainability 2021, 13(18), 10381. [Google Scholar] [CrossRef]
- International Renewable Energy Agency (IRENA). Renewable energy technologies: Cost analysis series – Hydropower; Available at; IRENA: Abu Dhabi, 2012. [Google Scholar]
- https://www.irena.org/-/media/Files/IRENA/Agency/Publication/2012/RE_Technologies_Cost_Analysis- HYDROPOWER.pdf (Accessed: 22 December 2025).
- International Renewable Energy Agency (IRENA). Renewable power generation costs in 2020; IRENA: Abu Dhabi, 2021; Available online: https://www.irena.org/publications (accessed on November 2025).
- International Renewable Energy Agency (IRENA). Renewable power generation costs in 2022; IRENA: Abu Dhabi, 2023a; Available online: https://www.irena.org/Publications/2023/Jun/Renewable-power-generation-costs-in-2022 (accessed on 14 October 2025).
- World Bank. Guidance on hydropower economic analysis; World Bank Group: Washington, DC, 2019; Available online: https://documents.worldbank.org/en/publication/documents-reports/documentdetail/ (accessed on 22 December 2025).
- Carvalho, R.F.; Junior, A.A.; Borges, P.H. ‘Low head hydropower technologies and applications’. Renew. Energy Accessed. 2021, 173, 1251–1262. (accessed on November 2025). [Google Scholar] [CrossRef]
- Demeke, G.K.; Asfaw, D.H.; Shiferaw, Y.S. ‘3D hydrodynamic modelling enhances the design of Tendaho dam spillway, Ethiopia’. Water Accessed. 2019, 11(1), 82. (accessed on November 2025). [Google Scholar] [CrossRef]
- Tadesse, T. Dam break analysis and risk assessment: A case study of Tendaho dam. MSc thesis, Addis Ababa Institute of Technology, 2015. Available online: http://etd.aau.edu.et/handle/12345678/9942 (accessed on November 2025).
- Ayalew, A.T. ‘Assessment of power compeers prospective of Gobecho Micro Hydropower Plant on Ganga River, Genale Dawa River Basin, Ethiopia’. Am. J. Electr. Power Energy Syst. 2021, 10(2), 25–31. [Google Scholar] [CrossRef]
- Bezabih, A.W. ‘Evaluation of small hydropower plant at Ribb irrigation dam in Amhara regional state, Ethiopia’. Environ. Syst. Res. 2021, 10(1), 1. [Google Scholar] [CrossRef]
- Water Works Design and Supervision Enterprise (WWDSE) and Water and Power Consultancy Service (WAPCOS). Tendaho dam and irrigation project: Hydrology and design documents. Final design reports; Ministry of Water Resources: Addis Ababa, 2005. [Google Scholar]
- Nganga, J.; Wohlert, M.; Woods, M.; Becker-Birck, C.; Jackson, S.; Rickerson, W. Powering Africa through Feed-In Tariffs: Advancing renewable energy to meet the continent’s electricity needs; Renewable Energy Ventures (K) Ltd for World Future Council, Heinrich Böll Stiftung and Friends of the Earth England, Wales & Northern Ireland: Nairobi, 2013. [Google Scholar]
- Girma, Z. ‘Techno-economic feasibility of small scale hydropower in Ethiopia: The case of the Kulfo River, in southern Ethiopia’. Renewable Energy. Available at. 2016; Article ID 8037892. [Google Scholar] [CrossRef]
- Rahi, O.P.; Chandel, A.K. ‘Refurbishment and uprating of hydro power plants – A literature review’. Renew. Sustain. Energy Rev. 2015, 48, 726–737. [Google Scholar] [CrossRef]
- Kougias, I.; et al. ‘Analysis of emerging technologies in the hydropower sector’. Renew. Sustain. Energy Rev. 2019, 113, 1–15. [Google Scholar] [CrossRef]
- Kuriqi, A.; Pinheiro, A.; Sordo, A.; et al. ‘Ecological impacts of run-of-river hydropower plants – current status and future prospects’. Renew. Sustain. Energy Rev. 2021, 142, 110873. [Google Scholar] [CrossRef]
- Kishe, C.R. Am. J. Water Sci. Eng. 2023, 9(3), 58–68.
- Shrestha, K. Investigating the technical concept of retrofitting of non-hydro reservoir and dam. Master’s thesis, Norwegian University of Science and Technology (NTNU), 2022. Available online: https://ntnuopen.ntnu.no/ntnu-xmlui/handle/11250/3027393.
- Hatata, A.Y.; El-Saadawi, M.M.; Saad, S. ‘A feasibility study of small hydro power for selected locations in Egypt’. Energy Strategy Rev. Available at. 2019, 24, 300–313. [Google Scholar] [CrossRef]
- Zarfl, C.; Lumsdon, A.E.; Berlekamp, J.; Tydecks, L.; Tockner, K. ‘A global boom in hydropower dam construction’. Aquat. Sci. 2015, 77(1), 161–170. [Google Scholar] [CrossRef]
- Japan International Cooperation Agency (JICA). Guideline and Manual for Hydropower Development; Japan International Cooperation Agency: Tokyo, 2011. [Google Scholar]
- de Siervo, F.; de Leva, F. ‘Modern trends in selecting and designing Kaplan turbines’. Int. Water Power Dam Constr. 1978, 30(1), 52–58. [Google Scholar]
Figure 1.
Dedicated waterway.
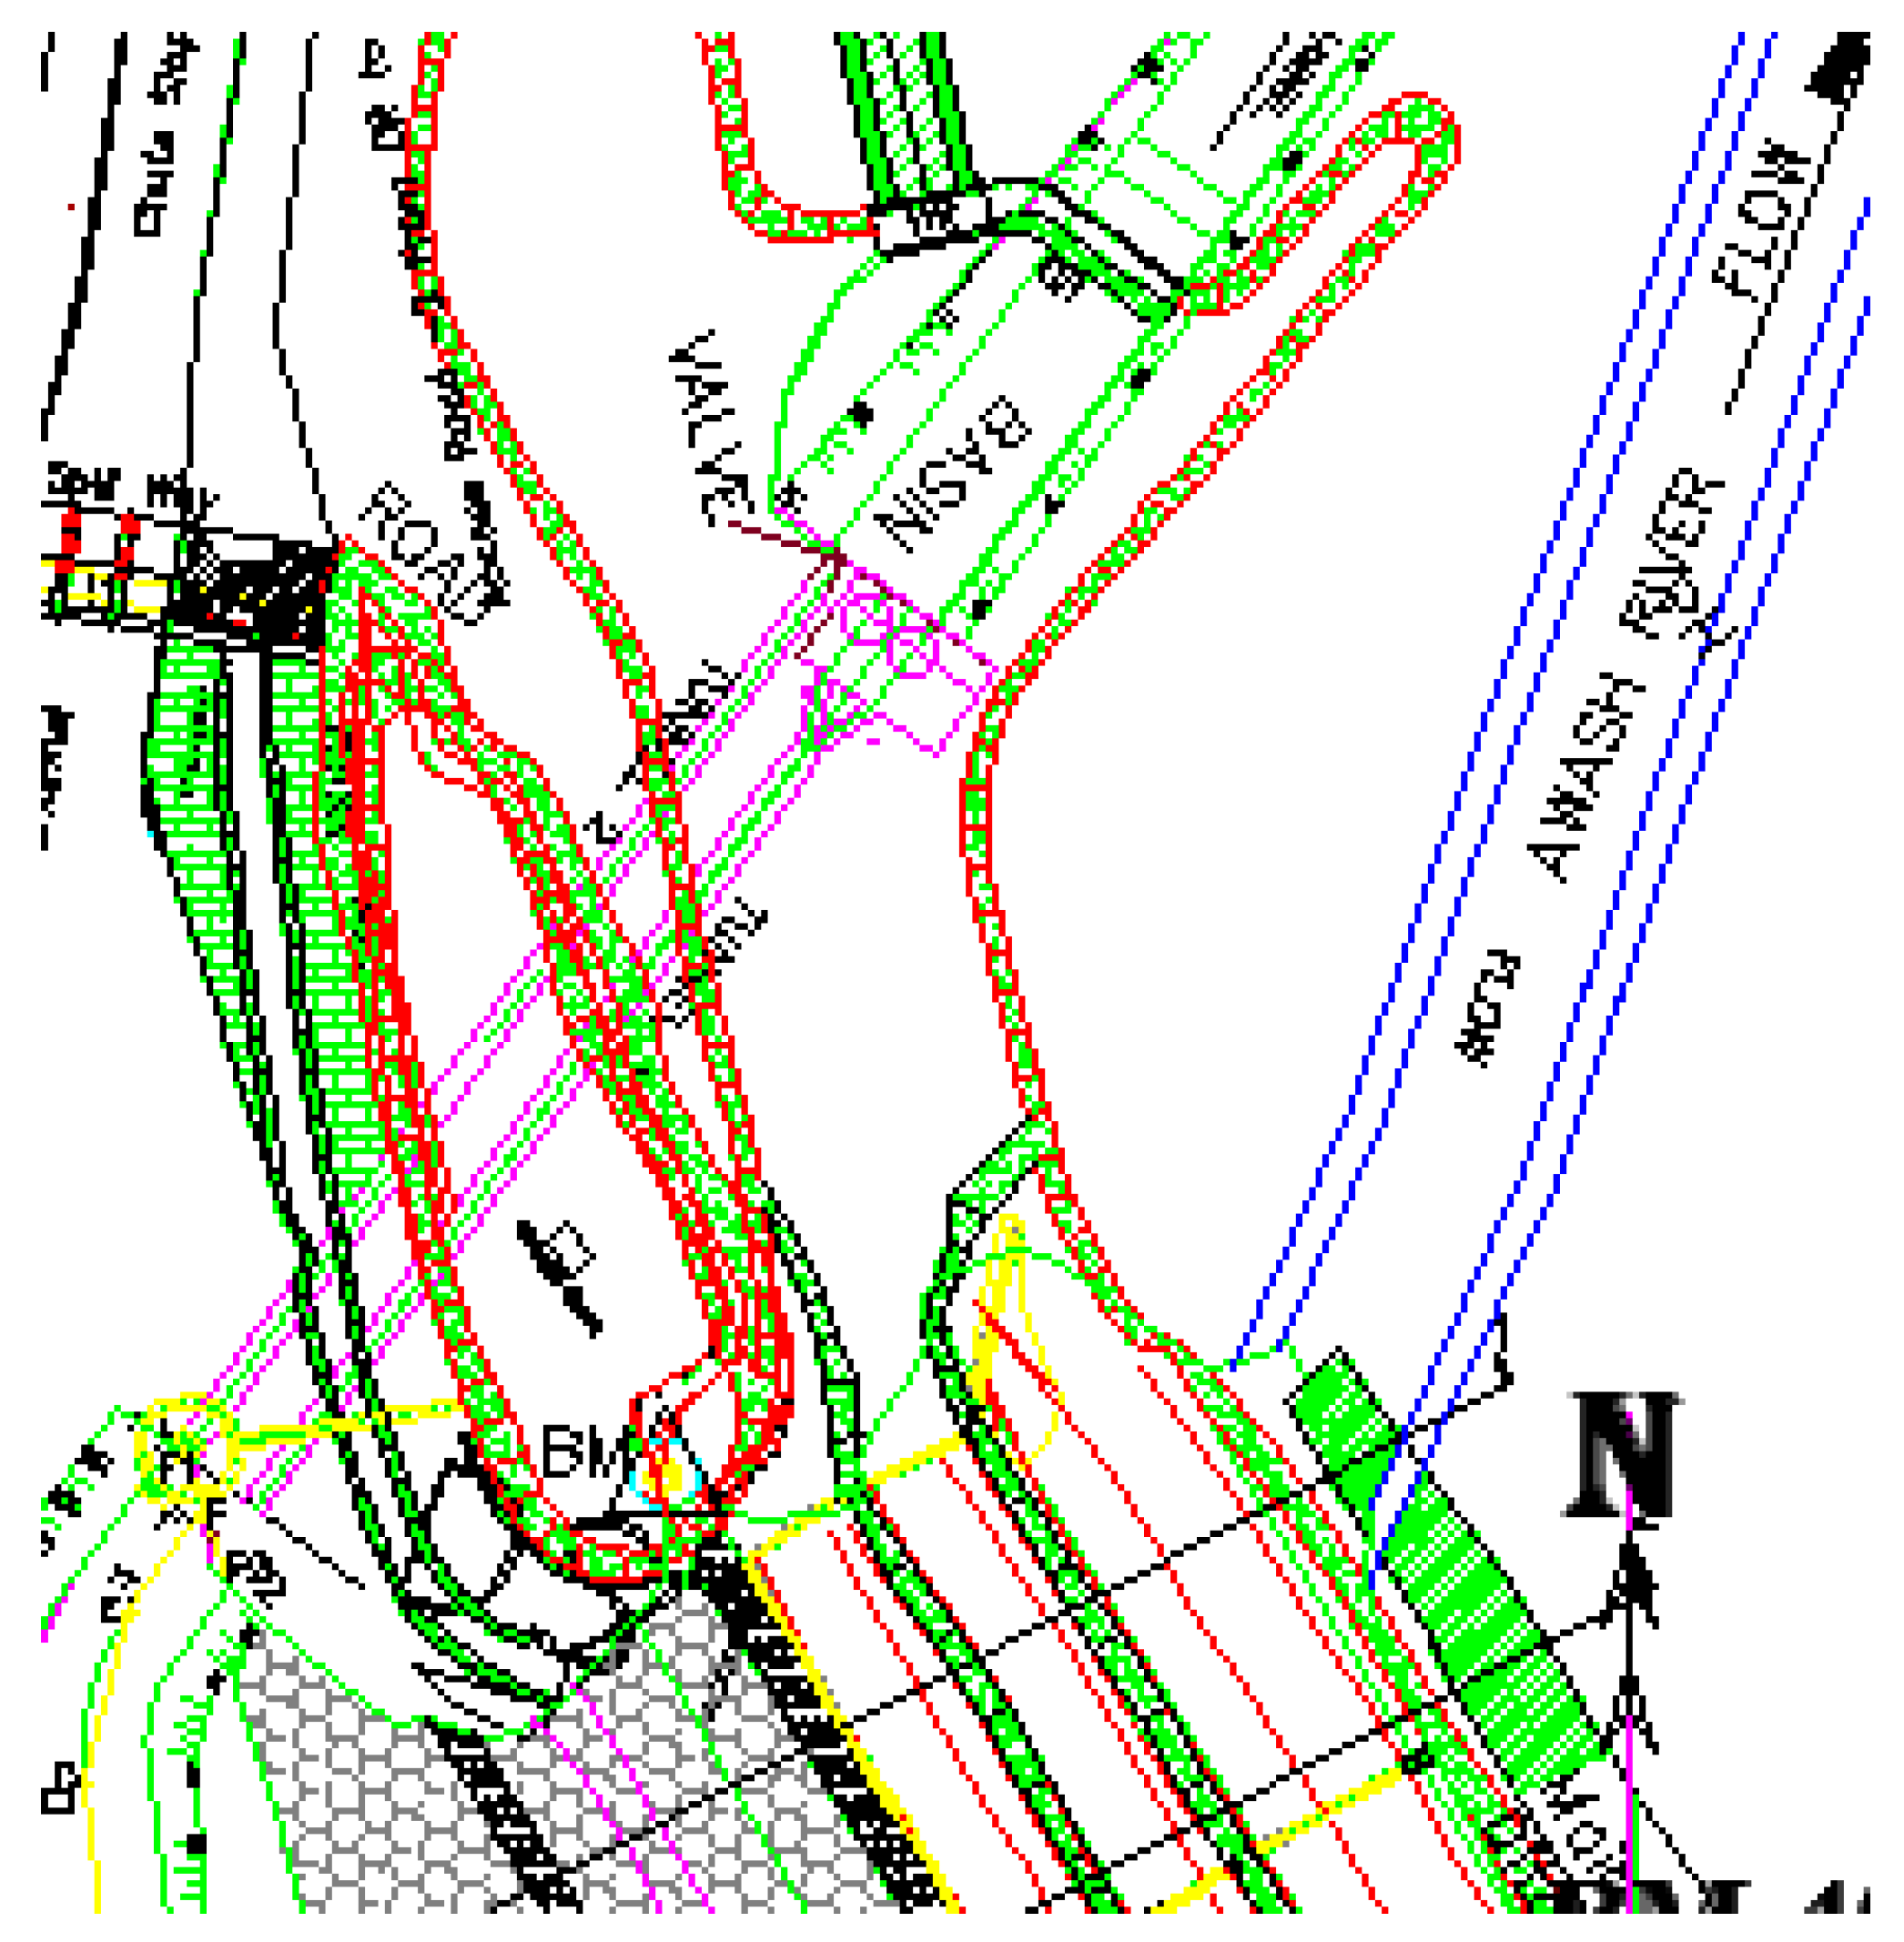
Figure 2.
Bifurcation strategy.
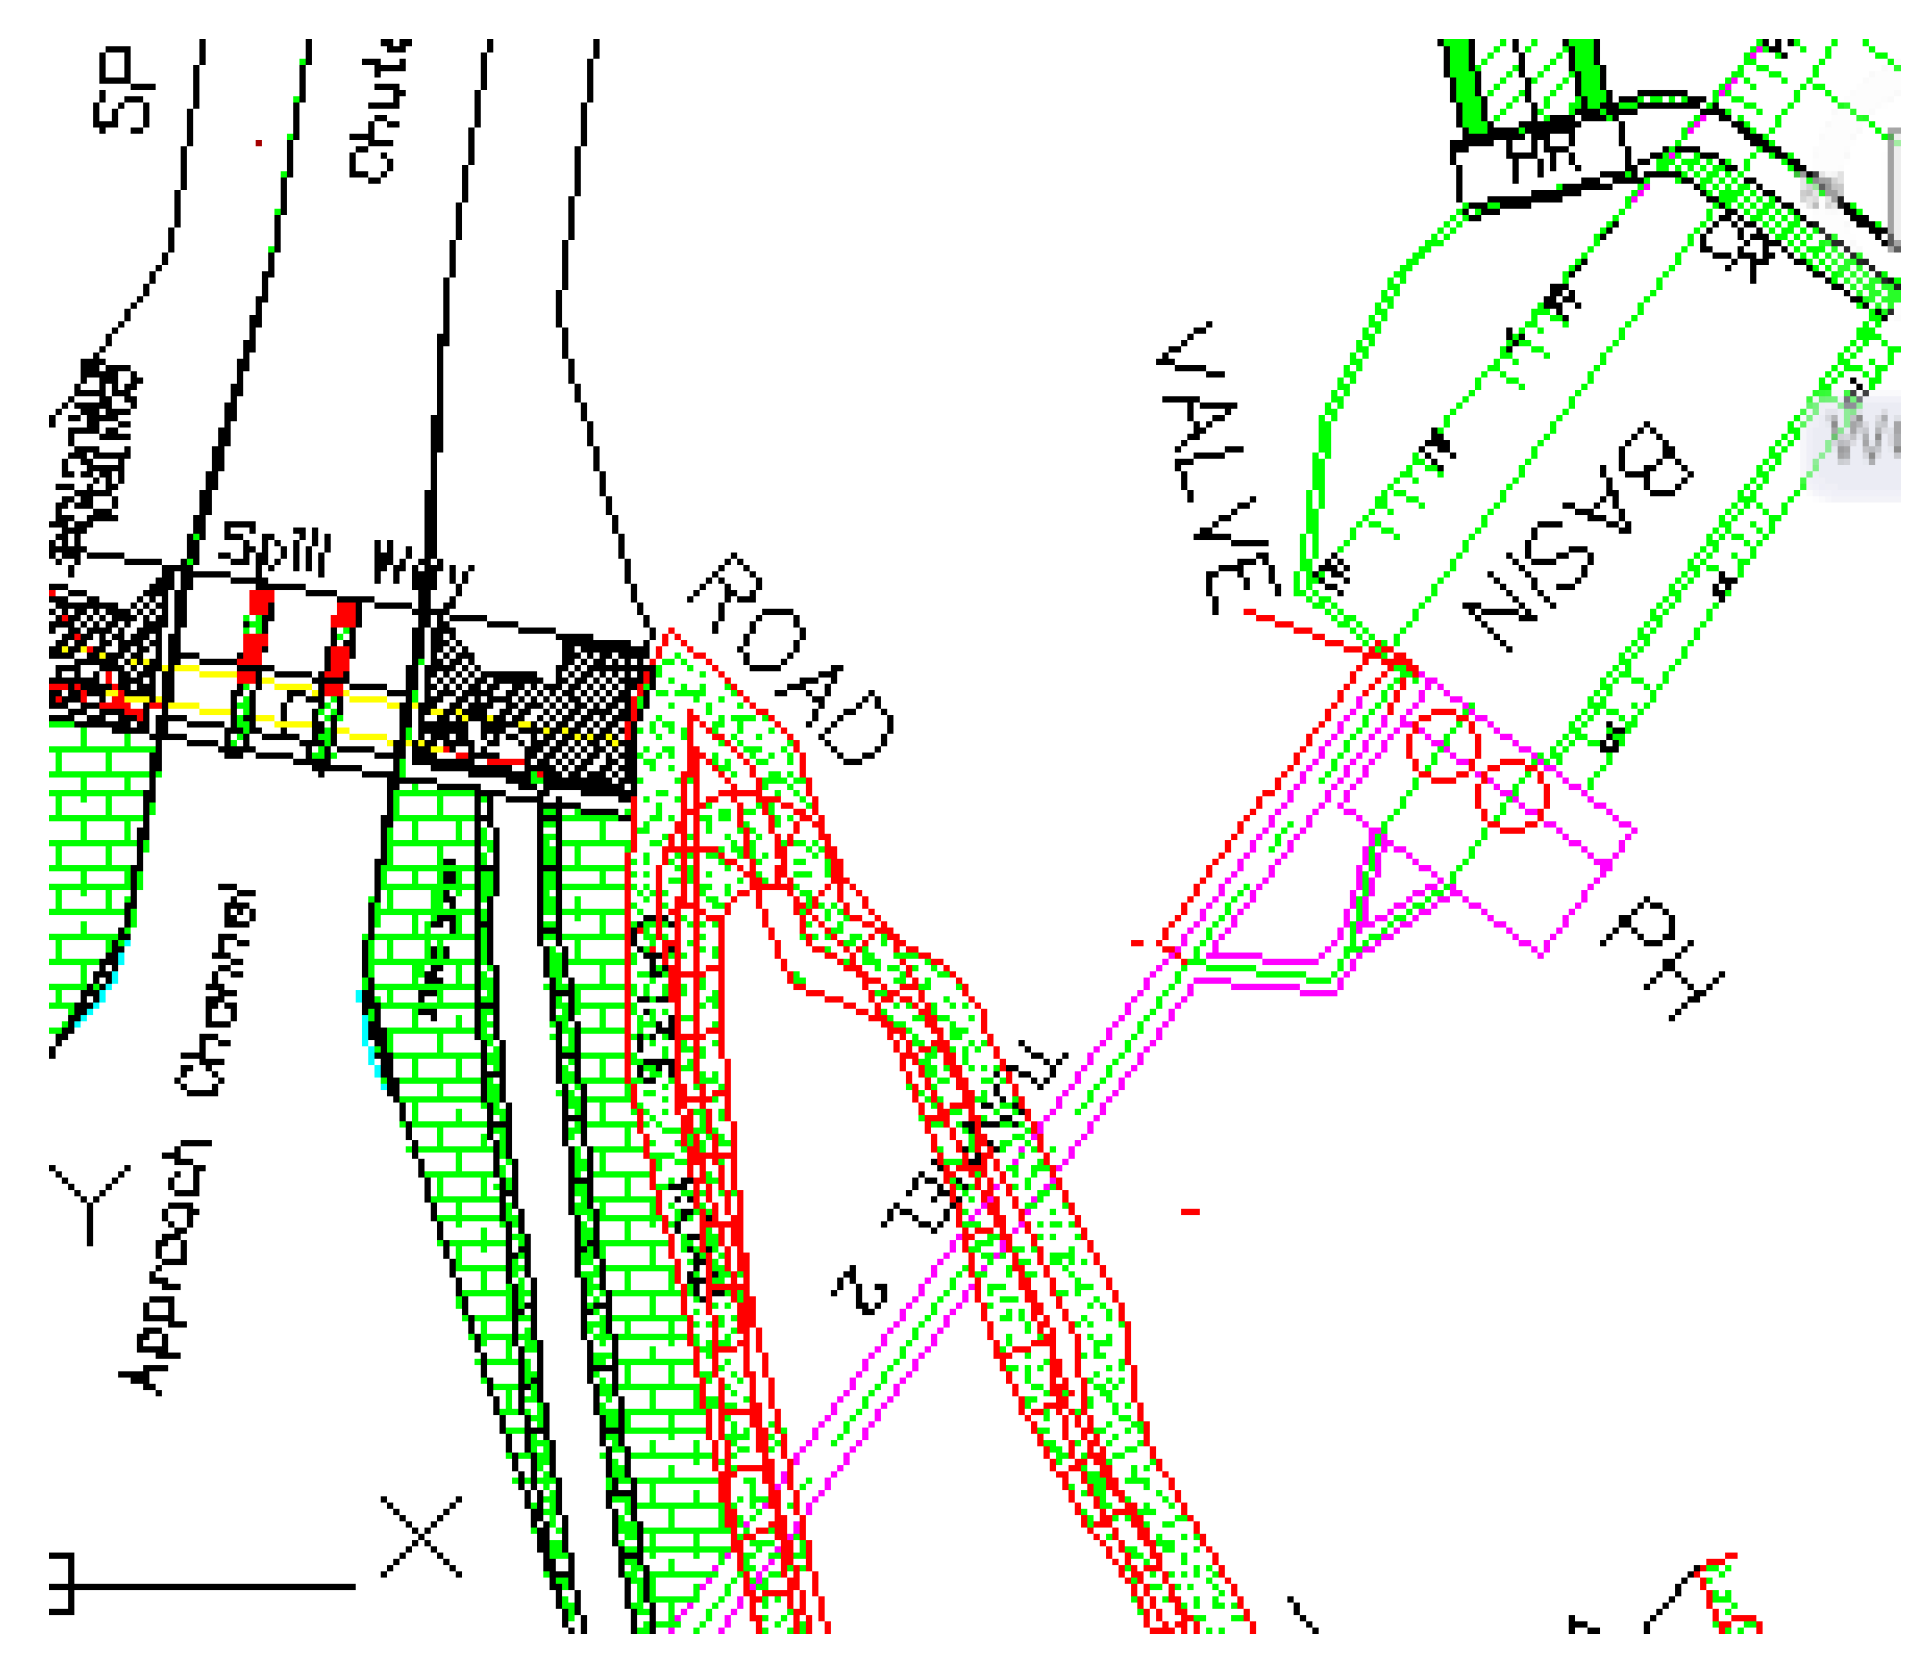
Figure 3.
Tunnel utilization.
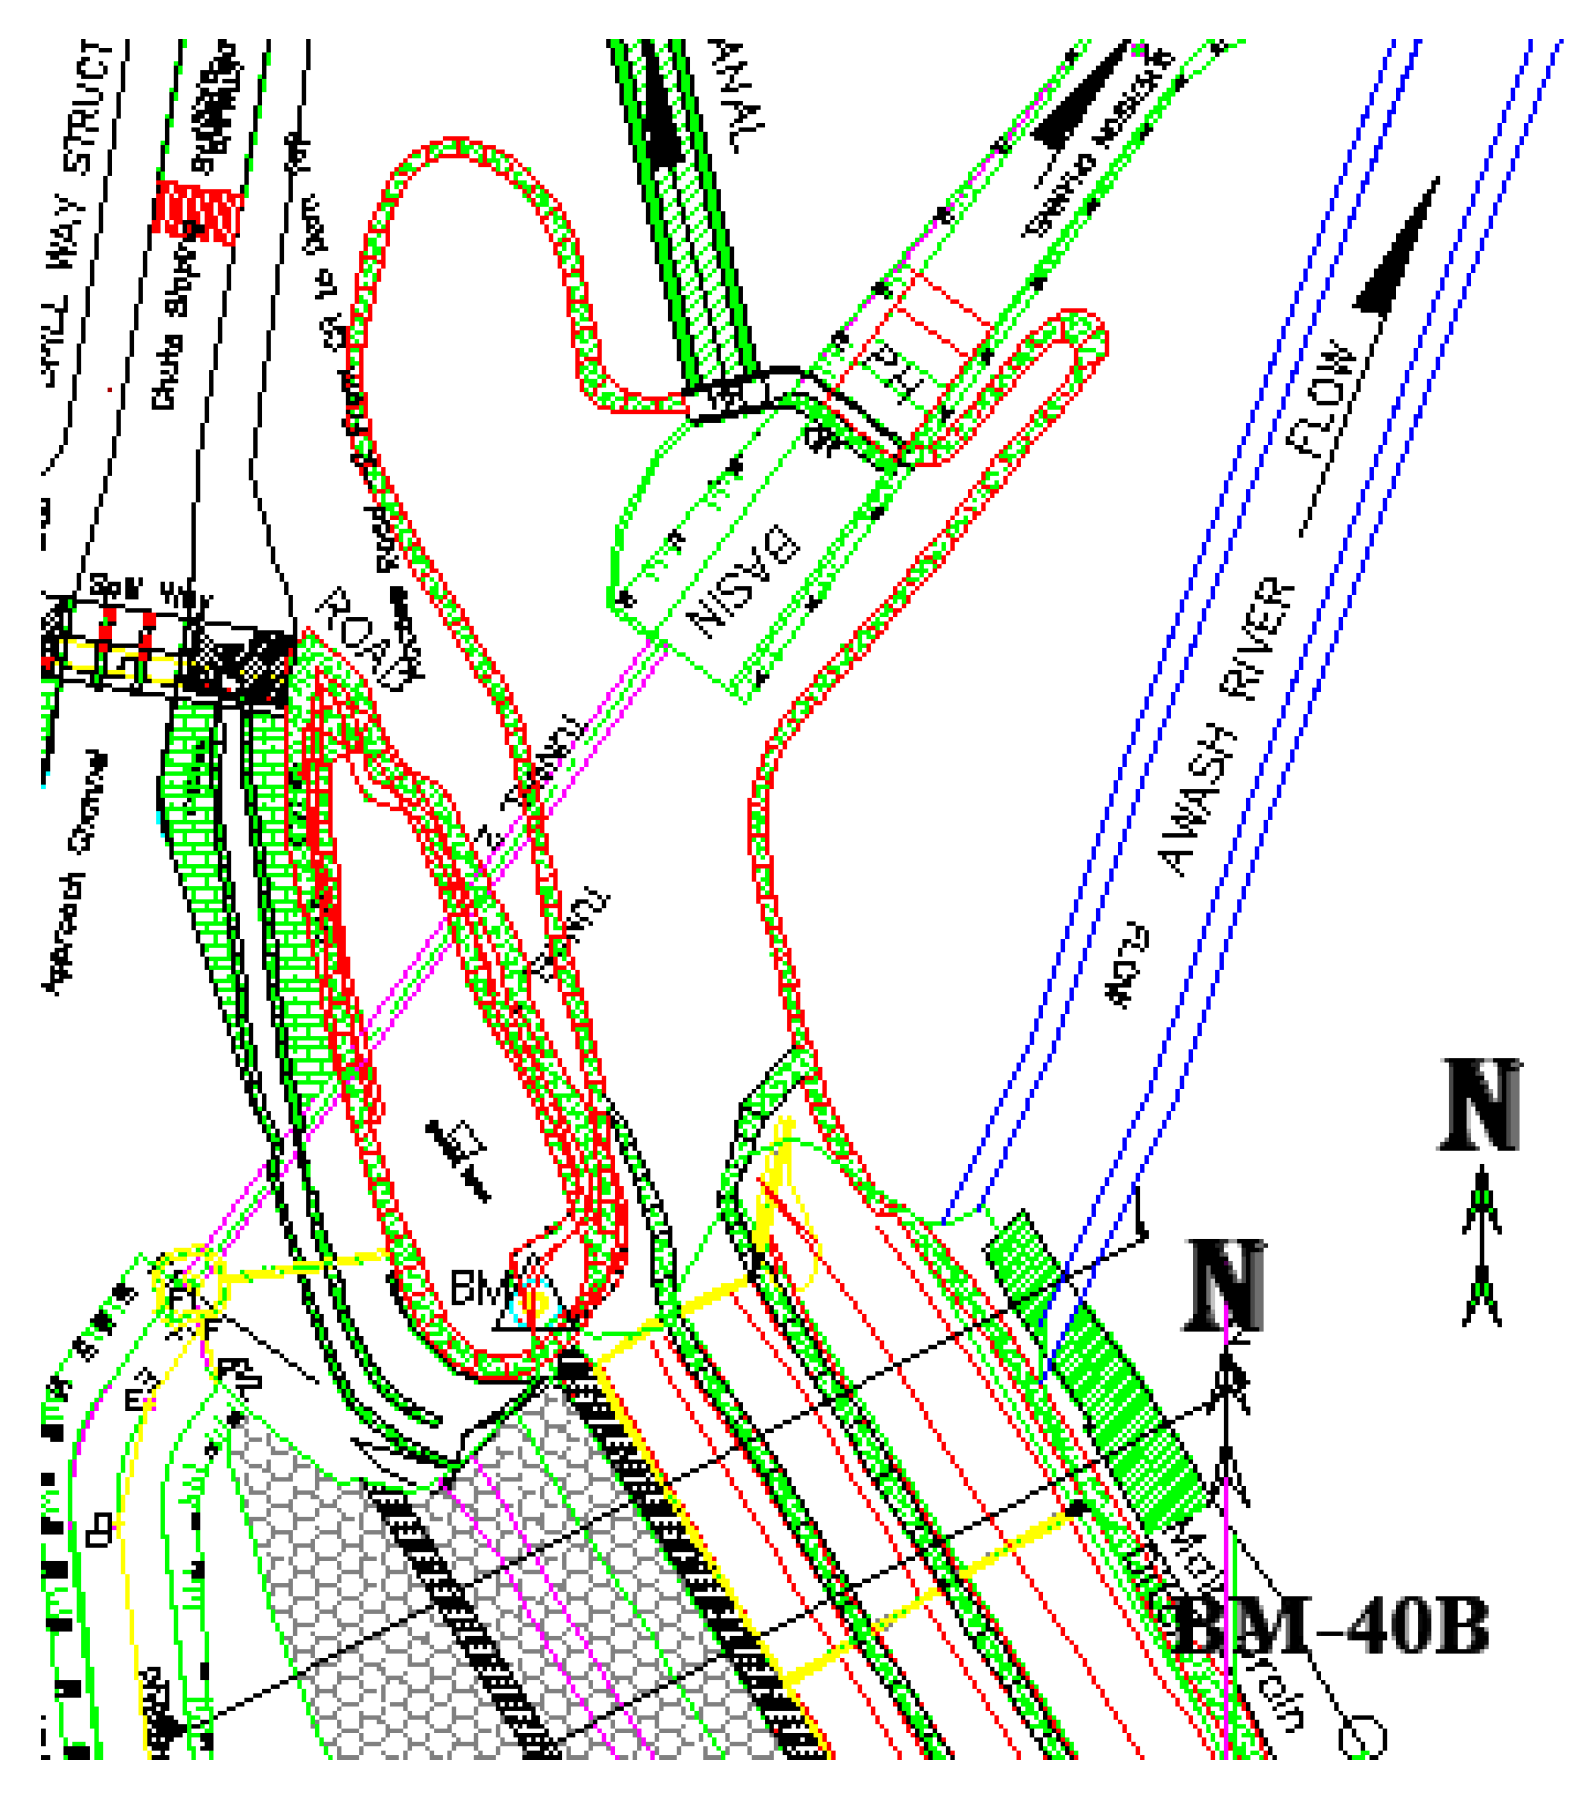
Figure 4.
Efficiency curves of turbines.
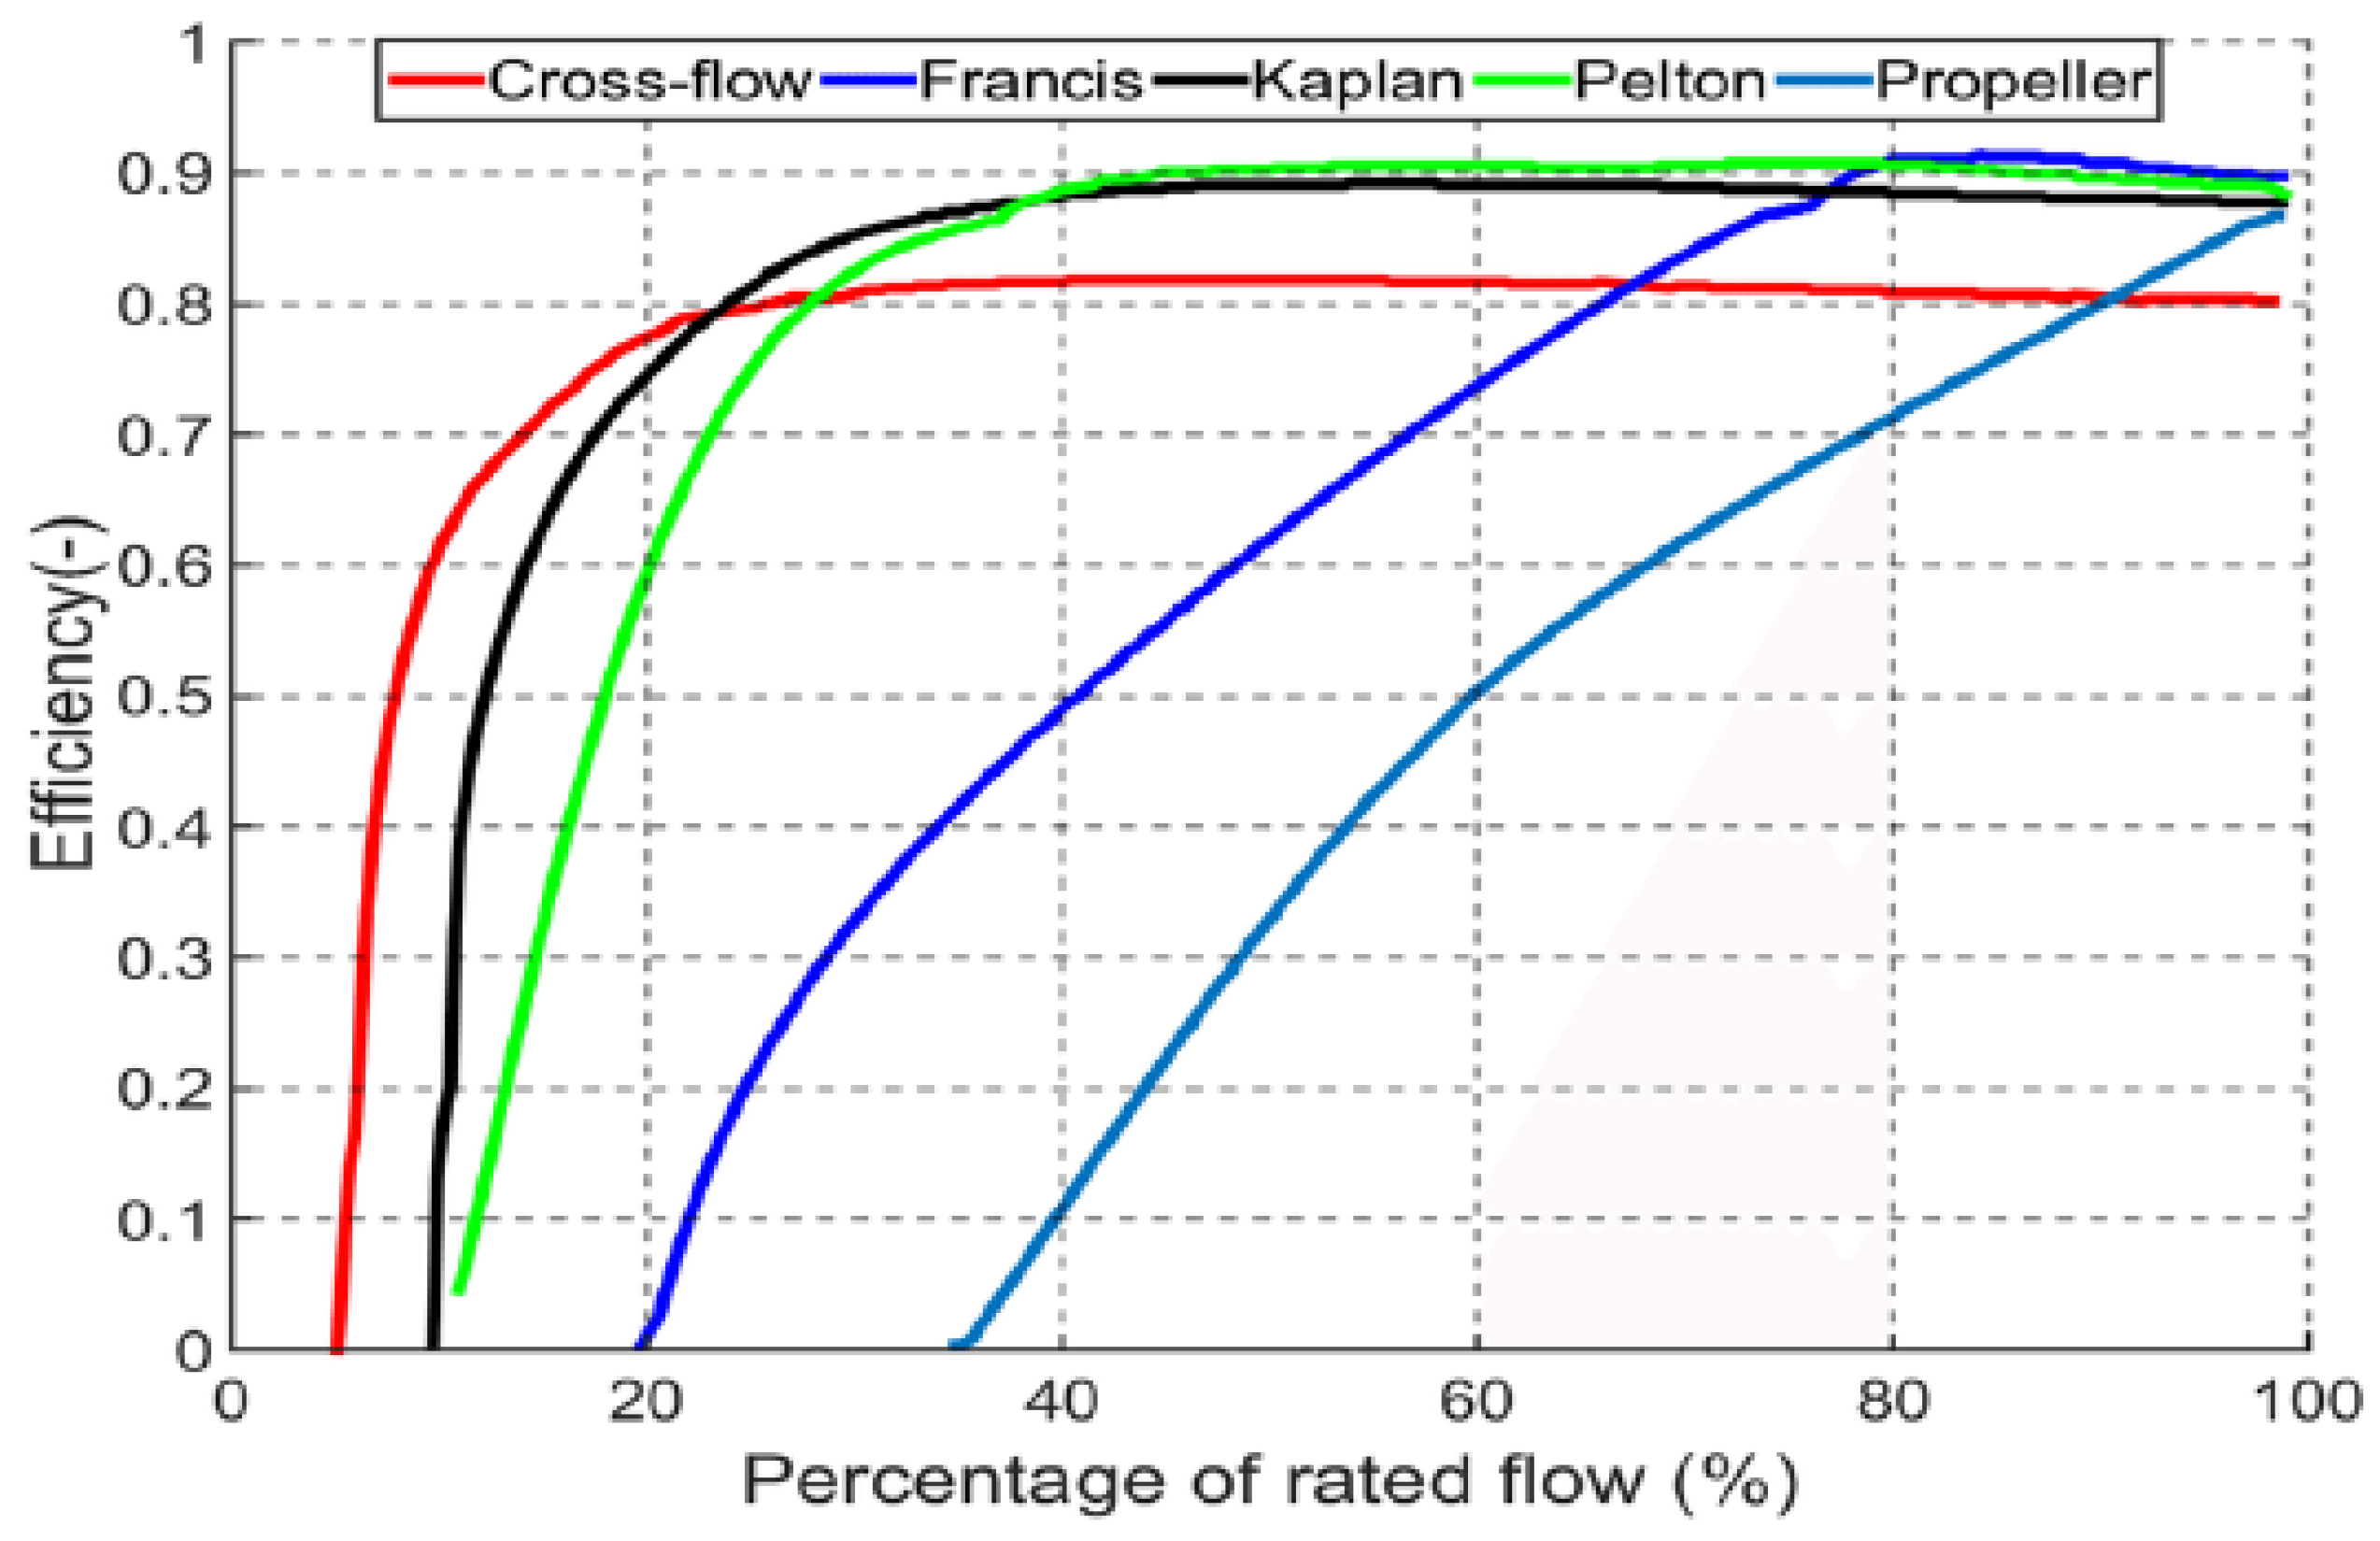
Table 6.
Summary of cost for option I, II and III.
| Item Description | Option I | Option II | Option III |
| Civil Works Subtotal | 5,452.143 | 1,630,675 | 74,195 |
| EM HM Cost | 8,285,513 | 8,285,513 | 408,177 |
| Total Project Cost | 18,408,459 | 749.62 | 627,418 |
| Unit Cost (USD/Kw) | 994.84 | 749.62 | 3002 |
Disclaimer/Publisher’s Note: The statements, opinions and data contained in all publications are solely those of the individual author(s) and contributor(s) and not of MDPI and/or the editor(s). MDPI and/or the editor(s) disclaim responsibility for any injury to people or property resulting from any ideas, methods, instructions or products referred to in the content. |
© 2026 by the authors. Licensee MDPI, Basel, Switzerland. This article is an open access article distributed under the terms and conditions of the Creative Commons Attribution (CC BY) license (http://creativecommons.org/licenses/by/4.0/).
Copyright: This open access article is published under a Creative Commons CC BY 4.0 license, which permit the free download, distribution, and reuse, provided that the author and preprint are cited in any reuse.