

Submitted:
10 September 2026
Posted:
11 September 2026
You are already at the latest version
Abstract
High-density residential areas require environmental measures that address multiple anthropogenic pressures while remaining spatially feasible and compatible with economic and social objectives. Existing selection approaches often treat these requirements separately and rarely incorporate built-form morphology as an explicit constraint. This study develops a multi-criteria methodology based on a combined two-stage optimization model. The method classifies measures targeting chemical, physical, and biological hazards; links them to functional, technological, and evaluation attributes; calculates environmental relevance and scenario-specific sustainability scores; and excludes spatially infeasible options through deterministic geometric filtering. The methodology was tested in a residential area in Rostov-on-Don, Russia. The results demonstrate that alternative priority weights produce distinct but comparable sets of measures while preserving the same measurements and feasibility rules. The proposed approach supports the reproducible selection and spatial allocation of measures during the preparation of residential-area improvement projects. The algorithm was also implemented in an online platform that enables stepwise data entry and scenario-based recommendations.
Keywords:
urban planning
; residential-area morphology
; urban design
; multi-criteria decision analysis
; sustainable development
; optimization
; environmental protection measures
1. Introduction
1.1. Problem Relevance
Cities worldwide face persistent tensions between socioeconomic development and environmental protection. In high-density residential areas, planning must reduce environmental risks without compromising spatial efficiency, public safety, or project feasibility. Economic justification is therefore essential because capital and operating costs can constrain implementation [1].
The need for environmentally safe built environments is particularly pronounced in multifunctional residential areas, where high density and functional intensity constrain the placement and operation of environmental measures. This study responds to policy objectives aimed at improving the comfort, safety, and environmental performance of urban residential environments [2].
1.2. Review of International Research
Urbanization has expanded across all world regions and has intensified the challenge of reconciling socioeconomic development with environmental quality in dense urban settings. Its principal environmental consequences include the degradation of natural biogeocenoses [3], air pollution [4,5,6,7], soil and water contamination [8], and reduced acoustic and microclimatic comfort in residential areas [9].
The literature indicates that improving environmental safety in residential areas requires an integrated approach that distinguishes among environmental protection measures, ecosystem services, and remediation measures. Although closely related, these concepts have different scopes and should be defined consistently [10,11].
Environmental protection measures comprise engineering, planning, and organizational solutions designed to prevent, reduce, or eliminate adverse anthropogenic effects. In residential areas, they include conventional solutions, such as noise-protection planting and sanitary protection zones [12], as well as adaptive technologies integrated into landscaping and site improvement [13].
The ecosystem-services concept has become widely used in urban planning [14,15]. Ecosystem services are commonly classified as provisioning, regulating, supporting, and cultural services. In residential areas, regulating services—such as air purification, microclimate regulation, and noise attenuation—and cultural services related to recreation and aesthetic quality have the most direct influence on residents’ well-being [16].
Environmental protection measures in residential areas aim to maintain a living environment in which residents are protected from chemical, physical, and biological hazards. Specific objectives include reducing pollution to regulatory levels, increasing ecosystem resilience, conserving biodiversity, and providing comfortable conditions for recreation and daily activity [17].
International practice generally evaluates urban environmental quality through three interrelated dimensions: environmental, social, and economic performance [18]. Because improvements in one dimension may impose constraints on another, their joint assessment requires an explicit treatment of trade-offs.
The literature review identified six functional categories of environmental protection measures applicable to the present study (Table 1).
A central methodological challenge is to balance the three dimensions. Environmental benefits, including pollution reduction, biodiversity conservation, and microclimate regulation, may conflict with capital and operating constraints. Social benefits are essential to quality of life but are often difficult to express in monetary terms. These characteristics support the use of multi-criteria methods to identify an appropriate set of measures.
1.3. Review of Methodological Approaches
Current research applies several approaches to improving environmental safety in residential areas. For analytical purposes, the reviewed studies were grouped into three broad categories according to their objectives, methods, and degree of integration.
The first category comprises factor-specific studies [19], which examine individual components of environmental quality without systematically addressing their interactions. This approach provides detailed evidence for individual factors but may generate measures that conflict when implemented together.
The second category comprises regulation-oriented approaches [20], in which decisions are based primarily on compliance with established standards. Their limitation is the discrete nature of regulatory thresholds, which does not capture trade-offs among different impacts.
The third category comprises integrated approaches [21], which treat residential areas as socio-ecological-economic systems. This perspective underpins the concepts of green infrastructure, blue–green infrastructure, ecosystem services, and nature-based solutions.
Table 2 summarizes the reviewed studies by functional category, methodological approach, and principal finding.
When the effectiveness of environmental measures is assessed against several criteria, multi-criteria decision analysis (MCDA) provides a suitable framework for balancing their multiple benefits and constraints [39].
MCDA is particularly relevant when criteria differ in physical meaning and measurement units. Reviews of urban quality-of-life assessment identify numerous indicators spanning environmental, physical-infrastructure, and social dimensions, confirming the suitability of MCDA for integrated environmental-quality assessment [40].
Recent hybrid approaches combine MCDA with rule-based procedures and geographic information systems (GIS). These studies demonstrate the value of integrating spatial analysis with multi-criteria assessment when identifying locations suitable for sustainable urban development [39,40,41].
Despite the widespread application of MCDA in urban planning and environmental management, environmental and social criteria are represented more frequently than economic and technical constraints. This imbalance indicates a need for methods that integrate spatial and economic feasibility into multi-criteria assessment.
In residential-area planning, multi-criteria approaches have been applied mainly to site selection for social infrastructure and recreational spaces and to stormwater management within blue–green infrastructure. Their use for selecting across a broad catalog of environmental measures remains limited.
The review identified four limitations that are relevant to the present study:
- Built-form morphology is rarely used as an explicit constraint. Existing studies consider morphological parameters mainly in aerodynamic calculations rather than integrating them into a measure-selection procedure;
- Chemical, physical, and biological hazards are seldom assessed within the same framework. Most studies focus on a single environmental domain, although an integrated assessment is required to support environmental safety;
- Decision-maker priorities are not consistently represented through adjustable and transparent weights. Where weighting is used, its mathematical basis is often insufficiently documented;
- Practical implementation in an accessible decision-support tool remains uncommon. Many studies propose theoretical models without providing a reproducible workflow for end users.
Accordingly, this study develops an integrated methodology that combines multi-criteria ranking with deterministic spatial-feasibility testing. The underlying information model links criteria, technological requirements, and functional relationships among measures and monitored hazards. The approach is intended to provide a transparent, reproducible, and locally adaptable basis for selecting environmental protection measures in residential areas.
Greening, blue–green infrastructure, transport management, adaptive lighting, runoff control, soil remediation, and utility upgrades can provide environmental benefits while influencing accessibility, public-space quality, operational requirements, and long-term costs [14,15,16,32,33,34,35,42]. This multifunctionality complicates selection because an effective measure may be spatially infeasible, weakly related to the dominant hazard, or operationally costly.
Recent studies published in Sustainability commonly define a specific study object and input dataset, document a reproducible analytical workflow, report quantitative results, compare findings with previous research, and state limitations and data requirements [12,13,14,15,16,17,18,19,20]. Related applications use GIS-based suitability analysis, fuzzy multi-criteria methods, machine learning, and decision-support interfaces; however, they typically focus on site suitability, quality of life, a single infrastructure type, or one environmental domain.

Table 3.
Positioning of the proposed methodology relative to recent studies published in Sustainability.
Table 3.
Positioning of the proposed methodology relative to recent studies published in Sustainability.
| Study | Approach | Contribution relevant to this study | Remaining gap |
| L. Della Spina and V. Assumma [43] | MCDA priority mapping for collaborative urban regeneration | Object-specific criteria and spatial prioritization | Does not rank an interdisciplinary catalog of environmental measures |
| R. Nathawat, S.K. Gupta, S. Kanga, et al. [44,45] | GIS-based green-infrastructure suitability model | Spatial evidence and suitability mapping | Identifies suitable green-infrastructure locations rather than comparing measures targeting different hazards |
| A.M. Banisalman, M.E. Elsharkawy, and A.E. Labin [46] | GIS and nature-based solutions for open-green-space planning | On-site testing and spatial planning | Focuses on site selection and gives limited attention to physical and biological hazards |
| S.M. Salavati, M. Janalipour, and N.A. Tehrani [47] | FAHP and SVM methodology for mapping urban quality of life | Spatial indicators, validation, and sensitivity analysis | Evaluates conditions rather than selecting environmental measures |
| M. Alqadi, S. Zaharieva, et al. [48] | Decision-support system for ecosystem-service valuation | Database, assessment system, interface, and testing | Addresses one infrastructure domain and relies on preliminary estimates |
The identified research gap is the absence of a transparent procedure that simultaneously (1) links measures to chemical, physical, and biological hazards; (2) preserves the priority of measured environmental urgency; (3) allows decision makers to vary sustainability priorities; and (4) excludes spatially infeasible measures using reproducible geometric rules. Reviews of MCDA for green spaces and nature-based solutions likewise identify uneven treatment of technical and economic constraints, limited uncertainty analysis, and inconsistent reporting of criteria and weights [17,36,37,38,39].
1.4. Aim and Objectives
This study aims to develop and test an integrated methodology for the multi-criteria selection of environmental protection measures in residential areas. The methodology seeks to balance environmental, social, and economic objectives while accounting for constraints imposed by built-form morphology.
The following objectives were defined:
- to classify environmental protection measures by functional group and by the chemical, physical, and biological hazards they address and to describe their environmental, social, and economic effects;
- to develop an information model comprising interrelated tables of evaluation criteria, technological requirements, and functional attributes, with unique codes ensuring consistent identification of measures;
- to formalize a two-stage algorithm that combines multi-criteria ranking with geometric filtering based on built-form morphology and measured site parameters; and
- to test the methodology in a residential area and compare planning scenarios generated under alternative priority structures.
The object of the study is the decision process used to select environmental protection measures for residential areas under multiple criteria, uncertain input data, and spatial constraints. The subject is the methodology itself, including its information model, multi-criteria ranking procedure, and deterministic geometric filter.
Living-environment quality is defined as the integrated condition of a territory in which air, water, soil, acoustic, and microclimatic parameters do not pose unacceptable risks to residents and the spatial organization supports everyday comfort and access to essential functions.
Regulatory compliance is necessary but insufficient. The methodology therefore also considers the persistence of effects, resource requirements, adaptability to changing loads, and contributions to the environmental, social, and economic performance of the area.
Environmental protection measures are interpreted more broadly than local pollution-control actions. In addition to their direct environmental effects, they may improve microclimatic comfort and accessibility, support social activity, reduce operating costs, and increase the attractiveness of the area.
2. Materials and Methods
2.1. Conceptual Research Model
The conceptual model defines the analytical structure and sequence of the study.
The study develops and tests a decision-support procedure for selecting environmental protection measures in residential areas. The residential area is represented through the interaction of two domains:
- the built environment, comprising residential buildings, courtyards, green spaces, driveways, pedestrian paths, and related infrastructure; and
- the natural environment, comprising air, water, soil, and associated biotic components.
Residents are positioned at the center of the model because environmental quality directly affects their health, safety, and everyday well-being.
Safety is interpreted as both compliance with environmental standards and the provision of social and economic conditions that support comfort and access to infrastructure. Accordingly, candidate measures are evaluated not only by their direct effect on environmental hazards but also by their contribution to environmental, social, and economic sustainability.
The conceptual model comprises three interrelated information blocks (Figure 1):
Block 1. The living environment as the interaction between built and natural components.
Block 2. Chemical, physical, and biological hazards affecting environmental quality.
Block 3. Environmental, social, and economic conditions supporting sustainable residential development.
The three blocks are linked through an assessment of existing conditions and the subsequent selection of environmental protection measures.
2.2. Living Environment as the Study Object
The study focuses on an urban residential area, for which environmental-quality requirements are particularly important because exposure occurs close to homes and everyday activity spaces.
2.2.1. Built Environment of the Residential Area
The built environment comprises the following spatial and functional elements:
- sites occupied by residential buildings of different heights;
- building-adjacent areas, including courtyards, driveways, and parking areas;
- green spaces, including lawns, squares, and boulevards;
- utility areas, including municipal solid-waste collection sites and service facilities;
- utility-network corridors, including water supply, sewerage, stormwater drainage, and district-heating networks; and
- transport infrastructure, including streets and pedestrian areas.
The selection of environmental measures requires explicit consideration of site geometry and built-form morphology.
The built environment is described using the following measurable spatial parameters:
- built-form morphotype M, number of storeys H, number of buildings n, building footprint A_b, and building coverage ratio K_b;
- total residential-area size A_t, free area A_f, impervious-surface area A_imp, and imperviousness ratio K_imp;
- courtyard area A_c, minimum free width b_c, length l_c, length-to-width ratio, and the availability of continuous strips for linear measures;
- green area A_g, green-space ratio K_g, minimum green-strip width b_g, and distance from impact sources to residential façades d_r; and
- parking and utility-area dimensions, number of parking spaces, driveway width, utility-network alignments, and protection-zone widths. These measured parameters are compared directly with the minimum requirements of each measure and are not replaced by expert judgment.
A representative model of the study area is shown in Figure 2.
The configuration and quality of these elements influence the environmental, social, and economic performance of the residential area.
Built-environment elements are considered in two roles:
- recipient: an element exposed to an impact and requiring protection, such as housing or a recreation area; and
- buffer: an element capable of attenuating or redistributing an impact, such as a green space or water body.
This distinction is important because candidate measures should both reduce environmental risk and improve the broader sustainability performance of the area. Each measure is therefore assigned a direct hazard-reduction function and a set of associated sustainability effects.
2.2.2. Natural Environment of the Residential Area
The natural environment includes atmospheric air, surface water, groundwater, soil, and associated biotic components. Their condition is described by chemical concentrations, physical-impact levels, and sanitary-biological indicators measured at relevant human or ecosystem receptors.
Pollutants may move among these components through aerosol deposition, wash-off by surface runoff, soil infiltration, resuspension of dust, and bioaerosol formation. A single source can therefore generate several indicator groups, and measure selection must account for both the source and the receiving medium.
Table 4 presents the principal source–pollutant relationships used in the assessment.
Environmental quality is assessed for components whose critical condition may threaten human health or ecosystem functioning.
Activities within the residential area and on adjacent land are treated as potential sources of pollution for the three environmental media listed in Table 4.
The assessment begins with measurements of pollution and impact levels for the relevant environmental media. These values establish the priorities for selecting measures that reduce critical or near-critical conditions.
2.3. Environmental Quality Hazards in Residential Areas
The assessment framework distinguishes three groups of anthropogenic hazards: chemical, physical, and biological. The classification was derived from field observations, the scientific literature, and applicable regulatory documents. Each group is represented by measurable indicators that support the subsequent selection of environmental protection measures.
2.3.1. Chemical Pollution Hazards
Chemical pollution is a priority concern because many substances exert chronic, cumulative, or combined effects and can be transported among air, water, and soil. Relevant sources include transport and heating emissions, contaminated surface runoff, utility leaks, and secondary soil contamination.
For air, the monitored parameters comprise NOₓ, SO₂, CO, volatile organic compounds, PM₂.₅, and PM₁₀; for water, they comprise petroleum products, heavy metals, surfactants, and nitrates; and for soil, they comprise heavy metals, petroleum products, and water-soluble salts. Table 5 lists the units and critical-value rules.
Initial values are obtained through instrumental measurements and laboratory analysis at representative points along the source–pathway–receptor sequence. Sampling includes background and maximum-load locations and, for linear sources, points along a transverse profile. Calibrated instruments, certified methods, and documented quality-control procedures are used.
The assessment requires quantitative data; therefore, on-site instrumental measurements are performed using certified instruments and methods that comply with applicable regulatory requirements.
2.3.2. Physical Pollution Hazards
Physical impacts do not alter the chemical composition of environmental media, but prolonged exposure can reduce comfort and adversely affect human health. Relevant impacts include traffic and equipment noise, vibration, electromagnetic fields, inadequate or excessive lighting, and unfavorable microclimatic and thermal conditions.
The assessment uses equivalent and maximum sound levels, vibration acceleration, electric-field strength, magnetic induction, illuminance, air temperature, relative humidity, air velocity, surface temperature, and the UV index. Table 6 presents the units and comparison rules.
Measurements are conducted during representative and peak-load periods near residential façades and windows, children’s play and recreation areas, transport boundaries, and utility sources. Instrument positions, durations, and sampling intervals follow the applicable method for each factor.
2.3.3. Biological Pollution Hazards
Biological pollution is associated with organisms or biological material in air, water, and soil that may trigger infectious, parasitic, or allergic responses. Relevant sources include sewer leaks, waste-collection areas, dog-walking areas, stagnant water, poorly maintained green spaces, and seasonal pollen.
For air, the assessment includes pollen, total microbial counts, and mold spores; for water, it includes indicator bacteria (E. coli), pathogenic microorganisms, and indicators of algal proliferation; and for soil, it includes helminth eggs and pathogenic microorganisms. Table 7 presents the parameter system.
Air samples are collected using aspiration or sedimentation methods, whereas water and soil are sampled in accordance with sanitary requirements. Analyses are performed by an accredited laboratory. For pathogens and parasitological indicators, the criterion may be either a concentration threshold or detection within a specified sample volume or mass.
2.4. Assessment and Selection of Environmental Protection Measures
2.4.1. Environmental Protection Measures
Each environmental protection measure is linked to the hazards it directly addresses and to the built-environment elements required for its implementation.
The principal object in the information model is a measure, identified by a unique code E₁, E₂, …, Eₙ.
In addition to reducing a specific hazard, each measure may produce environmental, social, and economic co-benefits that contribute to residential-area sustainability.
Table 8 presents a catalog of measures selected according to their direct effects on monitored hazards and their multifunctional contribution to sustainability. Co-benefits are evaluated on an ordinal expert scale from 0 to 3, considering spatial coverage, duration, the number of affected recipients, and the feasibility of instrumental verification:
0—no demonstrable positive effect, not applicable to the factor, or a potentially adverse effect;
1—local or short-term effect on an individual site element;
2—persistent and measurable effect at the scale of a functional area or several user groups; and
3—systemic, long-term, and measurable effect across most of the area or several components of environmental quality.
The symbols 0, +, ++, and +++ in Table 8 are encoded in the database as 0, 1, 2, and 3, respectively.
Each measure is also assigned minimum geometric and technical requirements. A measure can be implemented only where the available spatial resources satisfy these requirements.
The catalog includes measures for runoff control, water and soil treatment, noise and light reduction, utility repair, and sanitary-biological protection, ensuring that every monitored hazard is linked to at least one direct-response measure.
The selection procedure comprises three consecutive assessments:
- geometric feasibility, which tests whether the site can accommodate each measure;
- environmental relevance, which relates measured pollution and impact levels to the measures that address them; and
- sustainability performance, which evaluates the environmental, social, and economic co-benefits of each measure.
Combining these assessments yields a ranked, technically feasible set of measures for the study area.
2.4.2. Assessment of Geometric Parameters
Geometric feasibility is assessed before final selection and acts as a deterministic filter. Measures that cannot be accommodated within the available site dimensions are excluded from the feasible set.
The principal spatial constraints are:
- the available courtyard area;
- courtyard configuration and minimum dimensions; and
- the built-form morphotype and arrangement of buildings.
For each measure Eᵢ, the technological-attributes table specifies a vector of minimum requirements qᵢ: required area Aᵢ,min, width bᵢ,min, length lᵢ,min, permissible distance intervals dᵢ, compatible morphotype Mᵢ, and utility-network constraints. A corresponding vector q of measured site parameters is compiled for the study area.
The geometric compatibility indicator is defined as Gᵢ = 1 when A ≥ Aᵢ,min, b ≥ bᵢ,min, l ≥ lᵢ,min, all distances fall within permissible intervals, the morphotype is compatible, and no utility protection zone is violated; otherwise, Gᵢ = 0. The geometrically feasible set is Z = {Eᵢ ∈ E₀ | Gᵢ = 1}. Because the requirements are defined once and evaluated against measured site dimensions, the procedure is reproducible.
The binary scale distinguishes feasible measures (Gᵢ = 1) from measures that cannot be implemented under the measured geometric conditions (Gᵢ = 0).
2.4.3. Assessment of Pollution in Urban Environmental Media
For each monitored indicator, the pollution index PI is calculated as the ratio of the measured value to the corresponding critical value:
where:
PIᵢ = Cᵢ/Ccritᵢ
PIᵢ—pollution index for indicator i (dimensionless);
Cᵢ—measured value of pollutant or impact i; and
Ccritᵢ—critical value for pollutant or impact i, such as a maximum permissible concentration or target standard.
The index indicates the relative intensity of each impact. Values at or above 50% of the critical threshold are treated as a risk zone for prioritizing measures.
For standardization, the index is converted to a 0–10 scale: Pⱼ = min(10, 10·PIⱼ). Thus, Pⱼ = 5 corresponds to 50% of the critical level, and Pⱼ = 10 indicates that the critical level has been reached or exceeded. The environmental relevance of measure Eᵢ is calculated only from the indicators it addresses: Qᵢ = ΣⱼwⱼaᵢⱼPⱼ/Σⱼwⱼaᵢⱼ, where aᵢⱼ ∈ {0,1} represents the functional relationship between measure i and indicator j, and wⱼ is the hazard or significance weight. If a measure is unrelated to all indicators, Qᵢ is set to 0.
2.4.4. Sustainability Assessment
Sustainability performance is assessed through environmental, social, and economic effects. This assessment follows the calculation of direct environmental relevance and can increase or decrease the overall priority of a measure according to the selected scenario.
Environmental effects include resource-efficient technologies, the use of natural materials, and the conservation or restoration of natural elements. Social effects include improved accessibility, amenity, safety, and psychological comfort. Economic effects include changes in capital and operating costs, asset life, and the attractiveness or value of the area. These co-benefits are evaluated separately from direct hazard reduction.
Experts assess each effect using the scale presented in Table 9.
Scores depend on the urban context and should be assigned by experts familiar with the study area. The resulting values are recorded in the evaluation-criteria table.
2.5. Research Workflow
The workflow comprises a sequence of steps leading from site characterization to the selection and spatial allocation of environmental measures (Figure 3).
The workflow consists of four sequential blocks:
- Data collection: measured site plan and built-form morphotype; chemical concentrations; physical-impact levels; biological indicators; and decision-maker priorities and constraints.
- Assessment: calculation of pollution indices and environmental relevance; expert assessment of environmental, social, and economic effects; and verification of the completeness and comparability of the input data.
- Processing: integrated ranking under a specified set of weights and exclusion of measures that do not satisfy the measured geometric conditions.
- Scenario development: formation and spatial allocation of alternative sets of measures, followed by the calculation of quantities, costs, and performance indicators and selection of the preferred option.
The environmental-measures database comprises three interrelated tables:
- evaluation criteria, which store expert scores for the environmental, social, and economic effects of each measure;
- technological attributes, which store the conditions under which measures can be applied to different built-form morphotypes; and
- functional attributes, which link measures to the chemical, physical, and biological hazards they reduce.
2.6. Mathematical Framework for Assessing and Selecting Environmental Measures
The model seeks an appropriate balance among environmental, social, and economic performance while enforcing the geometric constraints of the study area. Its output is a ranked set of technically feasible measures for a specific urban context.
The algorithm comprises three computational stages (Figure 4):
The mathematical model combines multi-criteria ranking with spatial-feasibility testing. Let E₀ = {E₁, …, Eₙ} denote the full catalog of measures; j = 1, …, m denote the monitored pollutants and impacts; and k = 1, 2, 3 denote the environmental, social, and economic sustainability effects. The calculation is performed in three stages after the input data have been prepared.
Stage 0: Input data preparation.
For the study area, the model uses the measured values Cⱼ, critical values Ccritⱼ, geometric vector q, functional-relationship matrix aᵢⱼ, expert sustainability scores xᵢₖ ∈ {0,1,2,3}, scenario weights gₖ ≥ 0 with Σgₖ = 1, and the environmental-safety priority coefficient λ ∈ [0.5,1].
Stage 1: Multi-criteria assessment and ranking.
First, the normalized exposure level is calculated as Pⱼ = min(10, 10·Cⱼ/Ccritⱼ). The environmental relevance of measure Eᵢ is then calculated as Qᵢ = ΣⱼwⱼaᵢⱼPⱼ/Σⱼwⱼaᵢⱼ, where wⱼ is the hazard or significance weight of indicator j. If a measure is not linked to any indicator, Qᵢ is set to 0.
The associated sustainability effect is calculated as Sᵢ = Σₖgₖxᵢₖ and rescaled to 0–10 as S*ᵢ = (10/3)Sᵢ. The integrated score is Rᵢ = λQᵢ + (1 − λ)S*ᵢ. The constraint λ ≥ 0.5 preserves the priority of environmental safety, whereas changes in gₖ generate alternative scenarios. Measures are ordered by decreasing Rᵢ to form the ranked list L.
Stage 2: Geometric filtering.
For each measure, Gᵢ = 1 when the actual area, width, length, setbacks, morphotype, and utility constraints satisfy all minimum requirements; otherwise, Gᵢ = 0. The final set Y = {Eᵢ ∈ L | Gᵢ = 1} preserves the order of L and contains only technically feasible measures.
Varying gₖ and λ changes the ranking but not the original measurements or geometric constraints. The scenarios are therefore comparable: their differences reflect alternative priorities rather than changes in the input data. The algorithm returns a ranked feasible set for spatial allocation and techno-economic comparison.
The calculation yields a ranked set of technically feasible environmental protection measures.
3. Results
A residential area in Rostov-on-Don was selected to test the methodology. The area contains multi-apartment buildings, a school, a kindergarten, a community center, internal driveways and parking areas, utility sites, green spaces, and utility networks (Figure 5). These elements provide a representative combination of impact sources and spatial constraints:
- 5.
- high-traffic streets along the site boundaries, generating NOₓ, CO, volatile organic compounds, particulate matter, noise, and vibration;
- 6.
- internal driveways and extensive parking areas, creating localized zones of contaminated runoff, overheating, and light exposure;
- 7.
- a high proportion of impervious surfaces and a risk of disrupted surface runoff; and
- 8.
- utility areas and network-maintenance zones, representing potential sources of odors, biological contamination, leakage, and flooding, together with fragmented green spaces.
The area was treated as a comprehensive-renewal case in which measures must both reduce priority impacts and improve sustainability performance. The planning scheme was used to define measurable geometric constraints rather than to assign an abstract morphotype through expert judgment.
3.1. Data Collection for the Study Area
Data were collected in three steps. First, geometric parameters were recorded from the site plan and field survey. Table 10 lists the required parameters, with values obtained from the measured plan and survey records. Second, chemical, physical, and biological indicators were measured at control points and normalized as Pⱼ (Table 11). Third, the expert group compiled the matrix of environmental, social, and economic effects xᵢₖ and documented the basis for each score (Table 12). The resulting values were combined into a single input-data table and held constant across all scenarios.
To ensure reproducibility, the survey plan records the site boundary and scale, the areas of functional zones, minimum free widths, distances to impact sources, utility-network locations, and measurement points.
A field survey of the study area and adjacent development was conducted to identify the sustainability effects required from the selected measures. These requirements were incorporated into the assessment system.
During data collection, impact categories are separated from monitored indicators, and measured values are separated from their standardized scores. This structure prevents heterogeneous data from being combined in the same field and supports unambiguous transfer from measurement records to the calculation matrix.
3.2. Mathematical Calculation and Selection of Measure Sets for Alternative Priority Scenarios
The calculation stage transforms heterogeneous survey results into comparable indicators and generates a ranked set of technically feasible measures for each scenario. Inputs comprise measured impact values and critical levels, the functional-relationship matrix, expert assessments of associated effects, scenario weights, and site geometry. Outputs comprise Qᵢ, Rᵢ, Gᵢ, and the ordered feasible set Y.
The calculation proceeds sequentially. Each measured impact is first compared with its critical value and converted to the 0–10 normalized level Pⱼ. For each catalog measure, environmental relevance Qᵢ is calculated using only the impacts that the measure directly addresses. Expert scores for environmental, social, and economic effects are then combined with the scenario weights to obtain the associated sustainability score S*ᵢ. Finally, the integrated score Rᵢ is calculated, and the measures are ranked in descending order.
After ranking, each measure undergoes geometric verification. Its minimum requirements are compared with the available area, width and length of free space, permissible setbacks, built-form morphotype, utility-network locations, and the need to maintain fire and service access. Measures with Gᵢ = 1 remain in the list; those with Gᵢ = 0 are excluded as technically infeasible. Table 13 records Qᵢ, Rᵢ for the three scenarios, and Gᵢ.
Three scenarios represent different decision objectives. The environmental scenario prioritizes the reduction of identified chemical, physical, and biological impacts. The balanced scenario assigns comparable importance to environmental outcomes, residents’ interests, and operational and economic consequences. The socioeconomic scenario prioritizes user comfort and cost efficiency while maintaining the required minimum environmental outcome.
Each scenario is defined by a normalized weight vector g whose components sum to 1. Three contrasting vectors were tested in the order environmental, social, and economic: (0.60, 0.20, 0.20), (0.34, 0.33, 0.33), and (0.20, 0.40, 0.40). These values are scenario assumptions rather than universal standards. The coefficient λ represents the contribution of direct correspondence between a measure and the measured impacts to the final score Rᵢ; λ was set to 0.60 in all scenarios. Consequently, a measure with substantial co-benefits cannot receive a high priority if it does not address a documented site risk, such as contaminated runoff, dust, or noise.
The calculation produces a ranked list in which environmental relevance, scenario-specific integrated scores, and geometric feasibility are reported for every measure. This list provides the formal basis for scenario development; differences among scenarios arise from the specified weights rather than changes in measurements or feasibility rules.
3.3. Formation and Formal Description of Planning Scenarios
This stage converts the ranking of individual measures into integrated planning alternatives that can be compared in terms of environmental performance, spatial feasibility, and aggregate techno-economic indicators. The same feasible set Y is interpreted under three alternative priority structures.
For each scenario, measures are selected from the ranked feasible set Y, beginning with the highest Rᵢ. A measure is included when it matches the scenario priority, addresses a documented site impact, and has a confirmed location. When several measures duplicate the same effect in one location, the measure with the higher Rᵢ is preferred; complementary measures are retained when they can be accommodated together. For each selected measure, the code and name, Qᵢ, Rᵢ, rank, and Gᵢ are recorded. Measures are then allocated to specific areas of the site; repeated placement is allowed when the same measure is required in spatially separated locations. Techno-economic indicators are calculated after spatial allocation.
The three scenarios use the same measurements, catalog of measures, and geometric-verification rules; only the priority structure varies. Differences in composition and ranking therefore reflect alternative objectives rather than changes in the input data.
The mean integrated score R̄ is the arithmetic mean of the individual Rᵢ values. It is not a sum and therefore permits comparison of sets containing different numbers of measures. Techno-economic indicators were derived from the spatial allocations, and costs were estimated in 2025 prices with an uncertainty of ±20%.
Table 14.
Comparison of planning scenarios.
| Indicator | Environmental | Balanced | Socioeconomic |
| Composition and spatial allocation (selection of measures E₁…Eₙ from Table 8) | E4, E18, E22, E2, E1; spatial allocation—Figure 7(2) | E4, E18, E22, E2, E1, E14, E29, E19; spatial allocation—Figure 7(3) | E30, E22, E1, E18; E1 and E18 occur at several locations; spatial allocation—Figure 7(1) |
| Number of selected measures, n | 5 | 8 | 4 |
| Mean integrated score of selected measures R̄, 0–10 | 7.92 | 7.64 | 7.38 |
| Green area, m² | 2050 | 1820 | 1240 |
| Permeable surfaces, m² | 360 | 520 | 180 |
| Trees/shrubs/small architectural forms, n | 52/390/0 | 44/340/18 | 36/260/0 |
| Length of protective strips, m | 245 | 220 | 175 |
| Capital costs, million RUB | 21.4 | 28.7 | 16.8 |
| Annual operating costs, million RUB/year | 1.32 | 1.64 | 0.91 |
For the socioeconomic scenario (Figure 7(1)), the algorithm selected four measure types after integrated ranking and geometric filtering:
(1) E30—repair and separation of stormwater and sanitary sewer systems;
(2) E22—rain garden for collecting surface runoff;
(3) E1—group planting of trees and shrubs; and
(4) E18—dust-filtering vegetation along the transport boundary.
Measures E1 and E18 were allocated to several feasible locations. This set limits capital and operating costs while retaining direct action on the priority risks.
For the environmental scenario (Figure 7(2)), the highest integrated scores among measures with Gᵢ = 1 were obtained for:
(1) E4—vertical greening of engineering infrastructure;
(2) E18—dust-filtering vegetation along transport boundaries;
(3) E22—rain garden;
(4) E2—hedges of native species along the roadway; and
(5) E1—protective and reclamation planting of trees and shrubs.
The planning scheme reduces dust and contaminated runoff, attenuates noise, and improves the continuity of green infrastructure.
The district police station and associated internal courtyard driveways were removed from the courtyard to create additional usable space.
For the balanced scenario (Figure 7(3)), the algorithm retained the environmental core—E4, E18, E22, E2, and E1—and added three geometrically feasible measures:
(6) E14—small architectural forms integrated with vegetation;
(7) E29—adaptive outdoor lighting with color-temperature control and limits on spill light; and
(8) E19—implementation of the car-free-yard principle while maintaining fire and service access.
The final design combines runoff management and protective planting with pedestrian safety and improved courtyard comfort. Space released by removing the district police station was allocated to previously absent sports, play, and recreation areas.
Scenario development completes the algorithmic workflow by converting a ranked list into testable planning alternatives. The alternatives can be compared by green and permeable area, number of elements, length of protective planting, and capital and operating costs. For the study area, the comparison identifies measures suitable for initial reconstruction, measures that can be added in an expanded balanced scenario, and spatial reserves that should be retained for later implementation.
4. Discussion
The results are consistent with studies showing that built-form morphology affects the dispersion of air pollutants and the propagation of noise [3,6,12,13,14,15]. In contrast to approaches that use morphology only as an input to flow modeling, the proposed method treats measured geometric parameters as explicit feasibility criteria for individual measures.
The combined use of green and blue infrastructure is consistent with research on ecosystem services and collaborative green-space management [14,15,16,17,18]. A single measure may regulate runoff, reduce overheating, support biodiversity, and improve public-space quality. The present method distinguishes these co-benefits from the direct response to a monitored hazard and evaluates the two components on separate scales.
The use of MCDA is also consistent with reviews of green-space and nature-based-solution planning [19,20,21,22]. Environmental, social, economic, and technical criteria use different units and cannot be combined transparently without standardization and explicit weights. The proposed model makes this procedure traceable through a common environmental-risk scale, a separate sustainability scale, and scenario-specific weighting.
Research on accessibility and intelligent urban management demonstrates the value of digital tools, graph models, and Internet of Things monitoring [37,38]. The proposed algorithm extends this approach by linking survey results, a catalog of measures, scenario priorities, and geometric-compatibility rules in a reproducible workflow connecting environmental assessment with planning decisions.
Compared with studies of biodiversity and carbon-sequestration co-benefits in residential courtyards [42], the proposed approach covers a broader range of chemical, physical, and biological hazards. Instrumental measurements are not replaced by expert judgment: experts evaluate only the associated sustainability effects, whereas pollution and geometry are represented by measured parameters.
The study is limited by the quality of the input data and the need to validate the expert-effects matrix. Critical values depend on the national regulatory framework and site category, whereas costs and operating performance change over time. Future research should include inter-expert validation, sensitivity analysis of the weights, explicit treatment of measurement uncertainty, and testing across several built-form morphotypes.
5. Conclusions
The study demonstrates that measurable environmental-quality objectives should be established at the pre-design stage of residential-area renovation and new development. Because environmental measures entail capital and operating costs, their inclusion should be supported by a transparent comparison of environmental relevance, cost, and spatial feasibility.
Living-environment quality is multidimensional. It depends not only on reductions in pollutant concentrations and physical and biological impacts but also on the contribution of measures to the environmental, social, and economic sustainability of the area.
The proposed methodology combines impact standardization, assessment of associated sustainability effects, scenario weights, and deterministic geometric filtering. Separating these components preserves environmental safety as the primary objective while allowing the priorities of residents, clients, and operating organizations to be represented.
The calculation produces a ranked feasible set of measures. For each option, the relationship to the monitored hazard, the sustainability contribution, the integrated score, and the reason for geometric acceptance or exclusion can be traced, thereby improving the reproducibility and transparency of selection.
The algorithm can be applied to both the renovation of existing residential areas and new development. In renovation projects, it identifies measures that fit the available space; in new projects, it indicates which geometric parameters should be adjusted before the planning proposal is approved.
The ranked list and scenario comparison provide inputs for the landscape plan, bill of quantities, and feasibility study. The final design decision should be made after spatial allocation, cost estimation, and verification of regulatory constraints.
The proposed methodology transforms measure selection from a collection of separate recommendations into a consistent and verifiable sequence: measurement, assessment, ranking, geometric verification, and scenario development. Its practical value lies in aligning environmental objectives with site constraints and documenting why each measure is included or excluded. For practical application, the algorithm has been implemented in an online platform that provides stepwise data entry, scenario calculation, and a record of the selection rationale.
References
- Aliu, J.; Oke, A.E.; Akanni, O.A. Exploring the barriers to the adoption of environmental economic practices in the construction industry / Management of Environmental Quality: An International Journal. 2025, 36(1), 1–20. [Google Scholar] [CrossRef]
- Hou, F.; Marzbali, M. H.; Tilaki, M. J. M. Rethinking Urban Greening: Implications of Crime Prevention Through Environmental Design for Enhancing Perceived Safety in Baitashan Park. Lanzhou Urban Sci. 2025, 9(1), 9. [Google Scholar] [CrossRef]
- Chen, Y.; Ren, X.; Xu, X. Evaluation of Living Environment Quality in Urban Residential Areas under the Concept of Urban Renewal - A Case Study of Binjiang District, Hangzhou, China. Sustainability 2023, 15(19), 14104. [Google Scholar] [CrossRef]
- Richards, G.C.; Carpenter, J.; Heneghan, C. Assessing housing exposures and interventions that impact healthy cities: a systematic overview of reviews / Perspectives in Public Health. 2023, 145(5). [Google Scholar] [CrossRef] [PubMed]
- Hassan, A. M.; ELMokadem, A.A.; Megahed, N.A. Urban morphology as a passive strategy in promoting outdoor air quality. J. Build. Eng. 2020. [Google Scholar] [CrossRef]
- Samarskaya, N.; Gurova, O. Investigation of the process of reducing air pollution when crushing gravel / E3S Web of Conferences. 2021, 281, 09021. [Google Scholar] [CrossRef]
- Sharmilaa, G.; Ilango, T. Vehicular air pollution based on traffic density - A case study / Materials Today: proceedings. 2022, Vol. 52(Part 3), P. 532–536. [Google Scholar] [CrossRef]
- Li, Z.; Ming, T.; Liu, Sh. Review on pollutant dispersion in urban areas-part A: Effects of mechanical factors and urban morphology / Building and Environment. 2021, Vol. 190, 107534. [Google Scholar] [CrossRef]
- Ruiz, M.A.; Mark-Vergara, Y.L. Resilient and Sustainable Housing Models against Climate Change: A Review / Sustainability. 2023, 15(18), 13544. [Google Scholar] [CrossRef]
- Liu, T.; Yu, L.; Chen, X. Environmental laws and ecological restoration projects enhancing ecosystem services in China: A meta-analysis / Journal of Environmental Management. 2023, Vol. 327, 116810. [Google Scholar] [CrossRef] [PubMed]
- Yang, J.; Yan, Y.; Wang, L. Dynamics of multiple stakeholders’ benefits due to mining area environmental remediation based on risk reduction and ecosystem services / Journal of Cleaner Production. 2023. [Google Scholar] [CrossRef]
- Kholikov, A. Recommendations on improvement of the state of anti-noise landscaping and the situation on the main streets of Tashkent city / AIP Conference Proceedings. 2024, 3023, 030001. Available online: https://pubs.aip.org/aip/acp/article-abstract/3023/1/030001/2932611 (accessed on 21 May 2026).
- Goldani, M. Strengthening urban resilience through landscape architecture: A comprehensive review of strategies and best practices / Flower and Ornamental Plants. 2024, 9, pp. 185–206. Available online: https://flowerjournal.ir/browse.php?a_code=A-10-323-1&sid=1&slc_lang=en (accessed on 25 May 2026).
- Silwal, S.; Thomas, R. Ecosystem Service Concept as a Rationale for Urban Green Space Conservation - A Systematic Review. Int. J. Sci. Adv. 2023, Vol. 4(3). [Google Scholar] [CrossRef]
- Cardinali, M.; Balderrama, A.; Arztmann, D. Green walls and health: An umbrella review / Nature-Based Solutions. 2023, Vol. 3, 100070. [Google Scholar] [CrossRef]
- Yang, L.; Zhou, X.; Gu, X. Impact mechanism of ecosystem services on resident well-being under sustainable development goals: A case study of the Shanghai metropolitan area / Environmental Impact Assessment Review. 2023, Vol. 103, p. 107262. Available online: https://www.sciencedirect.com/science/article/pii/S0195925523002287 (accessed on 16 June 2026).
- Bisht, S.; Singh, H.; Kumar, A. Ecosystem Services and Maintaining Their Flow in Urban Environments: Nurturing Sustainable Flow in Urban Environments / Urban Forests, Climate Change and Environmental Pollution. 2024, pp. 447–467. Available online: https://link.springer.com/chapter/10.1007/978-3-031-67837-0_21 (accessed on 20 June 2026).
- Ochoa, W.A.A.; Neto, A.; Junior, P.C. The Theory of Complexity and Sustainable Urban Development: A Systematic Literature Review / Sustainability. 2025, 17(1), 3. [Google Scholar] [CrossRef]
- Ibrahim, S.; Younes, A.; Abdel-Razek, S.A. Impact of Neighborhood Urban Morphologies on Walkability Using Spatial Multi-Criteria Analysis / Urban Sci. 2024, 8(2), 70. [Google Scholar] [CrossRef]
- Okay, B.B. Sharing Economy and Sustainable Development Goals: Multi-Dimensional and Cross-Dimensional Alignment at the City Level - A Qualitative Meta-Synthesis Based Systematic Review / Sustainability. 2026, 18(8), 3832. [Google Scholar] [CrossRef]
- Habrel, M.; Lysiak, N. Assessment of urban unfill socio-ecological and economic efficiency / AIP Conf. Proc. 2022, 2574, 160002. [Google Scholar] [CrossRef]
- Kumar, P.; et al. Urban heat mitigation by green and blue infrastructure: Drivers, effectiveness, and future needs / Innovation (Camb). 2024, 5(2), 100588. [Google Scholar] [CrossRef] [PubMed]
- Valois, L.; Aline, B.; et al. Performance assessment of the ecosystem services provided by urban Nature-based solutions: focus on rainwater management / IOP Conference Series Earth and Environmental Science. 2023, 1196(1), 012028. [Google Scholar] [CrossRef]
- Danilina, N.; Tsurenkova, K.; Berkovich, V. Evaluating Urban Green Public Spaces: The Case Study of Krasnodar Region Cities, Russia / Sustainability. 2021, 13, 14059. [Google Scholar] [CrossRef]
- Miroshnyk, N.V.; Likhanov, A.F.; Grabovska, T.O.; Teslenko, I.K.; Roubík, H. Green infrastructure and relationship with urbanization - Importance and necessity of integrated governance / Land Use Policy. 2022, Vol. 114, 105941. [Google Scholar] [CrossRef]
- Valappil, A.; Kumar, P.; et al. Air Pollution Abatement Performances of Green Infrastructure in Open Road and Built-up Street Canyon Environments - A Review / Atmospheric Environment. 2017, 162, 71–86. [Google Scholar] [CrossRef]
- Lei, Y.; Duan, Y.; He, D.; Zhang, X.; Chen, L.; Li, Y.; Zheng, J. Effects of urban greenspace patterns on particulate matter pollution in metropolitan Zhengzhou in Henan, China / Atmosphere. 2018, 9(5), 199. [Google Scholar] [CrossRef]
- Janhäll, S. Review on urban vegetation and particle air pollution - Deposition and dispersion / Atmospheric Environment. 2015, Vol. 105, 130–137. [Google Scholar] [CrossRef]
- Gil-Ozoudeh, I.; et al. Life cycle assessment of green buildings: A comprehensive analysis of environmental impacts. Int. J. Manag. Entrep. Res. 2022, 4(12), 729–747. [Google Scholar] [CrossRef]
- Nandi, N.; Dede, M. Urban heat island assessment using remote sensing data in West Java, Indonesia: From literature review to experiments and analyses / Indonesian Journal of Science and Technology. 2022, 7(1), 105–116. [Google Scholar] [CrossRef]
- Delgado-Enales, I.; Del Ser, J. A framework to improve urban accessibility and environmental conditions in age-friendly cities using graph modeling and multi-objective optimization. Comput. Environ. Urban Syst. 2023, 102, 101966. [Google Scholar] [CrossRef]
- Salman, M. Y.; Hasar, H. Review on environmental aspects in smart city concept: Water, waste, air pollution and transportation smart applications using IoT techniques / Sustainable Cities and Society. 2023, 94, 104567. [Google Scholar] [CrossRef]
- Li, S.; Jian, H.; Zhou, L.; Qiu, L. A multiple case study on the cooperative governance model of treating environmental deterioration. Chin. J. Popul. Resour. Environ. 2021, Vol. 19(Issue 1), P. 56–64. [Google Scholar] [CrossRef]
- Kotlyarova, E. Basic scientific principles of improving the methodology for the assessment of the level of environmental safety of urbanized territories / AIP Conference Proceedings. 2023, 2560, 020010. [Google Scholar] [CrossRef]
- Lei, F.; et al. Global Investigation of Soil Moisture and Latent Heat Flux Coupling Strength / Water Resour Res. 2018, 54(10), 8196–8215. [Google Scholar] [CrossRef] [PubMed]
- Mundher, R.; Bakar, S.A. Aesthetic Quality Assessment of Landscapes as a Model for Urban Forest Areas: A Systematic Literature Review / Forests. 2022, 13(7), 991. [Google Scholar] [CrossRef]
- Shangen, T.; Kaixin, L. Research Progress and Prospect of Internet of Things Technology in the Context of Smart Landscape / Landscape Architecture. 2023, 30(8), 64–71. [Google Scholar] [CrossRef]
- Yuan, L.; Yang, Z.; Wang, X. A Systematic Review of Research on Urban Streets and Parks Based on Eye-Tracking Technology / Appl. Sci. 2025, 15(17), 9305. [Google Scholar] [CrossRef]
- Bousquet, M.; Kuller, M.; Lacroix, S. A critical review of multicriteria decision analysis practices in planning of urban green spaces and nature-based solutions / Blue-Green Systems. 2023, 5(2), 200–219. [Google Scholar] [CrossRef]
- Ayo-Odifiri, S. A systematic review of the applicability of nature-based solutions for resilient urban residences in Southern Nigeria / International Journal of Disaster Resilience in the Built Environment. 2025, 16(3), 344–362. [Google Scholar] [CrossRef]
- Delgado-Enales, I. A framework to improve urban accessibility and environmental conditions in age-friendly cities using graph modeling and multi-objective optimization / Computers Environment and Urban Systems. 2023, 102(5), 101966. [Google Scholar] [CrossRef]
- Ariluoma, M. Optimizing the co-benefits of biodiversity and carbon sinks in urban residential yards / Frontiers in Sustainable Cities. 2024. [Google Scholar] [CrossRef]
- Della Spina, L.; Assumma, V. Development Strategies for the Mediterranean Coastal Landscape: Adaptive Decision-Making Processes for Implementing the Circular Economy in the Redevelopment of the Reggio Calabria Waterfront / Land. 2025, 14(2), 301. [Google Scholar] [CrossRef]
- Nathawat, R.; Gupta, S. K. Urban Green Infrastructure Planning in Jaipur, India: A GIS-Based Suitability Model for Semi-Arid Cities / Sustainability. 2025, 17(6), 2420. [Google Scholar] [CrossRef]
- Nathawat, R.; Kumar, S. A geospatial framework for Urban Blue Infrastructure suitability in semi-arid cities / Next Research. 2025, 2(3), 100596. [Google Scholar] [CrossRef]
- Salman, A.B.; Elsharkawy, M.M. Tool for the Establishment of Optimal Open Green Spaces Using GIS and Nature-Based Solutions: Al-Sareeh (Jordan) Case Study / Sustainability. 2025, 17(19). [Google Scholar] [CrossRef]
- Salavati, M.; Janalipour, M. Measuring Urban Quality of Life Through Spatial Analytics and Machine Learning: A Data-Driven Framework for Sustainable Urban Planning and Development / Sustainability. 2025, 17(11). [Google Scholar] [CrossRef]
- Alqadi, M.; Zaharieva, S. Developing and Implementing a Decision Support System-Integrated Framework for Evaluating Solar Park Effects on Water-Related Ecosystem Services / Sustainability. 2025, 17(7), 3121. [Google Scholar] [CrossRef]
Figure 1.
Conceptual model of the study.
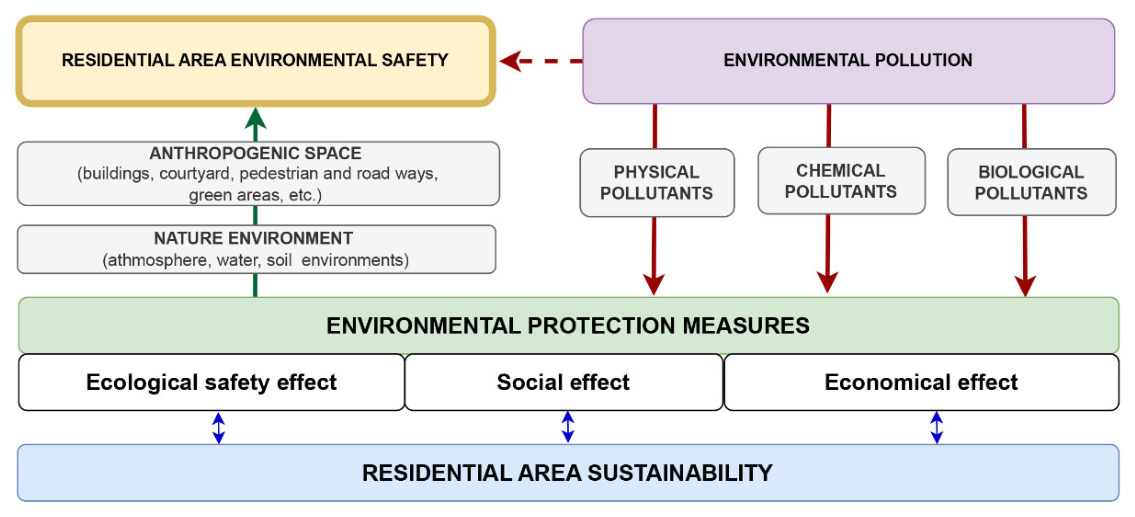
Figure 2.
Residential area and its principal spatial components.
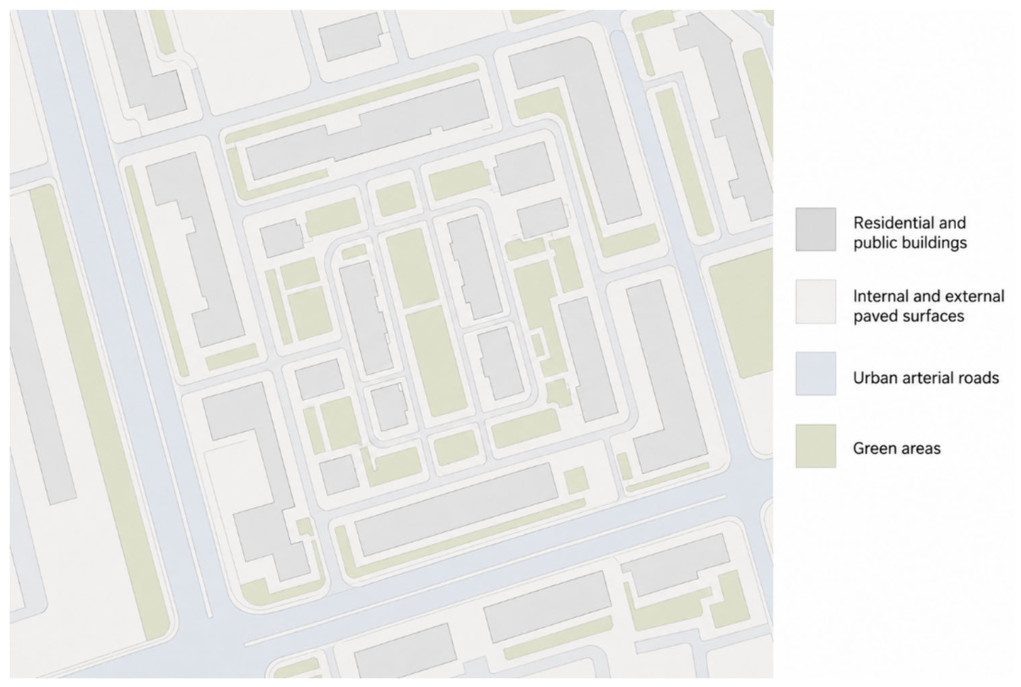
Figure 3.
Research workflow for selecting environmental measures.
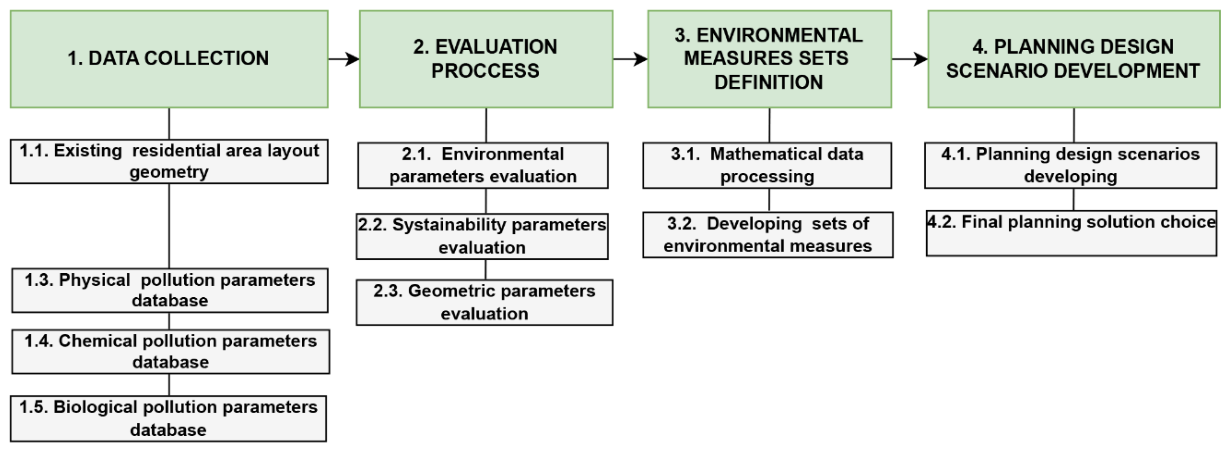
Figure 4.
Multi-criteria assessment, ranking, and geometric-filtering procedure.
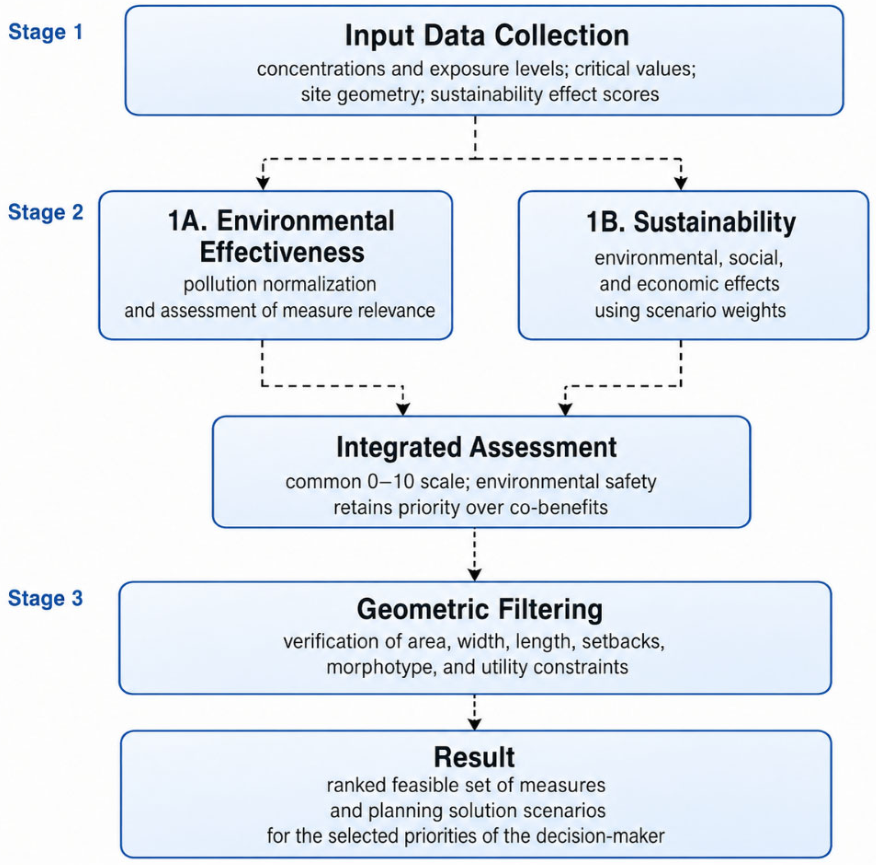
Figure 5.
Study area in Rostov-on-Don.
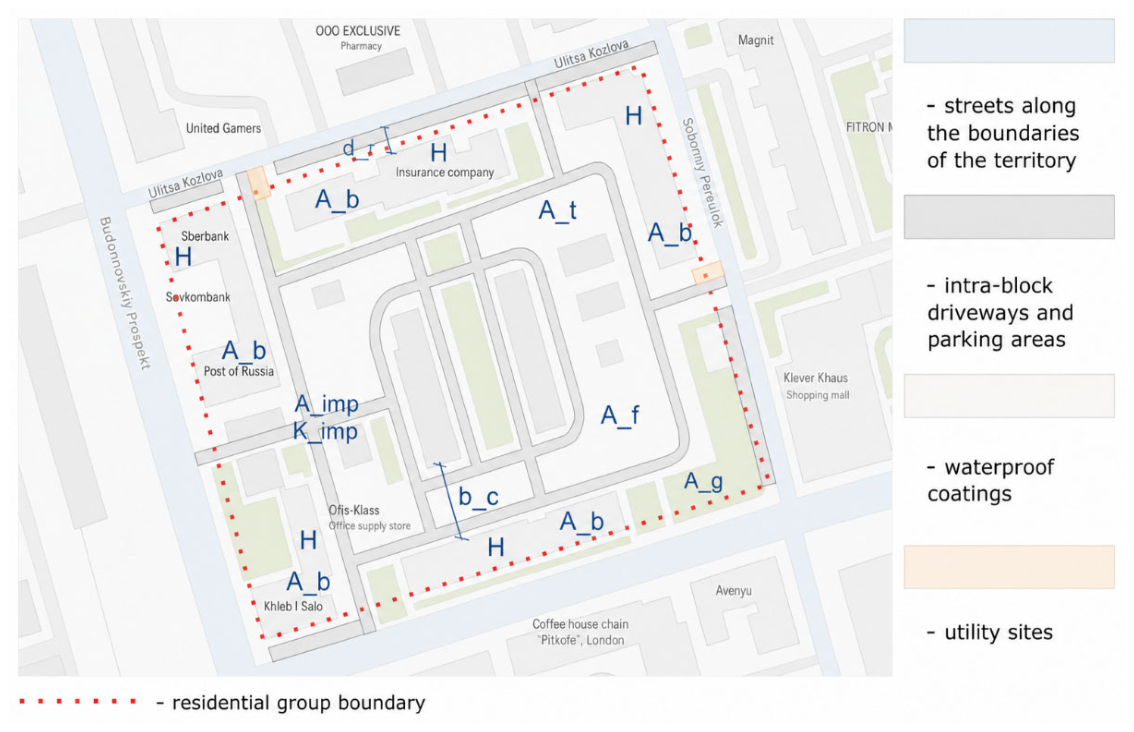
Figure 7.
Socioeconomic (1), environmental (2), and balanced (3) scenarios for selecting and spatially allocating environmental measures in the study area.
Figure 7.
Socioeconomic (1), environmental (2), and balanced (3) scenarios for selecting and spatially allocating environmental measures in the study area.
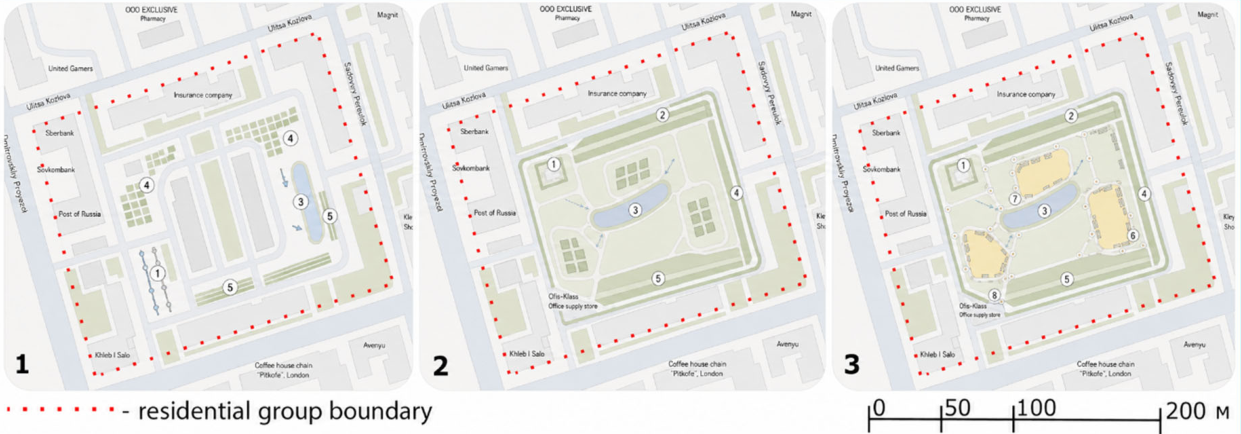
Table 1.
Environmental protection measures supporting sustainable urban development.
| No. | Category | Environmental effect | Social effect | Economic effect |
| 1 | Green infrastructure (rain gardens, bioswales, permeable pavements, and vertical greening) |
30–50% reduction in surface runoff; mitigation of soil sealing; improved stormwater quality | Improved visual quality and public-space comfort; reduced psychological stress | High capital and maintenance costs; limited applicability in dense development |
| 2 | Improvement of air and soil quality (phytoremediation and protective planting) |
Reduction in airborne pollutants; CO₂ uptake; soil phytoremediation | Potential improvement in public health and aesthetic quality | Potential conflicts with sanitary-zone requirements; maintenance needs; performance depends on species and climate |
| 3 | Noise protection and acoustic comfort (vegetation belts and acoustic barriers) |
Attenuation of noise through absorption, scattering, and screening | Reduced psychological stress; improved sleep and cognitive comfort | Limited effectiveness where space is constrained; seasonal variation; high cost of specialized barriers |
| 4 | Microclimatic comfort and a healthy environment (adiabatic systems, water features, pergolas, and phytoncide-producing plants) |
Lower surface and air temperatures; mitigation of urban heat; evapotranspirative cooling | Reduced summer heat stress and improved outdoor comfort | Water and energy requirements; maintenance needs; lower effectiveness under extreme conditions |
| 5 | Safety and accessibility (curb ramps, car-free yards, heated pavements, and adaptive lighting) |
Potential reduction in vehicle emissions, light pollution, and related exposure | Lower injury risk; improved accessibility; reduced stress associated with excessive lighting | Operating costs for heated surfaces; potential conflict with parking demand |
| 6 | Recreation, leisure, and social activity (dog-walking areas, community gardens, managed bird-feeding areas, and courtyard greenhouses) |
Support for biodiversity and environmental awareness | Stronger social ties; increased physical activity; improved psychological well-being | Maintenance and infrastructure costs; seasonal constraints; potential conflicts among user groups |
Table 2.
Systematization of existing approaches to improving urban environmental quality.
| No. | Category of measures | Methodological approach | Principal findings |
| 1 | Green infrastructure [22,23,24,25] | Systematic review of quantitative studies | Measurable reductions in air pollution were reported for both linear vegetation elements and larger green areas. |
| 2 | Improvement of air and soil quality [26,27,28] | Review of green-infrastructure performance in reducing air pollution | The effectiveness of urban vegetation depends on built-environment configuration. |
| 3 | Noise protection and acoustic comfort [12,29] | Systematic review of mechanical factors and built-form morphology | Vegetation can reduce sound pressure by 1–7 dBA; multi-row planting is more effective, and built form influences noise propagation. |
| 4 | Microclimatic comfort [12,30] | Review of methods for assessing the urban heat-island effect | Vertical greening can reduce daytime surface and air temperatures; performance depends on façade orientation and climate. |
| 5 | Safety and accessibility [31,32,33,34] | Graph modeling and multi-criteria optimization | Integrated frameworks can improve urban accessibility while accounting for environmental conditions; IoT systems support monitoring and management. |
| 6 | Recreation, leisure, and social activity [25,35] | Analysis of vegetation patterns and integrated green-infrastructure governance | The spatial pattern of green areas influences particulate pollution, and integrated governance supports long-term performance. |
| 7 | Aesthetics and landscape design [36] | Assessment of formal, cultural, and experiential dimensions of landscape quality | Place-specific design can strengthen aesthetic quality, cultural meaning, and user experience. |
| 8 | Smart technologies [37] | Scientometric review of Internet of Things applications in landscape projects | Smart sensing, data analysis, resource management, and automated maintenance can improve landscape performance. |
| 9 | Navigation and communication [38] | Systematic review of eye-tracking studies in streets and parks | Evidence on visual attention and cognitive response can support legible navigation and restorative urban environments. |
Table 4.
Principal sources and pollutants in the residential environment.
| Residential-area element | Water | Air | Soil and ground |
| Residential buildings | Domestic and emergency wastewater; organic substances, synthetic surfactants, nitrates, pathogenic microorganisms | Emissions from heating and ventilation systems: NOx, SO₂, CO, VOCs, PM; biological aerosols | Roof runoff: suspended solids, heavy metals, petroleum products; construction waste |
| Building-adjacent areas | Surface runoff: suspended solids, petroleum products, deicing salts, heavy metals | Vehicle exhaust: NOx, CO, VOCs, PM; secondary dusting; noise and heat load | Compaction; petroleum products; salts; heavy metals |
| Social infrastructure facilities | Domestic wastewater: organic and biogenic substances, synthetic surfactants, microbiological indicators | Ventilation emissions, odors, VOCs, PM; transport emissions | Food and medical waste; pathogenic microorganisms; compaction |
| Green spaces | Runoff of fertilizers and maintenance agents: nitrates, phosphates, surfactants | Pollen, spores and other bioaerosols; secondary dusting during lawn degradation | Accumulation of salts and heavy metals; residues of fertilizers and pesticides; parasitological indicators |
| Transport routes | Road runoff: petroleum products, salts, PAHs, heavy metals, suspended solids | NOx, CO, VOCs, PM; noise, vibration, light impact | Petroleum products, salts, PAHs, heavy metals in the roadside strip |
| Utility networks | Water supply and sewerage leaks: synthetic surfactants, nitrates, pathogens; emergency discharges | Methane, H₂S and odors during accidents; thermal impact of district heating pipelines | Waterlogging, salinization, changes in moisture and microbiological indicators |
| Utility areas | MSW leachate: organic substances, synthetic surfactants, metals, microplastics and pathogens | Odors, CH₄, H₂S, VOCs, aerosols | Organic pollutants, heavy metals, microplastics, pathogenic microorganisms and helminths |
Table 5.
Indicators and critical values for chemical pollution.
| Environmental medium | Monitored indicator and unit | Critical-value rule |
| Critical concentration | Ccrit is the maximum permissible concentration or target standard for the applicable averaging period | |
| Air | NOₓ, SO₂, and CO, mg/m³ | Cᵢ ≥ Ccrit; risk zone at Cᵢ/Ccrit ≥ 0.5 |
| Volatile organic compounds, mg/m³ | For each substance, Cᵢ ≥ Ccrit; for mixtures, the applicable summation index | |
| PM₂.₅ and PM₁₀, mg/m³ | Exceedance of the applicable daily or annual mean Ccrit | |
| Water | Petroleum products, mg/dm³ | Cᵢ ≥ Ccrit for the applicable water-use category |
| Heavy metals, mg/dm³ | For each metal, Cᵢ ≥ Ccrit | |
| Surfactants, mg/dm³ | Cᵢ ≥ Ccrit | |
| Nitrates, mg/dm³ | Cᵢ ≥ Ccrit | |
| Soil and ground | Heavy metals, mg/kg dry weight | Cᵢ ≥ the maximum permissible concentration or, where unavailable, the regional background level |
| Petroleum products, mg/kg | Cᵢ ≥ the applicable regulatory or regional threshold | |
| Water-soluble salts/chlorides, mg/kg or % | Exceedance of the permissible content or background level | |
Table 6.
Indicators and critical values for physical impacts.
| Impact category | Monitored indicator and unit | Critical-value rule |
| Icrit is the maximum permissible level for the applicable location and time period | ||
| Noise | Equivalent sound level LAeq, dBA | LAeq ≥ the permissible level |
| Maximum sound level LAmax, dBA | LAmax ≥ the permissible level | |
| Vibration | Vibration acceleration, m/s², or corrected level, dB | Iᵢ ≥ Icrit |
| Electromagnetic fields | Electric-field strength, V/m | Iᵢ ≥ Icrit |
| Magnetic induction, µT | Iᵢ ≥ Icrit | |
| Lighting | Horizontal or vertical illuminance, lx | Value outside the permissible range or excessive spill light at residential windows |
| Microclimate | Air temperature, °C | Value outside the optimal or permissible range |
| Relative humidity, % | Value outside the permissible range | |
| Air velocity, m/s | Value outside the permissible range | |
| Thermal conditions | Surface temperature, °C | Exceedance of the background or target overheating threshold |
| UV exposure | UV index, dimensionless | High or very high level on the adopted scale |
Table 7.
Indicators and critical values for biological pollution.
| Environmental medium | Monitored indicator and unit | Critical-value rule |
| Sanitary-microbiological, parasitological, and aerobiological indicators | Bcrit is the permissible content or the required absence of a pathogen in a standardized sample | |
| Air | Pollen, grains/m³ | Bᵢ ≥ the seasonal or target risk threshold |
| Total microbial count and mold spores, CFU/m³ | Bᵢ ≥ Bcrit | |
| Water | E. coli, CFU or MPN/100 mL | Bᵢ ≥ Bcrit |
| Pathogens, presence/100 mL; algae, cells/mL; or chlorophyll-a, µg/L | Pathogen detected or Bᵢ ≥ Bcrit | |
| Soil and ground | Helminth eggs, eggs/kg | Viable forms detected or Bᵢ ≥ Bcrit |
| Pathogenic microorganisms, CFU/g or presence in the sample | Pathogen detected or Bᵢ ≥ Bcrit | |
Table 8.
Environmental protection measures, sustainability effects, and minimum geometric requirements.
Table 8.
Environmental protection measures, sustainability effects, and minimum geometric requirements.
| Code | Measure | Sustainability effects in residential areas | Minimum geometric and technical requirements | ||||
| Environmental | Social | Economic | |||||
| Chemical pollution | Physical impacts | Biological pollution | |||||
| E1 | Group planting of trees and shrubs | ++ | ++ | ++ | +++ | ++ | Area ≥25 m²; width ≥3 m; soil depth ≥1 m |
| E2 | Hedge of native plant species along the roadway | ++ | +++ | + | ++ | ++ | Length ≥10 m; strip width ≥1.5 m |
| E3 | Container planting in entrance areas with connection to the ground | + | + | + | ++ | + | Site ≥4 m²; remaining clear width ≥1.5 m |
| E4 | Vertical greening of engineering infrastructure and blank façades | + | ++ | + | ++ | + | Accessible surface ≥20 m²; maintenance passage ≥1 m |
| E5 | Small fountain or recirculating water feature | - | +++ | + | +++ | + | Site ≥15 m²; water and electricity connections |
| E6 | Separate municipal solid-waste collection site with closed containers | ++ | + | +++ | ++ | ++ | Area ≥12 m²; vehicle access; sanitary setback in accordance with local requirements |
| E7 | Noise-protection belt of deciduous trees | + | ++ | + | ++ | ++ | Continuous strip ≥10 m wide and ≥20 m long |
| E8 | Mixed noise-protection belt of coniferous and deciduous trees | + | +++ | + | ++ | ++ | Continuous strip ≥10 m wide and ≥20 m long |
| E9 | Row planting of tall shrubs | + | ++ | + | ++ | ++ | Width ≥3 m; length ≥10 m |
| E10 | Row planting of low shrubs | + | + | + | ++ | ++ | Width ≥1.5 m; length ≥10 m |
| E11 | Equipped dog-walking area | - | + | +++ | +++ | + | Area ≥400 m²; fencing and sanitary setback in accordance with local requirements |
| E12 | Managed bird-feeding area with sanitary maintenance | - | - | + | ++ | + | Site ≥6 m²; adequate distance from play areas and food-service sites |
| E13 | Automated irrigation with flow and soil-moisture control | + | ++ | + | + | ++ | Service area ≥100 m²; water source and irrigation network |
| E14 | Small architectural forms integrated with vegetation | + | + | + | +++ | ++ | Site ≥6 m²; clear passage ≥1.5 m |
| E15 | Planting for CO₂ uptake and shade provision | ++ | ++ | + | ++ | ++ | Area ≥50 m² or linear strip ≥3 m wide |
| E16 | Planting of sulfur-tolerant species to capture sulfur compounds | +++ | + | + | ++ | ++ | Protective strip ≥5 m wide and ≥20 m long |
| E17 | Phytoremediation planting to reduce phenolic contamination | +++ | + | + | ++ | ++ | Contaminated area ≥20 m²; confirmed soil suitability |
| E18 | Dust-filtering vegetation along the transport boundary | +++ | ++ | + | ++ | ++ | Continuous strip ≥5 m wide and ≥20 m long |
| E19 | Car-free yard principle with parking relocated outside the courtyard | +++ | +++ | + | +++ | +++ | Alternative parking; maintained fire and service access |
| E20 | Benches with autonomous lighting and charging facilities | - | + | - | ++ | + | Site ≥4 m²; clear passage ≥1.5 m |
| E21 | Community greenhouse within the courtyard | + | ++ | + | +++ | + | Area ≥30 m²; water and electricity connections |
| E22 | Rain garden or bioretention swale | +++ | ++ | ++ | ++ | ++ | Area ≥20 m²; width ≥2 m; connection to a runoff source |
| E23 | Permeable pavement for paths and parking areas | +++ | ++ | + | ++ | +++ | Area ≥50 m²; filter base and suitable soil conditions |
| E24 | Local sorption–filtration facility for stormwater runoff | +++ | + | ++ | + | ++ | Area ≥8 m² at the collection point; maintenance access |
| E25 | Replacement of contaminated soil or in situ phytoremediation | +++ | + | ++ | + | ++ | Confirmed area ≥20 m²; treatment depth based on survey results |
| E26 | Optimized use and storage of deicing agents | +++ | + | + | + | +++ | Managed surface area ≥100 m²; enclosed storage |
| E27 | Acoustic barrier or vegetated earth berm | + | +++ | + | + | ++ | Continuous length ≥20 m; space for the foundation and required clearances |
| E28 | Traffic calming and reduction in through traffic | ++ | +++ | + | +++ | +++ | Route modification possible while maintaining emergency access |
| E29 | Adaptive outdoor lighting with limits on spill light | - | +++ | - | ++ | ++ | Lighting network and installation points that avoid spill light at residential windows |
| E30 | Repair and separation of stormwater and sanitary sewer systems | +++ | ++ | +++ | + | +++ | Accessible network corridor and repair zone satisfying protection requirements |
| E31 | Sanitary treatment, rodent control, and elimination of stagnant-water sources | - | - | +++ | ++ | ++ | Identified contamination source; safe access for treatment and monitoring |
Table 9.
Interpretation of expert-assessment scores.
| Score | Interpretation |
| 0 | No positive effect, not applicable, or potentially adverse effect |
| 1 | Weak: local or short-term effect on an individual site element |
| 2 | Moderate: persistent and measurable effect at the scale of a functional area or several user groups |
| 3 | Strong: systemic, long-term, and measurable effect across a large part of the area or several quality components |
Table 10.
Geometric and planning parameters of the study area.
| Parameter | Value for the residential area |
| Residential-area size A_t, ha | 2.1 |
| Built-form morphotype and number of storeys H | 5 |
| Building footprint A_b, m²; building coverage K_b, % | 11,770/56 |
| Free courtyard area A_f, m² | 12,500 |
| Minimum free width b_c, m | 33 |
| Impervious surfaces A_imp, m²; imperviousness K_imp, % | 4092/19.5 |
| Green area A_g, m²; green-space ratio K_g, % | 5138/24.5 |
| Parking spaces, units | 60 |
| Distance to the transport boundary d_r, m | 18 |
Table 11.
Input data for chemical, physical, and biological impacts.
| Impact category | Monitored indicator and unit | Measured survey result | Normalized risk index Pⱼ, 0–10 |
| Physical impacts | Equivalent and maximum sound levels LAeq/LAmax, dBA | Iⱼ, as reported in the instrumental measurement record | Pⱼ = min(10, 10·Iⱼ/Icritⱼ) |
| Vibration acceleration, m/s², or corrected level, dB | Iⱼ, as reported in the instrumental measurement record | Pⱼ = min(10, 10·Iⱼ/Icritⱼ) | |
| Electric-field strength, V/m; magnetic induction, µT | Iⱼ, as reported in the instrumental measurement record | Pⱼ = min(10, 10·Iⱼ/Icritⱼ) | |
| Illuminance, lx; temperature, °C; humidity, %; air velocity, m/s | Iⱼ, as reported in the instrumental measurement record | Pⱼ, based on the magnitude of deviation from the permissible range | |
| Chemical indicators | Air: NOₓ, SO₂, CO, volatile organic compounds, PM₂.₅/PM₁₀, mg/m³ | Cⱼ, as reported in the laboratory record | Pⱼ = min(10, 10·Cⱼ/Ccritⱼ) |
| Water and surface runoff: petroleum products, metals, surfactants, nitrates, mg/dm³ | Cⱼ, as reported in the laboratory record | Pⱼ = min(10, 10·Cⱼ/Ccritⱼ) | |
| Soil: metals, petroleum products, and salts, mg/kg | Cⱼ, as reported in the laboratory record | Pⱼ = min(10, 10·Cⱼ/Ccritⱼ) | |
| Biological indicators | Air: pollen, microorganisms, and mold spores, grains/m³ or CFU/m³ | Bⱼ, as reported in the laboratory record | Pⱼ = min(10, 10·Bⱼ/Bcritⱼ) |
| Water and soil: E. coli, pathogens, and helminth eggs | Bⱼ and detection status, as reported in the laboratory record | Pⱼ = 10 when an unacceptable pathogen is detected; otherwise, Pⱼ = 10·Bⱼ/Bcritⱼ |
Table 12.
Required sustainability effects for scenario development.
| Required sustainability effects in the residential environment | ||
| Environmental effects | Social effects | Economic effects |
| Increasing green-space coverage; reducing soil sealing, surface runoff, noise, dust, and overheating; and supporting biodiversity | Improving acoustic and microclimatic comfort, accessibility, pedestrian safety, recreation facilities, navigation, and opportunities for social activity | Reducing wastewater, maintenance, energy, and water costs; extending the service life of surfaces and green assets; and increasing the attractiveness and value of the area |
Table 13.
Scenario-based ranking of measures.
| Measure | Qᵢ, 0–10 | Integrated score Rᵢ, 0–10 | Gᵢ | ||
| Environmental | Balanced | Socioeconomic | |||
| [Eᵢ, rank 1] | [auto] | [auto] | [auto] | [auto] | [auto] |
| [Eᵢ, rank 2] | [auto] | [auto] | [auto] | [auto] | [auto] |
| … | [auto] | [auto] | [auto] | [auto] | [auto] |
Disclaimer/Publisher’s Note: The statements, opinions and data contained in all publications are solely those of the individual author(s) and contributor(s) and not of MDPI and/or the editor(s). MDPI and/or the editor(s) disclaim responsibility for any injury to people or property resulting from any ideas, methods, instructions or products referred to in the content. |
© 2026 by the authors. Licensee MDPI, Basel, Switzerland. This article is an open access article distributed under the terms and conditions of the Creative Commons Attribution (CC BY) license.
Copyright: This open access article is published under a Creative Commons CC BY 4.0 license, which permit the free download, distribution, and reuse, provided that the author and preprint are cited in any reuse.