
Submitted:
10 September 2026
Posted:
11 September 2026
You are already at the latest version
Abstract
This study assessed how ruminal volatile fatty acid (VFA) biomarkers—acetic acid, propionic acid, the acetate-to-propionate ratio (A:P), and total VFA—relate to average daily gain (ADG) in growing sheep and goats, and whether they add predictive value beyond conventional covariates. A systematic search identified 85 studies with 290 treatment groups; complete data were available for 83 studies with 283 treatment groups (total VFA: 82 studies, 279 treatment groups). Two analytic strategies were used: multilevel meta-regression with inverse-variance weighting and an unweighted mixed linear model as a confirmatory check, with adjustment for dry matter intake, initial body weight, crude protein, neutral detergent fiber, and species. Under inverse-variance weighting with cluster-robust inference, acetic acid (β = 0.00088, robust P = 0.003), propionic acid (β = 0.00188, robust P < 0.001), and total VFA (β = 0.00088, robust P < 0.001) were positively related to ADG, explaining 0.583, 0.621, and 0.625 of heterogeneity, respectively; each added limited but positive explanatory value beyond covariates (0.017, 0.107, and 0.083). A:P did not reach significance under cluster-robust inference (robust P = 0.074) and behaved inconsistently in the mixed linear framework (P = 0.015). Results were consistent in the mixed linear framework (marginal R² = 0.610–0.642). Leave-one-out cross-validation showed propionic acid gave the largest cross-study predictive gain (overall ΔCV-R² = 0.124, 95% CI 0.012–0.326; RMSE reduced 10.84%; goats ΔCV-R² = 0.441, 95% CI 0.035–1.337; RMSE reduced 14.92%). No significant slope difference between sheep and goats was detected. In conclusion, acetic acid, propionic acid, and total VFA are robustly associated with ADG, but their incremental explanatory power for inter-study heterogeneity is modest; propionic acid offers the largest and most stable cross-study predictive increment, whereas A:P is unreliable. The models are suited to estimating mean treatment-group performance under similar conditions, pending external validation.
Keywords:
rumen volatile fatty acids
; propionic acid
; average daily gain
; sheep and goats
; multilevel meta-regression
; leave-one-out cross-validation
1. Introduction
Rumen volatile fatty acids (VFA) supply most of the energy that ruminants use, covering roughly 70%–80% of metabolizable energy (Bergman, 1990). In practice, the fermentation measures reported most often are acetic acid, propionic acid, and the A:P ratio (Russell and Hespell, 1981). These acids do not form a single uniform energy pool; instead, the VFA profile emerges from the combined action of the microbial community, the diet, and how animals are managed. Fibrous feeds typically steer fermentation toward acetate, whereas readily fermentable starch favors propionate-producing taxa such as Prevotella, Succinivibrionaceae, and Ruminococcus spp., raising the share of propionic acid (Janssen, 2010; Lin et al., 2023). Propionic acid in turn is a major substrate for hepatic gluconeogenesis: it feeds the tricarboxylic acid cycle through the propionate pathway and can contribute around 60%–74% of the carbon skeleton of glucose (Aschenbach et al., 2010). Since the propionic acid fraction reflects both fermentation type and energy partitioning, it may carry information about animal growth that other measures do not.
Average daily gain (ADG) is widely used as a growth indicator in sheep and goats (National Research Council, 2007). Calcium propionate supplementation improved lamb growth in one meta-analysis (Orzuna-Orzuna and Lara-Bueno, 2023), and goats with high daily gain showed higher ruminal propionate concentrations (Chen et al., 2024), as did high-yielding Hu sheep (Jia et al., 2026). A meta-analysis of goats likewise reported that additives such as yeast, which raise ruminal propionate and total VFA, improved ADG (Ogbuewu and Mbajiorgu, 2023); in lambs, post-weaning ADG has been connected to rumen microbiota composition and its fermentation products (Yin et al., 2023). Multi-omics work further suggests that differences in carbohydrate-degrading capacity between ruminal and hindgut microorganisms can directly affect ADG (Krone et al., 2024; Dai et al., 2021).
The literature was searched systematically in line with the PRISMA guidelines (Page et al., 2021), identifying 85 studies with 290 treatment groups. Complete data—all covariates plus the standard error of ADG—were available for 83 independent studies covering 283 treatment groups. Two analytical routes were then followed: inverse-variance-weighted multilevel meta-regression (Tempelman, 2025) as the primary analysis, and an unweighted mixed linear model as a confirmatory check. Both were used to examine how acetic acid, propionic acid, A:P, and total VFA relate to ADG in growing sheep and goats, to characterize their functional forms, and to adjust for feed intake, initial body weight, and diet composition. Incremental predictive value and the limits of applicability were assessed with the incremental heterogeneity-explanation proportion, species interaction tests, and leave-one-out cross-validation. Our hypothesis was that propionic acid adds predictive value for ADG beyond standard animal and dietary information, largely because of stable between-study differences in fermentation profiles that trace back to the biological mechanisms of the fermentation–glycogenolysis axis.
2. Materials and Methods
2.1. Data Sources and Retrieval Strategy
The systematic literature search was conducted in accordance with the PRISMA guidelines (Page et al., 2021) (search databases, search terms, and search date are detailed in Supplementary Material S1). No upper date limit was imposed; the search cutoff date was May 20, 2026. A total of 1,846 articles were identified, after deduplication, 1,275 articles remained; these underwent a preliminary screening based on titles and abstracts, eliminating 1,085 articles. Among the remaining 190 articles, full-text evaluations were performed; subsequently, 105 articles were excluded due to reasons such as failure to report ADG or VFA metrics, lack of standard deviation or standard error, experimental subjects not being sheep or goats, or duplicate publications. Ultimately, 85 studies comprising 290 treatment groups were included (48 studies involving 164 treatment groups for sheep, and 37 studies involving 126 treatment groups for goats; the literature screening process is detailed in Supplementary Material S1). A complete data sample was defined as records containing all predictive factors, covariates (DMI, IBW, CP, NDF), and the standard error (SE) for ADG; this resulted in 83 independent studies and 283 treatment groups, and Table 1A lists these 83 studies (46 sheep studies with 157 treatment groups and 37 goat studies with 126 treatment groups). For the total VFA analysis, since some studies did not report values, the analysis was based on 82 studies and 279 treatment groups. The means, standard deviations, and ranges for each predictive factor and covariate are presented in Table 1B of the article. The covariates included dry matter intake (DMI, kg/d), initial body weight (IBW, kg), dietary crude protein (CP,% DM), and neutral detergent fiber (NDF,% DM); these were independently extracted from the original manuscripts of each included study by two researchers and cross-verified; missing records were excluded according to the complete data principle. The selection of the above four factors was based on their decisive role in determining growth performance (energy intake, body size, and fiber regulation), supplemented by model comparisons incorporating stepwise addition of covariates (using AIC and heterogeneity explanation proportions) and a variance inflation factor (VIF) diagnostic (with all VIFs < 2.3) to validate their necessity and ensure non-collinearity (see Appendix A, covariate diagnostics).
2.2. Analytical Framework
The primary analysis rested on two independent frameworks. In the first, inverse variance weighting was used: each treatment group was weighted by the reciprocal of the squared standard error (SE) of its ADG mean, and multilevel meta-regression was then applied to the group means (Tempelman, 2025). Predictors were centered by their inverse-variance-weighted means, and squared terms were added to limit collinearity between X and X² and to keep the main effects easy to interpret. The random-effects structure operated on two levels, study (Study) and the within-study treatment effect, the latter being the observation-level random term that captures residual between-group heterogeneity. Treating studies as clusters, we obtained cluster-robust standard errors (CR1); P-values under this framework are therefore cluster-robust, while within-model P-values are reported for reference. The second framework was an unweighted linear mixed model (LMM) in which Study entered as a random intercept and effect size (ID) was nested within Study as a random effect; marginal R² was derived with the Nakagawa–Schielzeth method. The inverse-variance framework was designated the primary (formal) analysis and supplied the principal results, and the unweighted LMM served as a confirmatory check that the findings did not hinge on the weighting choice. Because the LMM's random structure already accounts for within-study correlation, within-model P-values are reported for this framework. Heterogeneity explained is summarized by three complementary proportions (see Figure 1): the proportion for the model with predictors only (M1; the “(X only)” value in Figure 1) relative to the empty model; the incremental proportion of the full model relative to the covariates-only model (incremental R², reported untruncated so that negative values are kept); and the proportion of the full model relative to the empty model. The output also includes τ² for each model (spanning both study and treatment components), the residual heterogeneity Q-test, and the overall I². These three measures index different benchmarks—completeness, incrementality, and overall heterogeneity—so they should not be compared directly.
Where: Yij is the average daily gain (ADG, kg/d) of the jth treatment group in the ith study; is the overall intercept; is the random intercept for study i (random effect); is the species-effect coefficient, with "Goat" an indicator variable taking 1 for goats and 0 for sheep; , , , , and are the fixed-effect coefficients for propionic acid concentration (Pro, mmol/L), dry matter intake (DMI, kg/d), initial body weight (IBW, kg), dietary crude protein (CP, % DM), and neutral detergent fiber (NDF, % DM), respectively; and mᵢⱼ is the residual term.
Standard errors are shown in parentheses: intercept 0.0349 (0.0356); Goat = −0.0055 (0.0133); Pro = 0.00219 (0.00037); DMI = 0.1320 (0.0144); IBW = −0.00131 (0.00090); CP = 0.00136 (0.00085); NDF = −0.00115 (0.00048). n = 273 treatment groups and 80 studies; the marginal R2 (R2m) = 0.658.
2.3. Automatic Selection of Function Forms
To determine whether a linear or quadratic functional form should be adopted to assess the association between each predictor (acetic acid, propionic acid, A:P, total VFA) and ADG, after controlling for covariates, linear and quadratic models were fitted separately for each indicator (with the quadratic term included as a centered variable to reduce multicollinearity); multiple pieces of evidence were then synthesized to decide on the appropriate functional form: statistical significance of the quadratic coefficient (P < 0.01); the incremental heterogeneity explanation proportion of the quadratic model relative to the linear model under either the inverse-variance framework (Figure 1) or the mixed linear framework (Figure 2), or the relative increase in the marginal R2 (≥10%); and the degree of improvement in the Akaike Information Criterion (AIC) (a decrease ≥4). The quadratic form was selected when it outperformed the linear form for an indicator; otherwise, the linear form was retained to avoid over-parameterization and extrapolation beyond observed data ranges. The results showed that, under the inverse-variance framework, the functional forms for A:P and total VFA were identified as quadratic, while those for acetic acid and propionic acid were linear; under the mixed linear framework, all indicators exhibited linear relationships.
2.4. Species Interaction Test
To explore the sources of heterogeneity further, the primary analysis was extended by fitting an expanded multilevel meta-regression model with average daily gain (ADG) as the outcome and species, dry matter intake (DMI), initial body weight (IBW), dietary crude protein (CP), and neutral detergent fiber (NDF) as covariates. To separate within-study from between-study sources of treatment effects, the treatment-level covariate (X) was decomposed into a within-study component (Xwithin—the deviation of each treatment group's X from the mean X of its own study) and a between-study component (Xbetween—the mean X across all studies); main effects and their species interactions were estimated separately for the two components. Weighting (inverse variance) and the random structure (studies as random intercepts, effect ID nested within each study) matched the primary analysis. For the interaction term, slope differences between sheep and goats were tested at both the within-study and between-study levels, with multiple interaction tests corrected using the BH method. When an interaction was not significant, a contrast approach estimated within-study and between-study slopes for each species with their 95% confidence intervals (CIs), and the overlap ratio among the ranges of original X, within-study X, and between-study X quantified the degree of data overlap between the two species.
2.5. Leave-One-Sample Cross-Validation (LOSO)
For each predictor, a baseline model (DMI + IBW + CP + NDF; species also included in the full sample) and a baseline-plus-indicator model were estimated. Leave-one-out cross-validation was then applied: each iteration omitted one study, refit the model to the remaining studies, and predicted all treatment groups of the omitted study. Evaluation proceeded along three lines: overall population prediction (sheep and goats), a sheep-specific equation, and a goat-specific equation. The cross-validation R² (CV-R²), the change in CV-R² after adding the indicator (ΔCV-R²), the RMSE, and its percentage reduction were computed. Paired bootstrap resampling (1000 repetitions) with the study as the sampling unit supplied 95% confidence intervals (CI) for the reductions in ΔCV-R² and RMSE, taken as the 2.5% and 97.5% percentiles. A 95% CI for ΔCV-R² that excludes zero together with a lower RMSE denotes clear incremental predictive value; if only the point estimate improves while the 95% CI crosses zero, predictive performance improves but the increment remains uncertain.
2.6. Sensitivity Analysis
The SE Monte Carlo perturbation approach drew 500 independent random values for the standard errors of the predictors, DMI, and IBW under a normality assumption, re-estimated the interaction model each time, and reported whether the perturbed percentile intervals excluded zero and whether the signs matched the primary findings. The full dataset and the complete-data subset were compared by repeatedly fitting the primary model to the entire dataset with the data-based approach, checking whether the direction, significance, and incremental R² stayed qualitatively unchanged. Robustness was further assessed by comparing coefficients, P-values, and signs across four model variants: inverse variance weighting, a model with only study-level random effects, precision truncation (95th percentile), and the unweighted mixed-effects model. Publication bias was appraised with a funnel plot combined with Egger's linear regression test, in which standardized effect sizes were regressed on the ADG standard errors of the studies to test whether the intercept deviated from zero. Egger's test P-values for all four indicators were < 0.001, hinting at possible small-sample or publication bias; association magnitudes may accordingly be inflated, and the results should be interpreted with this caveat (see Supplementary Material S1). Individual study risk of bias was not formally assessed with a dedicated tool (e.g., ROBINS-I); instead, reporting bias was evaluated via funnel plots and Egger’s test, and the robustness of inferences was examined through multiple sensitivity analyses (Section 2.6). The review protocol was not registered in PROSPERO.
2.7. Statistical Software, Significance Definition, and Data Availability
All analyses were performed in R (version 4.5.1). Multilevel meta-regression models were fitted with the rma.mv function of the metafor package (version 4.6.0); linear mixed models (LMMs) were fitted with the nlme package (version 3.1-166) and the lme4 package (version 1.1-35.5); data management and variable transformations relied mainly on the dplyr package (version 1.1.4). The significance level was set at α = 0.05; the association between the four VFA indicators and ADG was treated as a pre-specified primary hypothesis; P-values were used to assess the robustness of the main effects; and multiple comparisons for species interactions were corrected with the BH method. Analysis scripts, diagnostic plots, and all intermediate results are provided in Appendix A and Supplementary Material S1.
3. Results
3.1. Sample Characteristics
The complete data sample comprised 83 studies and 283 treatment groups (46 studies with 157 treatment groups in sheep and 37 studies with 126 treatment groups in goats); the total VFA dataset included 82 studies and 279 treatment groups. The baseline characteristics and literature sources of the included studies are presented in Table 1A. Within the complete data sample, the mean ADG was 0.170 ± 0.081 (SD) kg/d, the mean acetic acid was 48.30 ± 22.70 mmol/L, the mean propionic acid was 17.95 ± 9.83 mmol/L, the mean A:P was 3.06 ± 1.15, and the mean total VFA was 77.27 ± 36.77 mmol/L; the mean ADG values were 0.213 kg/d for sheep and 0.117 kg/d for goats. The means, standard deviations, and ranges of all variables are provided in Table 1B. A parallel analysis using feed conversion rate (FCR, i.e., feed intake-to-gain ratio) as a secondary endpoint is available in Supplementary Materials S2–S5.
3.2. The Correlation Between Acetic Acid and ADG
Acetic acid showed a significant positive association with ADG (Table 2A: β = 0.00088; 95% CI: 0.00031–0.00144; cluster-robust P = 0.003; total model heterogeneity explained = 0.583), and this relationship was also significant in the mixed linear framework (Table 2B: β = 0.00070; 95% CI: 0.00034–0.00106; P < 0.001; marginal R² = 0.610). The incremental heterogeneity explained by acetic acid in Table 2A was 0.017, the smallest among the four indicators. At the species level, sheep showed significant associations in both frameworks (Table 2A: β = 0.00098; robust P = 0.013; Table 2B: β = 0.00066; P = 0.004), whereas goats did not in either (Table 2A: β = 0.00052; robust P = 0.205; Table 2B: β = 0.00063; P = 0.065). See Figure 1 and Figure 2.
3.3. Association Between Propionic Acid and ADG
Propionic acid showed a significant positive correlation with ADG (Table 2A: β = 0.00188, 95% CI: 0.00095–0.00280; cluster-robust P < 0.001; overall model heterogeneity explanation proportion = 0.621); the mixed linear framework was also significant (Table 2B: β = 0.00213, 95% CI: 0.00139–0.00287, P < 0.001; marginal R² = 0.637). In Table 2A, the incremental heterogeneity explanation proportion for propionic acid was 0.107, the highest among the four indicators. Within the species subgroup, both frameworks for goat propionic acid yielded significant results (Table 2B: β = 0.00279, P < 0.001; Table 2A: β = 0.00227, robust P < 0.001); for sheep propionic acid, the mixed linear framework yielded a significant result (Table 2B: β = 0.00157, P = 0.002), while the inverse variance framework also yielded a significant result (Table 2A: β = 0.00148, robust P = 0.035).
3.4. The Relationship Between A:P and ADG
The evidence strength for A:P is inconsistent across the two frameworks: in the inverse-variance framework, it does not achieve cluster-robust significance (Table 2A: β = –0.00820; 95% CI: –0.01720 to 0.00080; robust P = 0.074), whereas in the mixed linear framework, it exhibits weak negative significance (Table 2B: β = –0.00769; 95% CI: –0.01384 to –0.00153; P = 0.015). The incremental heterogeneity explanation proportion is 0.071 (Table 2A). The contrast—where concentration-based indicators show a positive association while proportion-based indicators show a negative association—is consistent with the exploratory findings from the between-study decomposition analysis; however, the inconsistency in significance across the two frameworks suggests that the A:P result is not robust and should therefore not be used as an independent predictive indicator.
3.5. Correlation Between Total VFA and ADG
The total VFA and ADG exhibited a significant positive correlation (Table 2A: β = 0.00088, 95% CI: 0.00042–0.00135; cluster-robust P < 0.001; the incremental heterogeneity explanation proportion for total VFA reached 0.083). The mixed linear framework also showed a significant result (Table 2B: β = 0.00127, 95% CI: 0.00080–0.00174, P < 0.001; marginal R² = 0.642). At the species level, both frameworks yielded significant results for sheep (Table 2A: β = 0.00108, robust P = 0.002; Table 2B: β = 0.00157, P < 0.001) and for goats (Table 2A: β = 0.00055, robust P = 0.033; Table 2B: β = 0.00148, P = 0.039). For details, see Figure 1 and Figure 2.
3.6. Species Interaction Test-
In the extended model, neither the Species × X (Within) nor the Species × X (Between) interaction term reached statistical significance (P > 0.05). Species-specific slopes showed that for sheep acetic acid both the intra-study and inter-study slopes were significant (P = 0.005 and P = 0.032), whereas for goat acetic acid neither slope was significant. For goat propionic acid both the intra-study and inter-study slopes were significant (P = 0.001 and P = 0.031), while for sheep propionic acid only the inter-study slope was significant (P = 0.008). These findings describe a point-estimate pattern in which acetic acid is the more sensitive indicator for sheep and propionic acid for goats; nevertheless, the differences were not significant enough to confirm an interaction effect.
3.7. Incremental Predictive Value of Leave-One-Study-Out Cross-Validation (Table 3)
When the overall equation was used for prediction, adding propionic acid lifted CV-R² from 0.393 to 0.518 (ΔCV-R² = 0.124; 95% CI: 0.012–0.326; excludes zero) and cut RMSE by 10.84%, so both metrics point to clear incremental predictive value. Total VFA (ΔCV-R² = 0.070) and A:P (ΔCV-R² = 0.073) improved the point estimates, but because their 95% CIs crossed zero the improvements were not statistically significant (Figure 3). For sheep, propionic acid raised CV-R² to 0.485 (ΔCV-R² = 0.056; 95% CI crosses zero) and lowered RMSE by 5.03%, an improvement whose incremental benefit is still uncertain. For goats, the same addition moved CV-R² from −0.599 to −0.157 (ΔCV-R² = 0.441; 95% CI: 0.035–1.337; excludes zero) and reduced RMSE by 14.92%, which we read as clear incremental predictive value even though the goat baseline was inherently weak. Within both species equations, point estimates for each indicator were best when propionic acid was included (ΔCV-R² of 0.046 and 0.204, respectively), yet both 95% CIs crossed zero; these results should be treated as exploratory. Figure 4 plots observed against predicted values after propionic acid was added to the overall equation.

Table 3.
Incremental predictive value of leave-one-study-out (LOSO) cross-validation.
| Validation Scenario | Number of groups | Baseline CV-R² | propionic acid-model CV-R² | ΔCV-R² (propionic acid vs. baseline, 95% CI) | RMSE reduction (%) | propionic acid P |
|---|---|---|---|---|---|---|
| Overall→Overall | 279 | 0.393 | 0.518 | 0.124(0.012,0.326) | 10.84 | < 0.001 |
| Overall→Sheep | 153 | 0.429 | 0.485 | 0.056(−0.056,0.165) | 5.03 | < 0.001 |
| Overall→Goat | 126 | −0.599 | −0.157 | 0.441(0.035,1.337) | 14.92 | < 0.001 |
| Sheep→Sheep | 153 | 0.384 | 0.431 | 0.046(−0.052,0.160) | 3.82 | < 0.001 |
| Goat→Goat | 126 | −0.250 | −0.047 | 0.204(−0.061,0.547) | 8.51 | < 0.001 |
In the column headings, A→B denotes the model trained on dataset A and validated on dataset B; the baseline model contained DMI, IBW, CP and NDF (plus species for the total sample); LOSO provides internal validation.;ΔCV-R² = CV-R² (with propionic acid) − baseline CV-R² (without propionic acid); the 95% CI was derived from study-level paired bootstrap (1,000 resamples; 2.5% and 97.5% percentiles); bold indicates that the 95% CI excludes 0.;N denotes the number of treatment groups predicted in each validation direction; P for propionic acid is the P-value of the propionic acid coefficient in the LMM that included propionic acid.;A negative baseline CV-R² indicates that the baseline model predicted worse than simply using the overall mean, reflecting the weak baseline predictive ability for goats.
3.8. Sensitivity Analysis
Comparing the complete-data and full-data results, the direction of effects was identical across all four indicators, and the qualitative significance conclusions were also consistent. The Monte Carlo perturbation test (500 replicates) and the multi-inference robustness check support the main conclusion; the propionic acid interaction and the predictive increment remained directionally stable under SE perturbations. When only the two inference variants—the study-level random-effects model and the 95th-percentile precision ceiling—were considered, the directions and significance of acetic acid, propionic acid, and total VFA were largely consistent; however, neither acetic acid nor propionic acid was statistically significant (see Supplementary Material S1, Sensitivity Table).
4. Discussion
We combined 83 studies and 283 treatment groups under two complementary frameworks—inverse-variance-weighted meta-regression and multilevel mixed-effects models—to ask how total VFA, acetic acid, propionic acid, and the A:P ratio relate to average daily gain (ADG) in growing sheep and goats, and whether the VFA profile adds predictive value on top of conventional covariates. The findings separate association from prediction rather cleanly. On the association side, acetic acid, propionic acid, and total VFA were positively related to ADG in both frameworks, whereas A:P was inconsistent. On the prediction side, only propionic acid produced a clear incremental cross-study gain (ΔCV-R² = 0.124; RMSE reduced by 10.84%), and the species-specific point estimates never translated into significant interaction effects. The rest of the discussion develops these results at three levels—mechanism, species, and application.
4.1. Principal Analysis Results and Mechanisms
4.1.1. Separation of Correlation Strength and Predictive Increment
Across both statistical frameworks, total VFA, acetic acid, and propionic acid were significantly and positively correlated with ADG, and after adjustment for DMI, IBW, CP, NDF, and species the direction of the effects stayed consistent with similar magnitudes (Table 2A and Table 2B). This cross-method agreement is a first sign of reproducibility. For the three indicators, the full model explained 0.625, 0.583, and 0.621 of the between-study heterogeneity, respectively. Turning to incrementality, the VFA profile added only modest heterogeneity beyond conventional covariates, though all values were positive: 0.017 for acetic acid, 0.071 for A:P, 0.107 for propionic acid, and 0.083 for total VFA, with propionic acid again the largest. LOSO reinforced this picture, showing the clearest cross-study predictive gain for propionic acid (ΔCV-R² = 0.124; 95% CI: 0.012–0.326; RMSE reduced by 10.84%). In short, propionic acid outperformed the other variables on robust association, incremental R², and external prediction. The concentration-based indicators (acetic acid, total VFA), by contrast, tracked the scale–mass dimension that covaries with feed intake, body size, and diet composition, so their incremental explanatory power was limited. Predictive value should therefore be judged by incremental R² or external validation rather than by single-variable correlations, consistent with earlier studies that found VFA relate to growth indicators yet add little predictive gain. For A:P, evidence strength differed between the two frameworks and the point estimates were small, making the result unstable. The functional form also diverged between frameworks (quadratic in Table 2A; linear in Table 2B), so a linear model is the most straightforward and appropriate choice in both cases. Its interpretation and application should be confined to the range of the observed data.
4.1.2. Mechanistic Reasoning Behind the Relationship Between Fermentation Products and Tissue Growth
For the statistical structure described above to carry meaning, every link in the chain must rest on established biochemical and physiological evidence rather than on mere correlation with phenotypes. The framework therefore runs through four interconnected processes: microbial production, epithelial absorption, portal vein and hepatic metabolism, and endocrine and tissue synthesis. Production comes first: fermentation kinetics set the metabolic profile, with each sugar molecule degraded into acetic, propionic, and butyric acids in characteristic proportions, and the propionic acid pathway competing with methanogenesis for hydrogen (Janssen, 2010; Morgavi et al., 2010). Starch-based diets favor taxa such as Succinivibrionaceae and Prevotella, which raises propionic acid levels (Lin et al., 2023; Krone et al., 2024); elevated propionic acid is at once an ecological outcome of intense fermentation and a key precursor for hepatic gluconeogenesis. Absorption comes next. VFA cross the epithelium by passive diffusion or through transporters such as MCT1/MCT4, NHE, and NBCe1; most butyric acid is oxidized in the epithelium to β-hydroxybutyrate, whereas propionic and acetic acids reach the portal vein in relatively higher proportions (Aschenbach et al., 2011; Rathert-Williams et al., 2023). Epithelial morphology and transporter expression adapt to fermentation load as well (Penner et al., 2011; Na and Guan, 2022). One point deserves emphasis: rumen fluid concentration is not the same as substrate flux reaching the liver. Absolute concentration depends heavily on rumen fluid volume, saliva secretion, and sampling time, while the molar ratio is largely insensitive to dilution—an anatomical reason why propionic acid prediction is more robust and why concentration-based indicators are more exposed to measurement noise (Fortina et al., 2022). Metabolically, propionic acid is converted by propionyl-CoA carboxylase (PCC) to methylmalonyl-CoA and then isomerized to succinyl-CoA by methylmalonyl-CoA mutase (MCM) with vitamin B12 as coenzyme; succinyl-CoA is later turned into oxaloacetate through the reverse tricarboxylic acid cycle (rather than by direct catalysis via PCK1/PEPCK), moved into the cytosol by the mitochondrial malate/aspartate shuttle, and finally converted by phosphoenolpyruvate carboxykinase (PCK1) to phosphoenolpyruvate (PEP), which enters gluconeogenesis to form glucose and supplies 60%–74% of the carbon skeleton (Aschenbach et al., 2010). The same pathway upregulates hepatic gluconeogenic enzymes and has insulinotropic effects (Wang et al., 2023; Pang et al., 2023). Chen et al. (2026) showed in a lamb gavage experiment that higher ruminal propionic acid upregulates hepatic PC and G6PC and boosts hepatic glucose output (Chen et al., 2026); the glucose–insulin–IGF-1 axis then drives nitrogen deposition and protein synthesis. Because higher propionic acid means more glucose precursors, propionic acid sits at a metabolic hub in the positive causal chain. Feedback closes the loop: propionic acid oxidation also acts as a satiety signal (hepatic oxidation theory), so the ADG effect of propionic acid operates within a homeostatic loop of energy supply and appetite regulation, with the marginal effect flattening as concentration rises rather than growing without bound (Allen, 2014); very high fermentation loads may even trigger subacute ruminal acidosis that lowers feed intake and growth (Golder and Lean, 2024; Elmhadi et al., 2022). Table 2A shows no significant quadratic term for propionic acid, so within the observed range the relationship looks predominantly linear. Still, the mechanisms above hint that endogenous effects of very high propionic acid may decelerate. This logic explains both the strong concentration-based correlations we observed and the prediction of stable structural configurations, the stability being owed to the measurement configuration rather than to the strength of the biological associations.
4.2. Species Differences and Cross-Study Predictive Value
The species-specific slopes follow a point-estimation pattern in which acetic acid is the more sensitive indicator for sheep and propionic acid for goats, yet none of the Species × X interaction terms reached statistical significance. We therefore treat these results as exploratory rather than fitting separate models per species. Variation in microbial community structure among sheep breeds may also weaken the stability of the species-specific signal (Xiang et al., 2022). The pattern fits with the host's dual control over fermentation dynamics: goats graze more often, have a relatively larger rumen volume, and show more flexible retention times, so the effective fermentation intensity and profile differ between the species even on identical diets (Krone et al., 2024). The host genome is a major determinant of the core microbiota and markedly shapes the rumen microbial community (Lin et al., 2023; Krone et al., 2024; Dai et al., 2021), and the microbial response to dietary change is fairly host-specific (Henderson et al., 2015; Weimer, 2015). The non-significant interaction is consistent with Salah et al. (2015), who reported that intake responses in sheep, goats, and cattle run parallel but differ in intercepts, systematic between-species differences appearing as baseline rather than slope differences (Salah et al., 2015). A unified framework with species-level effects is therefore preferable to separate models per species. On a point-estimation basis, LOSO indicated that propionic acid was the optimal additive component in every predictive scenario: the gain in overall prediction was clear (ΔCV-R² = 0.124; 95% CI excludes zero; RMSE reduced by 10.84%), and the improvement was largest for goats (ΔCV-R² = 0.441; RMSE reduced by 14.92%) despite a weak baseline; in all other scenarios the 95% CI crossed zero. It is worth noting that the incremental gain was greatest for targets with weaker baselines: when conventional covariates fail to capture the underlying pattern, configuration indicators may carry more marginal value, and such an inverse relationship between predicted gain and baseline performance is visible only through externalized leave-one-out cross-validation.
4.3. Comparison with Previous Studies and Robustness
A number of independent findings support the positive correlation we observed between propionic acid and ADG. Lambs given calcium propionate grew better in a meta-analysis (Orzuna-Orzuna and Lara-Bueno, 2023); goats with high daily weight gain carried higher ruminal propionic acid levels (Chen et al., 2024); high-yielding Hu sheep had elevated ruminal propionate (Jia et al., 2026); yeast-based supplements that raised ruminal propionate and total VFA improved ADG in goats (Ogbuewu and Mbajiorgu, 2023); post-weaning ADG in lambs was tied to ruminal microbiota composition (Yin et al., 2023); and an oral administration experiment confirmed that increased ruminal propionate upregulates key hepatic gluconeogenic enzymes (Chen et al., 2026). The reverse pattern was also observed: Velázquez-Cruz et al. (2024) found that low doses (10 g/kg DM) of calcium or sodium propionate failed to improve growth in fattening lambs (Velázquez-Cruz et al., 2024), matching our view that the effects depend on dose and physiological stage—the growth-promoting action of propionate is not unconditional, and the ADG response to propionic acid should be read as the net result of the fermentation–metabolism chain rather than of the additive alone. Earlier studies generally reported effects through correlation or regression P-values, while few provided incremental R², robust inference, and leave-one-out validation together. The present study addresses that gap by reporting the limited explanation of incremental heterogeneity transparently and by using LOSO to quantify the cross-study predictive benefit of propionic acid directly. Robustness checks support the same conclusions: the inverse-variance framework (Table 2A) and the mixed linear model framework (Table 2B) agreed on the significant positive correlation of acetic acid, propionic acid, and total VFA, and when the A:P direction was treated as non-robust, neither the complete-versus-full dataset comparison, nor the SE Monte Carlo simulation (500 replicates), nor the multi-simulation inference changed the direction or qualitative conclusion (Result 3.8), indicating that the primary findings do not hinge on specific data-cleaning or statistical decisions.
4.4. Application Significance and Limitations
The concentration- and composition-based approaches described above—designed to capture fermentation intensity and compositional stability in prediction—point to a differentiated application strategy. Total VFA and acetic acid work as monitoring indicators of fermentation intensity, suited to tracking fermentation scale in ration formulation and livestock management. Propionic acid emerges as the more robust compositional indicator across studies (overall equation prediction ΔCV-R² = 0.124, RMSE reduced by 10.84%), which agrees with evidence that propionic acid production improves feed efficiency and growth performance (Jia et al., 2026; Ogbuewu and Mbajiorgu, 2023; Yin et al., 2023; Chen et al., 2026). A:P, in turn, should not be used alone to predict growth performance. The Total–propionic acid model can serve as an empirical estimation model built on treatment-group means and checked through leave-one-out internal validation; it estimates mean performance across treatment groups under similar experimental conditions, but it does not support precise individual prediction and calls for independent external validation. Some design limitations should be kept in mind when interpreting these results. Because the findings rest on treatment-group means, publication bias is a real risk; funnel plots and Egger's regression flagged publication bias for all four indicators (Egger's P-values < 0.001; see Supplementary Material S1), which may have inflated the association strength. Heterogeneity arising from breed, feeding practices, sampling times, and VFA determination methods was not fully accounted for (Fortina et al., 2022), and the total VFA dataset covered only 279 treatment groups across 82 studies, with the functional-form choice sensitive to the analytic framework. Leave-one-out validation is internal validation, so the model's predictive power for baseline values in goats is relatively weak and does not justify developing or relying on goat-specific equations. Taken together, these limitations argue that the quantitative inferences should be read at the level of average effects across studies, with caution when extrapolating to individual animals.
5. Conclusion
This study used a multilevel modeling and cross-validation framework to assess how well the VFA profile predicts ADG. Total VFA, acetic acid, and propionic acid were robustly associated with ADG in both analytical frameworks; beyond conventional covariate adjustment, however, the VFA profile added only limited incremental explanatory power for inter-study heterogeneity. Among the components, propionic acid showed the highest incremental explanatory value and the most stable additional contribution at the cross-study prediction level, whereas A:P was neither robust nor independently informative.
Point estimates differed between sheep and goats, but the differences were not statistically significant at the interaction level. We therefore recommend incorporating propionic acid into a growth prediction model based on treatment-group means, with priority given to validation using independent external data; application of such models should be restricted to estimates derived from treatment-group means under conditionally similar settings. Future research should combine mechanistic validation with a richer set of host covariates to deepen our understanding of VFA-mediated growth regulation.
Author Contributions
Fuquan Yin contributed to conceptualization, funding acquisition, project administration, and writing-review & editing. Youtong Huang and Aihong Lao contributed to conceptualization, methodology, project administration, data filtering, data analysis, visualization and writing-original draft. Youtong Huang led the writing-review & editing and bears primary responsibility for the final manuscript. All authors reviewed and approved the final version of the manuscript.
Funding
This work was supported by the 2025 Guangdong Provincial Department of Education Key Projects for Supporting the “Hundred-Thousand-Ten Thousand Project” initiative.
Institutional Review Board Statement
This study is a systematic review and meta-analysis of published data; no new animal experiments were conducted, and therefore no ethical approval was required.
Data Availability Statement
The datasets analyzed during the current study are available from the corresponding author on reasonable request. Analysis scripts and intermediate results are provided in Appendix A and Supplementary Material S1.
Declaration of interest
This is to inform you that none of the authors have any actual or potential conflict of interest including any financial, personal or other relationships with other people or organizations.
Abbreviations
VFA, volatile fatty acid; A:P, the acetate-to-propionate ratio; ADG, average daily gain; DMI, dry matter intake; IBW, initial body weight; CP, crude protein; NDF, neutral detergent fiber.
References
- Allen, M.S. Drives and limits to feed intake in ruminants. Anim. Prod. Sci. 2014, 54(12), 1973–1985. [Google Scholar] [CrossRef]
- Aschenbach, J.R.; Kristensen, N.B.; Donkin, S.S. Gluconeogenesis in dairy cows: the secret of making sweet milk from sour dough. IUBMB Life 2010, 62(12), 869–877. [Google Scholar] [CrossRef] [PubMed]
- Aschenbach, J.R.; Penner, G.B.; Stumpff, F. Ruminant Nutrition Symposium: role of fermentation acid absorption in the regulation of ruminal pH. J. Anim. Sci. 2011, 89(4), 1092–1107. [Google Scholar] [CrossRef] [PubMed]
- Bergman, E.N. Energy contributions of volatile fatty acids from the gastrointestinal tract in various species. Physiol. Rev. 1990, 70(2), 567–590. [Google Scholar] [CrossRef] [PubMed]
- Chen, J.; Zhang, X.; Chang, X. Multi-omics analysis reveals the effects of host-rumen microbiota interactions on growth performance in a goat model. Front. Microbiol. 2024, 15, 1445223. [Google Scholar] [CrossRef] [PubMed]
- Chen, T.; Yu, S.; Li, K. Rumen microbiota inoculation indicates collaborative mechanisms enhancing propionate supply to alleviate weaning stress in lambs. Microbiome 2026, 14, 54. [Google Scholar] [CrossRef]
- Dai, Q.; Ma, J.; Cao, G. Comparative study of growth performance, nutrient digestibility, and ruminal and fecal bacterial community between yaks and cattle-yaks raised by stall-feeding. AMB Express 2021, 11, 98. [Google Scholar] [CrossRef]
- Elmhadi, M.E.; Ali, D.K.; Khogali, M.K. Subacute ruminal acidosis in dairy herds: microbiological and nutritional causes, consequences, and prevention strategies. Anim. Nutr. 2022, 10, 148–155. [Google Scholar] [CrossRef] [PubMed]
- Fortina, R.; Glorio Patrucco, S.; Barbera, S. Rumen fluid from slaughtered animals: a standardized procedure for sampling, storage and use in digestibility trials. Methods Protoc. 2022, 5(4), 59. [Google Scholar] [CrossRef] [PubMed]
- Golder, H.M.; Lean, I.J. Invited review: ruminal acidosis and its definition—a critical review. J. Dairy Sci. 2024, 107(12), 10066–10098. [Google Scholar] [CrossRef]
- Henderson, G.; Cox, F.; Ganesh, S. Rumen microbial community composition varies with diet and host, but a core microbiome is found across a wide geographical range. Sci. Rep. 2015, 5, 14567. [Google Scholar] [CrossRef] [PubMed]
- Janssen, P.H. Influence of hydrogen on rumen methane formation and fermentation balances through microbial growth kinetics and fermentation thermodynamics. Anim. Feed Sci. Technol. 2010, 160(1-2), 1–22. [Google Scholar] [CrossRef]
- Jia, X.; Zhang, Y.; Tian, B. Integrative analysis of rumen microbiota and host multi-organ interactions underlying feed conversion efficiency in Hu sheep. J. Anim. Sci. Biotechnol. 2026, 17, 19. [Google Scholar] [CrossRef]
- Lin, X.; Ju, L.; Cheng, Q. Comparison of growth performance and rumen metabolic pathways in sheep and goats under the same feeding pattern. Front. Vet. Sci. 2023, 10, 1013252. [Google Scholar] [CrossRef] [PubMed]
- Morgavi, D.P.; Forano, E.; Popova, M. Microbial community and methanogenesis in ruminants. Animal 2010, 4(7), 1024–1036. [Google Scholar] [CrossRef] [PubMed]
- Na, S.W.; Guan, L.L. Understanding the role of rumen epithelial host-microbe interactions in cattle feed efficiency. Anim. Nutr. 2022, 10, 41–53. [Google Scholar] [CrossRef] [PubMed]
- National Research Council. Nutrient Requirements of Small Ruminants: Sheep, Goats, Cervids, and New World Camelids; National Academies Press: Washington, DC, 2007. [Google Scholar]
- Ogbuewu, I.P.; Mbajiorgu, C.A. Meta-analysis of Saccharomyces cerevisiae on enhancement of growth performance, rumen fermentation and haemato-biochemical characteristics of growing goats. Heliyon 2023, 9(3), e14178. [Google Scholar] [CrossRef] [PubMed]
- Orzuna-Orzuna, J.F.; Lara-Bueno, A. Growth performance and ruminal fermentation of lambs supplemented with calcium propionate: a meta-analysis. Small Rumin. Res. 2023, 226, 107032. [Google Scholar] [CrossRef]
- Page, M.J.; McKenzie, J.E.; Bossuyt, P.M. The PRISMA 2020 statement: an updated guideline for reporting systematic reviews. BMJ 2021, 372, n71. [Google Scholar] [CrossRef] [PubMed]
- Pang, R.; Xiao, X.; Mao, T. The molecular mechanism of propionate-regulating gluconeogenesis in bovine hepatocytes. Anim. Biosci. 2023, 36(11), 1693–1699. [Google Scholar] [CrossRef]
- Penner, G.B.; Steele, M.A.; Aschenbach, J.R. Molecular adaptation of ruminal epithelia to highly fermentable diets. J. Anim. Sci. 2011, 89(4), 1108–1119. [Google Scholar] [CrossRef] [PubMed]
- Rathert-Williams, A.R.; McConnell, H.L.; Salisbury, C.M. Effects of adding ruminal propionate on dry matter intake and glucose metabolism in steers fed a finishing ration. J. Anim. Sci. 2023, 101, skad072. [Google Scholar] [CrossRef] [PubMed]
- Russell, J.B.; Hespell, R.B. Microbial rumen fermentation. J. Dairy Sci. 1981, 64(6), 1153–1169. [Google Scholar] [CrossRef]
- Salah, N.; Sauvant, D.; Archimède, H. Response of growing ruminants to diet in warm climates: a meta-analysis. Animal 2015, 9(5), 822–830. [Google Scholar] [CrossRef] [PubMed]
- Tempelman, R.J. Invited review: a review of some commonly used meta-analysis methods in dairy science research. J. Dairy Sci. 2025, 108(3), 2115–2132. [Google Scholar] [CrossRef]
- Velázquez-Cruz, L.A.; Hernández-García, P.A.; Mendoza-Martínez, G.D. Growth performance, rumen fermentation, and meat quality of finishing lambs supplemented with calcium propionate or sodium propionate. Vet. Sci. 2024, 11(12), 604. [Google Scholar] [CrossRef] [PubMed]
- Wang, G.Y.; Qin, S.L.; Zheng, Y.N. Propionate promotes gluconeogenesis by regulating mechanistic target of rapamycin (mTOR) pathway in calf hepatocytes. Anim. Nutr. 2023, 15, 88–98. [Google Scholar] [CrossRef] [PubMed]
- Weimer, P.J. Redundancy, resilience, and host specificity of the ruminal microbiota: implications for engineering improved ruminal fermentations. Front. Microbiol. 2015, 6, 296. [Google Scholar] [CrossRef] [PubMed]
- Xiang, J.; Zhong, L.; Luo, H. A comparative analysis of carcass and meat traits, and rumen bacteria between Chinese Mongolian sheep and Dorper × Chinese Mongolian crossbred sheep. Animal 2022, 16, 100503. [Google Scholar] [CrossRef] [PubMed]
- Yin, X.; Duan, C.; Ji, S. Average daily gain in lambs weaned at 60 days of age is correlated with rumen and rectum microbiota. Microorganisms 2023, 11(2), 348. [Google Scholar] [CrossRef] [PubMed]
Figure 1.
Fit of the predictive factors on ADG in inverse-variance-weighted multilayer meta-regression.
Figure 1.
Fit of the predictive factors on ADG in inverse-variance-weighted multilayer meta-regression.
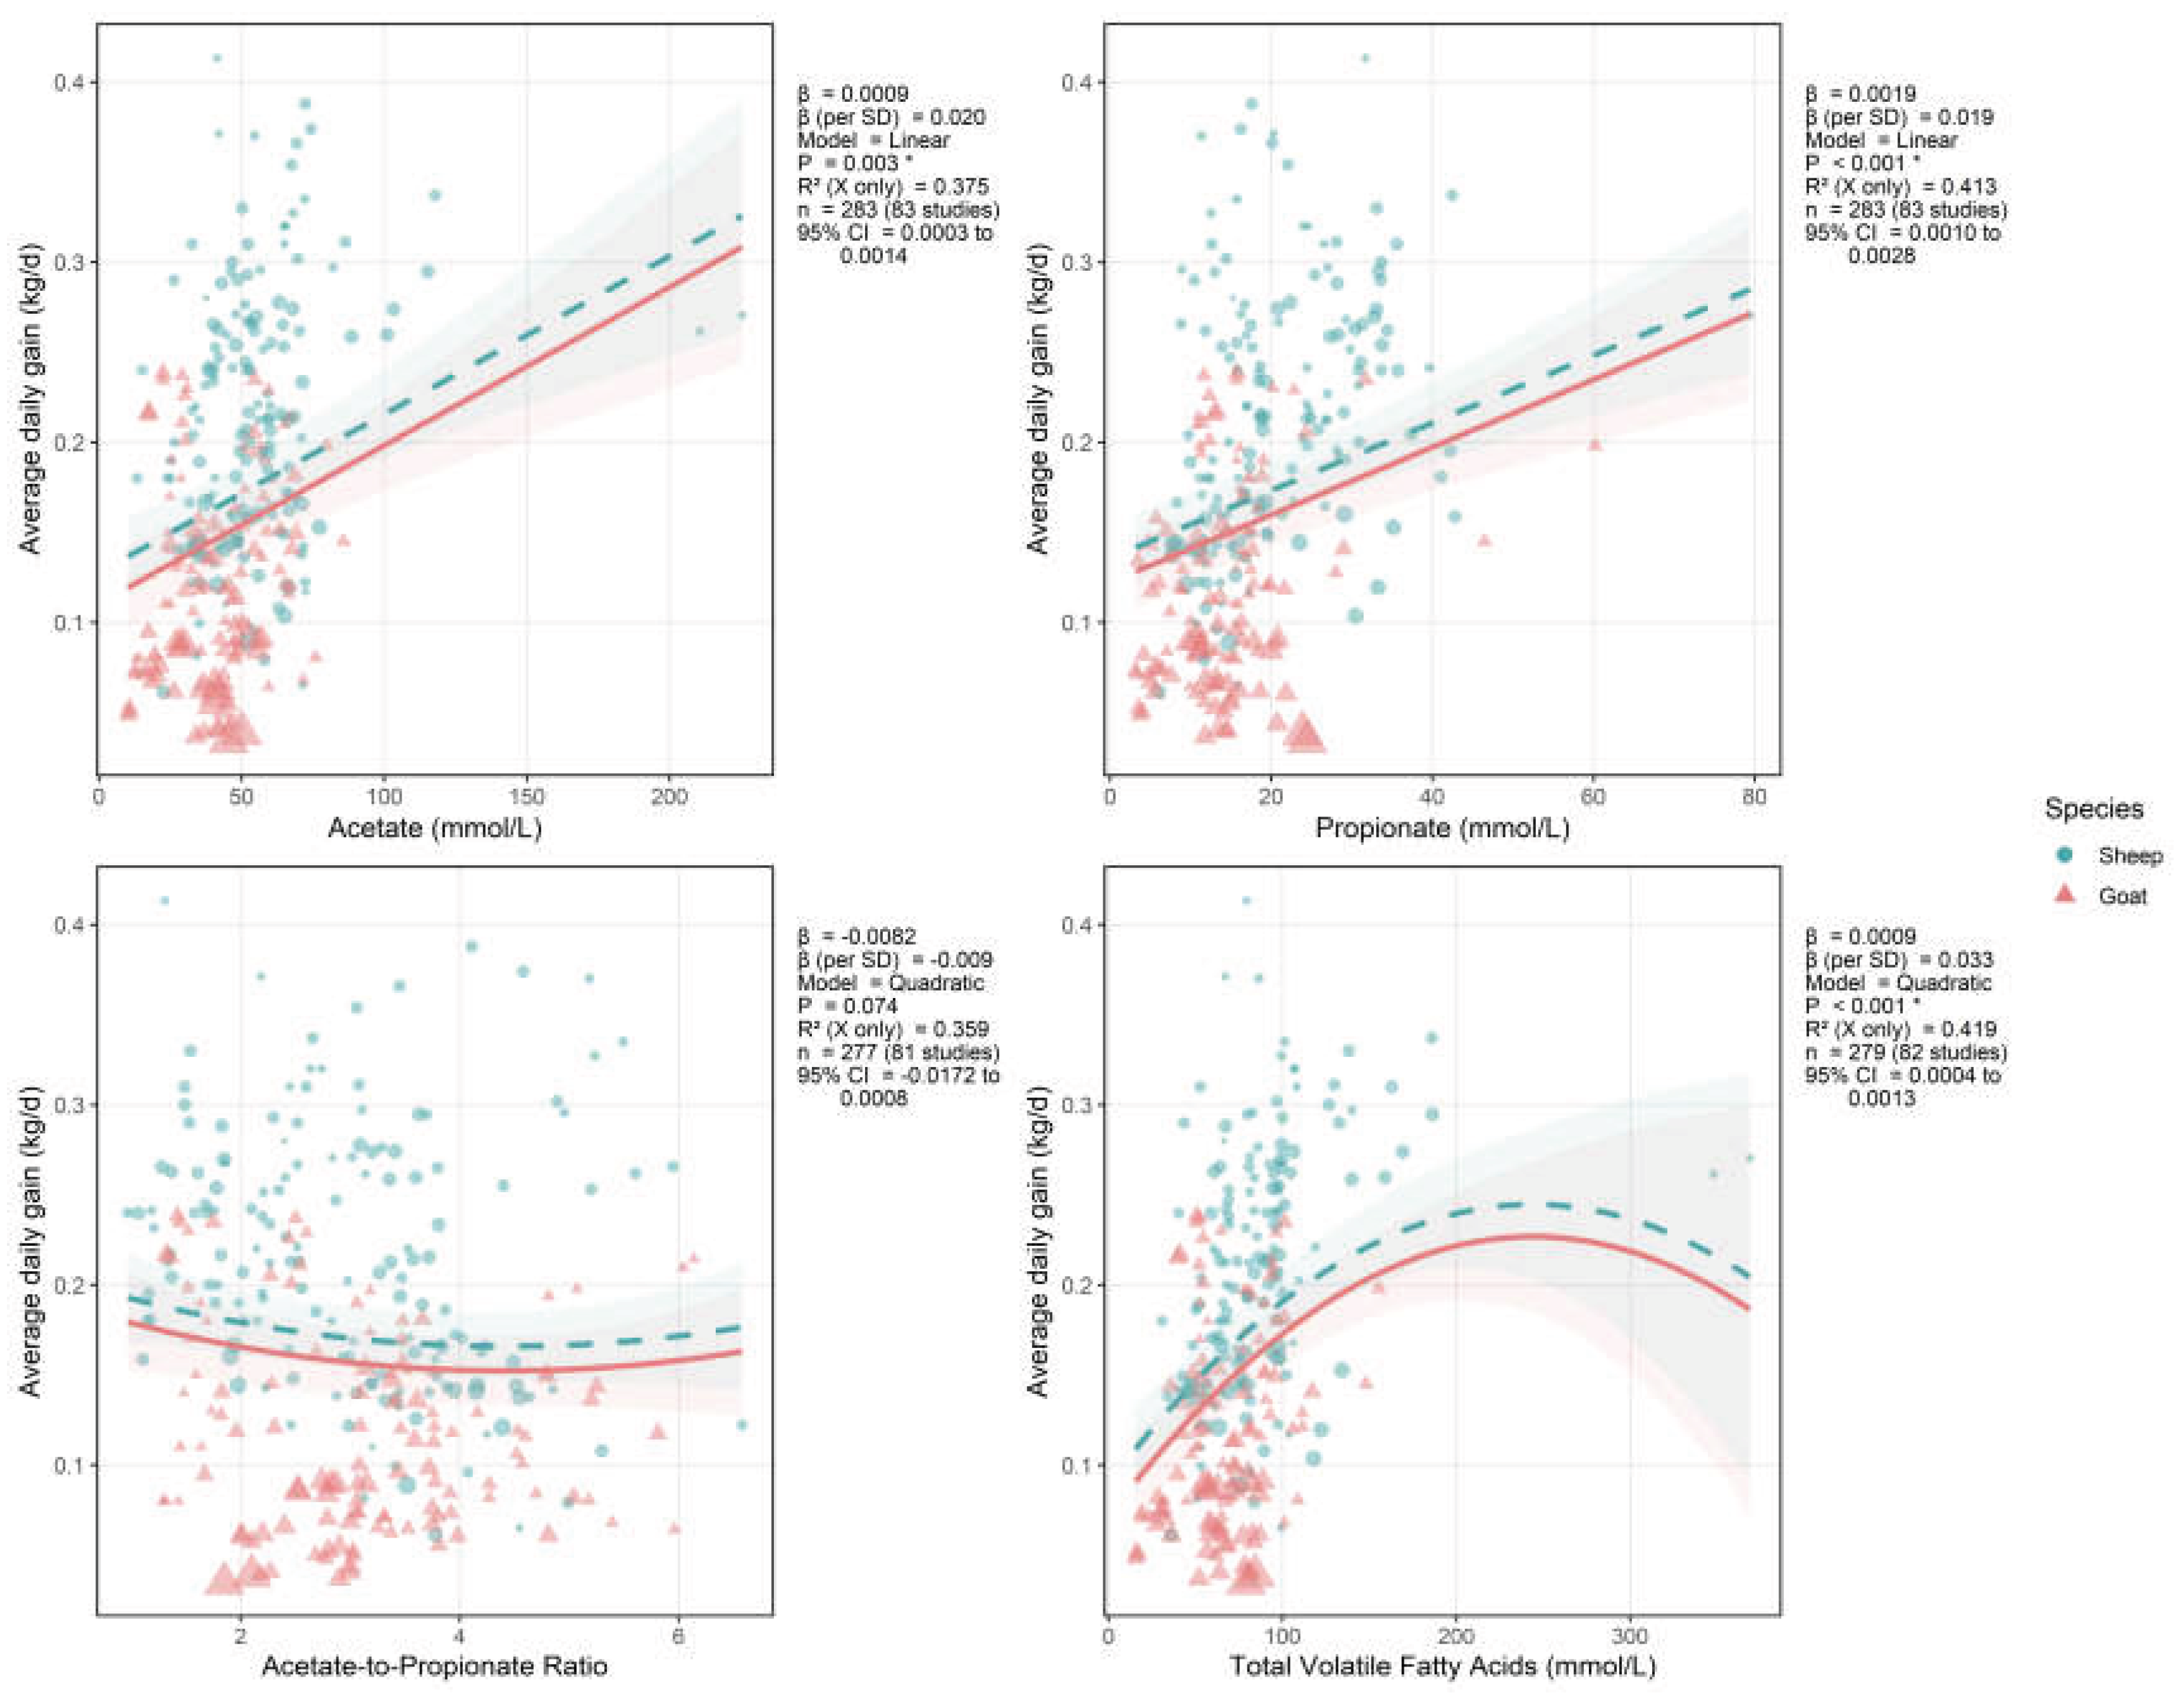
Figure 2.
Fit of the predictive factors on ADG in an unweighted mixed linear model.
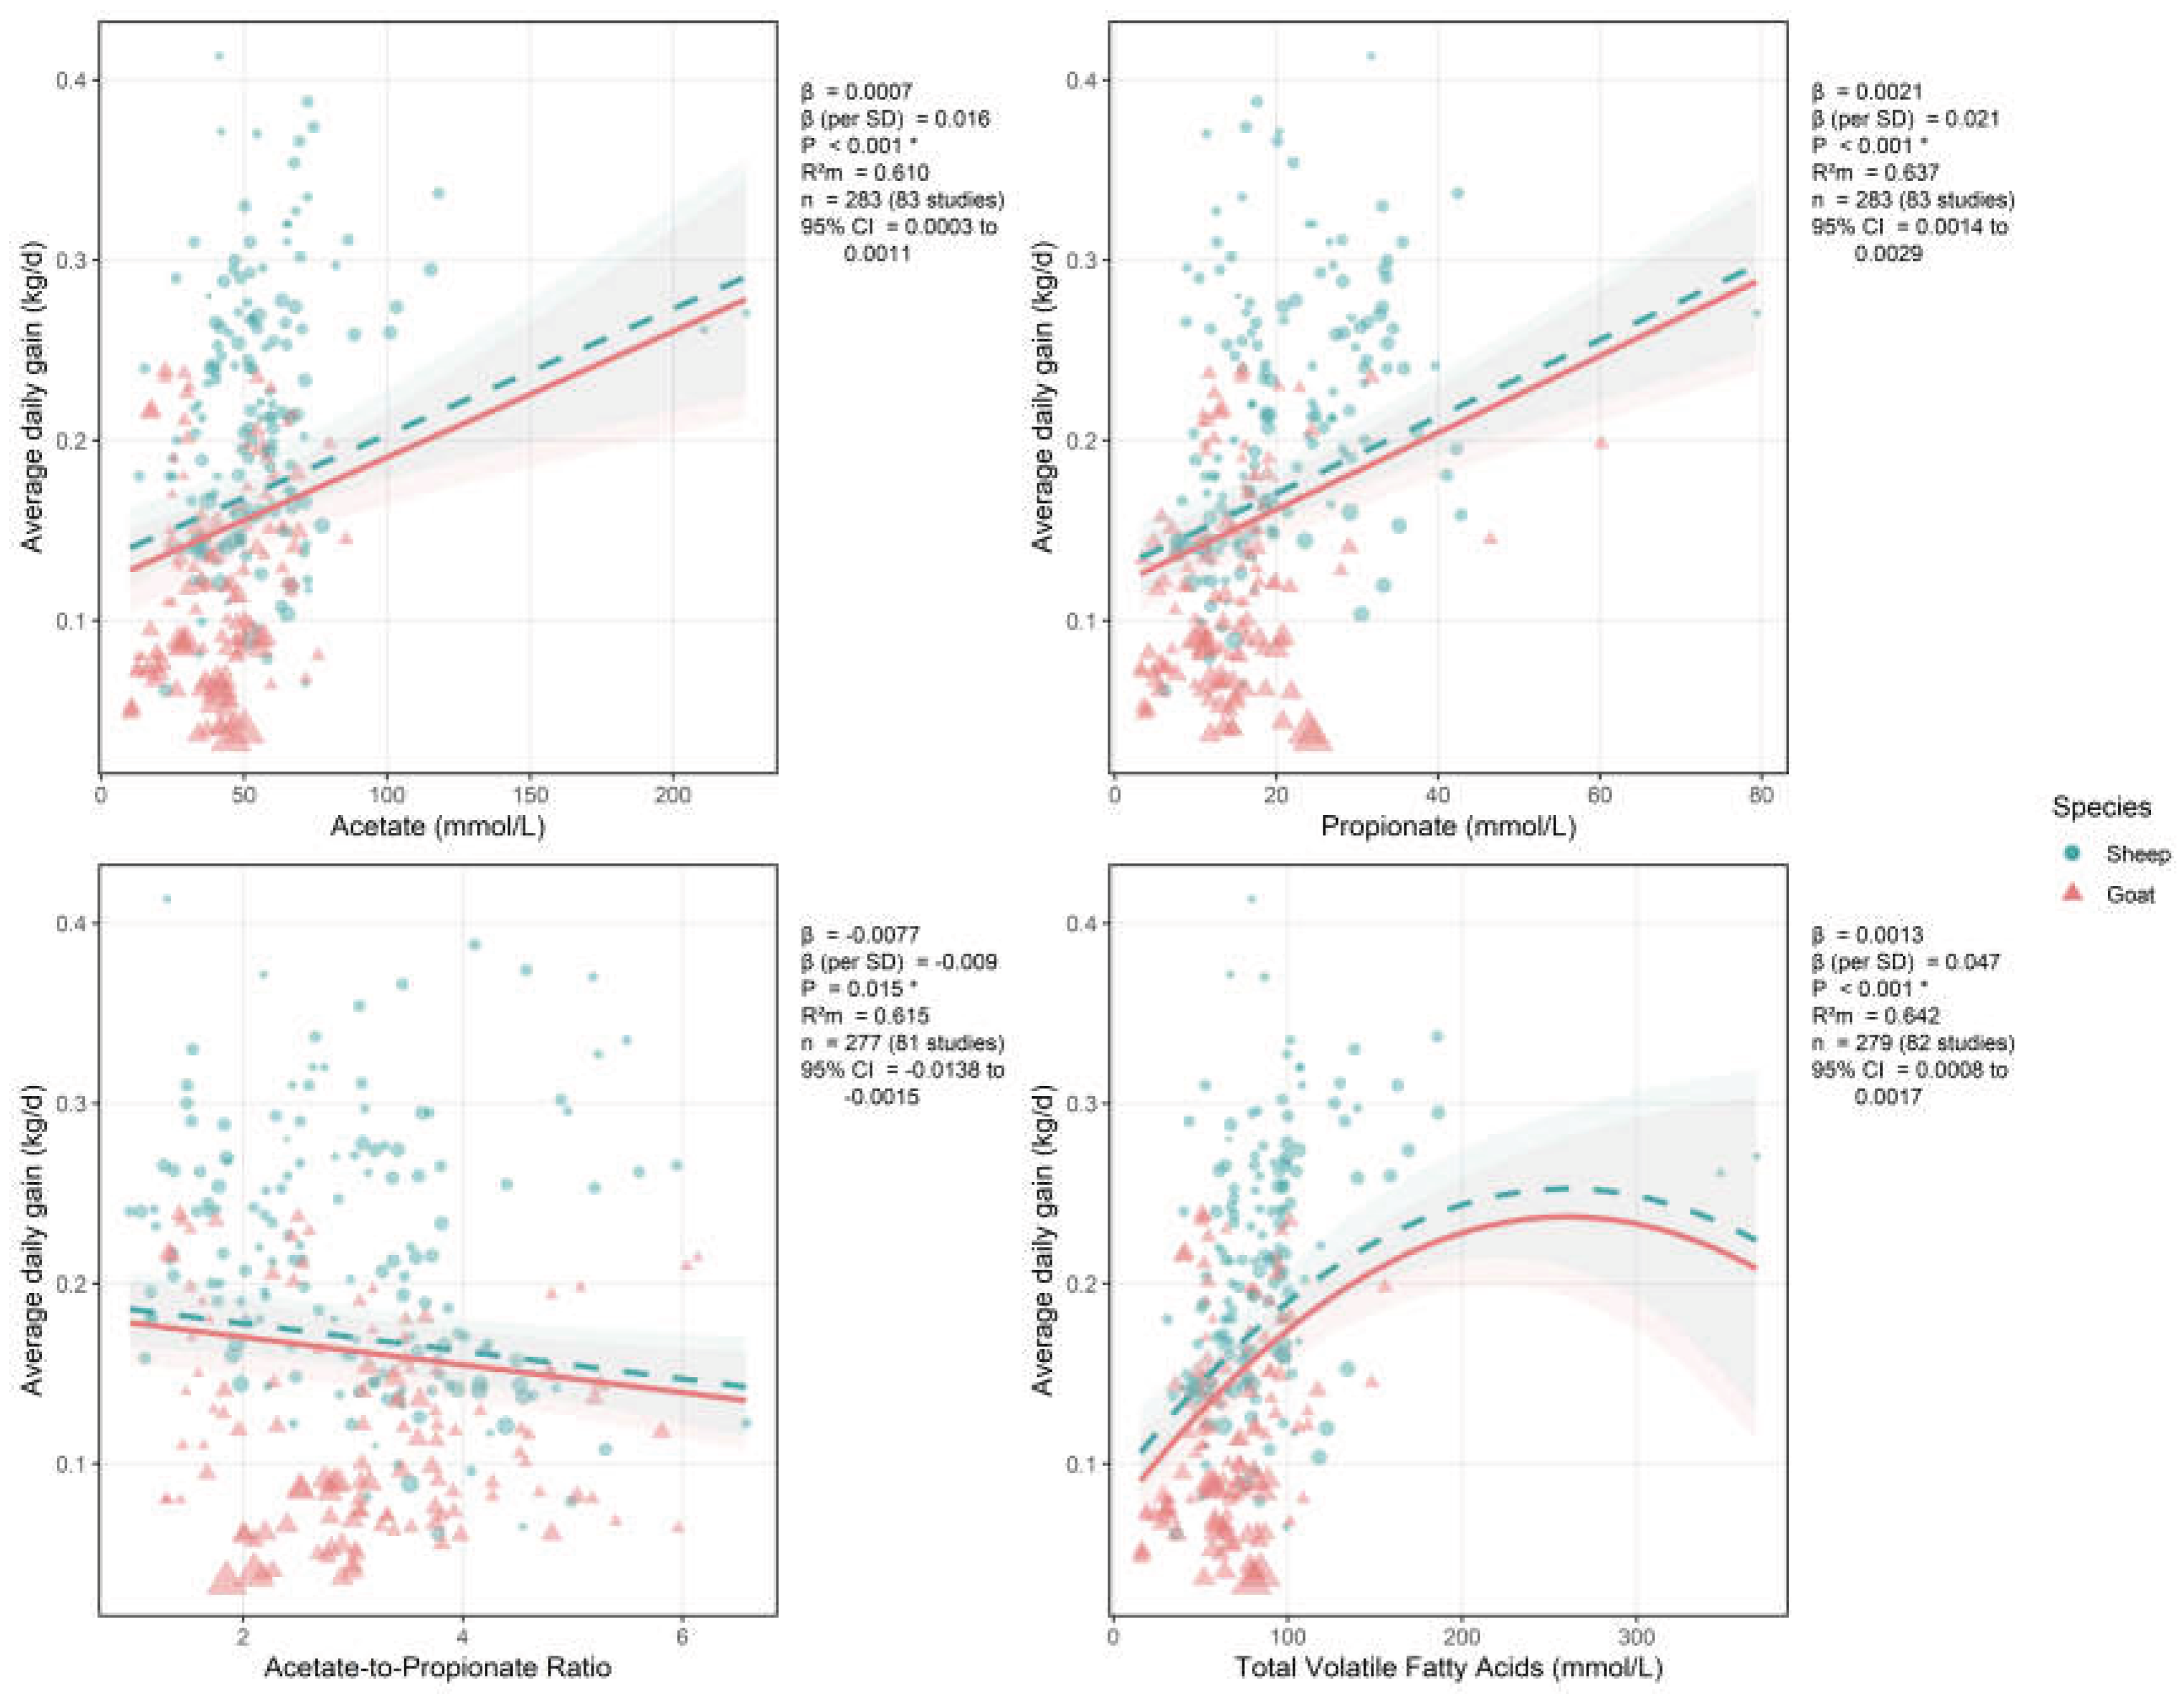
Figure 3.
The ΔCV-R² values for each VFA indicator along with their paired quantile 95% confidence intervals (forest map).
Figure 3.
The ΔCV-R² values for each VFA indicator along with their paired quantile 95% confidence intervals (forest map).
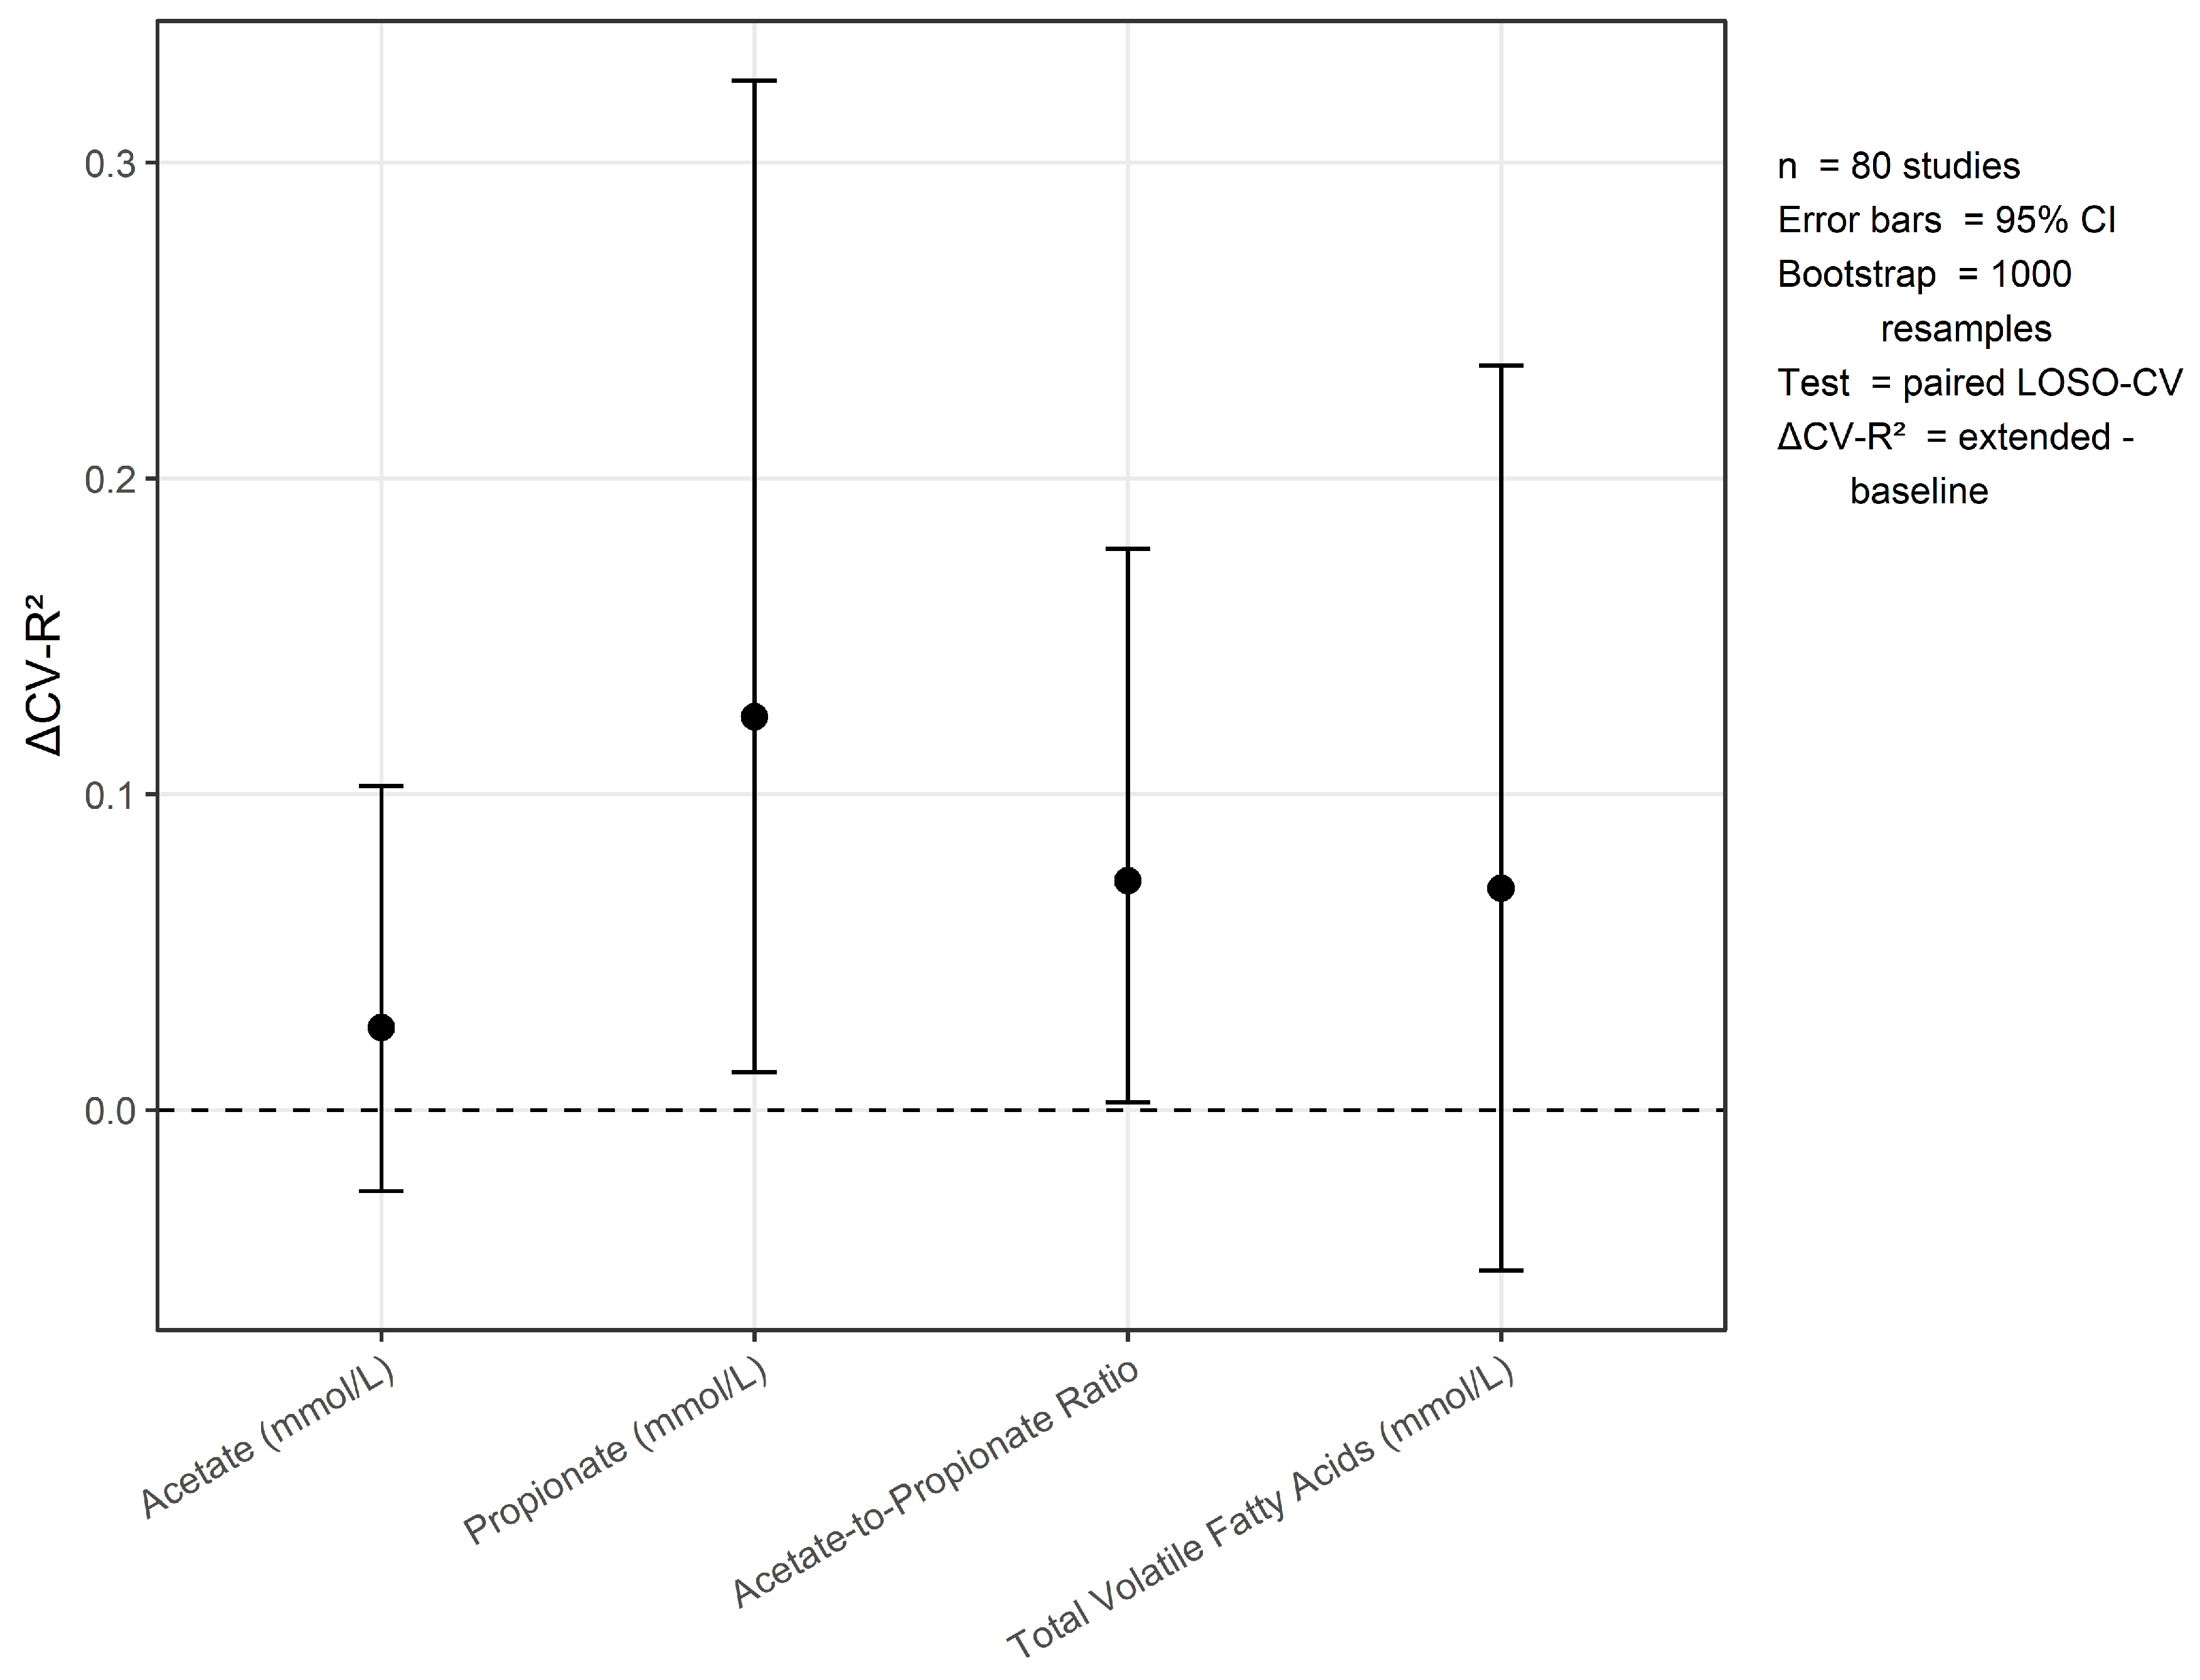
Figure 4.
Observed vs. predicted ADG at the treatment-group level from leave-one-study-out cross-validation using the overall equation with the addition of propionic acid.
Figure 4.
Observed vs. predicted ADG at the treatment-group level from leave-one-study-out cross-validation using the overall equation with the addition of propionic acid.
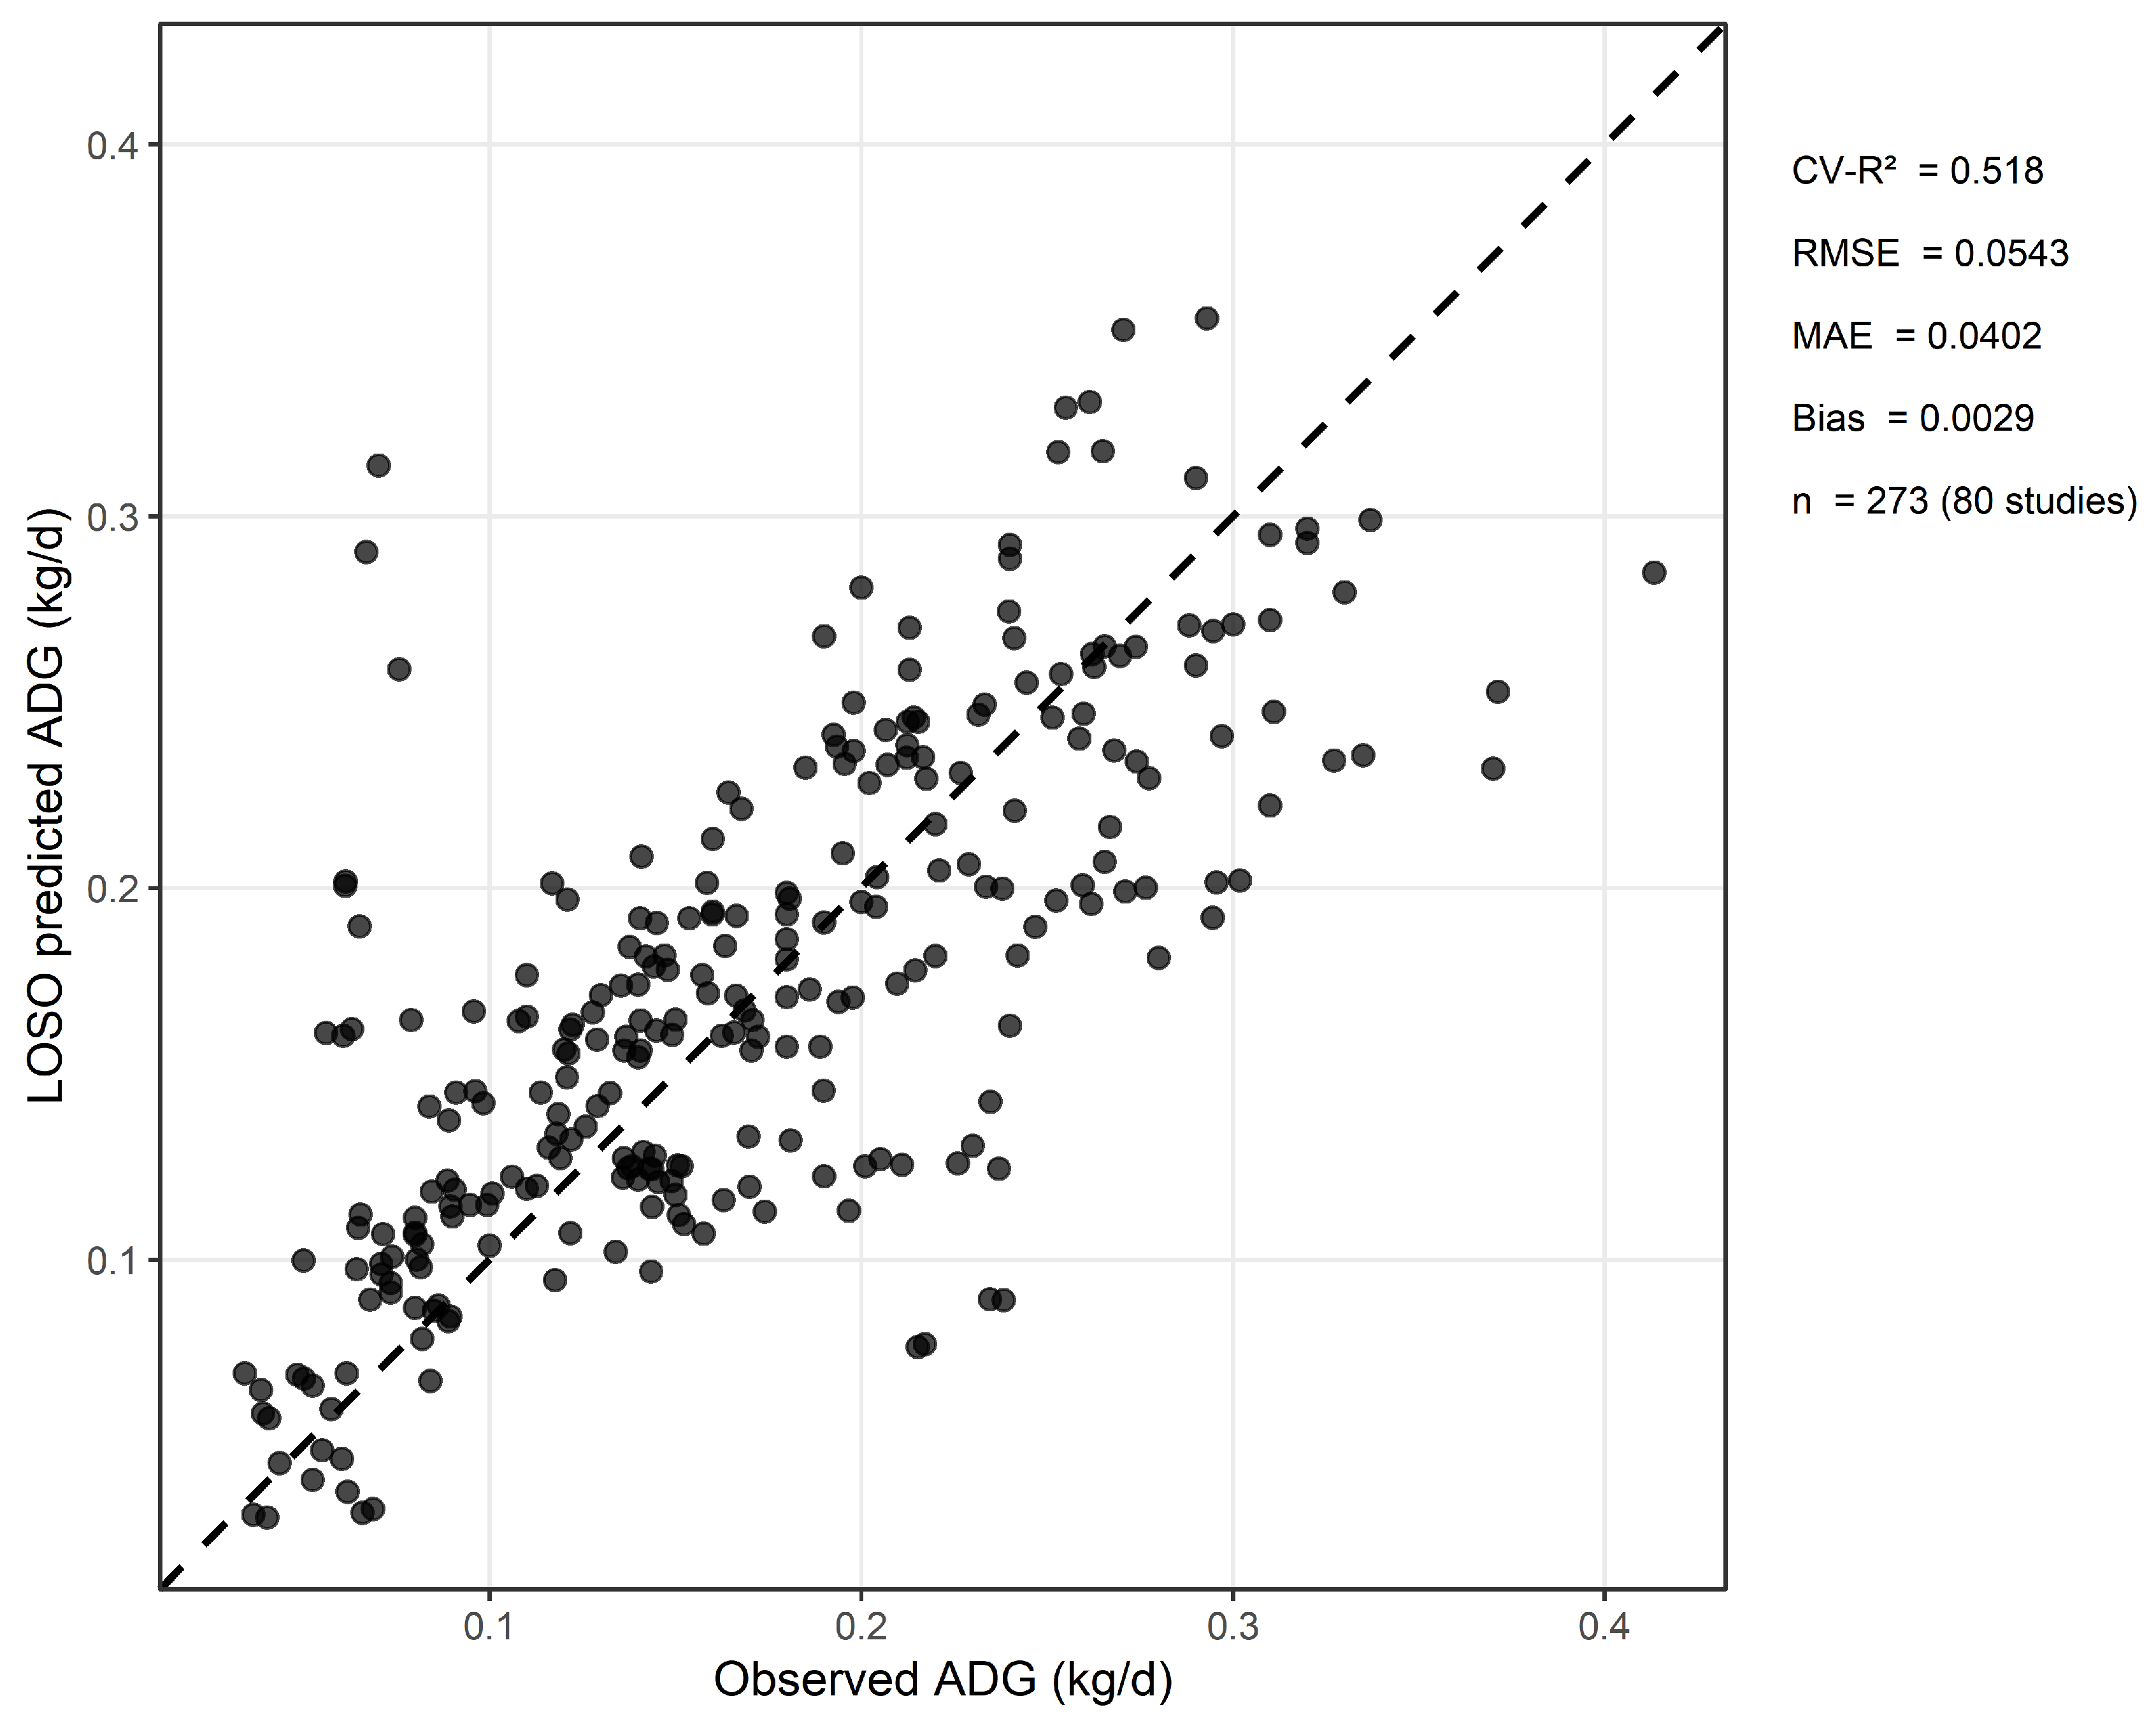
Table 1A.
Data and references of the 83 studies in the complete-case analysis.
| Species | Reference | Treatment | Basic information of sheep and goats |
|---|---|---|---|
| sheep | Fu Jian et al. | Natural grazing versus combined grazing with supplemental feeding | Grassland Tibetan sheep aged 7 months, with a body weight of (23.74 ± 2.16) kg |
| sheep | Guo Yaya | Feeding ad libitarily a total mixed ration with equal energy and nitrogen content, formulated with leaves of blackberry wolfberry at varying concentrations. | Du-hu crossbred lambs, aged 3 months, weighing 29.58 ± 2.06 kg. |
| sheep | Zhang Minghui | Feeding whole mixed particle diets with varying levels of Scutellaria baicalensis straw under conditions of equal energy and nitrogen content | Male Bayinbuluk sheep, aged 4 to 5 months, weighing 27.08 ± 3.12 kg. |
| sheep | Kang Yong | Feeding a complete mixed ration supplemented with alfalfa hay or alfalfa silage as roughage. | Hulunbuir sheep aged 3–5 months. |
| sheep | Chen Yanxu et al. | Feeding a total mixed ration with equal energy and nitrogen content supplemented with chrysanthemum meal at varying levels. | Hybrid male lambs with a body weight of (28.30 ± 3.95) kg |
| sheep | Jie Biao et al. | Feeding livestock with feed supplemented with different levels of jujube powder | Hybrid male lambs |
| sheep | Wei Dalian et al. | Adding fermented Agrocybe aegerita mushroom meal at varying levels to the basal diet | Dantui Lake Sheep (equal numbers of males and females) |
| sheep | Wang Xingxing | Add a 4% brown algae extract to the diet. | Hybrid male lambs aged 3 months. |
| sheep | Qi Shuai et al. | Replacing the original soybean straw in the diet with different concentrations of fermented soybean straw. | Male Hu lamb aged 4 months, weighing (27.00 ± 2.00) kg. |
| sheep | Zhang Weihua | High-nutrient diets with different energy and protein levels. | Male Hu lambs with a body weight of (20.89 ± 0.54) kg. |
| sheep | Jian Zhao et al. | Feeding two total mixed rations. | Male Tibetan sheep aged 5 months, with a body weight of (29.37 ± 1.16) kg. |
| sheep | Yao Wang et al. | With or without dietary supplementation of Pichia kudriavzevii. | Hu sheep aged (108 ± 5) days, with a body weight of (28.32 ± 0.71) kg. |
| sheep | Liang Chen et al. | Five dietary treatments. | Native breed male lambs aged 3 months, with a body weight of (28.24 ± 1.80) kg. |
| sheep | Wang Lele et al. | Basal diet supplemented with different levels of fermented wood chip fungi. | Male Altay sheep aged 4 months. |
| sheep | Maria M. Della Rosa et al. | Feeding a ryegrass-based forage diet supplemented with different levels of forage rape. | Lambs with a body weight of (42 ± 0.4) kg |
| sheep | Jin Yaxing | Feeding total mixed rations with different concentrate-to-roughage ratios. | Male Duolang sheep aged 3–4 months, with a body weight of (24.06 ± 3.10) kg. |
| sheep | Wade Shuang | Three diets with different dry matter contents. | Healthy male Hu sheep aged 4 months. |
| sheep | Chen Binglong | Different combinations and addition ratios of microbial strains and enzymes. | Male Bashbay lambs aged 4 months, with an average body weight of approximately 29 kg. |
| sheep | Jiang Yaxin | Different proportions of pine needles in the fermentation substrate. | Male Kazakh sheep with a body weight of (30.30 ± 0.36) kg. |
| sheep | Zhang Dihong | Feeding different levels of Aspergillus oryzae culture. | Hu sheep aged 3 months, with a body weight of (20.18 ± 1.89) kg. |
| sheep | Yuyang Xue et al. | Different levels of non-starch polysaccharide enzymes. | Female fattening crossbred sheep aged 5 months. |
| sheep | Zhu Aoxiang et al. | Feeding total mixed rations with different selenium sources and selenium levels. | Female Hu sheep aged 6 months, with an average body weight of (27.95 ± 0.27) kg. |
| sheep | Abiodun Mayowa Akanmu et al. | Four different dietary treatments. | Male Merino lambs aged 4 months, with a body weight of (28.8 ± 0.4) kg. |
| sheep | Jianxin Jiao et al. | Feeding three different corn varieties. | Female Hu sheep aged 4 months, with a body weight of (19.6 ± 0.26) kg. |
| sheep | Xiaolin Wang et al. | Feeding diets with different metabolizable energy contents. | Yunnan semi-fine wool sheep aged 10 months, with a body weight of (30.8 ± 1.9) kg. |
| sheep | Xiaowen Ma et al. | Four experimental diets with different starch sources. | Hu lambs with a body weight of (29.70 ± 1.70) kg. |
| sheep | Guangyuan Tian et al. | Basal diet supplemented with different levels of phytosterols on a dry matter basis. | Male fattening lambs aged 4 months, with a body weight of (23.90 ± 0.83) kg. |
| sheep | Zhang Yanzhen et al. | Different residual feed intake. | Hu sheep aged (97 ± 6.1) days, with a body weight of (23.33 ± 3.58) kg. |
| sheep | Huwei Zhao et al. | Supplementation with different levels of rubber seed cake. | Hu sheep aged 3 months, with a body weight of 17.01 ± 0.57 kg. |
| sheep | M. Mahmoudi-Abyane et al. | Diet supplemented with different nitrogen sources. | Male lambs with a body weight of (34.7 ± 1.8) kg. |
| sheep | Shiqi Zhang et al. | Feeding a basal diet supplemented with different levels of guanidinoacetic acid. | Male Kazakh sheep aged 5 months, with a body weight of (34.29 ± 1.95) kg. |
| sheep | Xinlong Zhang et al. | Replacing soybean meal with different levels of vitamin B. | Male Hu lambs aged (80 ± 4) days, with a body weight of (26.5 ± 0.59) kg. |
| sheep | Uriel Hidalgo-Hernández et al. |
Feeding different doses of glycerol. | Crossbred lambs aged 60 days, with a body weight of (25 ± 5) kg. |
| sheep | GUO Yun-xia et al. | Replacing dietary components with different concentrations of yam concentrate. | Male Small-tailed Han lambs aged 60 days, with a body weight of (22.68 ± 2.56) kg. |
| sheep | T. Ran et al. | Different conditioning temperatures of pelleted total mixed ration. | Lambs aged (120 ± 10.2) days, with a body weight of (24.9 ± 3.3) kg. |
| sheep | Cristina Saro et al. | Feeding diets with different crude protein contents. | Male Assaf lambs aged (89 ± 0.8) days, with a body weight of (30 ± 1.9) kg. |
| sheep | Ma Dongmei | Whether the diet was supplemented with Jerusalem artichoke polysaccharide. | Weaned sheep aged 3 months, with a body weight of (26 ± 2) kg. |
| sheep | Xueyan Lin et al. | Feeding diets with different concentrate-to-roughage ratios. | Male Small-tailed Han sheep aged 5 months, with an average body weight of (33.87 ± 1.70) kg. |
| sheep | Niu Shenghua et al. | High-concentrate diet supplemented with 2.2%Chao San Xian. | Fattening sheep aged 3 months, with an average body weight of (21.66 ± 1.88) kg. |
| sheep | Gao Xiujie et al. | Basal diet supplemented with different levels of Macleaya cordata extract. | Fattening male Hu lambs with an average body weight of (27.56 ± 0.24) kg. |
| sheep | Henan Lu et al. | Replacing different proportions of soybean meal with urea, cottonseed meal, and rapeseed meal under isoenergetic and isonitrogenous conditions. | Male Dumeng lambs aged 3 months, with an average body weight of (23.29 ± 0.87) kg. |
| sheep | Borui Han et al. | Basal diet supplemented with 0.3 g/d active dry yeast. | Duhan lambs aged 4 months, with an average body weight of (29.03 ± 0.45) kg. |
| sheep | Hamdon et al. | Diet supplemented with different levels of Saccharomyces cerevisiae. | Farafra lambs aged 5–6 months (under desert conditions), with an average body weight of (26.7 ± 1.83) kg. |
| sheep | Montazerharzand et al. | Diet supplemented with 1% walnut shell biochar. | Male Qezel lambs aged 2–3 months, with an average body weight of (34.5) kg. |
| sheep | Xie Yining et al. | Comparison of two rearing systems: grazing versus confinement feeding. | Male Gangba sheep aged 4 months, with an average body weight of (16.28) kg. |
| sheep | Wang Chuying et al. | Diet supplemented with 30 g/d yeast culture under feed restriction. | Suffolk sheep aged 4 months, with an average body weight of (22 ± 0.5) kg. |
| goat | Wang Boyao | Three experimental diets formulated with different types of soybean meal. | Male Liaoning cashmere goat lambs aged 3 months, with a body weight of (11.28 ± 0.7) kg. |
| goat | Su Hongping et al. | Basal diet supplemented with different levels of nano-selenium. | Male Shanbei white cashmere goat lambs aged 5 months, with an average body weight of (22.0 ± 1.5) kg. |
| goat | Bao Siqingaowa | Diet supplemented with 3%Artemisia ordosica. | Weaned castrated male lambs aged 4 months. |
| goat | Zhang Lu | Diet supplemented with tannins from different sources. | Female Liaoning cashmere goats aged 18 months, with a body weight of (32.59 ± 2.15) kg. |
| goat | Luo Dike | Replacing different levels of the diet with fermented green tea residue. | Male Shanbei white cashmere goats aged 6 months, with an average body weight of (23.89 ± 1.65) kg. |
| goat | Yu Hao | With or without dietary supplementation of noni fruit flavonoids. | Healthy male Albas white cashmere goats aged 4 months. |
| goat | Hu Zhichao | Diet supplemented with different levels of silaged paper mulberry and cottonseed meal. | Healthy female meat-purpose goats aged 4 months, weighing approximately 23 kg. |
| goat | Huang Wenqin et al. | Replacing different proportions of whole-plant corn silage with whole-plant sugarcane. | Weaned goats aged 4–5 months. |
| goat | Zhao Lichao | Supplementation with different artificial sweeteners. | Young dairy goats with an average body weight of (34.90 ± 0.68) kg. |
| goat | Qu Bo et al. | With or without dietary rumen leucine supplementation. | Healthy young Guanzhong dairy goats. |
| goat | Tan Zehao | Whether the diet was supplemented with bee pollen. | Growing Jintang black goats with an average body weight of (33.36 ± 1.34) kg. |
| goat | Zhao Xingrui et al. | Diet supplemented with creatine pyruvate and coated γ-aminobutyric acid. | Nubian black goats aged 4 months, with an average body weight of (22.61 ± 0.47) kg. |
| goat | Xu Qian et al. | Diet supplemented with different levels of garlic skin. | Male castrated Fuqing goats aged 9 months, with an average body weight of (15.42 ± 1.04) kg. |
| goat | Yang Yuntian | Basal diet supplemented with different levels of Saccharomyces cerevisiae. | Female Guanzhong dairy goats aged 4 months, with a body weight of (19.65 ± 0.41) kg. |
| goat | Xinhong Zhou et al. | Whether the diet was supplemented with cecropin. | Male Yudong black goats aged 3 months, with a body weight of (23.19 ± 0.32) kg. |
| goat | Han Yong et al. | Diets supplemented with POBF, probiotics, or POBF + probiotics, respectively. | Growing crossbred goats aged 5 months, with a body weight of (13.4 ± 1.3) kg. |
| goat | Liyuan Cai et al. | Diet supplemented with different proportional combinations of Saccharomyces cerevisiae and Clostridium butyricum. | Crossbred goats aged (5.0 ± 1.0) months, with a body weight of (19–21) kg. |
| goat | Ngo Thi Minh Suong et al. | Whether to feed a total mixed ration containing 50% anthocyanin-rich black sugarcane. | Male Thai native × Nubian crossbred goats, weighing (14.42 ± 0.6) kg. |
| goat | Nittaya Taethaisong et al. | Feeding concentrate feeds containing different levels of neem leaves and polyethylene glycol. | Male Anglo-Nubian goats with a body weight of (20 ± 2.0) kg. |
| goat | Jia Haobin et al. | Feeding diets with different concentrate-to-roughage ratios. | Guangfeng goats aged (120 ± 7) days. |
| goat | Pan Li | The basal diet was supplemented with 2% whole Jerusalem artichoke powder. | Crossbred Boer male goats aged 3 months, with a body weight of (26 ± 3) kg. |
| goat | Chunhui Wang et al. | Diets formulated with varying crude protein contents. | Chuannan black goats aged 4 months, with a body weight of (13.75 ± 0.27) kg. |
| goat | Lingling Xie et al. | Supplementation with varying levels of Hu-song extract. | Guizhou black goats with a body weight of (16.03 ± 0.79) kg. |
| goat | Saeid M. Basmaeil et al. | Diet supplemented with different concentrations of lasalocid. | Male Ardi goats aged 3 months, with an average body weight of (17.12 ± 0.51) kg. |
| goat | Yong Long et al. | Whether to add mushroom residue. | Guizhou black goats with an average initial body weight of (22.41 ± 0.90) kg. |
| goat | Liyuan Cai et al. | Whether to supplement with Clostridium butyricum. | Female crossbred goats aged (6 ± 1) months, with a body weight of (23.23 ± 3.10) kg. |
| goat | Ligang Xue et al. | Basal diet supplemented with different levels of Clostridium butyricum and Saccharomyces cerevisiae. | Male Macheng black goats, weighing (22.25 ± 4.26) kg. |
| goat | Ali Mujtaba Shah et al. | Diet supplemented with different levels of tea plant. | Nanjiang yellow goats aged 6 months, with a body weight of (34.6 ± 4.16) kg. |
| goat | Xueyan Lin et al. | Feeding different ratios of concentrate to roughage. | Male Boer goats aged 5 months, with a body weight of (33.87 ± 1.70) kg. |
| goat | Kang Yang et al. | Feeding diets with different levels of dietary cation–anion difference. | Female Qianbei multi-colored goats aged 13 months, with a body weight of (30.07 ± 0.55) kg. |
| goat | Ashvini Pundalik Bansod et al. | Diet supplemented with different levels of cauliflower leaf powder. | Unspecified breed male goats aged 6–8 months, with an average initial body weight of (10.96 ± 2.21) kg. |
| goat | A. Zali et al. | Diet supplemented with different levels of distiller's grains. | Male goats aged 5–6 months, with a body weight of (20 ± 2) kg. |
| goat | Gong Zhengfa et al. | Feeding a basal diet supplemented with allicin. | Qianbei Ma goats with a body weight of (22.80 ± 1.06) kg. |
| goat | Cai Liyuan et al. | Feeding a basal diet supplemented with a co-culture of Saccharomyces cerevisiae and Rhodotorula glutinis. | Goats aged (90 ± 3) days, with a body weight of (10.21 ± 1.10) kg. |
| goat | Chen Yan et al. | Diet supplemented with different proportions of potato starch residue–corn mixed fermented feed. | Female Boer goats aged 3 months, with a body weight of (25.17 ± 1.34) kg. |
| goat | Yuan Ruitong | Diet supplemented with different levels of chestnut tannin and tannic acid. | Female Liaoning cashmere goats aged 6 months, with a body weight of (26.34 ± 4.69) kg. |
| goat | Caixia Zhang et al. | Diet supplemented with non-protected or rumen-protected Clostridium butyricum. | Fattening Albas goats aged 7–8 months, with an average body weight of (21.94 ± 2.07) kg. |
Table 1B.
Variable Range.
| Population | Variable | n | Mean | SD | Median | Min | Max |
|---|---|---|---|---|---|---|---|
| Overall | ADG | 283 | 0.170 | 0.081 | 0.159 | 0.034 | 0.413 |
| acetic acid | 290 | 48.297 | 22.696 | 46.830 | 10.147 | 225.510 | |
| propionic acid | 290 | 17.951 | 9.829 | 15.785 | 3.160 | 79.420 | |
| A:P | 290 | 3.055 | 1.150 | 3.060 | 0.970 | 6.580 | |
| VFA | 281 | 77.268 | 36.771 | 74.100 | 15.785 | 368.910 | |
| DMI | 290 | 1.155 | 0.418 | 1.130 | 0.327 | 2.320 | |
| IBW | 290 | 24.788 | 6.549 | 24.900 | 10.213 | 42.000 | |
| CP | 290 | 14.918 | 5.598 | 14.090 | 6.480 | 60.650 | |
| NDF | 290 | 39.063 | 9.734 | 39.210 | 15.400 | 65.610 | |
| Sheep | ADG | 157 | 0.213 | 0.073 | 0.207 | 0.061 | 0.413 |
| acetic acid | 164 | 54.138 | 25.011 | 51.780 | 13.420 | 225.510 | |
| propionic acid | 164 | 20.843 | 10.431 | 18.045 | 6.126 | 79.420 | |
| A:P | 164 | 2.990 | 1.146 | 2.990 | 0.970 | 6.580 | |
| VFA | 155 | 86.318 | 42.025 | 79.910 | 30.990 | 368.910 | |
| DMI | 164 | 1.428 | 0.315 | 1.444 | 0.830 | 2.320 | |
| IBW | 164 | 27.326 | 4.923 | 27.555 | 16.210 | 42.000 | |
| CP | 164 | 14.445 | 2.511 | 14.075 | 6.480 | 24.400 | |
| NDF | 164 | 38.488 | 8.463 | 38.460 | 17.300 | 62.910 | |
| Goat | ADG | 126 | 0.117 | 0.056 | 0.103 | 0.034 | 0.238 |
| acetic acid | 126 | 40.695 | 16.497 | 41.556 | 10.147 | 85.690 | |
| propionic acid | 126 | 14.187 | 7.499 | 13.537 | 3.160 | 60.207 | |
| A:P | 126 | 3.155 | 1.155 | 3.070 | 1.290 | 6.140 | |
| VFA | 126 | 66.135 | 25.026 | 64.365 | 15.785 | 155.640 | |
| DMI | 126 | 0.830 | 0.265 | 0.860 | 0.327 | 1.535 | |
| IBW | 126 | 21.484 | 6.935 | 21.940 | 10.213 | 34.900 | |
| CP | 126 | 15.534 | 7.972 | 14.210 | 8.126 | 60.650 | |
| NDF | 126 | 39.812 | 11.165 | 41.720 | 15.400 | 65.610 |
n indicates the number of treatment groups with the variable reported. Total VFA was available for 281 groups in the descriptive statistics but analyses of total VFA used 279 groups (82 studies), the difference arising from 2 sheep groups excluded because of missing covariate or standard-error data.
Table 2A.
Association analysis between predictive factors and ADG using inverse-variance multilevel Meta-regression.
Table 2A.
Association analysis between predictive factors and ADG using inverse-variance multilevel Meta-regression.
| Metric Variable | Model Type | Studies | Group count | β (95%CI) |
Standardization coefficient | Robust P-value | Incremental R² | Heterogeneity R² |
|---|---|---|---|---|---|---|---|---|
| Overall – Acetic acid | Linear | 83 | 283 | 0.00088(0.00031, 0.00144) | 0.0201 | 0.003 | 0.017 | 0.583 |
| Overall – Propionic acid | Linear | 83 | 283 | 0.00188(0.00095, 0.00280) | 0.0186 | < 0.001 | 0.107 | 0.621 |
| Overall – A:P | Quadratic | 81 | 277 | -0.00820(-0.01720, 0.00080) | -0.0095 | 0.074 | 0.071 | 0.607 |
| Overall – Total VFA | Quadratic | 82 | 279 | 0.00088(0.00042, 0.00135) | 0.0325 | < 0.001 | 0.083 | 0.625 |
| Sheep – Acetic acid | Linear | 46 | 157 | 0.00098(0.00022, 0.00173) | 0.0246 | 0.013 | -0.017 | 0.454 |
| Sheep – Propionic acid | Linear | 46 | 157 | 0.00148(0.00011, 0.00284) | 0.0156 | 0.035 | 0.055 | 0.493 |
| Sheep – A:P | Quadratic | 45 | 154 | -0.00157(-0.01167, 0.00852) | -0.0018 | 0.754 | 0.006 | 0.449 |
| Sheep – Total VFA | Quadratic | 45 | 153 | 0.00108(0.00042, 0.00175) | 0.0458 | 0.002 | 0.028 | 0.521 |
| Goat – Acetic acid | Linear | 37 | 126 | 0.00052(-0.00030, 0.00134) | 0.0086 | 0.205 | 0.014 | 0.173 |
| Goat – Propionic acid | Linear | 37 | 126 | 0.00227(0.00116, 0.00338) | 0.0170 | < 0.001 | 0.100 | 0.245 |
| Goat – A:P | Quadratic | 36 | 123 | -0.01575(-0.02834, -0.00315) | -0.0182 | 0.016 | 0.154 | 0.315 |
| Goat – Total VFA | Quadratic | 37 | 126 | 0.00055(0.00005, 0.00105) | 0.0138 | 0.033 | 0.042 | 0.197 |
β represents the inverse-variance-weighted meta-regression coefficient: for acetic acid, propionic acid, and total volatile fatty acids (VFA), the units are mmol/L; A:P denotes the unit ratio; β per SD indicates the change in daily gain (ADG) corresponding to an increase of 1 standard deviation in the predictor variable.;The robust P-value is the cluster-robust P-value (CR1, with studies as the cluster unit).;Incremental R² is the additional heterogeneity explained by the complete model relative to the covariates-only model (dry matter intake (DMI) / initial body weight (IBW) / crude protein (CP) / neutral detergent fiber (NDF); the full sample also includes species), whereas heterogeneity R² is the proportion of heterogeneity explained by the complete model relative to the null model.;The number of studies refers to the total number of independent studies; the number of groups refers to the total number of treatment groups across all analyses.
Table 2B.
Complementary verification of predictors for ADG using a linear mixed-effects model (LMM).
Table 2B.
Complementary verification of predictors for ADG using a linear mixed-effects model (LMM).
| Metric Variable | Studies | Group count | β(95%CI) | P-value | Marginal R² |
|---|---|---|---|---|---|
| Overall – Acetic acid | 83 | 283 | 0.00070(0.00034, 0.00106) | < 0.001 | 0.610 |
| Overall – Propionic acid | 83 | 283 | 0.00213(0.00139, 0.00287) | < 0.001 | 0.637 |
| Overall – A:P | 81 | 277 | -0.00769(-0.01384, -0.00153) | 0.015 | 0.615 |
| Overall – Total VFA | 82 | 279 | 0.00127(0.00080, 0.00174) | < 0.001 | 0.642 |
| Sheep – Acetic acid | 46 | 157 | 0.00066(0.00022, 0.00110) | 0.004 | 0.500 |
| Sheep – Propionic acid | 46 | 157 | 0.00157(0.00061, 0.00254) | 0.002 | 0.516 |
| Sheep – A:P | 45 | 154 | -0.00528(-0.01366, 0.00311) | 0.220 | 0.479 |
| Sheep – Total VFA | 45 | 153 | 0.00157(0.00092, 0.00223) | < 0.001 | 0.556 |
| Goat – Acetic acid | 37 | 126 | 0.00063(-0.00003, 0.00129) | 0.065 | 0.352 |
| Goat – Propionic acid | 37 | 126 | 0.00279(0.00157, 0.00401) | < 0.001 | 0.391 |
| Goat – A:P | 36 | 123 | -0.00883(-0.01776, 0.00011) | 0.056 | 0.377 |
| Goat – Total VFA | 37 | 126 | 0.00148(0.00009, 0.00286) | 0.039 | 0.354 |
β denotes the fixed-effects coefficient in the LMM (units are consistent with Table 2A); P-value represents the within-model P-value calculated using the Satterthwaite approximation.;The marginal R² is calculated using Nakagawa and Schielzeth's method (fixed-effects variance / total variance).;The "Number of studies" refers to the total number of independent studies; the "Number of groups" refers to the total number of treatment groups across all analyses.
Disclaimer/Publisher’s Note: The statements, opinions and data contained in all publications are solely those of the individual author(s) and contributor(s) and not of MDPI and/or the editor(s). MDPI and/or the editor(s) disclaim responsibility for any injury to people or property resulting from any ideas, methods, instructions or products referred to in the content. |
© 2026 by the authors. Licensee MDPI, Basel, Switzerland. This article is an open access article distributed under the terms and conditions of the Creative Commons Attribution (CC BY) license (http://creativecommons.org/licenses/by/4.0/).
Copyright: This open access article is published under a Creative Commons CC BY 4.0 license, which permit the free download, distribution, and reuse, provided that the author and preprint are cited in any reuse.