

Submitted:
09 September 2026
Posted:
10 September 2026
You are already at the latest version
Abstract
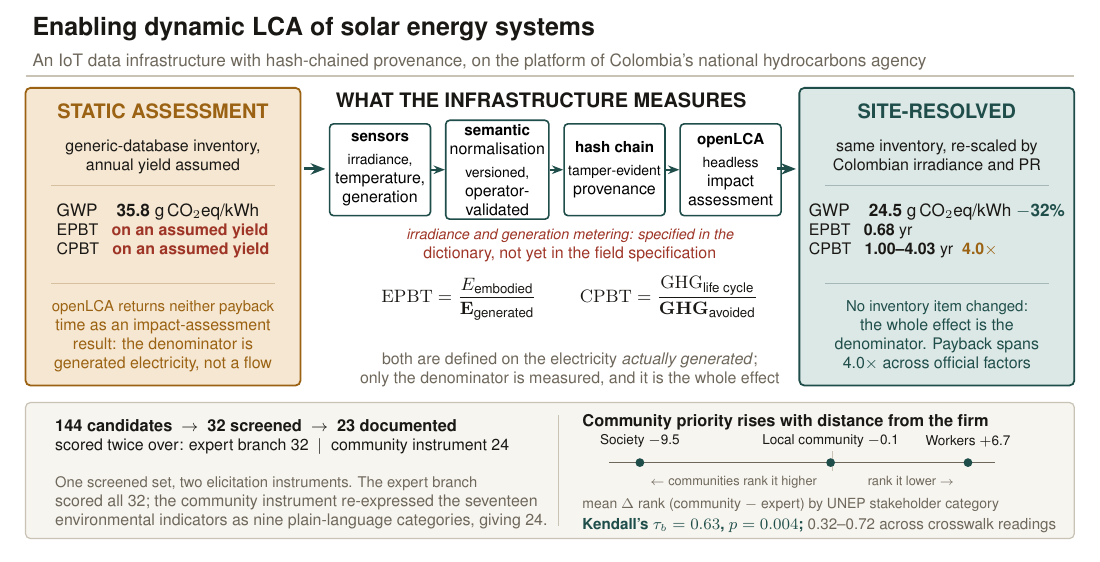
Life cycle assessment of photovoltaic systems still rests on aggregated, time-invariant inventories. In Colombia, where registered solar projects grew 128.6% between 2018–2022 and 2022–2025, environmental follow-up is self-reported, semi-annual and unmeasured by the authority. We report IMPACT Energy.CO, an infrastructure running in that authority’s production environment, which normalises heterogeneous sensor telemetry onto a versioned canonical vocabulary, hash-chains every derived indicator, and drives openLCA headlessly. A matrix of 144 candidate indicators was screened to 32 and scored independently by external experts and by communities in Magdalena and Cesar. On fifteen shared social indicators the two rankings show no detectable association (Spearman’s ρ = −0.07), yet their disagreement is ordered by stakeholder category: communities move an indicator up in priority the further its category lies from the firm’s internal sphere, and down the closer it lies (Kendall’s τb = 0.63, p = 0.004, utility-scale track). Experts rank labour conduct highest; communities rank their own channels of recourse highest. Of seventeen environmental indicators exactly two—energy and carbon payback time—cannot be obtained as impact-assessment results, because both are defined on measured generation; experts ranked them second and third. Harmonising IEA PVPS figures to Colombian irradiance lowers the mono-Si global warming potential by 32%, and carbon payback time varies three-fold across grid emission factors published for the same year. Static inventories cannot deliver the indicators their own users rank highest.
Keywords:
dynamic life cycle assessment
; life cycle inventory
; Internet of Things
; photovoltaic systems
; data provenance
; social life cycle assessment
; energy payback time
; environmental monitoring
; Colombia
1. Introduction
Photovoltaic generation is expanding faster than the institutional machinery that is supposed to account for its environmental consequences. In Latin America that expansion is being pursued in extractive economies whose territorial institutions were not built for it: Ruiz Cardona and González Escobar [1] argue for Colombia that techno-economic planning alone reproduces inequality unless knowledge integration, benefit distribution and conflict management are treated as conditions of the transition rather than as consequences of it, and Sagastume Gutiérrez et al. [2] show that the country’s official transition projections understate the required investment by a factor of four to eight. Colombia is therefore a useful place to observe the gap. Between the 2018–2022 and 2022–2025 periods the number of registered solar projects grew from 4,178 to 9,549, an increase of 128.6%; by the close of the second period 13,639 plants were in operation and 90 were in the testing phase, and 18,436 applications had been filed under the national energy-community scheme. These are our own consolidation of the national planning register and the ministry’s energy-community reporting at the April 2025 cut-off [3,4], and the extraction is given in the supplementary workbook so that the counts can be checked against the register. Over the same interval, the environmental follow-up regime did not change. Reporting is semi-annual, it is executed by the project developers themselves, and the licensing authority performs no direct monitoring; information held by the authority is released through a formal petition procedure with a fifteen-day statutory response time. The evidence base on which environmental decisions rest is therefore self-declared, low in temporal resolution, and difficult for third parties to audit. Figure 1 sets out both the expansion and the two regimes of environmental evidence this paper compares.
The scientific literature exhibits a structurally similar gap. Dynamic life cycle assessment has matured considerably on the methodological side—dynamic characterisation factors [5], temporal propagation through the background system [6,7], and open-source tooling [8]—while photovoltaic LCA has matured on the side of harmonised results [9,10,11]. Both lines share an unresolved dependency: the foreground inventory continues to be modelled rather than measured. Cornago et al. [12] quantify this precisely. Of 67 publications on dynamic life cycle inventory, only 17 use data collected continuously, 93% rely on white-box models rather than measurement, and the authors name “insufficient automation through IoT and sensors” as the principal barrier. Da Costa et al. [13] convert the same finding into an explicit research agenda. Zhang and Fröhling [14] report the corresponding vacancy on the provenance side: across 31 studies integrating distributed ledgers with LCA, there is “a significant lack of case studies rooted in real-world data”, and not one of them addresses photovoltaics.
Xu et al. [15] have since set out the same diagnosis as a research agenda for the field as a whole, naming traceability and access, interoperability, semantic normalisation and provenance transparency as the four conditions of a robust data system for life cycle assessment, and observing that sectoral coverage correlates with the human development index of the producing country. We take that agenda as the framing of this paper and read our contribution as an empirical answer to it: Xu et al. specify what a data system must do, and do not address sensors or deployment; what follows is an account of building one.
The practical cost of this dependency is visible in the dispersion of published results. Mariutti [16], writing in this journal, documents estimates of the manufacturing carbon footprint of Chinese photovoltaic modules ranging from roughly 400 to 3000 kg CO2-eq kWp−1, and attributes the spread largely to outdated silicon purity assumptions, understated chemical consumption and omitted fluorinated gases in the background database. Bhandari and Sekimuli [11] add a complementary observation: most studies do not normalise by the electricity actually generated over the system lifetime. Primary measurement, in other words, is not a methodological refinement; it is the only available route out of the dispersion.
This paper reports what was built to close that gap in one national setting, and what was learned in the process. It extends the conference contribution presented at IOCEN 2026 [17], which set out the framework in outline; the system description, the participatory scoring results, the re-scaling analysis and the validation record reported here are new. Our contribution is one of infrastructure and integration rather than of impact results. Specifically:
- 1.
- We describe an end-to-end data infrastructure, IMPACT Energy.CO, that couples sensor telemetry to a life cycle inventory through a versioned semantic normalisation layer, chains every derived indicator into a tamper-evident hash sequence, and executes impact assessment through openLCA in headless mode. The system runs in the production environment of a national energy authority, on premises and under that authority’s own data custody, with custody of accesses and configurations held by its technology office; its telemetry path is exercised end to end against a test instance rather than fed by field measurement.
- 2.
- We report a socio-environmental indicator system derived from a matrix of 144 candidates and scored along two independent branches—external experts and territorial communities. On the fifteen social indicators both branches scored, the two rankings show no detectable association (Spearman’s , ), a coefficient we report as an absence of resolution because the community instrument saturates. Their disagreement is nonetheless ordered by stakeholder category: on the utility-scale track the communities move an indicator up in priority the further its category lies from the firm’s internal sphere, and down the closer it lies (Kendall’s , ), with experts ranking the indicators that describe a firm’s internal labour conduct highest and communities placing the community’s own channels of recourse and information at the ceiling where the experts rank them last.
- 3.
- We show that of the seventeen environmental indicators screened by the technical team, exactly two cannot be obtained from openLCA as impact-assessment results—energy payback time and carbon payback time—because both are defined on generated electricity rather than on inventory flows, and that the expert panel ranked those two second and third of seventeen for utility-scale plants. We quantify the consequence: under Colombian irradiance the harmonised mono-Si global warming potential falls by 32%, and carbon payback time varies three-fold between two emission factors the national authorities publish for the same grid in the same year, and four-fold across the full set in force.
We are explicit about what this paper does not do. It does not report a complete life cycle assessment of a solar plant, it does not implement dynamic characterisation factors, and the sensor layer has not yet been deployed on an operating utility-scale plant—nor, as Section 5.6 sets out, does the current field specification yet include the irradiance and generation instrumentation that the payback indicators require. Section 2 positions the work against the prior art, Section 3 describes the system and the validation protocol, Section 4 presents the results, Section 5 discusses their implications and the limitations of the study, and Section 6 concludes.
2. Related Work and Positioning
2.1. Temporal Dynamics in Life Cycle Assessment
Life cycle assessment is codified in ISO 14040 and ISO 14044 [18,19], and its development up to the point where temporality became a live question is reviewed by Finnveden et al. [20]. Pehnt [21] was among the first to argue that renewable technologies in particular demand a dynamic treatment, since their burdens are front-loaded while their benefits accrue over decades.
The dynamic LCA literature begins with the observation that a fixed time horizon is internally inconsistent: an emission released in year 1 and one released in year 25 are not equivalent, yet a static characterisation factor treats them as such. Levasseur et al. [5] resolved this at the impact assessment stage through dynamic characterisation factors. Collinge et al. [22] extended dynamism to the inventory and the electricity mix in an instrumented building, and remain the closest conceptual ancestor of any sensor-fed platform. Beloin-Saint-Pierre et al. [6] and Pigné et al. [7] solved the computational problem of propagating temporal information through the background system, the latter across a complete background database. Cardellini et al. [8] delivered the first generic open-source implementation.
Two review papers govern how a contribution in this space should be described. Sohn et al. [23] distinguish dynamic process inventory, dynamic systems and dynamic characterisation, and legitimise partial dynamic LCA as a category in its own right; they also observe that dynamic inventory is by far the most prevalent form of dynamism, reporting that 73% of studies rely on inventory dynamism alone. That such inventories are almost always modelled rather than measured is a separate finding, established by Cornago et al. [12], whose systematic review classifies 93% of dynamic inventories as white-box models; we attribute the two observations separately because they are often run together. Beloin-Saint-Pierre et al. [24] fix the vocabulary of temporal scope, calendar-specific information and temporal resolution that the community now uses; the related notion of temporal correlation belongs to the data-quality pedigree literature rather than to their glossary, and we use it in that sense. We adopt these conventions to say what the present work is: not a partial dynamic LCA, but an infrastructure designed to support a partial dynamic LCA with a dynamic foreground inventory in the sense of Sohn et al. No telemetry has yet entered an inventory here, so the category describes the assessment this system would enable rather than one we report, and it makes no claim on dynamic characterisation. Vyrkou et al. [25] further separate dynamic LCA from real-time LCA; we do not claim the latter, since impact assessment runs are triggered on demand rather than continuously. Recent reviews [26,27,28] and the most recent extension of the dynamic climate model [29] map the field as it stands.
2.2. Sensor-Fed Inventories and Digital Technologies for LCA
Coupling instrumentation to life cycle inventory is not new. Tao et al. [30] combined RFID and bill-of-materials data more than a decade ago; Mashhadi and Behdad [31] proposed ubiquitous LCA covering both environmental and social impact. Ferrari et al. [32] fed a dynamic inventory from an enterprise resource planning system in ceramics, and Trofimenko et al. [33] did the equivalent for freight logistics. Albelwi [34] recently proposed a digital-twin framework for embodied carbon in construction, and is candid that all quantitative results rest on proxy estimates rather than measured project data. Lindemann et al. [35] approach the same coupling from the model side, generating inventory structures automatically from system models rather than from measurement. Closer to the present setting, Beltrán Castañón et al. [36] report a low-cost wireless monitoring system for photovoltaic installations on the Peruvian Altiplano, which establishes that the instrumentation layer is affordable in Andean conditions; they do not, however, connect it to life cycle inventory. Popowicz et al. [37] synthesise 103 sources into an integrated framework combining IoT, big data, blockchain and artificial intelligence across the ISO 14040/14044 phases; that framework is the conceptual reference against which any architecture in this space should be checked, and it is also a competitor, since the conceptual combination has already been articulated.
A second body of work bears directly on the normalisation problem, and it exists on both sides of the coupling. On the sensor side the semantics of observations are standardised: the modular SSN ontology [38] is a joint W3C and OGC recommendation, SOSA [39] is its lightweight core, and the OGC SensorThings API [40] provides the corresponding service interface. On the inventory side there is a semantic literature of equal standing that the platform papers above rarely engage: Kuczenski et al. [41] set out semantic catalogues and ontology design patterns for heterogeneous process and flow descriptions, and later [42] prototype the automated assembly of foreground models linked to background data by similarity matching; Ghose et al. [43] publish a core ontology for life cycle sustainability assessment on the Semantic Web. At the infrastructure level, Kahn et al. [44] describe a government-operated LCA data repository with a canonical federal elementary flow list and UUID-based provenance across agencies—the closest published precedent for an LCA data infrastructure held by public bodies, although it is a repository rather than a pipeline and carries no sensors. Any claim to a canonical variable vocabulary has to say why it is not simply an alignment to the sensor-side standards and a reuse of the inventory-side ones; we return to that question in Section 3.7.
Provenance for sensor-derived energy data has a closer precedent still. Vasheghani Farahani and Treiblmaier [45] report a photovoltaic energy logger that hash-chains each telemetry record with a named digest, batches Merkle roots to an Ethereum contract and assesses the sustainability of the mechanism itself over a real 135-hour deployment of 10,268 records. That work is ahead of ours on exactly the axes we do not claim: it uses field telemetry, names its digest, and evidences its on-chain transactions. It carries no life cycle inventory, no semantic normalisation layer and no institutional deployment, which is where the present contribution lies—but it removes “sensor telemetry plus hash-chained provenance for photovoltaics” from the set of things that can be claimed as new. In the supply-chain direction, Chadly et al. [46] report an Ethereum-based traceability scheme for rare earth metals in thin-film photovoltaics, so a ledger case study for photovoltaics also exists; what does not is one coupled to life cycle assessment.
The nearest prior art, and the one a reader of this journal is most likely to raise, is An et al. [47]: an IoT-based LCA platform for wind turbines, published in a sister MDPI journal, with a four-layer architecture and energy payback time as its headline indicator. Table 1 states the differences explicitly rather than leaving them to be inferred, and Figure 2 places the same body of work on the two axes that matter for the present argument: the temporal resolution of the foreground inventory, and whether the primary data are measured and independently verifiable.
2.3. Photovoltaic Life Cycle Assessment and the Denominator Problem
The IEA PVPS Task 12 guidance [9,50] and its periodic data updates [51] constitute the harmonised reference against which any photovoltaic LCA is read. A new inventory edition [52] was issued in July 2026, while this manuscript was in preparation; Section 3.10 states why the 2023 update is retained as the baseline for the re-scaling exercise and what the new edition would change. The 2023 update reports, for a 3 kWp rooftop system with in-plane irradiation of 1331 kWh m−2 yr−1 and a specific yield of 976 kWh kWp−1 yr−1, greenhouse gas intensities of 35.8, 43.6, 35.5 and 25.2 g CO2-eq kWh−1 for mono-Si, multi-Si, CIGS and CdTe respectively, with non-renewable energy payback times of 1.0, 1.2, 1.2 and 0.8 years.
These figures are not properties of the modules alone. Every one of them is a ratio whose denominator is delivered electricity. Two systems with identical manufacturing inventories, installed at sites with materially different irradiance and performance ratio, will report materially different values for the same indicator. Reviews [10,11] report first- and second-generation ranges spanning roughly an order of magnitude, and part of that range is precisely this denominator effect rather than genuine variation in manufacturing burden. The same denominator sensitivity governs indicators beyond climate change: land-use requirements per unit of delivered electricity [53] are expressed per kWh and therefore inherit it, and Ren et al. [54] demonstrate the point dynamically for residential systems. Ihoume et al. [55] argue on this basis for methodological transparency and traceability as a regulatory requirement. The Colombian precedent [56] anchors the geographical context. Colombia’s own grid emission factors, on which any carbon payback calculation in the country depends, are published by the national planning unit and the system operator [57,58], and their spread is itself part of the argument developed in Section 4.
2.4. Social Life Cycle Assessment in the Global South
The social dimension of the indicator system follows the UNEP guidelines [59], their methodological sheets [60] and the recently issued ISO 14075 [61]. Zafar et al. [62] provide the systematic review for industrial-scale solar.
Participatory prioritisation of social subcategories is itself an established method, not only an established practice. Mathe [63] set out the founding participatory S-LCA protocol, in which stakeholders are engaged in the construction of the assessment rather than surveyed as data sources; the closest recent precedent is Bouillass et al. [64], who set out a step-by-step framework for identifying and prioritising S-LCA impact subcategories with stakeholders and apply it to mobility scenarios. Their protocol and ours share the screening-then-weighting structure. They differ in two respects that matter for what we report: their prioritisation is a single stakeholder-informed exercise converging on one subcategory set, whereas ours runs two branches over the same screened set without reconciling them, so that disagreement is an output rather than something the protocol dissolves; and their instrument is uniform across participants, whereas ours was deliberately re-expressed for the community branch, which—as Section 4.2 shows—is both the source of its interpretive power and its principal methodological limitation.
Two applications are directly relevant to the present setting: Osorio et al. [65] adapt the UNEP guidelines to the community rather than the product-system level in rural Colombia, using a reference-scale approach and data gathered by surveyors from the community itself; and Lappi et al. [66] pursue a well-being framing for renewable energy communities in Namibia. Both establish that community co-production of the indicator set is a defensible methodological choice rather than a participatory gesture, and the divergence we report in Section 4 should be read against that precedent.
2.5. The Gap This Paper Addresses
Combining the strands, and stating the residue precisely rather than generously. Dynamic LCA has resolved time but not measurement. Sensor-fed inventory exists in manufacturing and in wind, but not in photovoltaics with temporal differentiation. Ledger-anchored provenance over photovoltaic telemetry now exists [45] and ledger-based photovoltaic supply-chain traceability exists [46], but neither is coupled to a life cycle inventory. Semantic infrastructure exists on both sides of that coupling—sensor observation ontologies and LCA process ontologies—but the two are not joined in any deployed system we could find. Government-operated LCA data infrastructure exists as a repository [44], without sensors or a pipeline. And social LCA in the region has established community co-production but has not been connected to an operational data infrastructure. Xu et al. [15] name the resulting conditions.
What is therefore not claimed here is any one of these components. What is claimed is their integration into a single artefact specified, built and handed over for production operation inside a national energy authority, under that authority’s own data custody: a versioned, operator-validated semantic normalisation layer between heterogeneous sensor telemetry and the life cycle inventory, a tamper-evident hash chain over every derived indicator, and headless openLCA execution, together with the empirical material that integration produced. We add one qualification to that claim in the same breath, because Section 5.6 would otherwise contradict it: the telemetry path is exercised end to end against a test instance rather than fed by field telemetry, so the artefact is at present an instrumented pipeline awaiting its instruments.
3. Materials and Methods
3.1. Case Setting and Governance of the Deployment
The system reported here was developed under contract 515 of 2025 between Universidad del Magdalena and the Agencia Nacional de Hidrocarburos, the Colombian national hydrocarbons agency, which under the national energy transition mandate also administers evidence on renewable projects. The scope covered sixteen contractual activities across three phases: an LCA methodological framework, a technology development phase, and a knowledge transfer phase. The deliverables of all sixteen activities, including the indicator matrix, the architecture plan, the LCA technical manual, the emerging-technology report and the functional test record, constitute the primary material analysed in this paper.
Two scoping statements are needed before the description proceeds. First, the delivered platform is broader than the layer this paper reports. Alongside the data path described here it carries a public geoportal, conversational assistants orchestrated on n8n, a bicultural avatar, a Community Monitoring Notebook for territorial reporting, and Spanish-language sentiment analysis over community submissions; several of these form part of the seven contractual interactive modules and appear in the functional test record. This paper concerns the data layer alone—acquisition, normalisation, provenance and the LCA connector—and the remaining modules are reported in companion manuscripts.
Second, the infrastructure was specified as technology-agnostic and is instantiated here for photovoltaics. Its canonical schema, its device and project abstractions and its prioritisation instrument were first exercised on the wind route of the same programme, and the deliverables retain that vocabulary in places. We regard the transfer between generation technologies as evidence of the generality the architecture claims rather than as a qualification of it: a data layer whose value rests on resolving heterogeneous vendor vocabularies would be poorly designed if it could not cross from one renewable technology to another. What is photovoltaic-specific is the indicator set, the openLCA method basis, and the variable dictionary instantiated for this route.
Two features of the governance arrangement are methodologically consequential. First, the platform was designed to operate entirely on the agency’s own infrastructure rather than in a public cloud, which the project documentation justifies on grounds of data sovereignty and which distinguishes it from the cloud-first architectures that dominate the published dynamic LCA platform literature. Second, the regulator is a user of the system rather than merely its sponsor: the administrator role, which has read visibility over every project and every indicator and may create and edit company records, but which the requirement specification excludes from IoT configuration and from the technical loading of third-party data, is held by the agency itself.
3.2. Requirements Elicitation
Requirements were elicited through four structured participatory settings during 2025, with 72 participants in total (a sum computed here from the four attendance records, which the source deliverables report separately): a technical meeting with information technology specialists from five national bodies—the hydrocarbons agency, the energy planning unit, the institute for non-interconnected zones, the licensing authority and the ministry of mines and energy—held in Bogotá on 26 July (19 participants); a focus group with a renewable energy cooperative on 14 August (21 participants); a technical visit to the planning unit and the licensing authority on 21 August (12 participants); and a community focus group on 23 August (20 participants). Four further working sessions validated the architecture with the same institutions.
The technical visit of 21 August produced the single most consequential finding for this paper. The licensing authority reported that its environmental follow-up is semi-annual, that it is executed by the project developers themselves, that the authority performs no direct monitoring, and that requests for held information follow a formal petition procedure with a fifteen-day response time. The same session proposed the incorporation of IoT measurement as a means of strengthening that regime. The motivation for the present work is therefore not an inference from the literature but a stated institutional diagnosis.
3.3. Prioritisation of Enabling Technologies
Candidate enabling technologies were ranked using CRITIC [67] for objective criterion weighting followed by TOPSIS [68] for ordering, computed in a spreadsheet implementation by the project team; the decision matrix and the derived weights are reproduced in the supplementary material so that both steps can be recomputed independently. The criteria were originally formulated within the same programme to prioritise emerging technologies for the monitoring of wind projects—the earlier route of the same programme, whose vocabulary Section 3 records as still present in the deliverables—and were applied unchanged here. A second, incompatible criteria list appears elsewhere in the same deliverable, naming technological readiness level, implementation cost, potential environmental impact, social acceptability, LCA compatibility and scalability; the eight-criterion set reproduced in Table 9 is the one the decision matrix actually scores, and we note the discrepancy so that a reader of the source is not misled by it. Six technologies—IoT, big data, digital twins, distributed ledgers, artificial intelligence and cyber-physical systems modelling—were scored against eight criteria: environmental impact, social impact, technological maturity, implementation and maintenance cost, ease of integration with existing systems, adaptability to complex territories, interoperability and standardisation, and community acceptance and social legitimacy. Nineteen participants from the five national bodies scored each pairing on a one-to-five scale; responses were aggregated by geometric mean. The resulting decision matrix is reproduced in full as Table 9.
3.4. The Indicator System
The indicator system was constructed as a screening funnel rather than by adoption of an existing set. A consolidated technical matrix of 144 candidate indicators was assembled from a structured review of the 2015–2025 literature across ScienceDirect, Scopus, Web of Science, MDPI and SpringerLink, together with the ISO 14040 and 14044 framework [18,19], the Task 12 guidance [9], the UNEP social guidelines [59] and the European product environmental footprint method. Each candidate carries fourteen attributes, including definition, calculation formula, unit, reporting frequency, data source, monitoring responsibility, and—critically for the argument of this paper—whether it is modellable in openLCA and whether it requires customisation.
The matrix was disaggregated by project type, yielding 50 indicators for utility-scale plants (26 environmental, 24 social) and 71 for energy communities (28 environmental, 43 social), the asymmetry reflecting the greater weight of social indicators in community-owned generation. The technical team then screened this set to 32 (17 environmental, 15 social) on the basis of the Task 12 relevance ranking for the environmental subset and four explicit criteria for the social subset: pertinence, operational measurability, evidence of socio-environmental effect, and non-redundancy.
Independently of the platform, the project’s LCA technical manual [69] fixes the methodological frame within which these indicators are to be computed: a functional unit of one kWh of AC electricity delivered to the grid, ReCiPe 2016 v1.1 (hierarchist) with eighteen midpoint categories as the impact assessment method, and comparison against a thermoelectric reference plant—which is precisely the avoided-emissions exercise on which carbon payback time depends. That frame anchors the re-scaling of Section 3.10, and the distinction between it and the platform’s own configurability is taken up in Section 5.6.
The Two Validation Branches and Their Instruments
Two independent validation branches were then run on the screened set, four days apart, with deliberately different instruments. Both instruments and the resulting per-indicator scores are provided as supplementary material.
The expert branch was convened virtually on 21 July 2025 over Microsoft Teams, with scoring captured live in Mentimeter; responses were captured anonymously, so a respondent cannot be linked across momentos and the overlap between the two track cohorts cannot be recovered from the export. Two earlier sessions were held on 19 and 20 July. The project record does not characterise them, and they were not smaller—the energy-community environmental session of 20 July recorded 5, 7 and 3 respondents across its three momentos against 4, 6 and 5 for the retained session—so we describe them as earlier sessions rather than as rehearsals. They are retained in the supplementary data and excluded from every figure reported here, which uses the 21 July session only. That exclusion is immaterial on the utility-scale environmental track, where including the earlier sessions leaves the ordering unchanged (), and material on the energy-community track, where it moves the ordering by and lifts energy payback time from fourth to first. We report the sensitivity in Table S13 rather than leave it implicit in the exclusion rule. Participants self-selected into a utility-scale solar park track or an energy community track, and could take part in both. Each indicator was rated on a zero-to-ten scale against two criteria at once, displayed as a live quadrant matrix. The environmental dimension ran three such momentos—direct environmental relevance against consistency with international frameworks; representativeness of the full life cycle against applicability to primary and secondary data; and relevance in the Colombian context against comparability and transparency—giving up to six criterion-level scores per indicator per track. The social dimension ran two: contextual pertinence against productivity, and available empirical evidence against socio-environmental impact. Participants came from four universities and a technical institute, a research seedbed, a legal clinic, two energy firms, a foundation and the departmental government. Per-momento respondent counts ranged from three to eight and are reported alongside every figure derived from them; this is a structured expert elicitation, not a survey.
The community branch was convened as a participatory workshop informed by—not conducted under—the participation and access-to-information obligations Colombia assumes through ILO Convention 169 [70] and the Escazú Agreement [71]; no formal consulta previa procedure was opened, and we do not describe the activity as one. Forty-three representatives of fourteen community organisations and communal action boards from the areas of influence of the Fundación, La Loma and Caimán Cienaguero solar parks, in the departments of Magdalena and Cesar, met in person in Ciénaga on 25 July 2025. They were divided into two tracks by project type and then into working groups by dimension—the source report describes six such groups, the transcribed score record carries five group identifiers, one of which scored both dimensions, and we report the five that produced scored data—and scored indicators on a one-to-five scale, described in the workshop report in one passage as a single pertinence and approval rating and in another as importance and applicability, with a single score per indicator surviving in the record. They used printed cards and post-it notes rather than a digital instrument, with a written justification recorded next to each score. Each group agreed a single collective score per indicator, so the unit of analysis is the group and not the individual: 71 group-level scores in all, from 43 participants across five groups. The instrument put 24 socio-environmental indicators to the groups, each with a simplified technical data sheet. Two features of the facilitation are recorded in the workshop report and bear on the scores, and we report them in Section 4.2 rather than here because that is where they matter: an opening ground rule inviting participants to be propositive rather than to focus on complaints, and the reduction of one working group to three participants by a transport stoppage. Attendance evidence for the session is the paper register annexed to that report; the report also cites an automatically generated conferencing-platform list for the same headcount, which is an artefact of copying from the report of the virtual expert workshop.
The two instruments were not identical, and the difference is consequential enough to state here rather than in the limitations. The fifteen social indicators were put to both branches in the same wording. The environmental dimension was not: experts scored the full seventeen-indicator midpoint set, while the community instrument was re-expressed as nine plain-language categories—climate change, toxicity to people, toxicity to the environment, clean air, river and lake pollution, loss of animals and plants, water use, use of minerals and metals, and use of fossil fuels. Energy and carbon payback time were not among them. Section 4.2 therefore compares the two branches quantitatively only on the social dimension, and treats the environmental dimension as a question about the instrument.
3.5. System Architecture
The architecture follows the C4 convention [72] and is summarised at the container level in Figure 3; Table 2 gives the corresponding specification together with the implementation status of each element.
The back end is built on .NET in a layered arrangement of controllers, services, repositories and Entity Framework data access, with JWT authentication, BCrypt password hashing, soft deletion on every entity and role- and tenant-scoped access control. The front end is React with role-differentiated modules. Ingestion follows the open protocol stack that has become standard for constrained devices [73], and raw telemetry is retained in a partitioned object store following data lake practice [74]. IEC 61724-1 [75], the monitoring standard for photovoltaic systems, is named in the roadmap deliverable as an enabling standard for the monitoring layer, but the project record does not connect it to the variable dictionary or to the sampling cadences, and no conformity assessment against it has been carried out. We therefore cite it as the standard against which the instrumentation gap of Section 5.6 should be closed rather than as a design input to what was built. The architecture deliverable specifies the extraction, transformation and loading design in more detail than the implemented subset exercises: watermarking and deduplication on ingestion, quality and rejection registers, lineage columns carried through to the warehouse, sliding windows, retry with backoff and controlled backfills, and a star schema on the analytical side. We report the design because it is part of what was delivered, and mark in Table 2 which parts of it were exercised. Extraction, transformation and loading are implemented in Python as scheduled jobs; the project documentation is explicit that no distributed cloud pipeline was available and that a lightweight cron-based approach was adopted deliberately. Non-functional requirements were specified numerically rather than qualitatively, and are listed in Table 3.
Component versions require a note. The architecture documents specify .NET Core with C# and ThingsBoard without pinning versions; the specific builds recorded in the project record—.NET 8 and ThingsBoard Community Edition v3.6—are those of the integration test environment described in Section 3.9, and Table 2 should be read accordingly.
3.6. The Telemetry-to-Inventory Data Path
Figure 4 traces the full path from sensor to certified result and, equally important, marks which segments are exercised in the deployed system and which are specified but not yet executed.
We state the status of this path before describing it. The pipeline is built and has been exercised end to end against a test instance of the IoT platform, with synthetic and platform-generated telemetry; it has not been fed by field telemetry from an operating plant, and the project record is explicit that the flow into the data lake follows stabilisation of that field capture. The description below is therefore of a pipeline that runs, on data that is not yet from sensors in the field.
Device registration creates a twin on the IoT platform together with a per-device authentication token, and the system emits a first sample immediately to confirm the link and synchronise metadata. Telemetry is ingested over MQTT or HTTP under TLS into a time-series store, with watermarks, deduplication and idempotent upserts. Validation checks structure, type, unit, range and rate of change against a catalogue keyed to the device profile; records that fail are quarantined and logged rather than discarded silently. Consolidation harmonises to UTC and SI units, resamples to one-, ten- and sixty-minute windows and loads a dimensional model carrying source, run identifier and checksum as lineage columns. The extraction cycle is scheduled; the project record gives fifteen minutes as an indicative interval rather than a fixed operational specification.
Two mechanisms then consume the consolidated series. The first is a dynamic indicator engine internal to the platform, in which each indicator is stored with an explicit formula and a set of typed inputs, and each computation is persisted as a new record rather than overwriting its predecessor. The second is openLCA [76], operated as a headless service on the same infrastructure, invoked through a REST connector that creates a homologous project from a template on project creation, accepts inventory amounts per flow and life cycle stage, executes a user-selected impact assessment method and returns versioned results. We record explicitly that the trigger for the second mechanism is currently a web form completed by an authorised user, not a telemetry stream.
3.7. Semantic Normalisation
The obstacle that dominated integration was not bandwidth or protocol support but vocabulary. Sensors from different vendors publish the same physical quantity under different keys, in different units and at different cadences. The response, shown in Figure 5, is a mapping engine that proposes candidate equivalences, requires an operator to confirm or correct them, attaches unit, conversion factor and sampling frequency, and writes the result as a new version of the mapping rather than as an in-place edit. Because the mapping is versioned rather than edited in place, a mapping decision can be audited after the fact and a historical series reinterpreted if a mapping is later found to be wrong. Whether every stored reading additionally carries a foreign key to the mapping version under which it was resolved is a property of the implementation that the architecture record does not state, and we do not claim it.
The project documentation identifies this module as the principal technical innovation of the deployment, on the grounds that it reduces dependence on proprietary hardware. We would state the claim more narrowly: the innovation is not the mapping itself, which is routine, but the combination of human validation with mapping versioning, which converts an ad hoc integration step into a reproducible and auditable one.
The obvious objection is that this vocabulary should have been an alignment to SSN and SOSA [38,39] rather than a dictionary of its own, with SensorThings [40] as the service interface. We accept the force of it, and the honest answer is about who does the work. The people who resolve an unfamiliar vendor key in this deployment are the regulator’s own operators, not knowledge engineers; the interaction they can sustain is confirming or correcting a proposed equivalence in a web form, and the artefact that has to be versioned and audited is that decision, not an ontology commitment. A flat, typed dictionary with unit, conversion factor and cadence attached is what that interaction can produce and what an auditor can read back. The two are not in conflict: the canonical terms are a small, closed set and each carries the attributes needed to be published as SOSA observable properties, so alignment is a mapping exercise on the canonical side rather than a redesign, and we regard it as the correct next step once the dictionary stabilises. The project record touches this from the design side, though less strongly than would be convenient: the emerging-technologies deliverable records that the selection of variables drew on ISO 14040/44 and on the recommendations of the OGC SensorThings API as conceptual references, and states explicitly that neither framework was applied literally. No entity, observation or datastream model was adopted and no SensorThings service interface exists. The alignment we describe as future work is therefore a direction the record is consistent with, not a decision already taken. The same argument does not excuse ignoring the inventory side of the coupling: the semantic catalogues and core ontologies of [41,42,43] are the natural target for the inventory end of the mapping, and their absence from this deployment is a gap in it rather than an absence in the literature. What would have been wrong is to require ontology editing of the operators who actually hold the domain knowledge.
3.8. Provenance
The provenance layer follows the implementation framework for ledger-backed life cycle assessment set out by Zhang et al. [77], simplified to what the deployment could sustain. Every computed indicator is written to an append-only structure in which each record carries the computed value, a hash over the content and its metadata, the hash of its predecessor, and a timestamp; the first record of each sequence is a genesis block. Altering a historical record breaks the chain, and the break is detectable by recomputation (Figure 6). On completion of an assessment run the platform issues a digital certificate over the result, which the project record describes as a key input to licensing, environmental audit and regulatory reporting. We use the source’s own framing here rather than a weaker one, while noting that no licensing process has yet consumed such a certificate.
We are deliberate about terminology here, and about what the construction does and does not establish. The deployed mechanism is a tamper-evident hash-chained audit log implemented over a relational store; the project record documents the chaining construction and the break-detection behaviour but does not name the digest algorithm, so we describe the construction rather than attribute a specific member of the SHA family [78] to it. A connector for anchoring hashes to an Ethereum-compatible ledger is exercised against a permissioned instance that the record places on the regulator’s own infrastructure: the functional test record shows a “verified on blockchain” badge and a copyable hash in the interface. It is not a public or distributed network, the record documents no smart-contract deployment, and we report no gas or transaction cost figures.
We also record the limits of the evidence, because they bound the claim. The transaction identifier appears in the expected result of that test and not in the obtained one, and the evaluator noted that a capture of the verification viewer showing the identifier, timestamp and matching hash was not attached; none of the five documented integration flows exercises the chain; and the emerging-technologies deliverable reports ledger read and write as integrated where the functional test record contains no such case. We report the weaker reading. On-chain anchoring is therefore exercised but not evidenced, and an integration test of that path with an attached verification capture is the first item of remaining work on this component.
The property the hash chain does provide, independently of the anchoring connector, is narrower than the word “blockchain” would suggest, and stating it precisely is what makes it defensible. Any party holding the records can recompute the chain and detect that a published indicator has been altered since it was computed, or that a record has been removed from the sequence. That is a real gain over a self-reported regime, in which no such recomputation is possible at all. It is not proof against the party that maintains the store: the authority computes the value, holds the chain and serves the verification, and a custodian with write access to all three can recompute a consistent chain over altered content. Nor does any chaining construction speak to whether the value entering it was correct—the oracle problem, in the formulation of Caldarelli [79], is not solved by the ledger but relocated to the instrument and the mapping that feed it, which is one reason the semantic layer of Section 3.7 and the instrumentation gap of Section 5.6 matter as much as the chain does. External anchoring is what would narrow the first of these two limits, by placing the chain’s state beyond the custodian’s reach; that is the purpose of the connector, and it is the part not yet evidenced.
3.9. Validation Protocol
System validation followed three levels. Functional testing is reported in the source record in two ways that do not reconcile, and we state the discrepancy rather than choose silently. The body of the test deliverable documents eighteen scenario-level entries—its own numbering and the closing report both say seventeen, because one of the eighteen entries carries no section number in the source—spanning authentication, multi-tenant isolation, project and device management, georeferencing, indicator computation with provenance publication, and the public-facing modules, each with recorded preconditions, acceptance criteria and traceability to a requirement. Alongside those the same deliverable documents twenty-two unit cases across eleven controllers and five integration flows. The consolidated summary of that deliverable instead breaks its 45 executed cases down as eight end-to-end functional tests, thirty unit tests and seven integration tests. Both partitions sum to 45— and alike—so neither can be preferred on that ground, and neither the eight nor the thirty nor the seven is separately evidenced case by case. We therefore report both, and use the documented body counts wherever a case-level verdict is needed.
Two features of that record bear on how the reported pass rate should be read, and we state them here rather than in a footnote. First, seven of the eighteen functional entries are read-only, anonymous checks of public modules; the data layer reported in this paper is exercised by the device-panel, device-creation, indicator-computation and telemetry entries and by the five integration flows. Second, four of the eighteen carry verdicts qualified to the interface layer, with the evaluator recording in each case that a confirming capture after submission was not attached: login, project creation, georeferencing and IoT device creation. The login entry is recorded as pending confirmation of effective authentication and redirection. That qualification is closed at the next level—the integration test of the full authentication flow passes in 2.3 s with the stored password hash verified in the database—but it is not closed within the functional record itself, and the 100% pass rate reported in Section 4 should be read against it.
Unit-test coverage carries a scope qualification of the same kind. The twenty-two documented unit cases are controller-level create, read, update and delete tests; no unit test covers the mapping engine, the hash chain or the openLCA connector. The emerging-technologies deliverable—not the architecture deliverable, which states no coverage figure at all—sets a minimum of 80% unit coverage on three critical domains: IoT ingestion and normalisation, indicator computation, and the issuance of ledger certificates. Two of the three components this paper reports as its contribution fall squarely inside that target and carry no dedicated unit tests. Those paths are exercised through the integration flows and the functional scenarios, but the 90% figure quoted below is coverage of the controller layer, not of them.
Security assurance sits partly outside this record and we report both halves. The closing deliverable records static and dynamic application security testing reports, an ethical-hacking report with its remediation, a digital security architecture, encryption and data-protection schemes, integration with the institutional directory and multi-factor authentication, and a digital security risk matrix. Those documents sit outside the sixteen contractual activities whose deliverables constitute the material analysed in this paper (Section 3); the closing report lists them among documentary evidence not originally contemplated at contractual level, we have not inspected them, and no finding, severity, scope, tool or date is recorded anywhere we cite. What we can report from the material we do hold is a gap of a different kind: the functional test record lists negative-access checks (an attempt to reach another tenant’s resource, with the expected 401 or 403 captured) as recommended evidence rather than as executed results, while its summary nonetheless asserts that tenant isolation worked in every scenario tested. Positive isolation observations are recorded—no other tenant’s companies visible in the listing, no other tenant’s devices in the device panel, and the company-and-project integration flow validating isolation—but the adversarial case is not among them. We report the assurance and the gap in the same breath, because the second bounds what the first can be taken to demonstrate here.
Unit and integration tests were executed against a containerised SQL Server instance, ThingsBoard Community Edition v3.6 and a .NET 8 test server using xUnit with WebApplicationFactory; the integration suite includes the device-synchronisation and telemetry-retrieval flows. Load and stress testing was performed with Apache JMeter 5.6 against the public landing endpoint at 500, 1000, 2000 and 5000 concurrent virtual users. The campaign lists content delivery network caching among its preconditions conditionally, and the evaluator attributes the absence of degradation partly to it; whether caching was in fact enabled is not recorded. Interface quality was assessed by heuristic inspection against the ten Nielsen heuristics [80], supplemented by a separate automated accessibility and performance audit conducted earlier in the design cycle.
3.10. Re-Scaling of Harmonised Indicators
To quantify the sensitivity of published photovoltaic indicators to the denominator, we re-scaled the IEA PVPS reference values [51] to Colombian conditions. The procedure changes only the lifetime yield and holds the manufacturing, balance-of-system and end-of-life inventories at their reference values; it is a transparency exercise, not a new assessment. It adopts the functional unit fixed by the project’s LCA technical manual [69], one kWh of AC electricity delivered to the grid, so that the exercise is anchored to the same unit the platform’s own methodological frame declares.
Choice of Baseline
While this manuscript was in preparation, IEA PVPS Task 12 issued a new inventory edition [52], built on 83 factory-level assessments collected through the French tender process between 2022 and 2025, moving the reference system from 3 to 10 kWp, adding TOPCon on n-type wafers and discontinuing the multi-Si datasets. We retain the 2023 update [51] as the baseline for three reasons, and state them explicitly because the choice is contestable. First, the exercise is a comparison against the published corpus, and every meta-analysis we set our results beside [10,11,16] is itself built on the earlier inventories; re-scaling a baseline the comparison literature does not share would confound the denominator effect we are trying to isolate with a change of numerator. Second, the arithmetic is deliberately first-order: the result is a statement about the sensitivity of a ratio to its denominator, and it is invariant to the absolute level of the numerator, so a lower embodied burden changes the reported values but not the effect. Third, multi-Si is retained in Figure 8 precisely because the new edition discontinues it; the technology remains widely installed in the Colombian fleet, and dropping it from a national analysis on the grounds that a European-weighted inventory no longer tracks it would be the wrong inference. The direction of the update is nonetheless clear—the new edition reports a marked decrease in module supply-chain impacts—so the absolute figures reported here should be read as conservative, and re-running the exercise on the 2026 inventory is stated as immediate further work.
Procedure
The operation is harmonisation in the sense established by the NREL Life Cycle Assessment Harmonization Project—the multiplicative meta-model in which a published per-kWh indicator is transported to a common irradiation, performance ratio and system lifetime [81,82], and applied to energy payback time by Bhandari et al. [83]. We name it because the method is established and because we run it in the opposite direction from its usual use: rather than harmonising a literature to one reference condition in order to compare studies, we transport an already harmonised reference value to three local conditions in order to expose what the reference condition costs.
From the reference in-plane irradiation of 1331 kWh m−2 yr−1 and specific yield of 976 kWh kWp−1 yr−1 the implied performance ratio is 0.733. Three Colombian in-plane irradiation levels were considered—1650, 1900 and 2150 kWh m−2 yr−1, representing the Andean interior, the Caribbean coast where the case-study region lies, and La Guajira. They are scenario values rather than site measurements, chosen to span the national range reported by the Global Solar Atlas and PVGIS for optimally inclined surfaces [84,85]; the project deliverables record local irradiance only as a data requirement, not as a value. A performance ratio of 0.75 is applied, with a sensitivity band of 0.70 to 0.80 standing in for temperature derating and soiling. Lifetime output assumes linear degradation at 0.7% yr−1 over a thirty-year module life, giving a mean lifetime derating factor of 0.8985. Indicators scale inversely with lifetime output.
Three conventions in this procedure need to be declared, because each is a place where a harmonisation can go wrong silently.
First, the specific yield of 976 kWh kWp−1 yr−1 is the reference system’s nominal annual yield, not a lifetime average: it is the value that, divided by the reference in-plane irradiation, returns the performance ratio of 0.733 that the reference system declares. Reading it as a degradation-weighted lifetime mean would imply a nominal performance ratio of 0.816, which no rooftop reference system of that vintage reports. The distinction is load-bearing—it fixes all four embodied burdens and every payback figure to within about 11%—so we state it rather than leave a reader to infer it.
Second, the reported energy payback times inherit the grid primary-energy conversion efficiency of the reference series rather than a Colombian one. The IEA PVPS definition divides embodied primary energy by the annual yield converted to its primary-energy equivalent at ; because our operation is a multiplicative transport of an already harmonised value, that term passes through unchanged. The ratios between scenarios—which is what the argument rests on—are invariant to ; the absolute levels are not. A Colombian substitution is also less straightforward than it looks: in a majority-hydroelectric system the conversion of electricity to primary energy is an accounting convention rather than a measurable thermal efficiency, and the choice of convention would move every re-scaled figure without improving any of them. We therefore report the re-scaled energy payback times as comparable to the IEA reference series, and not as independently derived national values.
Third, the mean lifetime derating factor enters the embodied-burden step, which is a lifetime quantity, and does not enter the payback step, which is not. Carbon payback occurs in the first years of operation, when cumulative degradation is small; applying a thirty-year mean derating to a four-year payback would overstate it by about 11%. Integrating the degradation profile properly—that is, solving for the year in which cumulative avoided emissions equal the embodied burden—gives 4.07 rather than 4.03 years at the lowest emission factor, 3.03 rather than 3.00 at the intermediate one and 1.00 at the highest. We report the year-one convention in the text and the degradation-aware values here, and the difference is below the resolution of every other assumption in the exercise.
The performance-ratio band deserves a note, because the re-scaling as described moves the reported impact in one direction only. Higher irradiance raises the denominator and lowers every indicator expressed per kWh, while tropical operating conditions act on the same denominator in the opposite sense through soiling and elevated cell temperature; Beltrán Castañón et al. [36] document the resulting variability for Andean sites. Module degradation, by contrast, does not appear to compound the penalty: Luo et al. [86] measured crystalline silicon modules over seven years in a tropical climate and report degradation rates of 0.03 to 0.47% yr−1 across five module types—below, not above, the 0.7% yr−1 used here—so the degradation assumption of this exercise is conservative for tropical conditions rather than optimistic. The 0.70–0.80 performance-ratio band is intended to absorb the soiling and temperature effects rather than to represent them explicitly, and the lower bound of the band is the figure a reader should use if the tropical penalty is judged severe. A site-specific treatment would require the measured generation series that this infrastructure is built to produce and that, as Section 5.6 records, it does not yet collect.
Carbon payback time was then treated parametrically. Embodied emissions per installed kWp were derived from the reference intensity and lifetime output, giving 941.8, 1147.0, 933.9 and 663.0 kg CO2-eq kWp−1 for mono-Si, multi-Si, CIGS and CdTe; the mono-Si value sits inside the 493–2760 kg CO2-eq kWp−1 range reported by Bhandari and Sekimuli [11], which serves as an independent consistency check. Carbon payback was then computed as embodied emissions divided by annual avoided emissions, sweeping the emission factor of the displaced electricity from 0.05 to 0.72 kg CO2-eq kWh−1 in 0.005 steps, with the three published national factors inserted as exact grid points, rather than adopting a single national value.
The interval reported in Section 4 is not a subrange of that sweep chosen after the fact. Its endpoints are values the Colombian authorities themselves publish for the same grid, for different purposes. The lowest, 0.164 kg CO2-eq kWh−1, is the unified generation emission factor of the national interconnected system agreed by the ministry of mines and energy, the planning unit and the system operator for corporate carbon-footprint accounting [58]. The highest, 0.660 kg CO2-eq kWh−1, is the combined-margin factor the planning unit publishes for exactly the calculation performed here—the emissions displaced by a new wind or solar project [57]—and the same source reports an annual average of 0.220 for inventory purposes.
Two comparisons can be made with these three numbers and they are not the same comparison, so we report both. Within a single reporting year, the annual average and the combined margin published by the same institution for 2024 differ by a factor of 3.0, and that ratio isolates the effect of the accounting convention alone. Across the full set of factors currently in force, which is what an analyst actually faces when choosing one, the range is a factor of 4.0, and it compounds the convention difference with four years of change in the generation mix. The 3.0 figure is the like-for-like result and we lead with it; the 4.0 figure describes the choice set. We also note that the direction of the gap is not a discovery, and that its magnitude has a specific and generalisable cause. A combined margin is by construction higher than an average over dispatched generation, because it is built from operating- and build-margin components under the methodology of the UNFCCC tool for electricity system emission factors [87], and that tool’s operating margin excludes must-run generation. In a system where hydroelectricity supplies the large majority of output and is dispatched must-run, the average therefore includes a body of near-zero-carbon generation that the operating margin removes by design—which is why these two conventions separate by a factor of three rather than by a few per cent. The consequence generalises beyond Colombia: any hydro-dominated grid will show a gap of this order between the two conventions, and a carbon payback time reported without naming which convention produced it is uninterpretable in such a system. What is specific to Colombia is that both figures carry official standing for the same grid in the same year.
We record the methodological tension in this step rather than leave it to a reviewer. Displaced generation is by construction a consequential question, while both published factors are attributional constructs: the 0.164 figure is an average over dispatched generation and the 0.660 figure is a combined margin built for project crediting, not a marginal factor derived from a dispatch model. Heijungs [88] sets out precisely why marginal and average quantities cannot be substituted for one another in this position, and hourly attributional grid assessments [89] show what the alternative requires. Our claim is therefore deliberately weak in form and strong in consequence: we do not assert a marginal emission factor for the Colombian grid; we show that two factors its own institutions publish for this system in the same year differ by a factor of three, that the full set in force spans a factor of four, and that the indicator inherits that spread whole. Resolving which is correct requires hourly dispatch data coupled to a measured generation series—which is the coupling this infrastructure exists to make possible.
The calculation script and its full audit trail are provided as supplementary material.
4. Results
4.1. The Indicator System and Its Observability
The screening funnel is shown in Figure 7a. Of 144 candidates, 23 were carried through to full technical data sheets: nine environmental and fourteen social.
Two counts in that funnel need reconciling, and we do so here rather than leave a reader to find the discrepancy. The indicator deliverable itself states that nine environmental and ten social key indicators were documented in a homogeneous format, and then presents nine environmental and fourteen social data sheets; the closing report repeats the nineteen. The 23 sheets are not the arithmetic product of the validation branches. Fourteen of the fifteen social indicators that both branches scored carry a data sheet; the one that does not is local employment creation, which the technical screening ranked as of high importance and which the expert panel went on to rank second of fifteen. Data-sheet production and branch validation ran in parallel rather than in sequence, and the nineteen originates in the indicator deliverable rather than in a later editorial consolidation, which locates the inconsistency inside a single source document. We report the 23 sheets because they are the documented artefacts, and flag the anomaly here, in the caption of Figure 7 and in the supplementary workbook.
Table 4 reports the environmental subset with the two attributes on which the argument of this paper turns—whether the indicator can be modelled in openLCA, which is recorded in the technical screening table of the project record, and its observability from IoT instrumentation, which we assign here as a contribution of this paper. Three of the nine documented indicators—human health, resources and biodiversity loss—are endpoint or ecosystem categories that entered the set after the screening stage and therefore carry no recorded modellability attribute; we mark them as such rather than infer one.
4.2. Two Prioritisations of the Same Set, and Where They Part
Both branches produced numeric scores, and Table 5 sets them side by side for the fifteen social indicators put to both in the same wording, on the utility-scale track—the case in which the great majority of Colombian photovoltaic capacity is being built. Two properties of that comparison must be stated before any statistic is read from it.
The two branches shared indicator wording but not elicitation construct. Experts placed each indicator on a two-axis matrix against four criteria and we average those criterion-level scores into a grand mean; the community groups produced a single consensus rating of pertinence and approval. A composite of technical adequacy is therefore being set against a single approval judgement, and the source workshop report is explicit that the community valuations were not mediated by technical criteria. And the community branch produced one social ranking, not two: the pooled community column of Table 5 is the same vector in both of the track comparisons below, and only the expert column changes between them. What varies across tracks is the expert prioritisation, not the community one.
The Global Rank Correlation Is an Absence of Resolution, Not a Measured Null
Spearman’s rank correlation between the expert utility-scale ranking and the pooled community ranking is (, 13 degrees of freedom, ; permutation ; bootstrap 95% CI ). Substituting the expert energy-community ranking against the same community vector gives (). We do not claim from this that project type moderates expert–community alignment, for three reasons that we set out together because each alone would be easy to discount.
First, the two coefficients are not formally distinguishable. Because they share the community vector, the appropriate contrast is Steiger’s test for dependent overlapping correlations [93]: , 12 degrees of freedom, ; an independent-samples Fisher z gives . Neither rejects equality.
Second, the two track-matched sensitivity checks are not symmetric in what they do to the result. Restricting the community column to the two utility-scale groups moves the utility-scale coefficient from to (); restricting it to the single group that scored the energy-community case moves that coefficient from to (). The energy-community agreement depends on pooling two utility-scale groups into a comparison about energy communities, and we do not report it as a measured agreement. It is fragile to single indicators as well: omitting occupational health and safety gives (), omitting cultural heritage ().
Third, and most restrictive, the community instrument cannot produce a strong positive coefficient on the utility-scale track at all. The pooled community column resolves to five distinct values across fifteen indicators with a seven-way tie at the ceiling, and the utility-scale-only column to three distinct values with a ten-way tie. Breaking those ties at random (50,000 draws, expert column held fixed) puts the empirical range of at for the pooled column and for the utility-scale-only column; solved exactly rather than sampled, the attainable extremes are and , so is not reachable under any tie-breaking. The observed sits in the middle of the only band the instrument can generate, so testing it against a null of tests a hypothesis the instrument could not have rejected in the informative direction. We report it as an absence of resolution and rest no claim on it.
What the Data Do Support: Displacement Is Ordered by Stakeholder Category
The substantive question in this comparison is not how strong a global association is but which indicators move, and in which direction. That question is testable, and unlike the global coefficient it is answerable at . We map each of the fifteen indicators to a stakeholder category of the UNEP framework [59,60]; the crosswalk is our own, was fixed before the test was run, and is printed in Table 5 and in full, with subcategories, as Table S12. Ordering the three categories by proximity to the firm’s internal sphere—Society, then Local community, then Workers, from the outermost category to the innermost—and correlating that order against the rank displacement gives Kendall’s (; permutation , 20,000 draws). The category means of are for the two Society indicators, for the ten Local community indicators and for the three Worker indicators. Since rank is the community rank minus the expert rank and rank 1 is the highest priority, a negative mean means the communities moved that category up: the communities up-prioritise an indicator the further its category lies from the firm’s internal sphere, and down-prioritise it the closer it lies. The two Society indicators are the two the communities up-prioritise most (Mann–Whitney , exact ; with two indicators against thirteen, is the smallest two-sided exact value the design can produce, so this is a statement that they are the two lowest of the fifteen and not a measure of effect size). The largest displacement in the other direction is occupational health and safety, a Workers indicator, at .
Because the crosswalk is ours, its sensitivity is the property that matters, and we report it in both directions rather than only the favourable one. Three of the fifteen assignments are contestable. Access to social benefits and social security can be read as a Workers subcategory rather than a Local community one. And the two indicators that carry the result, grievance mechanisms and access to project information, which we place in Society, have the weakest support of the fifteen: UNEP has no grievance-mechanism subcategory, “transparency” is a Consumers subcategory in that framework, and the subcategory labels we give them in Table S12 are our extensions rather than UNEP names. A reader could reasonably place both under Local community and community engagement instead. Table 6 gives what each reading does.
Three things follow. The ordered result survives every single reassignment, with between 0.46 and 0.72 and all six readings nominally significant, the most adversarial of them at ; it does not survive the conjunction of the two most adversarial readings together, where falls to 0.32 (). It is also unaffected by the pooling objection that governs the rank correlations above: restricting the community column to the two utility-scale groups leaves (). And it is not carried by any one indicator—deleting each of the fifteen in turn leaves between 0.56 and 0.69, with permutation throughout—which is the sharpest contrast with , where two single deletions crossed . Jonckheere–Terpstra, the canonical test for an ordered alternative across groups, gives a one-sided permutation on the same data.
The honest summary is therefore an envelope rather than a p value: lies between 0.32 and 0.72 across every crosswalk we consider defensible, and is nominally significant under all of them but the most adversarial combination. We prefer that formulation because it is the one a reader can check, and because the pairwise contrasts within it are the fragile part—the Workers-versus-rest contrast moves from to on a single reassignment, while the ordered test does not. One further caveat belongs with the crosswalk itself: we fixed it before running the test, but a reader cannot verify that, and we offer Table S12, the alternative assignments of Table 6 as encoded in File S14, and its runnable form in place of an assurance that cannot be checked.
The direction of the displacement is not the one a deficit model would predict. The experts’ top four are formal labour conditions, local employment creation, training, and occupational health and safety—three of them, under the crosswalk, indicators of how a firm conducts itself towards its own workforce. The communities placed occupational health and safety fourteenth of fifteen, and we attribute the reason precisely because the record is thinner than a plural would imply. Two of the three groups scored the indicator and they disagreed: one utility-scale group scored it 3, recording that the indicator is held to apply exclusively to personnel contracted by the project, so that its definition and enforcement are the executing company’s responsibility and not something the community should be asked to arbitrate; the energy-community group scored it 5, on the unrelated ground that the project benefits the community through energy savings. The mean of 4.00, the fourteenth rank and the displacement—the largest positive displacement in the analysis—are therefore a two-group mean over a disagreement, and the boundary reading is one group’s. We give it because it is the only recorded reasoning that addresses the indicator’s scope, and because it is not a misunderstanding of the indicator but a claim about who is accountable to whom. We note that the project’s own workshop report reads the same kind of low score, in another group, as evidence of misinterpreted information; we read it differently, and we mark the attribution rather than let a single group’s reasoning stand as the communities’.
The mirror of it is sharper, and here the scores are unanimous even where the reasoning is not. Grievance and remedy mechanisms rank last of fifteen for the experts and are scored 5 out of 5 by every community group without exception; access to environmental and social information ranks twelfth for the experts and, again, 5 out of 5 unanimously. One group recorded why, on both indicators: complaints go unanswered and it is unclear how to reach the mechanisms at all, and access to project information is described as nil. A second group’s note on grievance mechanisms is different in kind—training is needed in energy governance, finance and conflict resolution—and the third recorded no observation on either. The unanimity is in the scores; the explanation quoted here is one group’s, and we say so. What survives the attribution is the pattern: the two indicators that describe the community’s own channels of recourse and information—the ones through which any of the other thirteen could be contested—are the two the expert panel ranked lowest and the two the communities raised most.
Qualifications
Five qualifications belong with this result rather than in a later section.
The community instrument saturates. Thirty-five of the forty-four individual social scores are the maximum value (79.5%) and seven of the fifteen pooled means sit exactly at the ceiling; the pooled social mean is 4.67 across the fifteen indicator means, 4.68 across the forty-four group-level scores. The consequence for the rank correlation is quantified above.
The expert composite is not internally coherent, and averaging its four criteria needs a caveat we did not anticipate having to give. Cronbach’s over the four criteria is 0.73 on the utility-scale track and 0.52 on the energy-community track, and the two criteria that most resemble importance judgements—contextual pertinence and socio-environmental impact—are rank-orthogonal ( utility-scale, energy community). Restricting the composite to those two criteria gives () on the utility-scale track and () on the energy-community track: whatever the latter measures, it is not agreement about importance.
The respondent numbers are small and their denominators matter. The expert workshop recorded thirty-three attendees, of whom fifteen completed the registration form; the two utility-scale social momentos drew three respondents each and the two energy-community momentos four and six. On the community side there are three group consensuses per indicator, two for occupational health and safety. This is a structured elicitation, not a survey, and we draw no population inference from it.
Two facilitation features of the community workshop bear on the score distribution, and both are recorded in the workshop report. The session opened with ground rules that included an invitation to be propositive rather than to focus on complaints, which may have shifted scores upward and away from critical low values—a caveat that bears directly on a result about grievance mechanisms. And the energy-community working group was reduced to three participants by an intermunicipal transport stoppage that delayed the remaining participants by about three hours; the report records that these participants initially could not relate several indicators to their situation and were re-oriented with future-framing prompts before scoring, and that some of their answers were limited by that condition. That group is pooled into the community column, and it is the one group of the three with no direct experience of an operating utility-scale plant.
Finally, the two branches met four days apart, with different facilitators and a different instrument, so an instrument effect cannot be separated from a genuine difference in standpoint. What survives all five qualifications is the ordered pattern itself: the mechanisms of accountability at the ceiling for one branch and at the floor for the other is not an artefact that a finer scale would remove.
The Environmental Dimension: An Instrument Asymmetry, Not a Divergence
On the environmental side the two branches cannot be compared in the same way, and the reason is a design decision that we report as such. The experts scored the full seventeen-indicator midpoint set. The community instrument was re-expressed as nine plain-language categories, and energy payback time, carbon payback time, cumulative energy demand, land occupation and the endpoint categories were not among them. The communities did not de-prioritise those indicators; they were not asked about them.
What the community instrument does show is a much more discriminating and much more negative response than the social one: the mean environmental score is 2.85 of 5 against 4.67 for the social indicators, and only 25.9% of scores are at the ceiling against 79.5%. Water use is scored 1 of 5 by all three groups. The written justifications attach the low scores to two different things, and the distinction matters. One of the two groups scoring an operating utility-scale park records the absence of information rather than the absence of impact—“we do not know how much the project uses”, “we do not know” about minerals and metals; the other recorded no observation on those categories. For the energy-community group the recorded reason is different: cultural heritage, animal loss, water use and fossil fuel use were judged not pertinent to community-owned generation at all. The high scores, by contrast, attach uniformly to directly observed effects: crop damage, reduced fauna, altered rainfall, airborne particulates from earthworks, road damage from construction traffic.
Three midpoint categories of the technical screening—tropospheric ozone formation, acidification and particulate matter—have no unique counterpart in the community list and may all be subsumed in the single category “clean air”. The source record does not say, and we do not resolve it.
We take the asymmetry to be informative rather than merely regrettable. A nine-category instrument in plain language is what made a five-hour in-person workshop with forty-three participants produce scored, justified data at all, and the trade is legibility against comparability. But it means that the environmental prioritisation reported by this project is an expert prioritisation, and any claim that communities ranked environmental indicators should be read at the resolution of the instrument they were actually given.
This is not a failure of the participatory process, and it is not a knowledge deficit either. It is a measurable difference between the units in which an impact assessment method expresses itself and the units in which an affected population experiences a project, compounded by a difference in what each group takes the object of accountability to be. It has a direct consequence for platform design: an indicator system that serves regulator, developer and community simultaneously cannot be a single list. The platform therefore stores each indicator with an explicit formula and typed inputs, so that the same underlying measurement can be surfaced through different framings without being recomputed from scratch.
4.3. What Static Assessment Structurally Cannot Deliver
The most consequential result is visible in the last two columns of Table 4 and in full in Table S2. Of seventeen environmental indicators screened by the technical team, exactly two are recorded as not modellable in openLCA: energy payback time and carbon payback time. The claim needs stating precisely, because a looser version of it is false. Both quantities can be and routinely are computed with openLCA in the loop—Shah et al. [94] divide an openLCA-derived cumulative primary energy demand by an insolation-derived annual yield, and An et al. [47] compute energy payback time on an IoT platform. What openLCA cannot do is return either as an impact-assessment result, because neither is a characterised elementary-flow quantity: their denominators are generated electricity rather than inventory flows. In practice they are therefore computed outside the engine, against an assumed yield—which is exactly the assumption that instrumentation removes, and exactly the assumption whose cost Section 3.10 quantifies. We also note the provenance of the screening verdict itself, and one discrepancy inside it. “Not modellable” is a judgement recorded by the project’s technical team in its indicator table, not a property of the software certified by its developers. And the count the expert panel was briefed with on the day of the workshop was three, not two: the workshop report records fourteen indicators presented as directly modellable and three as not, the third being cumulative energy demand, which the indicator table marks as modellable and which we report as modellable throughout. We cannot resolve which reading the panel applied when it scored, and we flag it because the panel’s scores are evidence in this argument. The two indicators the argument turns on are unaffected: energy and carbon payback time are recorded as not modellable in both the table and the briefing. Both sit in the highest of the three recorded relevance classes, which holds seven of the seventeen and of which the other five are modellable. And the expert panel, scoring the same seventeen independently, placed those two second and third for utility-scale plants—behind only greenhouse gas emissions—and fourth and fifth for energy communities (Table 7). So the claim is not that they are uniquely relevant; it is the narrower and more awkward one that among the indicators the participants themselves rank at the top, the two that a database-driven workflow cannot produce at all are there by construction.
The disaggregation points the same way, with a caveat about its resolution. Across the four criterion-level scores retained for the utility-scale track, energy payback time is rated 9.25 on representativeness of the full life cycle, 7.88 on consistency with international frameworks, 6.88 on direct environmental relevance and 6.75 on applicability to primary and secondary data. Among the four criteria on which the indicator was scored, the one on which the experts rated it least favourably is the availability of the data it needs. That ordering rests on a 0.13-point margin on a 0–10 scale between two momentos of eight and four respondents, so we report it as indicative and rest no claim on it; it is not, and we do not say that it is, the lowest score any indicator received on that criterion, where energy payback time ranks sixth of seventeen. What the disaggregation does support is that the gap this infrastructure was built to close was named by the participants rather than asserted by us.
Both indicators, by the definitions this paper uses throughout,
are defined on electricity actually generated: is cumulative embodied primary energy, the grid primary-energy conversion efficiency that puts numerator and denominator on the same basis (Section 3.10), and the annual terms are measured output. A database-driven assessment can only supply that denominator by assumption; an instrumented system measures it directly. Two of the indicators the expert panel places at the top on both tracks are therefore precisely the two that the static paradigm cannot deliver as assessment results and that continuous measurement would render trivial—subject to the instrumentation gap recorded in Section 5.6, which is that no instrument specification or delivered-energy metering point exists for the series these two indicators require.
Figure 8 quantifies what follows. Panel (a) re-scales the harmonised reference values by Colombian irradiance and performance ratio. At the Caribbean site the mono-Si global warming potential falls from 35.8 to 24.5 g CO2-eq kWh−1, a reduction of 32%, and the non-renewable energy payback time from 1.00 to 0.68 years; in La Guajira the corresponding figures are 21.7 g CO2-eq kWh−1, a reduction of 39%, and 0.61 years. No inventory item changed. The entire effect is the denominator.
Panel (b) makes the temporal argument explicit. Carbon payback time depends not only on how much electricity a plant delivers but on what that electricity displaces, and in a hydro-dominated system such as Colombia’s that quantity swings with hydrology: in a wet regime the displaced electricity is largely hydroelectric and the avoided emissions are small; in a dry regime, or during an El Niño event, thermal plants set the margin and avoided emissions rise sharply. The point can be made without modelling that dispatch, because the Colombian authorities already publish factors that differ by this much. Taking the unified generation factor of 0.164 kg CO2-eq kWh−1 agreed by the ministry, the planning unit and the system operator [58], the mono-Si carbon payback time for the Caribbean scenario is 4.03 years. Taking the combined-margin factor of 0.660 that the planning unit publishes for exactly this calculation—the emissions displaced by a new wind or solar project [57]—it is 1.00 year. The annual average of 0.220 that the same document reports for inventory purposes gives 3.00 years. For one installation, at one site, with one inventory, the indicator ranges over a factor of 4.0 according to which official figure is used for the electricity displaced—and by a factor of 3.0 between the two figures the same institution publishes for the same year, which isolates the accounting convention from four years of change in the generation mix. A static, annually averaged assessment reports one of these numbers and conceals the other two. Section 3.10 sets out why none of the three is a marginal factor in the consequential sense, and why resolving that requires the coupled dispatch and generation series this infrastructure exists to make possible.
4.4. Validation of the Deployed System
Forty-five test cases were executed across functional, unit and integration levels, under either of the two partitions the source record gives for them (Section 3.9), with a 100% pass rate and no critical or blocking defects recorded. That pass rate carries the two qualifications set out there: four of the eighteen documented functional verdicts are limited to the interface layer, and no negative-access check—an attempt to reach another tenant’s resource, with the expected 401 or 403 captured—appears with an executed verdict, although positive isolation observations are recorded in three places. Code coverage reached 90% for unit tests and 87% for integration tests against an 80% threshold, measured over the controller layer and not over the mapping engine, the hash chain or the openLCA connector. The integration suite specifically exercises the two paths that matter for the data argument: device creation with synchronisation to the IoT platform, which completed in 5.2 s and confirmed correct token generation and association with the corresponding ThingsBoard customer; and telemetry retrieval, which completed in 3.5 s and confirmed correct key discovery, historical recovery, response structure and date filtering. Measured latencies elsewhere in the system were 1.8 s for device creation with remote registration and 2.5 s for telemetry queries returning more than a thousand records. System availability during the test period was 99.8%, mean cyclomatic complexity 8, and XML documentation coverage of public methods 95%. The availability figure is a property of the test environment, not of a production service.
No saturation was observed within the tested range (Figure 9). Mean response times were 390, 464, 395 and 411 ms at 500, 1000, 2000 and 5000 concurrent virtual users respectively, with a 0% error rate throughout and isolated latency spikes reaching 1300–1400 ms at the highest step. Three qualifications belong with these figures. Load was applied to the public landing endpoint with content delivery network caching listed conditionally among the preconditions, so what is being characterised is the cached edge as much as the application. The source itself notes that the five-second ramp-up for 2000 threads is aggressive and attributes the absence of degradation partly to caching. And the absence of an observed saturation point is not a reported result of the campaign but an inference from the four steps executed. We report these as evidence of headroom for the cached public endpoint, not as a characterisation of system capacity.
Heuristic inspection returned 29 passes, 8 failures, 6 not-applicable items and one item for which no result was recorded, over a 44-item checklist. All failures were of severity 1 or 2; none reached the major or catastrophic levels. The substantive findings concerned insufficient differentiation of clickable elements, absent confirmation messages before irreversible actions in the simulator, and the absence of a help and documentation section.
A separate figure is often read as belonging to this exercise and does not. The 95% implementation rate reported in Table 8 refers to the findings of the automated accessibility audit, which was carried out earlier in the design cycle; the heuristic inspection was conducted after the resulting second design iteration and still returned the eight failures above. The two should not be chained into a claim that the heuristic findings were 95% resolved.
4.5. Technology Prioritisation
Figure 10 and Table 9 report the CRITIC–TOPSIS result. Three criteria concentrate approximately half the objective weighting—interoperability and standardisation at 18.39%, environmental impact at 15.76% and ease of integration with existing systems at 15.69%, totalling 49.85%—which is itself informative: the institutions doing the scoring weighted the capacity of a system to connect to what already exists above the sophistication of what it computes.
Two of those three figures are the source’s own. The third is not, and we report the correction rather than the source value. Recomputing CRITIC from the published decision matrix, at the four-decimal precision given in Table S5—min–max normalisation, population standard deviation, weight proportional to —reproduces the interoperability and environmental weights exactly at 18.39% and 15.76%, which fixes the reconstruction, and returns 15.69% where the source reports 16.69%, a digit transposition. The correction leaves the “approximately half” statement intact and reverses the second and third places. The complete eight-weight vector, which the source does not publish, is given in Table S5, as are the closeness coefficients: artificial intelligence 0.958, big data 0.775, IoT 0.639, distributed ledgers 0.553, cyber-physical systems modelling 0.505 and digital twins 0.000, the last exactly zero because it is the anti-ideal on all eight criteria. The ordering is unchanged by the weight correction and survives even equal weighting. We draw the obvious moral in Section 5: a derived indicator published without its inputs cannot be checked, and this one was checkable only because the decision matrix was published alongside it.
The ordering places artificial intelligence first, big data second and IoT third, with distributed ledgers fourth, cyber-physical systems modelling fifth and digital twins last, the latter scoring lowest on every criterion. The recommended deployment sequence inverts the top of that ranking: IoT and big data are to be built first, because artificial intelligence consumes the data they produce, and provenance mechanisms are layered across the whole. This inversion between analytical desirability and constructional order is, in our reading, the practical lesson of the exercise, and it is consistent with the gap analysis of Section 2: the binding constraint in this field is data availability, not algorithmic capability.
5. Discussion
5.1. Infrastructure as the Binding Constraint
The dynamic LCA literature has spent fifteen years making time tractable. The results reported here suggest that the remaining obstacle is not temporal resolution but data supply. Cornago et al. [12] measured this directly: 93% of dynamic inventory studies are white-box models. Our experience is consistent. The methodological apparatus for temporal differentiation exists and is open source [7,8]; what does not exist, in the photovoltaic sector, is the routine institutional machinery that produces a measured, unit-consistent, provenance-carrying series in the first place. The system reported here is an attempt to supply that machinery rather than to extend the method.
This framing also sets the boundary of the claim. Following Sohn et al. [23], what we describe is not a partial dynamic LCA but an infrastructure designed to support one, with a dynamic foreground inventory; no telemetry has yet entered an inventory, the characterisation stage would in any case remain static, and extending it to dynamic characterisation factors [5,29] is future work rather than a property of the present system. Following Vyrkou et al. [25], the system is not a real-time LCA: telemetry is ingested continuously by design, but impact assessment is run on demand.
5.2. The Denominator Is the Measurement
The re-scaling exercise of Section 4 is arithmetically trivial, and that is the point. A 32% reduction in reported global warming potential at the case-study site, and a 39% reduction in La Guajira, arise from changing nothing except the electricity the same equipment delivers. Set against Mariutti’s [16] finding that published manufacturing footprints span 400 to 3000 kg CO2-eq kWp−1, and Bhandari and Sekimuli’s [11] observation that most studies do not normalise by lifetime generation at all, the implication is that a meaningful fraction of the apparent disagreement in the photovoltaic LCA literature is a measurement problem in the denominator rather than a modelling disagreement in the numerator. Instrumentation addresses that fraction directly.
The carbon payback result is stronger still, because it is irreducibly temporal. A factor of 3.0 between two emission factors published by the same Colombian institution for the same grid and the same year—and 4.0 across the full set in force—is not a sensitivity band around a central estimate; it is a statement that the indicator has no well-defined value independent of what the electricity displaces and when. In systems with a stable fossil margin this matters less. In a hydro-dominated system subject to El Niño cycles it dominates. Any annual-average figure for carbon payback in such a system is an artefact of aggregation, and the practice of reporting one is a methodological choice that the availability of hourly dispatch data no longer requires.
There is a methodological flank here that we would rather name than have named for us. Asking what a new plant displaces is a consequential question, and neither of the published factors we use is a consequential answer: one is an average over dispatched generation and the other a combined margin constructed for project crediting. Heijungs [88] shows why marginal, average and average-marginal quantities carry different meanings in exactly this position and cannot be exchanged, and the hourly attributional treatment of the Italian grid by Cortés Castelblanco et al. [89] demonstrates what a temporally resolved alternative requires in data terms. Our argument does not depend on resolving that choice. It depends on the weaker and more robust observation that the institutional record itself contains a four-fold spread, so that any single reported value for carbon payback in Colombia is a selection among official figures rather than a measurement—and that closing the question requires hourly dispatch coupled to a measured generation series, which is the coupling this infrastructure exists to enable and, as the next subsection concedes, does not yet perform.
5.3. Translating Between Impact Categories and Lived Experience
The disagreement between the expert and community rankings is, we think, the finding with the widest application beyond this case, and it is not the disagreement we expected to find. Both branches scored the same fifteen social indicators. Both were competent within their own frame. Their rankings carry no detectable rank association (), but that coefficient is not the result: as Section 4.2 shows, the community instrument could not have produced a strong positive coefficient on this track whatever the communities thought. The result is the structure of the displacement, which is ordered by stakeholder category (, ).
The direction of that ordering is what makes it interpretable, and Section 4.2 sets out the evidence for it. Read together, the two rankings are not two lists of impacts. They are two answers to the question of who is accountable to whom: experts scored a monitoring system that reports on the firm’s conduct, communities one that gives them a channel through which that conduct can be contested. The displacement is monotone in the stakeholder axis, and in the direction that reading predicts: the further a category lies from the firm, the more the communities raise it relative to the experts, and the closer it lies, the more they lower it. A deficit model predicts neither.
This is not a knowledge deficit to be corrected by communication, and it is not a defect in either instrument. Bouillass et al. [64] converge their participatory prioritisation on a single subcategory set; running two branches without reconciling them is what made the disagreement visible at all. We state this as a methodological recommendation rather than as a circumstance of our case: in a participatory social assessment with more than one constituency, non-reconciliation should be a declared protocol choice, and the divergence between branches should be reported as an output of the assessment rather than resolved away in the aggregation step. A protocol that dissolves it discards what is arguably its most useful product. Osorio et al. [65], working at the community rather than the product-system level in rural Colombia, reach an analogous conclusion from a different direction. The design implication is architectural: an indicator is stored as a formula over typed inputs, so that a single measured series can be surfaced as a midpoint category for a regulator and as a perceptible quantity for a community without the two being separate data. But the result above suggests the harder requirement is not translation of units at all—it is that a platform serving all three audiences has to carry the recourse and information indicators as first-class objects, not as metadata about the others. Whether the resulting translation is faithful is an open question we cannot settle from the material reported here, and it deserves dedicated study.
A small demonstration of the argument
One episode in the preparation of this paper illustrates the thesis more economically than the argument does. The technology prioritisation of Section 4 reports three CRITIC weights and a ranking, and its source deliverable publishes the decision matrix they were computed from. Recomputing the weights reproduces two of the three exactly and returns 15.69% where the source reports 16.69%, a digit transposition that had propagated into a project document and, in an earlier draft, into this manuscript. The error was detectable for one reason only: the inputs were published beside the result. Had the deliverable reported the weights alone—as it does for the closeness coefficients, which are not recoverable from anything it publishes—the transposition would have been permanent and invisible. A derived indicator without its inputs cannot be checked by anyone, which is the same property that makes a self-reported semi-annual environmental figure unauditable, and the same property that hash-chained provenance over typed inputs is meant to remove. We report the correction rather than quietly adopt the corrected number, and publish the full weight vector and the recomputed coefficients in Table S5.
5.4. Sovereignty, and What an On-Premise Architecture Costs
The decision to run the evidence path entirely on the regulator’s own infrastructure departs from the cloud-first pattern of the published platform literature, and it was taken on data sovereignty grounds. We are precise about its scope. Ingestion, semantic normalisation, the provenance chain, the warehouse and the openLCA connector—everything reported in this paper—run on the authority’s infrastructure. The wider platform carries external dependencies that we report rather than omit: identity through Microsoft Entra ID, productivity through Microsoft 365, business intelligence through embedded Power BI with directory authentication, mapping through ArcGIS, and the conversational assistants through the WhatsApp Business API, a commercial text-to-speech service, an n8n orchestrator and a cloud speech-recognition API that transcribes the voice reports citizens submit. The last of these deserves naming rather than aggregating: community audio leaves the agency’s infrastructure to be transcribed. The load campaign also lists content delivery network caching conditionally among its preconditions. The sovereignty argument applies to the evidence path, not to every module. Within that scope it carries real costs, which we report rather than minimise: no distributed pipeline was available, so extraction runs as scheduled cron jobs rather than under a managed orchestrator; horizontal scaling depends on the institution provisioning further instances; and operational continuity depends on a service-level agreement rather than on a provider’s redundancy. Against this, the arrangement places custody of the evidence with the body that has the statutory mandate to act on it, and it removes a dependency that, in a jurisdiction where environmental data are already contested, would itself become an object of dispute. For infrastructure whose purpose is to be believed by parties who do not trust each other, we judge that trade to be correct, and we note that it is rarely available to report because most published platforms are not deployed inside a regulator. The closing report of the contract records the resulting separation—a public and a private front end, a management API, a calculation API bound to openLCA and a traceability API—among the project’s key lessons. That document is our own: it is authored by the executing team and reviewed by the corresponding author, so we cite it as a considered self-assessment rather than as external validation.
We are equally precise about what “deployed” means here, because the word does a lot of work in this literature. The closing deliverable of the contract records the platform as deployed, published and operating in the production environment provided by the authority, addressable at five institutional endpoints under the agency’s own domain, with a signed service-level agreement and a support and maintenance plan running from 1 May to 31 October 2026 that carries a minimum availability target of 99% in business hours and a service-level response compliance target of 95%. We give the dates because the commitment is bounded: it covers the six months following the handover and not the operating life of the system. Custody of the accesses, credentials, databases and server configurations sits with the institution’s technology office, to which the system was transferred under a handover record, a systems reception record and a documentation acceptance record. Knowledge transfer is documented at the same scale: 102 technicians trained and certified, seven transfer workshops with 116 users, seven dissemination sessions reaching 190 people, and a public online course.
What we do not claim is field validation, and one boundary needs stating precisely because the words “deployed” and “validated” would otherwise be read as applying to the same system. They do not. The entire validation record of Section 4 was captured in October 2025 against the project’s own site, not against the institutional endpoints: the test deliverable references that site throughout and does not reference the agency’s domain once. No test in the record was executed after the transfer to the production environment, no post-deployment verification is documented, and we therefore make no claim about the behaviour of the production instance. No sensors are installed on an operating utility-scale plant, no field telemetry has entered the inventory, and the availability, response-time and coverage figures reported in Table 8 are properties of the pre-transfer test environment rather than of the production service. Nor is there a publicly inspectable instance or a code release: the endpoints are institutional and access is controlled by the authority. The sovereignty argument needs the deployment claim and not the field claim, and the record supports exactly that distribution.
5.5. Regulatory Trajectory
Two European instruments establish that verifiable, LCA-derived declarations are becoming a condition of market access rather than a voluntary disclosure. The batteries regulation [95] already requires an LCA-based carbon footprint declaration and a digital passport, phased from 2027; the ecodesign regulation [96] generalises the passport instrument across product categories. Jensen et al. [97] set out what such a passport requires of the underlying data, and the requirement is continuity and traceability rather than volume. Ihoume et al. [55] argue that photovoltaic LCA is not currently transparent enough to meet that standard. What does not yet exist, for photovoltaics, is infrastructure that can generate the underlying data continuously, auditably and without self-declaration. The system reported here is a proof of concept for that infrastructure, developed in a jurisdiction outside the European regulatory perimeter and therefore without its compliance pressure, which we take to strengthen rather than weaken the transferability argument. The regional literature supports that reading from the other side: Ruiz Cardona and González Escobar [1] argue that in Latin America’s extractive economies the binding constraint on a just transition is territorial and institutional rather than technical, and Sagastume Gutiérrez et al. [2] document how far Colombia’s official projections diverge from what the transition would actually cost. An evidence infrastructure held by the authority, rather than by the developers it regulates, is a modest but concrete response to the first of those findings.
5.6. Limitations
We state the limitations of this work plainly, because several of them bear directly on how its claims should be read.
No field deployment on an operating plant. The sensor layer is specified, and the device registration, telemetry ingestion and normalisation paths are exercised in integration tests against a live IoT platform instance, but no sensors have been installed on an operating utility-scale solar plant. The system is a functionally complete prototype validated in a controlled institutional environment, not a field-validated monitoring installation.
No instrument specification exists for irradiance or delivered energy, which the payback indicators require. This is the limitation that bears most directly on the argument of the paper, and we state it at the level at which it is true. Solar radiation is named among the variables prioritised for field instrumentation in the emerging-technologies deliverable, alongside ambient temperature, humidity, atmospheric pressure, wind speed and direction, noise and structural vibration, and it appears again in the environmental variable list of the technology roadmap. What the record does not contain is an instrument specification for it: no pyranometer or reference cell is named anywhere in the deliverables we hold, no accuracy class or IEC 61724-1 [75] conformity is stated, no plane-of-array configuration is defined, and no metering point for active power or delivered energy is specified at all. Energy and carbon payback time are defined on generated electricity, so the sensor layer as specified would not, on its own, produce the denominator on which Section 4 and Section 5 turn—an irradiance series without a delivered-energy series is not sufficient. What the platform does supply is the path by which such series would be ingested, normalised, versioned and hash-chained once they exist, which is a real contribution but a different one from measuring them. Closing this is the immediate requirement rather than a distant one: a class-B or better irradiance sensor in the plane of array and inverter-side energy metering conforming to IEC 61724-1, integrated through the same connector and dictionary already exercised for the ambient variables. Until that is done, the claim this paper supports is that the infrastructure removes the obstacles between a measured generation series and a dynamic inventory, not that it currently measures generation.
The telemetry-to-inventory coupling is not automatic. As Figure 4 records, the trigger for an openLCA run is a web form completed by an authorised user. The automatic mapping of normalised series onto inventory parameters is specified architecturally and is the single most important item of remaining work. Until it closes, the platform enables dynamic inventory rather than performing it end to end.
The platform does not fix a functional unit or an impact assessment method, although the project’s methodological framework does. The distinction matters and the two should not be conflated. The platform is multi-tenant: the impact assessment method is selected by the user from those available on the openLCA server—the deployment ships a 100 MW solar park product-system template and a national reference database in .zolca form—and the product system is configured per project, deliberately, so that it does not impose one methodological choice on every tenant. The project’s own LCA technical manual [69] is not so agnostic—it fixes one kWh of AC electricity delivered as the functional unit, selects ReCiPe 2016 v1.1 (hierarchist) with eighteen midpoint categories, and specifies comparison against a thermoelectric reference plant. The re-scaling exercise of Section 3.10 adopts that functional unit. What remains true is that the platform as software does not constitute a life cycle assessment, and that the re-scaling is a sensitivity analysis on published values rather than an assessment of a specific plant.
The provenance mechanism is not a distributed ledger, and its tamper-evidence is bounded by who holds it. It is a hash chain over a relational store with an anchoring interface exercised against a permissioned instance that the architecture record places on the authority’s own infrastructure. The record documents no smart-contract deployment and reports no gas or transaction cost, no distributed network is in operation, and end-to-end on-chain verification is not evidenced in the test record: the transaction identifier appears in the expected result of the functional test and not in the obtained one, the evaluator recorded that a capture of the verification viewer was not attached, and none of the five documented integration flows exercises the chain. The two deliverables also disagree—the emerging-technologies document reports ledger read and write as integrated, while the functional test record contains no such case—and we report the weaker of the two readings. The digest algorithm is not named anywhere in the record. Section 3.8 states what this does and does not establish.
Predictive models are not reported as results. Statistical and machine learning models were trained in laboratory conditions on open national market data and on parameters from the university’s own installed panels. No performance metrics were recorded, and the models are not in production. They appear here only as future work.
Load testing was partial. Percentiles, throughput and server resource utilisation were not instrumented; the 95th-percentile target is a design threshold, not a computed statistic. Load was applied to the public landing endpoint only, with content delivery network caching listed conditionally among the preconditions, not to authenticated or analytical routes, and no saturation was observed within the tested range, so the reported figures establish headroom rather than capacity.
The participatory result rests on small samples and unequal instruments. The per-indicator scores of both workshops are now available and are reported in Section 4.2 and as supplementary data, but three constraints limit what can be inferred from them. Respondent counts are small: three to eight per momento on the expert side, from a workshop with thirty-three recorded attendees, and three group consensuses per indicator on the community side (two for occupational health and safety), so this is a structured elicitation rather than a survey. Within-momento dispersion is not recoverable from the Mentimeter export, which returns momento-level means; what is available, and reported in Table 5 and Table 7, is the spread of each indicator across the criteria it was scored on. One expert momento—Colombian relevance against comparability, utility-scale track—recorded a single respondent and is excluded from every figure reported here, which means the environmental ranking rests on two of the three intended criterion pairs. And the community instrument saturates, with 79.5% of social scores at the ceiling, which bounds the attainable range of the rank correlation so tightly (Section 4.2) that the utility-scale must be read as an absence of resolution rather than as a measured null. The environmental dimension is not comparable across branches at all, for the instrument reasons set out in Section 4.2. The number of heuristic evaluators is likewise not stated in the record we hold.
The economic dimension is absent. The project documentation records that economic indicators were excluded because firms treat the underlying data as commercially sensitive. The system therefore covers two of the three pillars of sustainability assessment, and a full life cycle sustainability assessment is out of reach without a mechanism for handling confidential financial data.
The literature screening was structured, not systematic. The review underlying the indicator matrix followed documented search strings, databases and inclusion criteria, but no PRISMA counts were recorded, and we describe it accordingly.
Some reported figures are our own aggregates rather than source data. The 72 participants of Section 3, the 32 screened indicators, the 8500 load samples of Figure 9 and the registered-project counts of the introduction are sums and extractions we computed from figures the deliverables and the public registers report separately; the arithmetic is given in the supplementary workbook. The implementation-status column of Table 2 and the IoT-observability column of Table 4 are our assessments, not attributes recorded in the project record. We mark these rather than let them read as source data.
We correct the project record downwards in several places. The closing report of the contract declares 100% completion of all sixteen activities and contains no limitations section. Several statements in this paper—on production status, on the pipeline’s data source, on the instrumentation gap, and on the counts above—are more conservative than that document. Where the two differ, this paper is the more restrictive reading, and the deliverables are cited so that the difference can be checked.
6. Conclusions
We have reported the design and institutional deployment of an end-to-end data infrastructure that enables dynamic life cycle assessment of photovoltaic systems, and we have used the material it generated to make a specific argument about what static assessment can and cannot do.
Three findings stand. First, of the seventeen environmental indicators screened, exactly two—energy payback time and carbon payback time—cannot be obtained as impact-assessment results, because both are defined on measured generation rather than on inventory flows, and are in practice computed outside the assessment engine against an assumed yield. The expert panel independently ranked those two second and third of seventeen for utility-scale plants. Among the four criteria on which energy payback time was scored, the one on which the panel rated it least favourably is the applicability of the primary and secondary data it needs—indicatively, on a 0.13-point margin that we do not rest a claim on (Section 4). The static paradigm is structurally unable to deliver, from measurement, indicators that its own users rank at the top. Second, the consequences are large and quantifiable: harmonising reference values to Colombian irradiance reduces the mono-Si global warming potential by 32% at the case-study site and 39% in La Guajira with no change to any inventory item, and carbon payback time for a single installation varies by a factor of 3.0 across the two emission factors the Colombian authorities publish for the same grid and the same year—and by 4.0 across the full set of factors currently in force. Third, expert and community rankings of the same fifteen social indicators show no detectable rank association for utility-scale plants (), but their disagreement is ordered rather than arbitrary: the communities move an indicator up in priority the further its stakeholder category lies from the firm’s internal sphere and down the closer it lies (Kendall’s , ), with experts ranking the firm’s internal labour conduct highest and communities placing at the ceiling the grievance and information mechanisms the experts rank last and twelfth of fifteen. That is a design constraint on any platform intended to serve regulator, developer and community at once.
The contribution is one of infrastructure. Its distinctive elements are the versioned, operator-validated semantic normalisation layer that makes heterogeneous device fleets addressable through one vocabulary; the tamper-evident provenance chain that lets any party holding the records detect that an indicator has been altered or removed since computation, bounded by the fact that the custodian holds value, chain and verification alike; and the fact that the whole of that evidence path runs on the premises of the national authority that must act on the evidence, to which it has been handed over for production operation—the wider platform’s identity, productivity, business-intelligence, mapping and conversational modules excepted (Section 5).
The path forward is clear and is stated as such. Specifying and installing irradiance and delivered-energy instrumentation to a declared accuracy class is the first priority: solar radiation is named among the variables prioritised for the field deployment, but no instrument, accuracy class or metering point is specified anywhere in the project record, and the two headline indicators require both. Closing the automatic coupling between normalised telemetry and inventory parameters is the second. Beyond those: an integration test of the ledger-anchoring path with an attached verification capture, dedicated unit tests for the mapping engine, the hash chain and the LCA connector, deployment on an operating plant, incorporation of dynamic characterisation factors, hourly rather than annual grid emission factors for carbon payback, re-running the harmonisation on the 2026 IEA PVPS inventory, formalisation of the canonical dictionary against SSN, SOSA and SensorThings, and validation of the predictive layer against measured generation. Until those are done, the honest description of this work is that it builds the road rather than travels it. In a field where 93% of dynamic inventories are still modelled rather than measured [12], we would argue that the road is the scarce good.
Supplementary Materials
The following supporting information can be downloaded at the website of this paper posted on Preprints.org. Table S1: the 23 documented indicator data sheets, nine environmental and fourteen social, with every recorded field (indicator, definition, unit, calculation, data source, periodicity, scope, responsible entity and observations). Table S2: membership of each indicator across the technical screening and the two validation instruments, the machine-readable companion to Table 7. Table S3: the 26-indicator social long list classified by importance, from which the fifteen prioritised social indicators were drawn, with the screening’s applicability marks for the utility-scale and energy-community tracks. Table S4: the functional and integration test record, with verdicts and execution times, underlying Table 8, including the four functional entries whose verdicts are qualified to the interface layer. Table S5: the CRITIC–TOPSIS decision matrix, together with the complete eight-element weight vector and the six closeness coefficients as recomputed by us from that matrix, both labelled as recomputed and set beside the three weights the source publishes. Table S6: the interface protocol specification and the quantified non-functional requirements. Table S7: the canonical variable dictionary with worked mapping examples; the entries are illustrative of the mapping mechanism, the only canonical schema enumerated in the architecture deliverable is the wind instantiation of the same programme, and the deployed solar dictionary is held in the platform database. File S8: epbt_gwp_scaling.py, its output data files and the audit trail summary.txt, which records every intermediate value behind Figure 8 and permits its complete reproduction, including the degradation-aware carbon payback variant reported in Section 3.10. Folder S9: standalone TEX sources and compiled files for all ten figures. Table S10: the expert workshop scores as exported from Mentimeter—494 criterion-level means from the sessions of 19, 20 and 21 July 2025, of which the 21 July session alone underlies every derived figure, with session dates, respondent counts, momento and criterion labels—together with the derived per-indicator grand means, with their across-criteria minima and maxima, underlying Table 5 and Table 7. Table S11: the community workshop scores of 25 July 2025, transcribed from the workshop report, with the written justification recorded against each score. Table S12: the crosswalk from the fifteen social indicators to UNEP stakeholder categories and subcategories, as fixed before the ordered test of Section 4.2 was run, with the alternative assignment used in the sensitivity analysis marked. Table S13: the full robustness suite for the participatory analysis—all five rank correlations with permutation p values and bootstrap intervals, the Steiger and Fisher comparisons, the tie structure and attainable ranges under random tie-breaking, Cronbach’s and the inter-criterion correlation matrices, the criterion-restricted and leave-one-out correlations, the ordered stakeholder test under all seven crosswalk readings with Jonckheere–Terpstra, the track-matched ordered test, leave-one-out on the ordered test, the design’s exact resolution floor for the contrast, and the sensitivity of the environmental ordering to the 19–20 July sessions. File S14: S14_participatory_stats.py, which regenerates every figure in Tables S12 and S13 and every participatory number quoted in Section 4.2 and Section 6 from S10 and S11. File S15: S15_extract_annexes.py, which regenerates S10 and S11 from the source annexes.
Author Contributions
Conceptualization, J.A.T.G., V.J.O.O. and C.A.R.; methodology, J.A.T.G. and V.J.O.O.; software, V.J.O.O.; validation, M.J.C. and L.A.C.; formal analysis, V.J.O.O. and M.J.C.; investigation, V.J.O.O., M.J.C. and C.A.R.; resources, L.A.C. and J.A.T.G.; data curation, V.J.O.O.; writing—original draft preparation, J.A.T.G. and V.J.O.O.; writing—review and editing, C.A.R., M.J.C. and L.A.C.; visualization, V.J.O.O.; supervision, J.A.T.G. and C.A.R.; project administration, J.A.T.G. and V.J.O.O.; funding acquisition, J.A.T.G. All authors have read and agreed to the published version of the manuscript.
Funding
This research was funded by the Agencia Nacional de Hidrocarburos (ANH), Vicepresidencia Técnica, under Contract No. 515 of 2025 executed with Universidad del Magdalena (Resolución 0159 de 2025). The APC was funded by Universidad del Magdalena, with the 20% discount granted to invited authors of IOCEN 2026.
Institutional Review Board Statement
The study was conducted within the framework of ALUNA IA, an institutional initiative of Universidad del Magdalena that integrates engineering, artificial intelligence, environmental monitoring and participatory approaches in support of sustainable and regenerative territorial development, and it followed the ethical procedures established under that initiative. The research concerns the design, implementation and validation of an IoT data infrastructure for dynamic life cycle assessment of solar energy systems, including mechanisms for data traceability and cryptographic provenance. The community-engagement component is limited to participatory workshops convened to contextualise, discuss and validate indicators and their relevance to local stakeholders. The study involves no clinical or biomedical intervention, no collection of biological samples, and no experimental procedure affecting participants; ethical review and approval beyond the institutional procedures of the ALUNA IA initiative were therefore not required. That determination was made by the research team under those procedures rather than by a separate ethics committee, and no committee reference number exists; we state the basis explicitly so that it can be assessed. The principles of voluntary participation, transparency, respect, confidentiality and responsible data management were applied throughout all activities involving community members and other stakeholders. No personal or identifying data are reported in this article; all participatory results are presented in aggregate form.
Informed Consent Statement
Participation in every workshop and community activity was voluntary and unremunerated. At the opening of each session participants were informed of the purpose and scope of the activity, of the project and its funder, and of the intended use of the information generated. Attendance was recorded—automatically by the conferencing platform for the virtual expert workshop of 21 July 2025, and by a paper register annexed to the workshop report for the in-person community workshop of 25 July 2025—and those records constitute the documentary evidence of participation; a separate written informed-consent instrument was not administered, and we state this rather than imply a stronger process than the record supports. The activities were conducted under the institutional procedures of the ALUNA IA initiative of Universidad del Magdalena and the principles of voluntary participation, transparency, respect, confidentiality and responsible data management set out in the Institutional Review Board Statement. No personal or identifying data appear in this article; all participatory results are reported at group or aggregate level and no participant is identifiable from them. Participants were not asked to consent specifically to publication of their group-level scores, and we record that as a limitation. The attendance records are held by Universidad del Magdalena and are available from the corresponding author on reasonable request, subject to the data protection provisions of Colombian Law 1581 of 2012. The results reported here have not yet been returned to the participating community organisations in published form; a feedback session is planned and is not part of the record reported in this paper.
Data Availability Statement
The indicator matrix, the technical data sheets and the per-indicator scores of both participatory workshops that support the findings of this study are provided as Supplementary Materials, together with the UNEP stakeholder crosswalk (Table S12), the complete robustness suite for the participatory analysis (Table S13), the re-scaling script, the seeded statistical script that regenerates every participatory figure (File S14) and the workshop extraction script (File S15), with their outputs, so that every numeric result in Section 4 can be reproduced. The public modules of the project site are accessible at https://impact-energy.co; the production instance operated by the Agencia Nacional de Hidrocarburos is addressed under that institution’s own domain and access to it is controlled by the institution, so there is no publicly inspectable instance of the authenticated platform and no source release. Platform test telemetry and project-level records are held under the custody of the Agencia Nacional de Hidrocarburos and are subject to that institution’s data access procedures; they are not publicly redistributable by the authors.
Acknowledgments
The authors thank the technical teams of the Agencia Nacional de Hidrocarburos, the Unidad de Planeación Minero Energética, the Autoridad Nacional de Licencias Ambientales, the Instituto de Planificación y Promoción de Soluciones Energéticas and the Ministerio de Minas y Energía for their participation in the requirements and validation sessions; the cooperative COOMUSTIER and the community organisations of Magdalena and Cesar for their participation in the indicator validation workshops; and the software and data engineering team of the IMPACT Energy.CO project for the implementation work reported in Section 3. During the preparation of this manuscript the authors used a generative artificial intelligence assistant for language editing, for consistency checking of numeric values against the source deliverables, and for the extraction of tabular data from the workshop annexes into machine-readable form. The authors reviewed and edited all output and take full responsibility for the content of this publication.
Conflicts of Interest
L.A.C. is affiliated with the Agencia Nacional de Hidrocarburos, which funded this research and operates the deployed system. The remaining authors were contracted by that institution through Universidad del Magdalena. The authors declare that the funder participated in the requirements definition and validation of the system described, as documented in Section 3, and had no role in the analysis of the re-scaled indicators, in the interpretation of the prioritisation divergence, or in the decision to publish the results.
References
- Ruiz Cardona, M.C.; González Escobar, C.H. Territorial Energy Sustainability: A Framework for Just Energy Transitions in Latin America’s Extractive Economies—The Case of Colombia. Sustainability 2026, 18, 7266. [Google Scholar] [CrossRef]
- Sagastume Gutiérrez, A.; Cabello Eras, J.J.; Otero Meza, D.D. The Energy Transition in Colombia: Government Projections and Realistic Scenarios. Clean Technol. 2025, 7, 96. [Google Scholar] [CrossRef]
- Unidad de Planeación Minero Energética. Registro de proyectos de generación de energía eléctrica: informe de inscritos, cierre de abril de 2025. 2025). Available online: https://www.upme.gov.co/ (accessed on 5 September 2026).
- Ministerio de Minas y Energía de Colombia. Comunidades energéticas: reporte de postulaciones, corte de abril de 2025. 2025). Available online: https://www.minenergia.gov.co/ (accessed on 5 September 2026).
- Levasseur, A.; Lesage, P.; Margni, M.; Deschênes, L.; Samson, R. Considering Time in LCA: Dynamic LCA and Its Application to Global Warming Impact Assessments. Environ. Sci. Technol. 2010, 44, 3169–3174. [Google Scholar] [CrossRef]
- Beloin-Saint-Pierre, D.; Heijungs, R.; Blanc, I. The ESPA (Enhanced Structural Path Analysis) method: a solution to an implementation challenge for dynamic life cycle assessment studies. Int. J. Life Cycle Assess. 2014, 19, 861–871. [Google Scholar] [CrossRef]
- Pigné, Y.; Navarrete Gutiérrez, T.; Gibon, T.; Schaubroeck, T.; Popovici, E.; Shimako, A.H.; Benetto, E.; Tiruta-Barna, L. A tool to operationalize dynamic LCA, including time differentiation on the complete background database. Int. J. Life Cycle Assess. 2020, 25, 267–279. [Google Scholar] [CrossRef]
- Cardellini, G.; Mutel, C.L.; Vial, E.; Muys, B. Temporalis, a generic method and tool for dynamic Life Cycle Assessment. Sci. Total Environ. 2018, 645, 585–595. [Google Scholar] [CrossRef]
- Frischknecht, R.; Heath, G.; Raugei, M.; Sinha, P.; de Wild-Scholten, M. Methodology Guidelines on Life Cycle Assessment of Photovoltaic Electricity, 3rd edition; Technical Report IEA-PVPS T12-18:2020; International Energy Agency Photovoltaic Power Systems Programme, Task 12: Paris, 2020. [Google Scholar]
- Muteri, V.; Cellura, M.; Curto, D.; Franzitta, V.; Longo, S.; Mistretta, M.; Parisi, M.L. Review on Life Cycle Assessment of Solar Photovoltaic Panels. Energies 2020, 13, 252. [Google Scholar] [CrossRef]
- Bhandari, R.; Sekimuli, E. A Systematic Review on Environmental Life Cycle Assessment of Solar PV Modules. Sustainability 2026, 18, 4639. [Google Scholar] [CrossRef]
- Cornago, S.; Tan, Y.S.; Brondi, C.; Ramakrishna, S.; Low, J.S.C. Systematic Literature Review on Dynamic Life Cycle Inventory: Towards Industry 4.0 Applications. Sustainability 2022, 14, 6464. [Google Scholar] [CrossRef]
- da Costa, T.P.; Barbosa da Costa, D.M.; Murphy, F. A systematic review of real-time data monitoring and its potential application to support dynamic life cycle inventories. Environ. Impact Assess. Rev. 2024, 105, 107416. [Google Scholar] [CrossRef]
- Zhang, L.; Fröhling, M. Integration of blockchain and life cycle assessment: a systematic literature review. Int. J. Life Cycle Assess. 2025, 30, 1–19. [Google Scholar] [CrossRef]
- Xu, C.; Jia, T.; Qi, J.; Cai, Z.; Zhang, R.; Xiong, R.; Chang, H.; Lu, X.; Li, N.; Tian, J.; et al. Addressing critical challenges towards a robust data system for life cycle assessment. Nat. Rev. Clean Technol. 2025, 1, 788–800. [Google Scholar] [CrossRef]
- Mariutti, E. The Limits of the Current Consensus Regarding the Carbon Footprint of Photovoltaic Modules Manufactured in China: A Review and Case Study. Energies 2025, 18, 1178. [Google Scholar] [CrossRef]
- Taborda Giraldo, J.A.; Olivero Ortiz, V.J.; Robles, C.A.; Callejas, M.J.; Chia, L.A. An IoT-Enhanced Life Cycle Assessment Framework for Continuous Environmental Impact Monitoring in Solar Energy Systems. In Proceedings of the Proceedings of the 3rd International Online Conference on Energies (IOCEN 2026) Abstract Sciforum-170710. 12–15 May 2026, online, Basel, 2026; Available online: https://sciforum.net/event/IOCEN2026.
- International Organization for Standardization. ISO 14040:2006 Environmental management — Life cycle assessment — Principles and framework; 2006.
- International Organization for Standardization. ISO 14044:2006 Environmental management — Life cycle assessment — Requirements and guidelines; 2006.
- Finnveden, G.; Hauschild, M.Z.; Ekvall, T.; Guinée, J.; Heijungs, R.; Hellweg, S.; Koehler, A.; Pennington, D.; Suh, S. Recent developments in Life Cycle Assessment. J. Environ. Manag. 2009, 91, 1–21. [Google Scholar] [CrossRef]
- Pehnt, M. Dynamic life cycle assessment (LCA) of renewable energy technologies. Renew. Energy 2006, 31, 55–71. [Google Scholar] [CrossRef]
- Collinge, W.O.; Landis, A.E.; Jones, A.K.; Schaefer, L.A.; Bilec, M.M. Dynamic life cycle assessment: framework and application to an institutional building. Int. J. Life Cycle Assess. 2013, 18, 538–552. [Google Scholar] [CrossRef]
- Sohn, J.; Kalbar, P.; Goldstein, B.; Birkved, M. Defining Temporally Dynamic Life Cycle Assessment: A Review. Integr. Environ. Assess. Manag. 2020, 16, 314–323. [Google Scholar] [CrossRef]
- Beloin-Saint-Pierre, D.; Albers, A.; Hélias, A.; Tiruta-Barna, L.; Fantke, P.; Levasseur, A.; Benetto, E.; Benoist, A.; Collet, P. Addressing temporal considerations in life cycle assessment. Sci. Total Environ. 2020, 743, 140700. [Google Scholar] [CrossRef]
- Vyrkou, A.; Aryblia, M.; Savvakis, N.; Nicacio, I.; Siddique, O.; Arampatzis, G.; Angelis-Dimakis, A. Dynamic vs real time life cycle assessment. Clean. Environ. Syst. 2025, 18, 100296. [Google Scholar] [CrossRef]
- Salati, M.; Costa, A.A.; Silvestre, J.D. A Comprehensive Review of Dynamic Life Cycle Assessment for Buildings: Exploring Key Processes and Methodologies. Sustainability 2025, 17, 159. [Google Scholar] [CrossRef]
- Su, S.; Li, X.; Zhu, C.; Lu, Y.; Lee, H.W. Dynamic Life Cycle Assessment: A Review of Research for Temporal Variations in Life Cycle Assessment Studies. Environ. Eng. Sci. 2021, 38, 1013–1026. [Google Scholar] [CrossRef]
- Arias, A.; Feijoo, G.; Moreira, M.T. Dynamic life cycle assessment in environmental assessment of processes and products: A scoping review of sectoral applications, digitalization, decision support, and policy relevance. Environ. Impact Assess. Rev. 2026, 121, 108552. [Google Scholar] [CrossRef]
- Tiruta-Barna, L. Expanding the dynamic climate change impact model for dynamic LCA based on the climate science. Int. J. Life Cycle Assess. 2026, 31, 27. [Google Scholar] [CrossRef]
- Tao, F.; Zuo, Y.; Xu, L.D.; Lv, L.; Zhang, L. Internet of Things and BOM-Based Life Cycle Assessment of Energy-Saving and Emission-Reduction of Products. IEEE Trans. Ind. Inform. 2014, 10, 1252–1261. [Google Scholar] [CrossRef]
- Mashhadi, A.R.; Behdad, S. Ubiquitous life cycle assessment (U-LCA): A proposed concept for environmental and social impact assessment of industry 4.0. Manuf. Lett. 2018, 15, 93–96. [Google Scholar] [CrossRef]
- Ferrari, A.M.; Volpi, L.; Settembre-Blundo, D.; García-Muiña, F.E. Dynamic life cycle assessment (LCA) integrating life cycle inventory (LCI) and Enterprise resource planning (ERP) in an industry 4.0 environment. J. Clean. Prod. 2021, 286, 125314. [Google Scholar] [CrossRef]
- Trofimenko, I.; Chen, Y.; Müller, A.K.; Liebau, U.; Flore, A. Real-Time LCA/LCC Integration: A Framework of Agile Sustainability and Cost Management. Sustainability 2025, 17, 9433. [Google Scholar] [CrossRef]
- Albelwi, N. DT-LCAF: Digital Twin-Enabled Life Cycle Assessment Framework for Real-Time Embodied Carbon Optimization in Smart Building Construction. Sustainability 2026, 18, 2321. [Google Scholar] [CrossRef]
- Lindemann, M.; Jacobs, G.; Dreier, J.; Wischmann, S.; Höpfner, G.; Berges, J. Facilitating LCA During Product Development by Automated Inventory Model Generation Using SysML System Models. Sustainability 2025, 17, 4783. [Google Scholar] [CrossRef]
- Beltrán Castañón, N.J.; Chura Acero, F.; Ramos Cutipa, J.; Chayña Velásquez, O.; Shuta Lloclla, H.; Cruz Ticona, E. A Low-Cost Wireless Monitoring System for Photovoltaic Systems: Performance Analysis and Potential Application in Direct-Current Nanogrids. Energies 2025, 18, 2279. [Google Scholar] [CrossRef]
- Popowicz, M.; Katzer, N.J.; Kettele, M.; Schöggl, J.P.; Baumgartner, R.J. Digital technologies for life cycle assessment: a review and integrated combination framework. Int. J. Life Cycle Assess. 2025, 30, 405–428. [Google Scholar] [CrossRef]
- Haller, A.; Janowicz, K.; Cox, S.J.D.; Lefrançois, M.; Taylor, K.; Le Phuoc, D.; Lieberman, J.; García-Castro, R.; Atkinson, R.; Stadler, C. The modular SSN ontology: A joint W3C and OGC standard specifying the semantics of sensors, observations, sampling, and actuation. Semant. Web 2019, 10, 9–32. [Google Scholar] [CrossRef]
- Janowicz, K.; Haller, A.; Cox, S.J.D.; Le Phuoc, D.; Lefrançois, M. SOSA: A lightweight ontology for sensors, observations, samples, and actuators. J. Web Semant. 2019, 56, 1–10. [Google Scholar] [CrossRef]
- Open Geospatial Consortium. OGC 18-088; OGC SensorThings API Part 1: Sensing Version 1.1. Open Geospatial Consortium, 2021.
- Kuczenski, B.; Davis, C.B.; Rivela, B.; Janowicz, K. Semantic catalogs for life cycle assessment data. J. Clean. Prod. 2016, 137, 1109–1117. [Google Scholar] [CrossRef]
- Kuczenski, B.; Mutel, C.; Srocka, M.; Scanlon, K.; Ingwersen, W. Prototypes for automating product system model assembly. Int. J. Life Cycle Assess. 2021, 26, 483–496. [Google Scholar] [CrossRef]
- Ghose, A.; Lissandrini, M.; Hansen, E.R.; Weidema, B.P. A core ontology for modeling life cycle sustainability assessment on the Semantic Web. J. Ind. Ecol. 2022, 26, 731–747. [Google Scholar] [CrossRef]
- Kahn, E.; Antognoli, E.; Arbuckle, P. The LCA Commons—How an Open-Source Repository for US Federal Life Cycle Assessment (LCA) Data Products Advances Inter-Agency Coordination. Appl. Sci. 2022, 12, 865. [Google Scholar] [CrossRef]
- Vasheghani Farahani, J.; Treiblmaier, H. A Sustainability Assessment of a Blockchain-Secured Solar Energy Logger for Edge IoT Environments. Sustainability 2025, 17, 8063. [Google Scholar] [CrossRef]
- Chadly, A.; Hasan, H.R.; Moawad, K.; Salah, K.; Omar, M.; Mayyas, A. A blockchain-based solution for the traceability of rare earth metals used in thin-film photovoltaics. J. Clean. Prod. 2023, 428, 139399. [Google Scholar] [CrossRef]
- An, J.; Zou, Z.; Chen, G.; Sun, Y.; Liu, R.; Zheng, L. An IoT-Based Life Cycle Assessment Platform of Wind Turbines. Sensors 2021, 21, 1233. [Google Scholar] [CrossRef]
- Papadopoulos, C.; Bachoumis, A.; Skopetou, N.; Mylonas, C.; Tagkoulis, N.; Iliadis, P.; Mamounakis, I.; Nikolopoulos, N. Integrated Methodology for Community-Oriented Energy Investments: Architecture, Implementation, and Assessment for the Case of Nisyros Island. Energies 2023, 16, 6775. [Google Scholar] [CrossRef]
- Ahmad Affandi, N.A.; Ahmad Ludin, N.; Junedi, M.M.; Lim, C.H.; Purvis-Roberts, K. Analysing temporal factor in dynamic life cycle assessment of solar photovoltaic system. Sol. Energy 2024, 270, 112380. [Google Scholar] [CrossRef]
- Frischknecht, R.; Stolz, P.; Krebs, L.; de Wild-Scholten, M.; Sinha, P. Life Cycle Inventories and Life Cycle Assessments of Photovoltaic Systems; Technical Report IEA-PVPS T12-19:2020; International Energy Agency Photovoltaic Power Systems Programme, Task 12: Paris, 2020. [Google Scholar]
- Stucki, M.; Götz, M.; de Wild-Scholten, M.; Frischknecht, R. Environmental Life Cycle Assessment of Electricity from Photovoltaic Systems: 2023 Data Update. Technical report, International Energy Agency Photovoltaic Power Systems Programme, Task 12, Fact Sheet, Paris, 2024. [Google Scholar]
- Götz, M.; Deuber, R.; Gazbour, N.; Brailovsky, P.H.; Nold, S.; Marchand-Lasserre, M.; Frischknecht, R.; Khan, A.A.; Bovo, G. Life Cycle Inventories of Photovoltaic Systems. Technical Report IEA-PVPS T12-33-2026, International Energy Agency Photovoltaic Power Systems Programme, Task 12, 2026; ISBN 978-1-923734-08-1. [CrossRef]
- Sanseverino, E.R.; Cellura, M.; Luu, L.Q.; Cusenza, M.A.; Nguyen Quang, N.; Nguyen, N.H. Life-Cycle Land-Use Requirement for PV in Vietnam. Energies 2021, 14, 861. [Google Scholar] [CrossRef]
- Ren, M.; Mitchell, C.R.; Mo, W. Dynamic life cycle economic and environmental assessment of residential solar photovoltaic systems. Sci. Total Environ. 2020, 722, 137932. [Google Scholar] [CrossRef]
- Ihoume, I.; van Noord, M.; Augusto, A. Toward a transparent life cycle assessment of photovoltaic systems: Addressing regulatory and methodological challenges. Environ. Impact Assess. Rev. 2026, 118, 108290. [Google Scholar] [CrossRef]
- Sierra, D.; Aristizábal, A.J.; Hernández, J.A.; Ospina, D. Life cycle analysis of a building integrated photovoltaic system operating in Bogotá, Colombia. Energy Rep. 2020, 6, 10–19. [Google Scholar] [CrossRef]
- Unidad de Planeación Minero Energética. Factores de emisión del Sistema Interconectado Nacional (SIN) para el año 2024 Combined-margin factor for wind and solar projects 0.660 t CO2eq MWh-1; annual average for inventories 0.220 t CO2eq MWh-1; Technical report; Ministerio de Minas y Energía: Bogotá, 2025. [Google Scholar]
- XM S.A. E.S.P..; Unidad de Planeación Minero Energética.; Ministerio de Minas y Energía. Factor de emisión de CO2 por generación eléctrica del Sistema Interconectado Nacional: 164.38 g CO2 kWh-1. Joint technical communication of XM, UPME and the Ministry of Mines and Energy, reported in the UPME emission-factor series. 2020). Available online: https://www1.upme.gov.co/DemandayEficiencia/Paginas/Factores-de-emision.aspx (accessed on 7 September 2026).
- Benoît Norris, C.; Traverso, M.; Neugebauer, S.; Ekener, E.; Schaubroeck, T.; Russo Garrido, S.; Berger, M.; Valdivia, S.; Lehmann, A.; Finkbeiner, M.; et al. Guidelines for Social Life Cycle Assessment of Products and Organizations 2020; United Nations Environment Programme: Paris, 2020. [Google Scholar]
- United Nations Environment Programme. Methodological Sheets for Subcategories in Social Life Cycle Assessment (S-LCA) 2021; United Nations Environment Programme: Paris, 2021. [Google Scholar]
- International Organization for Standardization. ISO 14075:2024 Environmental management — Principles and framework for social life cycle assessment; 2024.
- Zafar, I.; Stojceska, V.; Tassou, S. Social sustainability assessments of industrial level solar energy: A systematic review. Renew. Sustain. Energy Rev. 2024, 189, 113962. [Google Scholar] [CrossRef]
- Mathe, S. Integrating participatory approaches into social life cycle assessment: the SLCA participatory approach. Int. J. Life Cycle Assess. 2014, 19, 1506–1514. [Google Scholar] [CrossRef]
- Bouillass, G.; Blanc, I.; Perez-Lopez, P. Step-by-step social life cycle assessment framework: a participatory approach for the identification and prioritization of impact subcategories applied to mobility scenarios. Int. J. Life Cycle Assess. 2021, 26, 2408–2435. [Google Scholar] [CrossRef]
- Osorio, M.; Cobo, M.; Sánchez, N. Assessing social and energy vulnerabilities through a novel S-LCA approach: A rural case study in Colombia’s Pacific region. Int. J. Life Cycle Assess. 2025, 30, 3536–3559. [Google Scholar] [CrossRef]
- Lappi, J.; Levänen, J.; Orola, A.; Havukainen, J.; Katende, J. Social life cycle assessment of renewable energy communities in Namibia: exploring pathways to well-being. Clean. Energy Syst. 2026, 13, 100254. [Google Scholar] [CrossRef]
- Diakoulaki, D.; Mavrotas, G.; Papayannakis, L. Determining objective weights in multiple criteria problems: The CRITIC method. Comput. Oper. Res. 1995, 22, 763–770. [Google Scholar] [CrossRef]
- Hwang, C.L.; Yoon, K. Methods for Multiple Attribute Decision Making. In Multiple Attribute Decision Making: Methods and Applications; Springer: Berlin, 1981; pp. 58–191. [Google Scholar] [CrossRef]
- Universidad del Magdalena.; Agencia Nacional de Hidrocarburos. Manual técnico del marco metodológico de análisis de ciclo de vida para proyectos solares (Entregable 4); Technical report, Contrato 515 de 2025; IMPACT Energy.CO: Santa Marta, 2025. [Google Scholar]
- International Labour Organization. Indigenous and Tribal Peoples Convention. 1989; 1989. [Google Scholar]
- America, N. E. C. f. L.; Caribbean, t. Regional Agreement on Access to Information, Public Participation and Justice in Environmental Matters in Latin America and the Caribbean (Escazú Agreement). 2018. [Google Scholar]
- Brown, S. Software Architecture for Developers, Volume 2: Visualise, Document and Explore your Software Architecture; Leanpub, 2018; Defines the C4 model of context, containers, components and code. [Google Scholar]
- Al-Fuqaha, A.; Guizani, M.; Mohammadi, M.; Aledhari, M.; Ayyash, M. Internet of Things: A Survey on Enabling Technologies, Protocols, and Applications. IEEE Commun. Surv. Tutor. 2015, 17, 2347–2376. [Google Scholar] [CrossRef]
- Azzabi, S.; Alfughi, Z.G.; Ouda, A. Data Lakes: A Survey of Concepts and Architectures. Computers 2024, 13, 183. [Google Scholar] [CrossRef]
- International Electrotechnical Commission. IEC 61724-1:2021 Photovoltaic system performance — Part 1: Monitoring; 2021.
- Ciroth, A. ICT for environment in life cycle applications: openLCA — a new open source software for life cycle assessment. Int. J. Life Cycle Assess. 2007, 12, 209–210. [Google Scholar] [CrossRef]
- Zhang, A.; Zhong, R.Y.; Farooque, M.; Kang, K.; Venkatesh, V.G. Blockchain-based life cycle assessment: An implementation framework and system architecture. Resour. Conserv. Recycl. 2020, 152, 104512. [Google Scholar] [CrossRef]
- Standards, I. Technical Report FIPS PUB 180-4; Secure Hash Standard (SHS). U.S. Department of Commerce, 2015. [CrossRef]
- Caldarelli, G. Understanding the Blockchain Oracle Problem: A Call for Action. Information 2020, 11, 509. [Google Scholar] [CrossRef]
- Nielsen, J.; Molich, R. Heuristic evaluation of user interfaces. In Proceedings of the Proceedings of the SIGCHI Conference on Human Factors in Computing Systems (CHI ’90), New York, 1990; pp. 249–256. [Google Scholar] [CrossRef]
- Hsu, D.D.; O’Donoughue, P.; Fthenakis, V.; Heath, G.A.; Kim, H.C.; Sawyer, P.; Choi, J.K.; Turney, D.E. Life Cycle Greenhouse Gas Emissions of Crystalline Silicon Photovoltaic Electricity Generation: Systematic Review and Harmonization. J. Ind. Ecol. 2012, 16. [Google Scholar] [CrossRef]
- Kim, H.C.; Fthenakis, V.; Choi, J.K.; Turney, D.E. Life Cycle Greenhouse Gas Emissions of Thin-film Photovoltaic Electricity Generation: Systematic Review and Harmonization. J. Ind. Ecol. 2012, 16. [Google Scholar] [CrossRef]
- Bhandari, K.P.; Collier, J.M.; Ellingson, R.J.; Apul, D.S. Energy payback time (EPBT) and energy return on energy invested (EROI) of solar photovoltaic systems: A systematic review and meta-analysis. Renew. Sustain. Energy Rev. 2015, 47, 133–141. [Google Scholar] [CrossRef]
- World Bank Group; Solargis. Global Solar Atlas 2.0: solar resource maps and data for Colombia. 2024). Available online: https://globalsolaratlas.info (accessed on 5 September 2026).
- European Commission; Joint Research Centre. Photovoltaic Geographical Information System (PVGIS) 5.3. 2024). Available online: https://re.jrc.ec.europa.eu/pvg_tools/en/ (accessed on 5 September 2026).
- Luo, W.; Khoo, Y.S.; Hacke, P.; Jordan, D.; Zhao, L.; Ramakrishna, S.; Aberle, A.G.; Reindl, T. Analysis of the Long-Term Performance Degradation of Crystalline Silicon Photovoltaic Modules in Tropical Climates. IEEE J. Photovolt. 2019, 9, 266–271. [Google Scholar] [CrossRef]
- UNFCCC Clean Development Mechanism Executive Board. Methodological tool TOOL07: Tool to calculate the emission factor for an electricity system, version 07.0. 2018). Available online: https://cdm.unfccc.int/methodologies/PAmethodologies/tools (accessed on 5 September 2026).
- Heijungs, R. Marginal and average considerations in LCA and their role for defining emission factors and characterization factors. Int. J. Life Cycle Assess. 2025, 30, 525–542. [Google Scholar] [CrossRef]
- Cortés Castelblanco, J.D.; Muliere, G.; Famiglietti, J. Hourly Attributional Prospective Life Cycle Assessment of the Italian Electricity Grid. Sustainability 2026, 18, 1506. [Google Scholar] [CrossRef]
- Boulay, A.M.; Bare, J.; Benini, L.; Berger, M.; Lathuillière, M.J.; Manzardo, A.; Margni, M.; Motoshita, M.; Nunez, M.; Pastor, A.V.; et al. The WULCA consensus characterization model for water scarcity footprints: assessing impacts of water consumption based on available water remaining (AWARE). Int. J. Life Cycle Assess. 2018, 23, 368–378. [Google Scholar] [CrossRef]
- Huijbregts, M.A.J.; Steinmann, Z.J.N.; Elshout, P.M.F.; Stam, G.; Verones, F.; Vieira, M.; Zijp, M.; Hollander, A.; van Zelm, R. ReCiPe2016: a harmonised life cycle impact assessment method at midpoint and endpoint level. Int. J. Life Cycle Assess. 2017, 22, 138–147. [Google Scholar] [CrossRef]
- Rosenbaum, R.K.; Bachmann, T.M.; Gold, L.S.; Huijbregts, M.A.J.; Jolliet, O.; Juraske, R.; Koehler, A.; Larsen, H.F.; MacLeod, M.; Margni, M.; et al. USEtox — the UNEP-SETAC toxicity model. Int. J. Life Cycle Assess. 2008, 13, 532–546. [Google Scholar] [CrossRef]
- Steiger, J.H. Tests for comparing elements of a correlation matrix. Psychol. Bull. 1980, 87, 245–251. [Google Scholar] [CrossRef]
- Shah, H.H.; Bareschino, P.; Mancusi, E.; Pepe, F. Environmental Life Cycle Analysis and Energy Payback Period Evaluation of Solar PV Systems: The Case of Pakistan. Energies 2023, 16, 6400. [Google Scholar] [CrossRef]
- Parliament; Union, C.o.t.E. Regulation (EU) 2023/1542 concerning batteries and waste batteries. Off. J. Eur. Union 2023, L 191, 1–117. [Google Scholar]
- Parliament; Union, C.o.t.E. Regulation (EU) 2024/1781 establishing a framework for the setting of ecodesign requirements for sustainable products. Off. J. Eur. Union 2024, L series, 2024/1781. [Google Scholar]
- Jensen, S.F.; Kristensen, J.H.; Adamsen, S.; Christensen, A.; Waehrens, B.V. Digital product passports for a circular economy: Data needs for product life cycle decision-making. Sustain. Prod. Consum. 2023, 37, 242–255. [Google Scholar] [CrossRef]
Figure 1.
The Colombian setting. (a) Registered solar projects in the two most recent reporting periods of the national planning register [3], at the April 2025 cut-off; 13,639 plants were in operation and 90 in the testing phase at the close of the second period. (b) The two regimes of environmental evidence compared in this paper. Under the current regime a three-year licence period generates six self-reported observations; under the instrumented regime described here, telemetry is normalised on ingestion, quarantined on validation failure and hash-chained on persistence, with an indicative extraction cycle of fifteen minutes and resampling at one, ten and sixty minutes.
Figure 1.
The Colombian setting. (a) Registered solar projects in the two most recent reporting periods of the national planning register [3], at the April 2025 cut-off; 13,639 plants were in operation and 90 in the testing phase at the close of the second period. (b) The two regimes of environmental evidence compared in this paper. Under the current regime a three-year licence period generates six self-reported observations; under the instrumented regime described here, telemetry is normalised on ingestion, quarantined on validation failure and hash-chained on persistence, with an indicative extraction cycle of fifteen minutes and resampling at one, ten and sixty minutes.
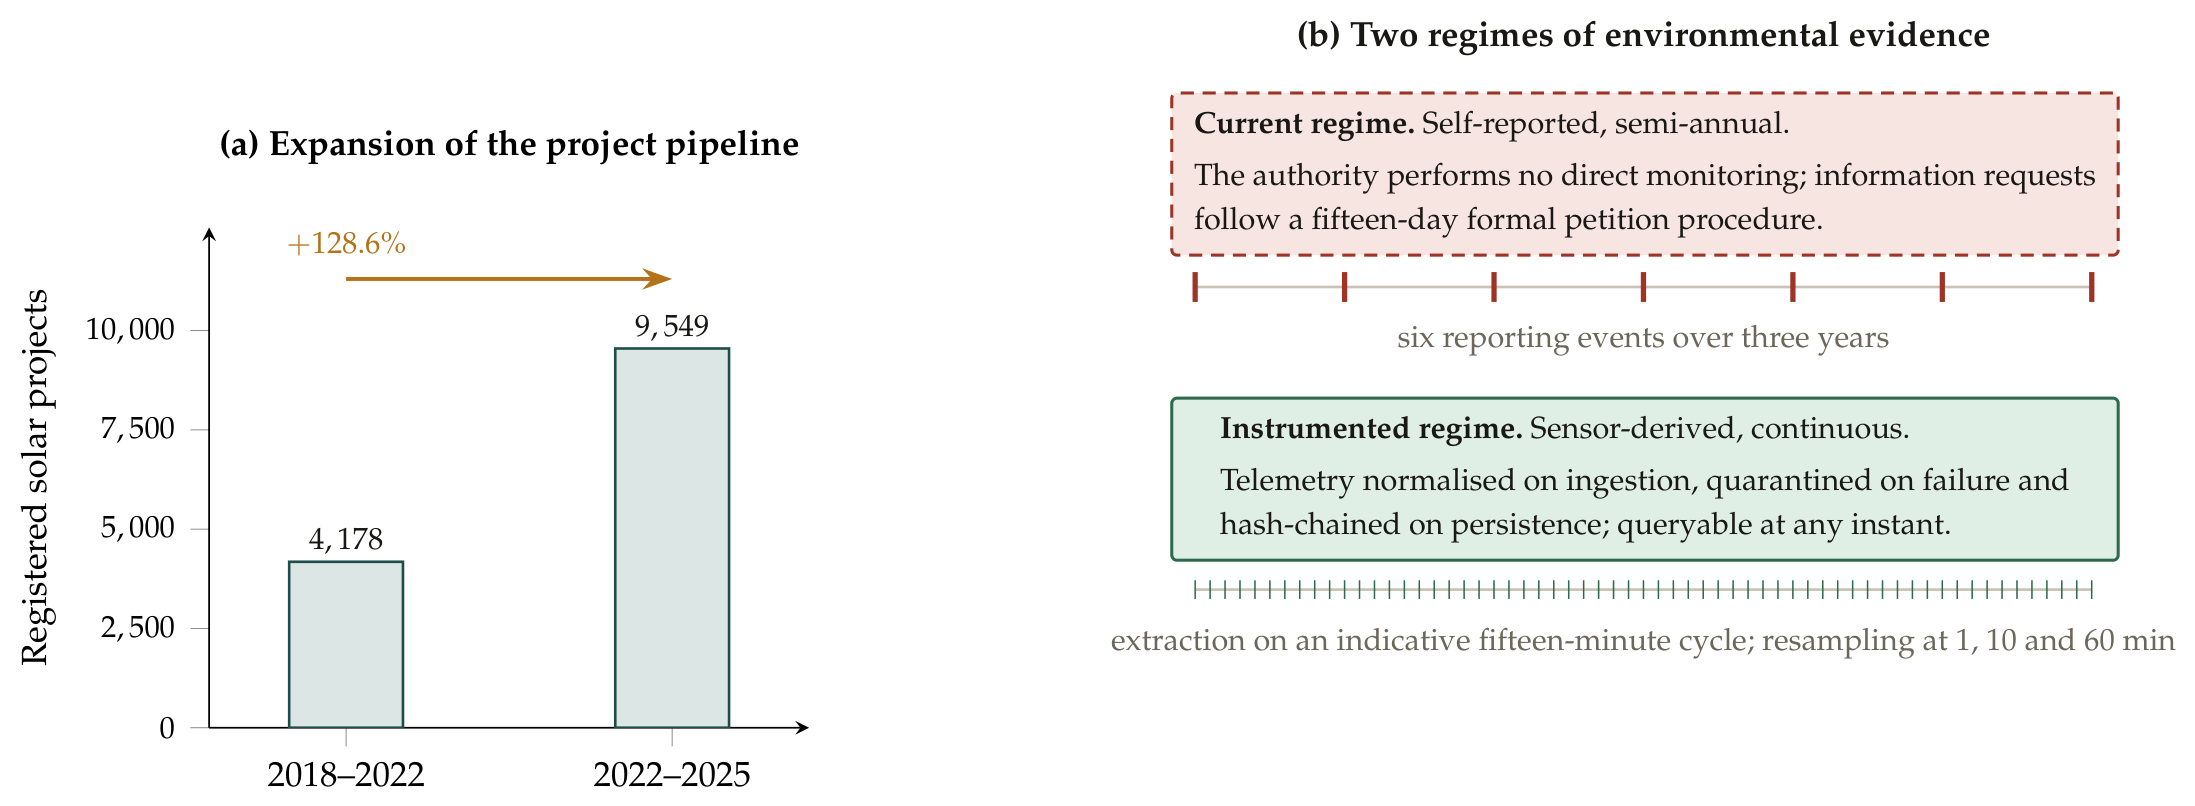
Figure 2.
Positioning of the present work against the prior art. The horizontal axis is the temporal resolution of the foreground inventory; the vertical axis is whether the primary data are measured and independently verifiable rather than modelled or assumed. Methodological advances in dynamic LCA occupy the lower right: they resolve time, but the inventory they resolve is still assumed. Sensor-fed platforms occupy the upper middle. The upper-right quadrant—continuous and auditable—is the position this work claims.
Figure 2.
Positioning of the present work against the prior art. The horizontal axis is the temporal resolution of the foreground inventory; the vertical axis is whether the primary data are measured and independently verifiable rather than modelled or assumed. Methodological advances in dynamic LCA occupy the lower right: they resolve time, but the inventory they resolve is still assumed. Sensor-fed platforms occupy the upper middle. The upper-right quadrant—continuous and auditable—is the position this work claims.
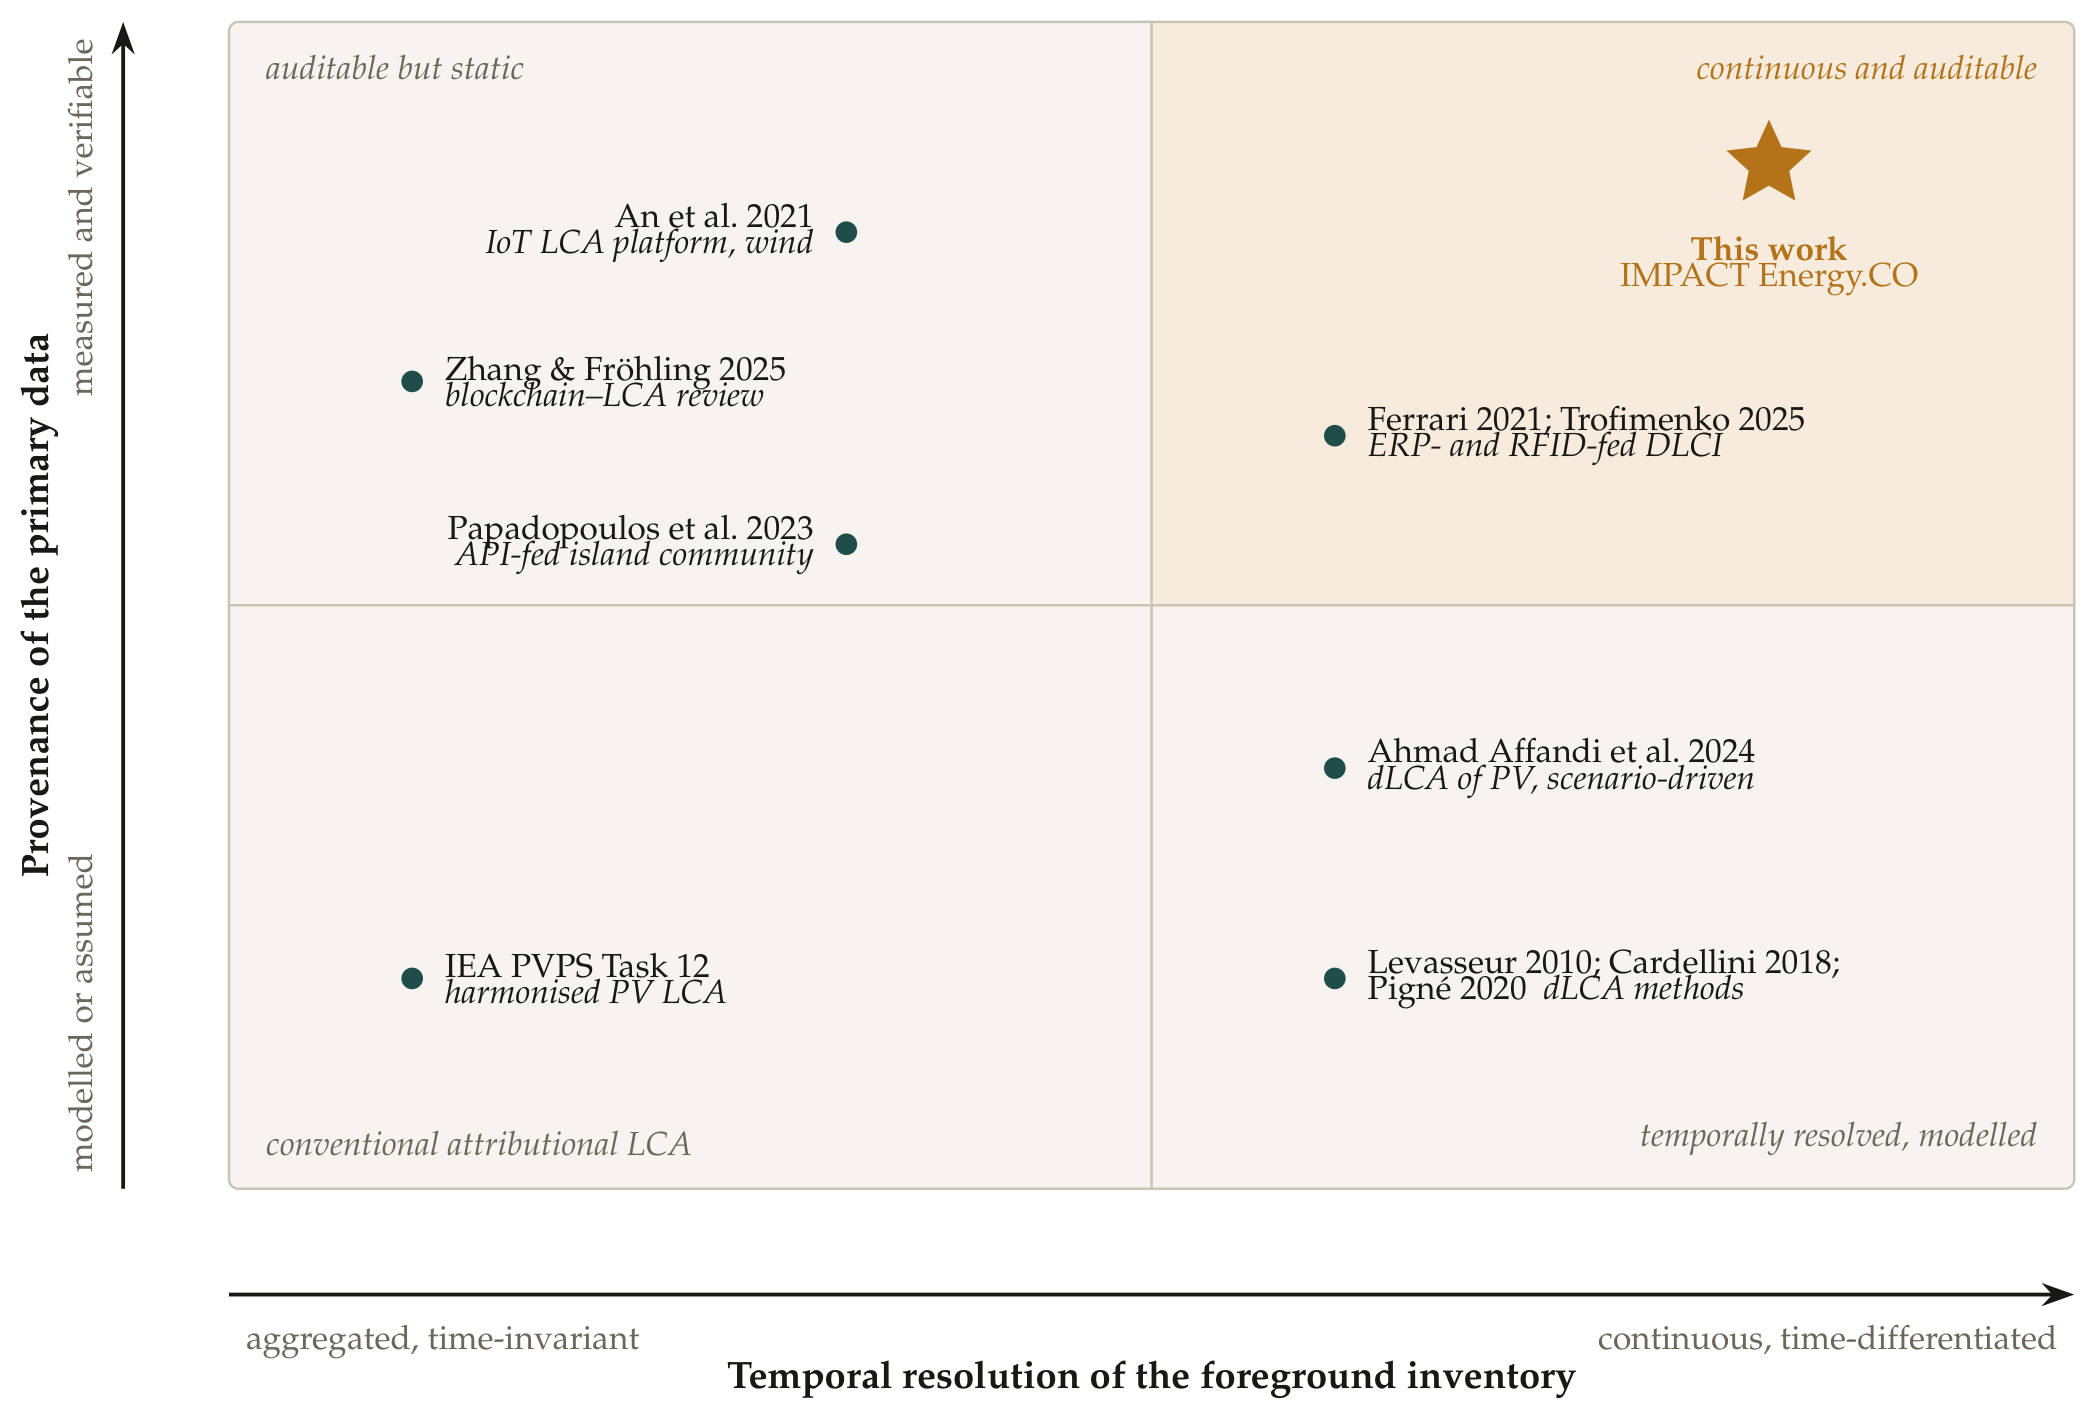
Figure 3.
Container-level view of the IMPACT Energy.CO architecture. Four actor roles reach a role-based web front end, which is served by two separate .NET APIs: an interoperability API that orchestrates operations and integrations, and a consumption API that serves reads and exports. Three connectors bind the platform to its external systems. The analytical path runs from the time-series store through a scheduled ETL into a dimensional warehouse. The dashed boundary marks the regulator’s own infrastructure for the evidence path reported in this paper; the wider platform’s external dependencies for identity, business intelligence, mapping and the conversational assistants are outside it and are enumerated in Section 5. The field layer is specified but not yet deployed on an operating plant.
Figure 3.
Container-level view of the IMPACT Energy.CO architecture. Four actor roles reach a role-based web front end, which is served by two separate .NET APIs: an interoperability API that orchestrates operations and integrations, and a consumption API that serves reads and exports. Three connectors bind the platform to its external systems. The analytical path runs from the time-series store through a scheduled ETL into a dimensional warehouse. The dashed boundary marks the regulator’s own infrastructure for the evidence path reported in this paper; the wider platform’s external dependencies for identity, business intelligence, mapping and the conversational assistants are outside it and are enumerated in Section 5. The field layer is specified but not yet deployed on an operating plant.
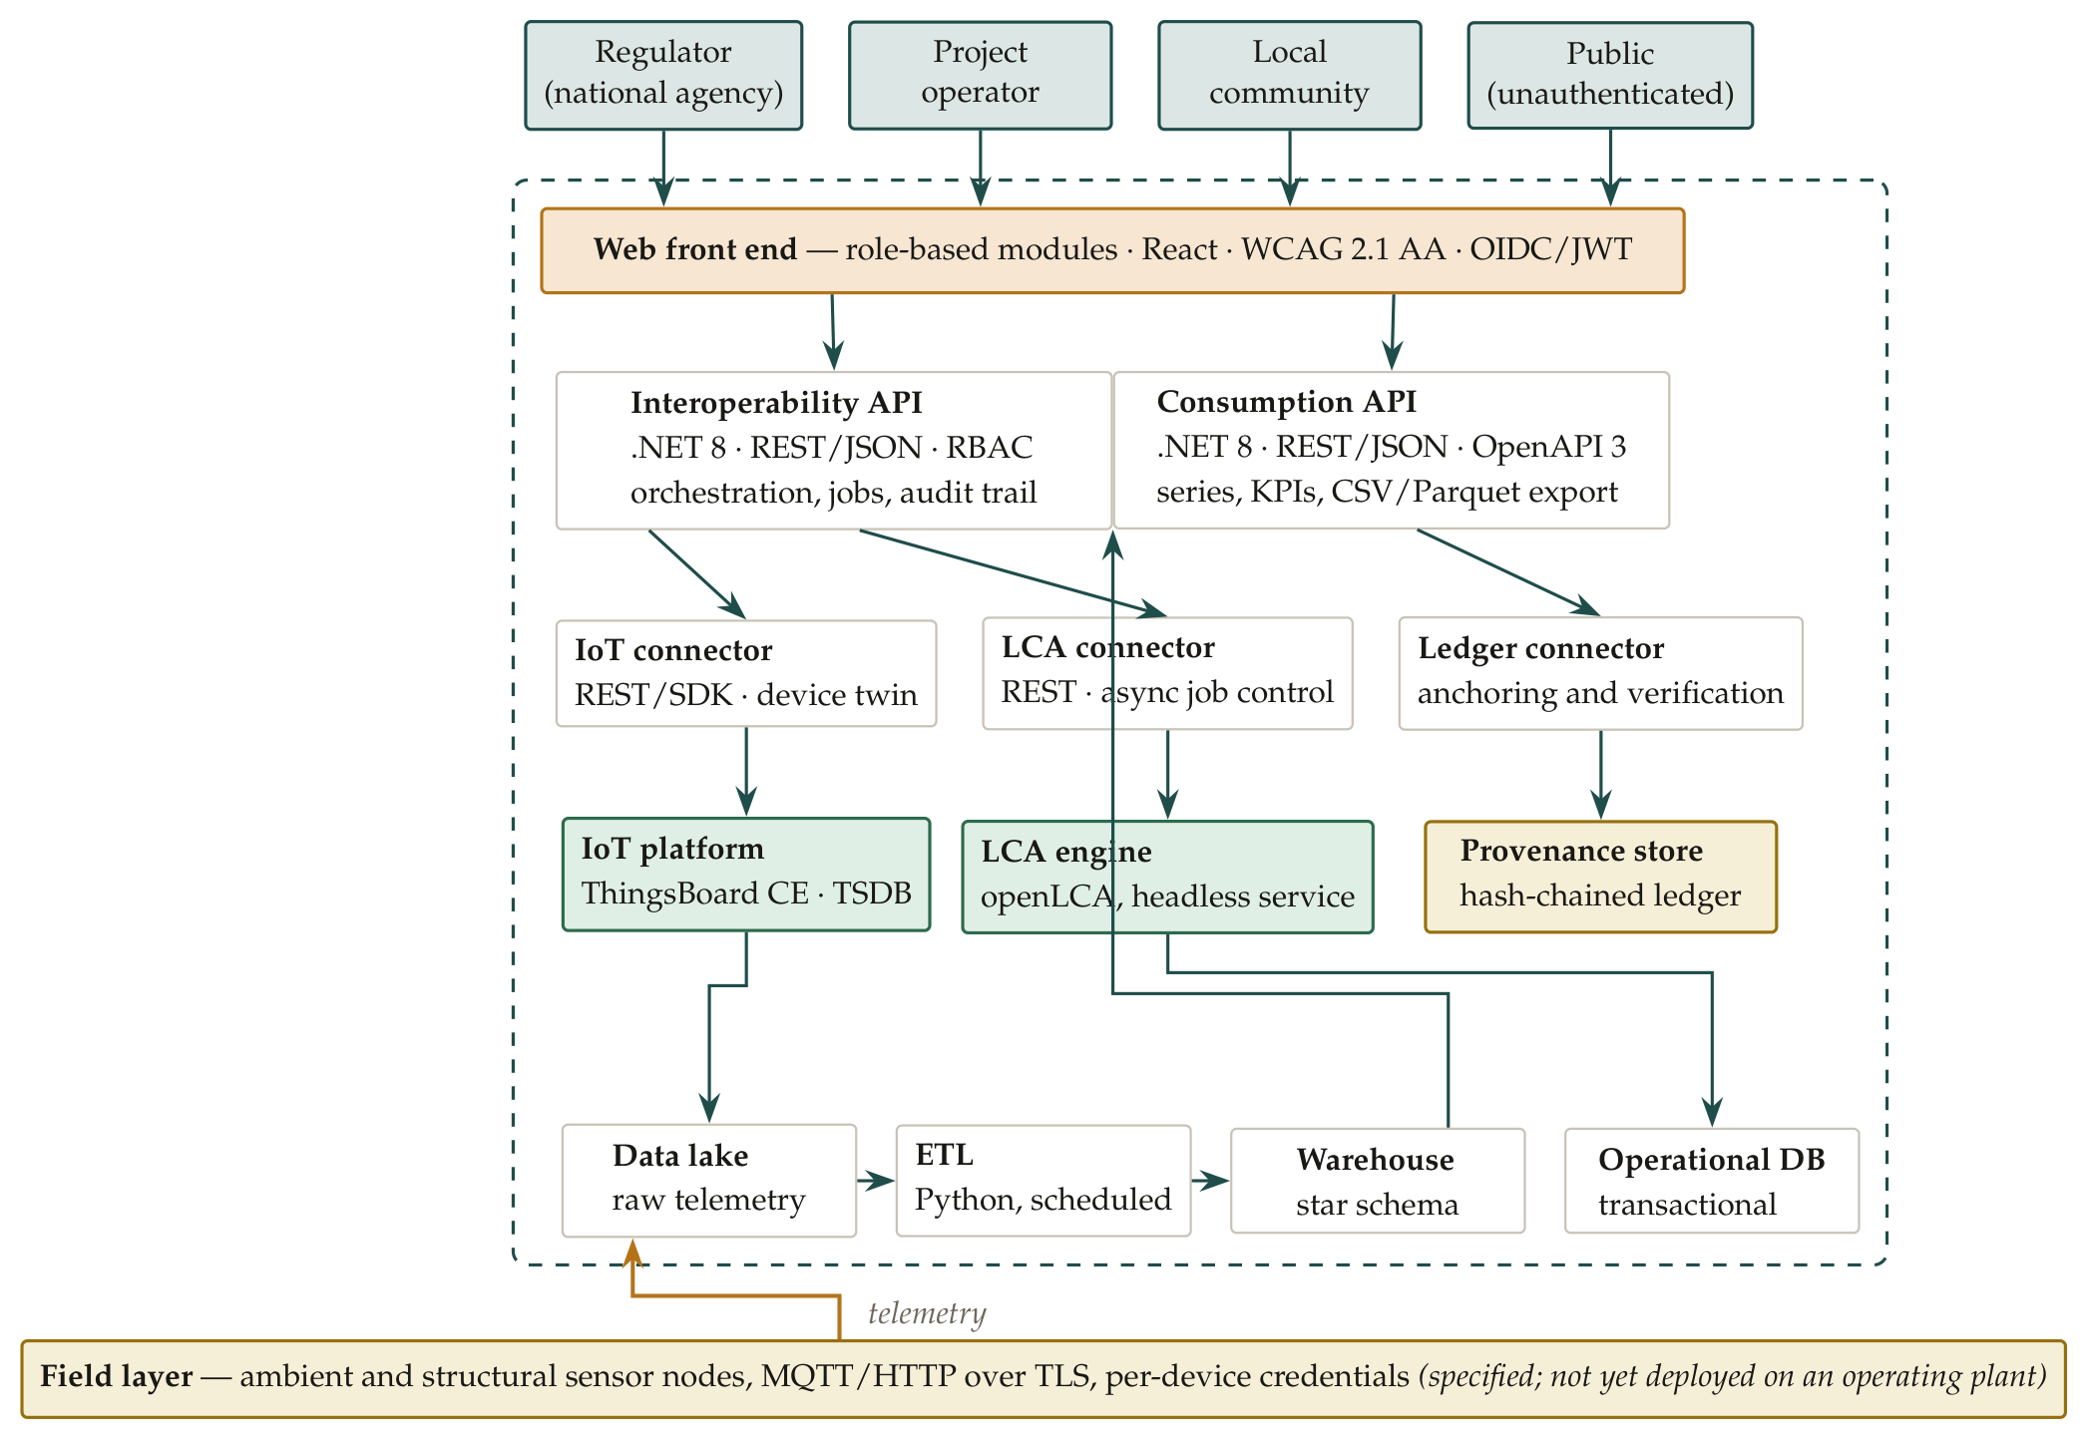
Figure 4.
The data path from acquisition to provenance. Green stages are implemented and exercised; the amber stage is implemented but human-triggered; the red dashed stage and its incoming edges are specified at the architectural level and not yet executed. The automatic coupling between normalised telemetry and inventory parameters is the segment that remains open, and the current trigger for an impact assessment run is a completed web form.
Figure 4.
The data path from acquisition to provenance. Green stages are implemented and exercised; the amber stage is implemented but human-triggered; the red dashed stage and its incoming edges are specified at the architectural level and not yet executed. The automatic coupling between normalised telemetry and inventory parameters is the segment that remains open, and the current trigger for an impact assessment run is a completed web form.
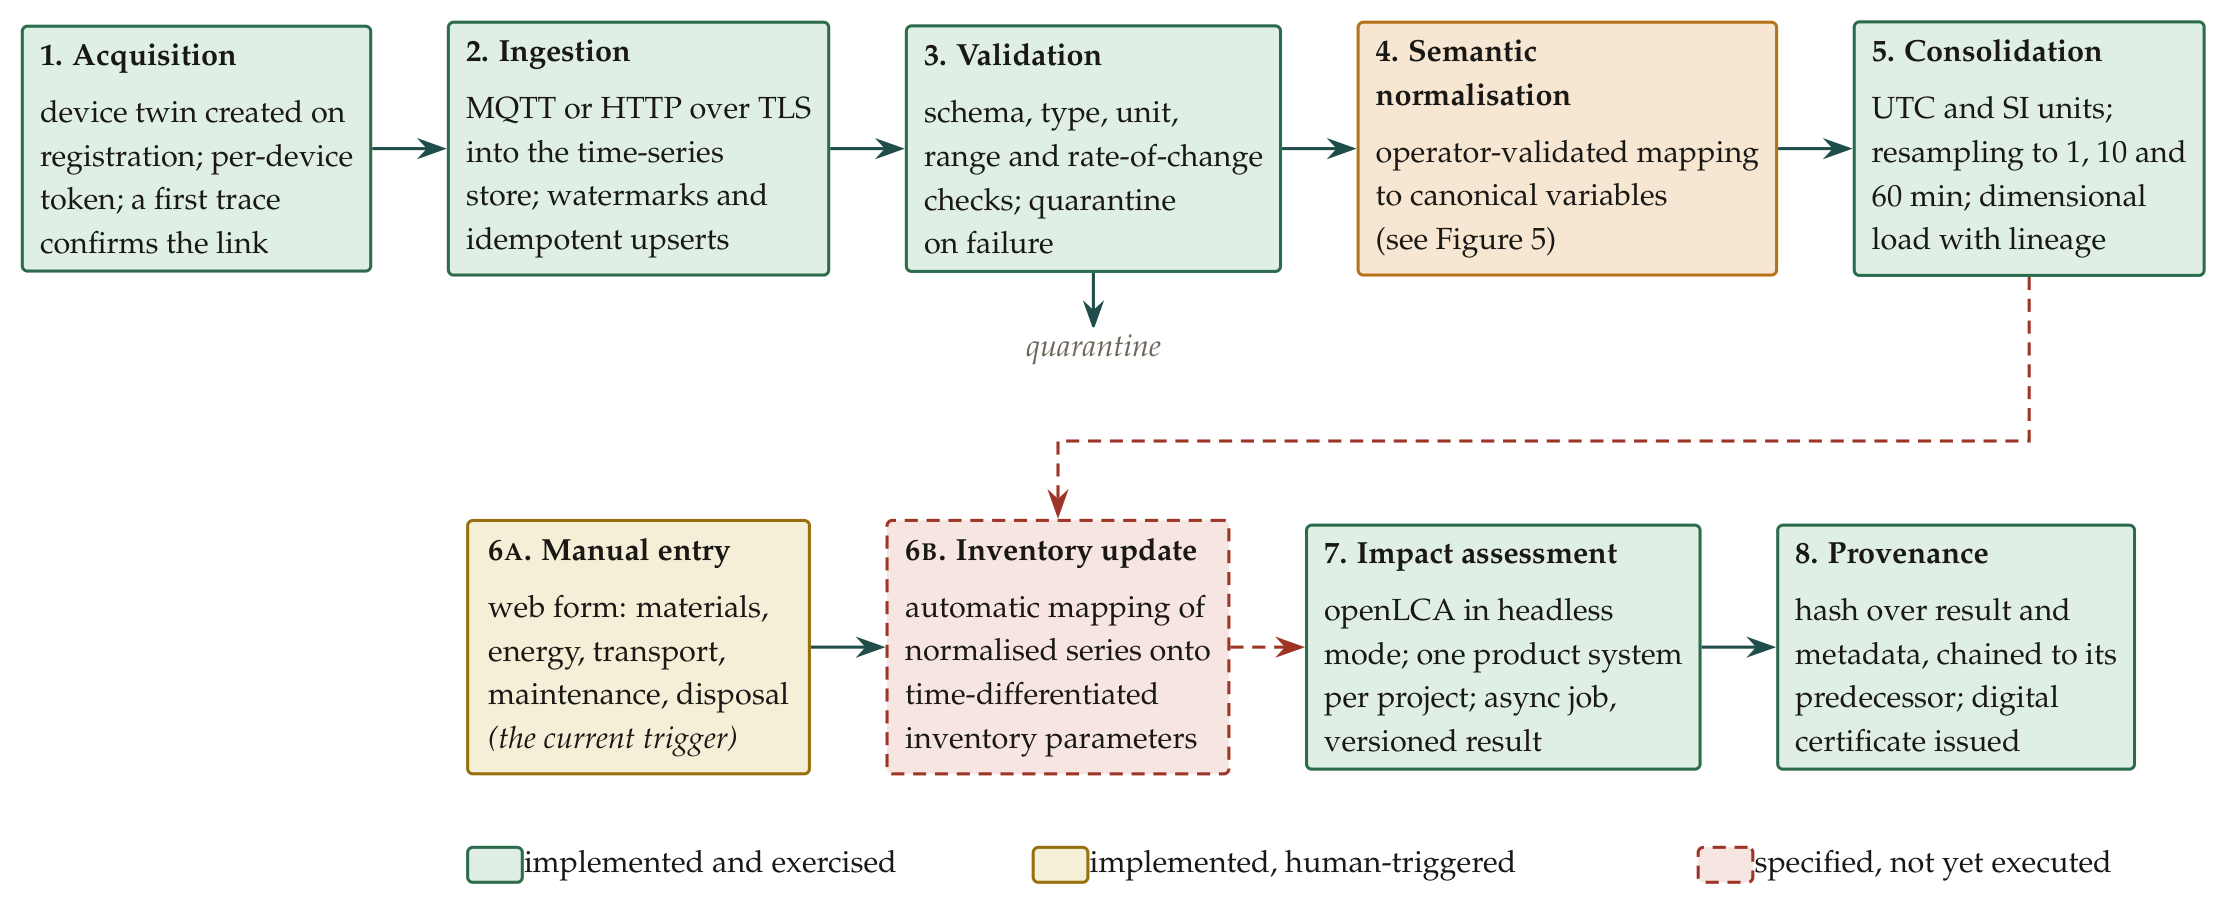
Figure 5.
The semantic normalisation layer. Vendor-specific telemetry keys are resolved onto a canonical variable dictionary through an operator-validated mapping engine. The mechanism is deliberately simple, but it removes the dependency on proprietary vendor SDKs and makes heterogeneous device fleets addressable through one vocabulary. The canonical entries shown are illustrative of the mechanism and are not reproduced from any deliverable: the only canonical schema enumerated in the architecture deliverable is the wind instantiation of the same programme (wind_speed, rotor_rpm, power_kw), and the only worked mapping examples in the record are two Spanish-language variable labels. The deployed solar dictionary is held in the platform database and in the data dictionary transferred to the authority’s technology office, which is not among the sixteen contractual deliverables. The versioning shown makes a mapping decision auditable; whether each stored reading additionally references its mapping version is not stated in the record and is not claimed here (Section 3.7).
Figure 5.
The semantic normalisation layer. Vendor-specific telemetry keys are resolved onto a canonical variable dictionary through an operator-validated mapping engine. The mechanism is deliberately simple, but it removes the dependency on proprietary vendor SDKs and makes heterogeneous device fleets addressable through one vocabulary. The canonical entries shown are illustrative of the mechanism and are not reproduced from any deliverable: the only canonical schema enumerated in the architecture deliverable is the wind instantiation of the same programme (wind_speed, rotor_rpm, power_kw), and the only worked mapping examples in the record are two Spanish-language variable labels. The deployed solar dictionary is held in the platform database and in the data dictionary transferred to the authority’s technology office, which is not among the sixteen contractual deliverables. The versioning shown makes a mapping decision auditable; whether each stored reading additionally references its mapping version is not stated in the record and is not claimed here (Section 3.7).
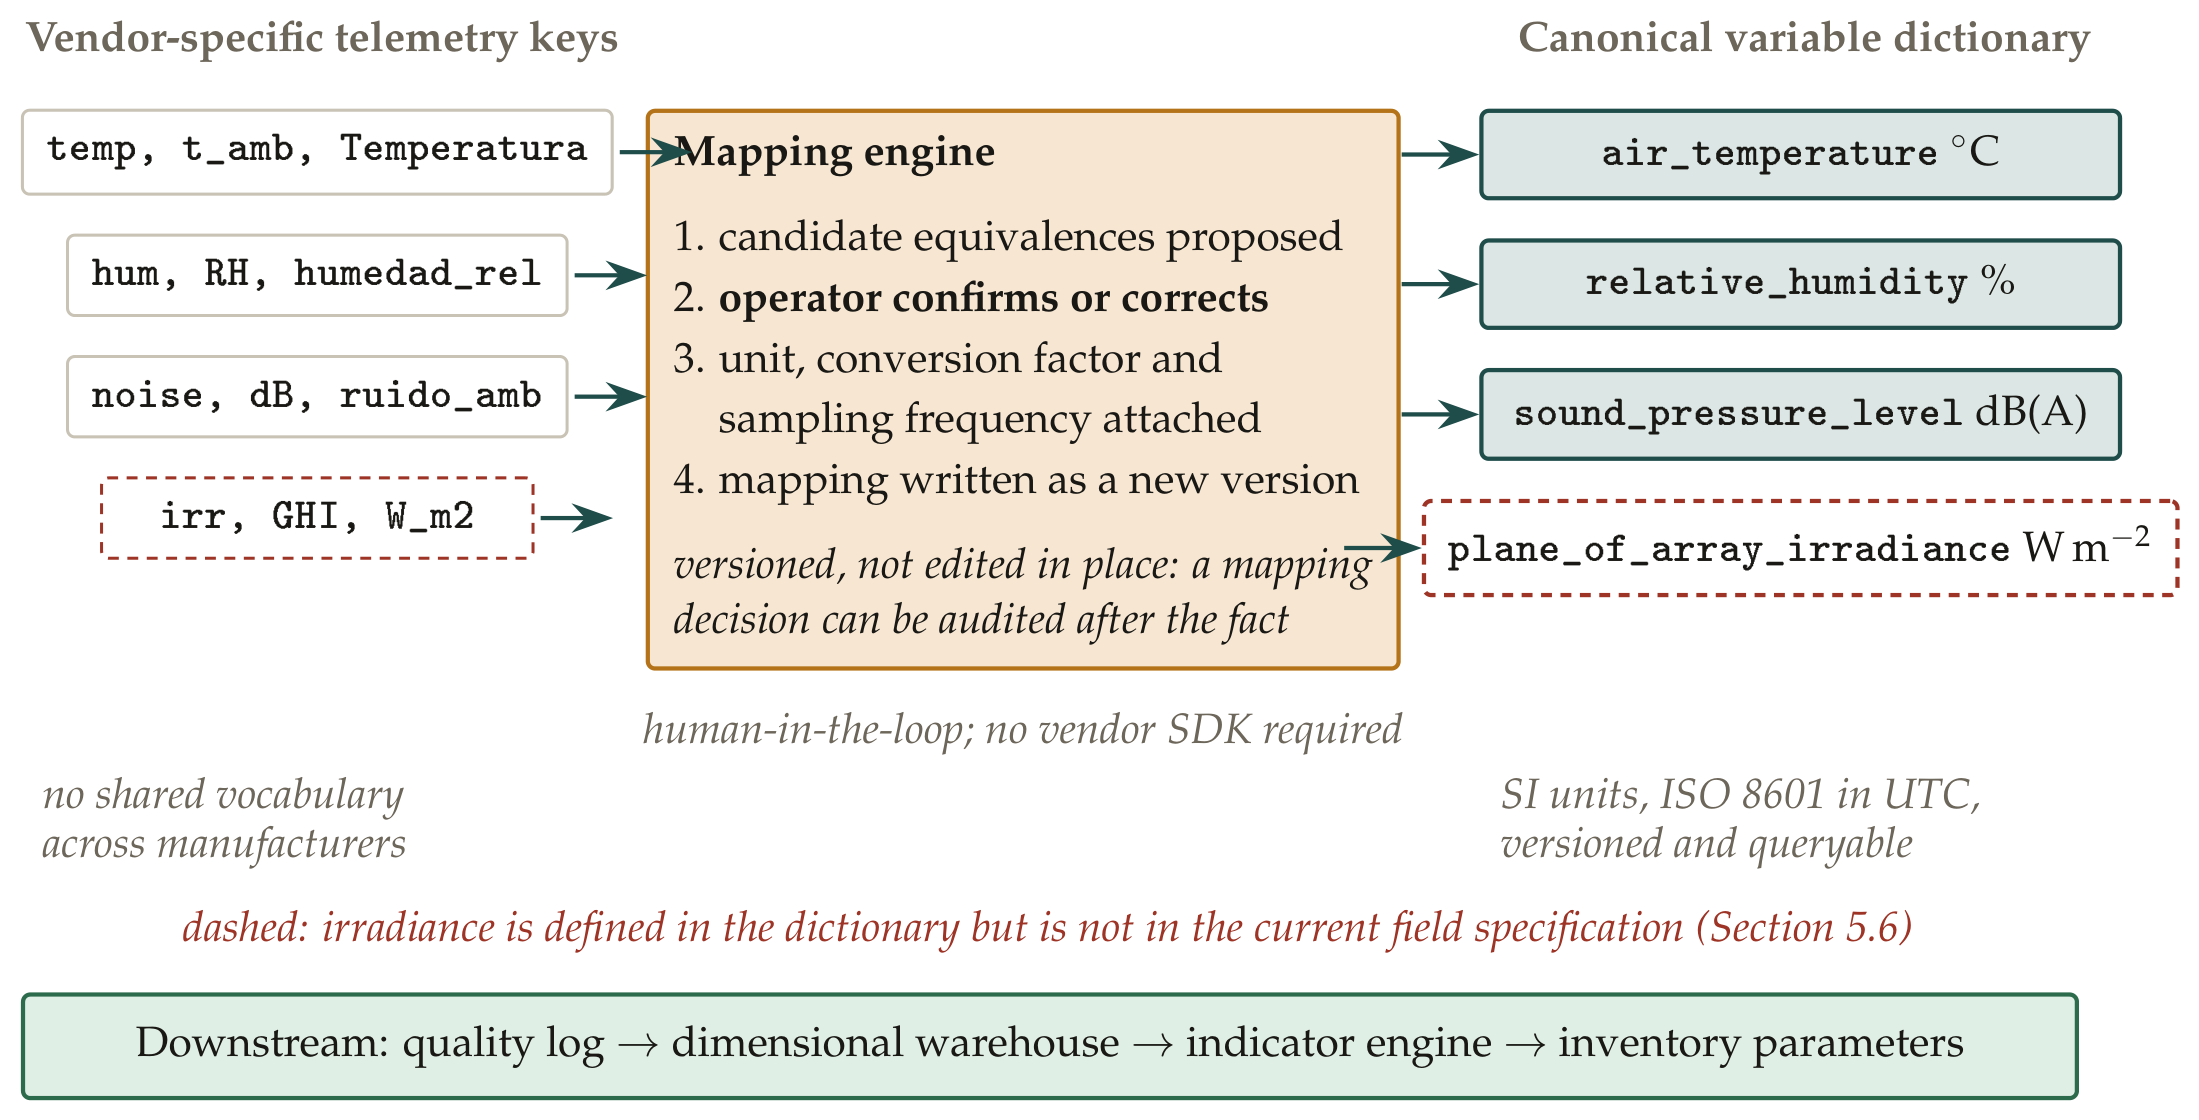
Figure 6.
Tamper-evident provenance chain. Each record links to its predecessor by hash; retrospective alteration of a value invalidates every subsequent link and is detected on recomputation. The mechanism is an append-only audit log over the relational store, hardened by hash chaining. The anchoring interface to an Ethereum-compatible ledger is exercised against a permissioned, centrally hosted instance; it is not a distributed network.
Figure 6.
Tamper-evident provenance chain. Each record links to its predecessor by hash; retrospective alteration of a value invalidates every subsequent link and is detected on recomputation. The mechanism is an append-only audit log over the relational store, hardened by hash chaining. The anchoring interface to an Ethereum-compatible ledger is exercised against a permissioned, centrally hosted instance; it is not a distributed network.
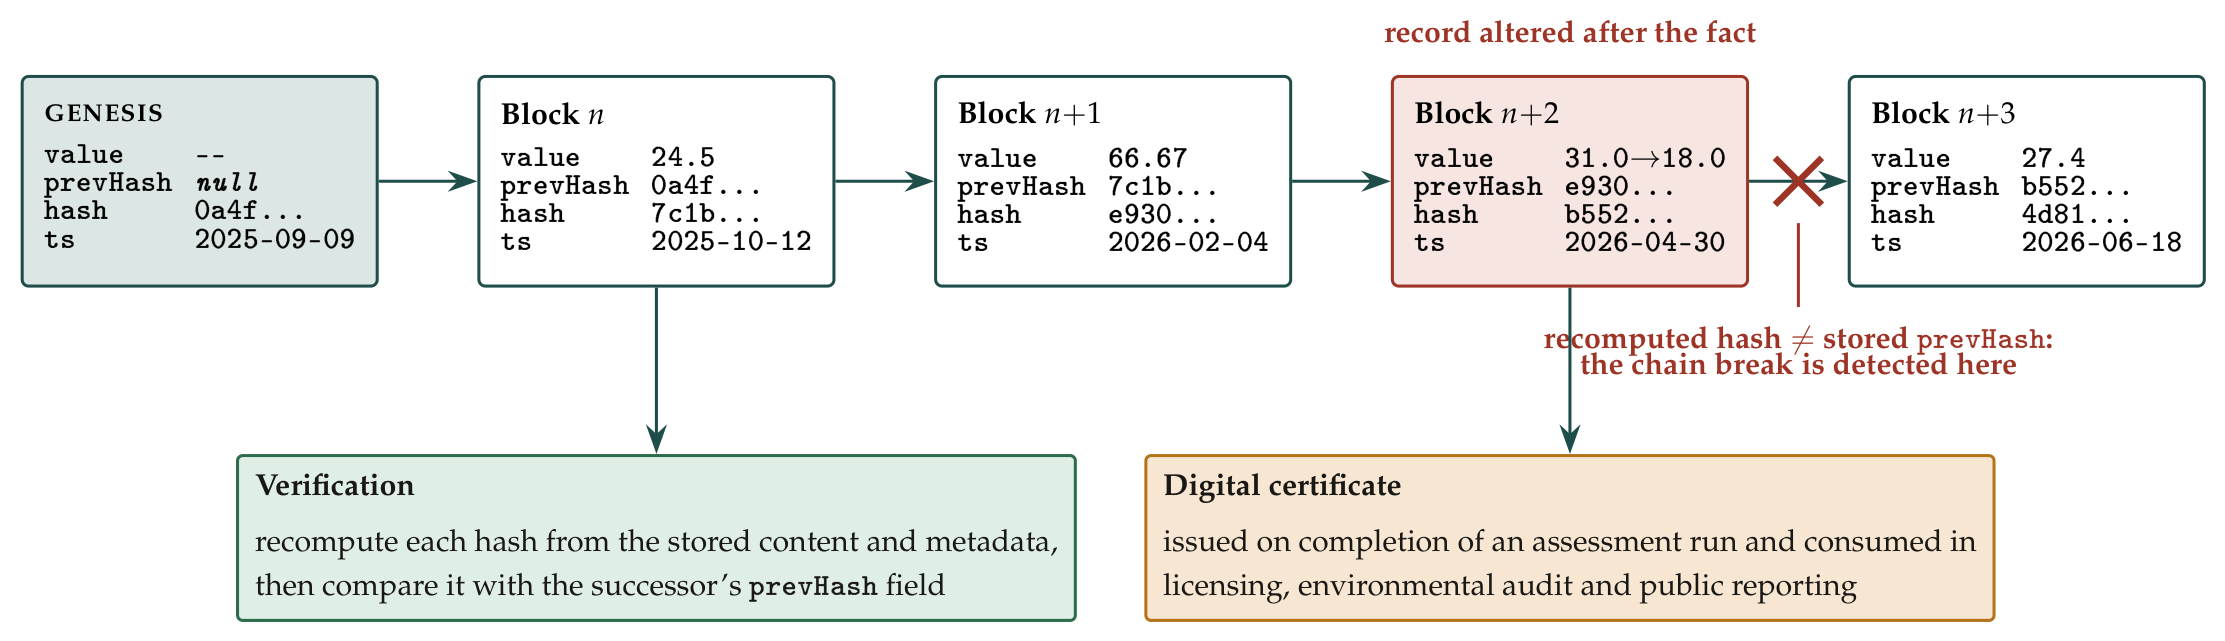
Figure 7.
Construction of the indicator system. (a) The screening funnel from 144 candidates to 23 documented indicators, with the two independent validation branches shown separately. Data-sheet production ran in parallel with branch validation rather than after it: fourteen of the fifteen scored social indicators carry a data sheet, the exception being local employment creation, which the expert panel ranked second of fifteen. The indicator deliverable states nineteen and then presents 23, an inconsistency internal to that source. (b) Expert and community rankings of the fifteen social indicators both branches scored, for the utility-scale track. Ranks are unrelated (); the labelled indicators are the four largest displacements.
Figure 7.
Construction of the indicator system. (a) The screening funnel from 144 candidates to 23 documented indicators, with the two independent validation branches shown separately. Data-sheet production ran in parallel with branch validation rather than after it: fourteen of the fifteen scored social indicators carry a data sheet, the exception being local employment creation, which the expert panel ranked second of fifteen. The indicator deliverable states nineteen and then presents 23, an inconsistency internal to that source. (b) Expert and community rankings of the fifteen social indicators both branches scored, for the utility-scale track. Ranks are unrelated (); the labelled indicators are the four largest displacements.
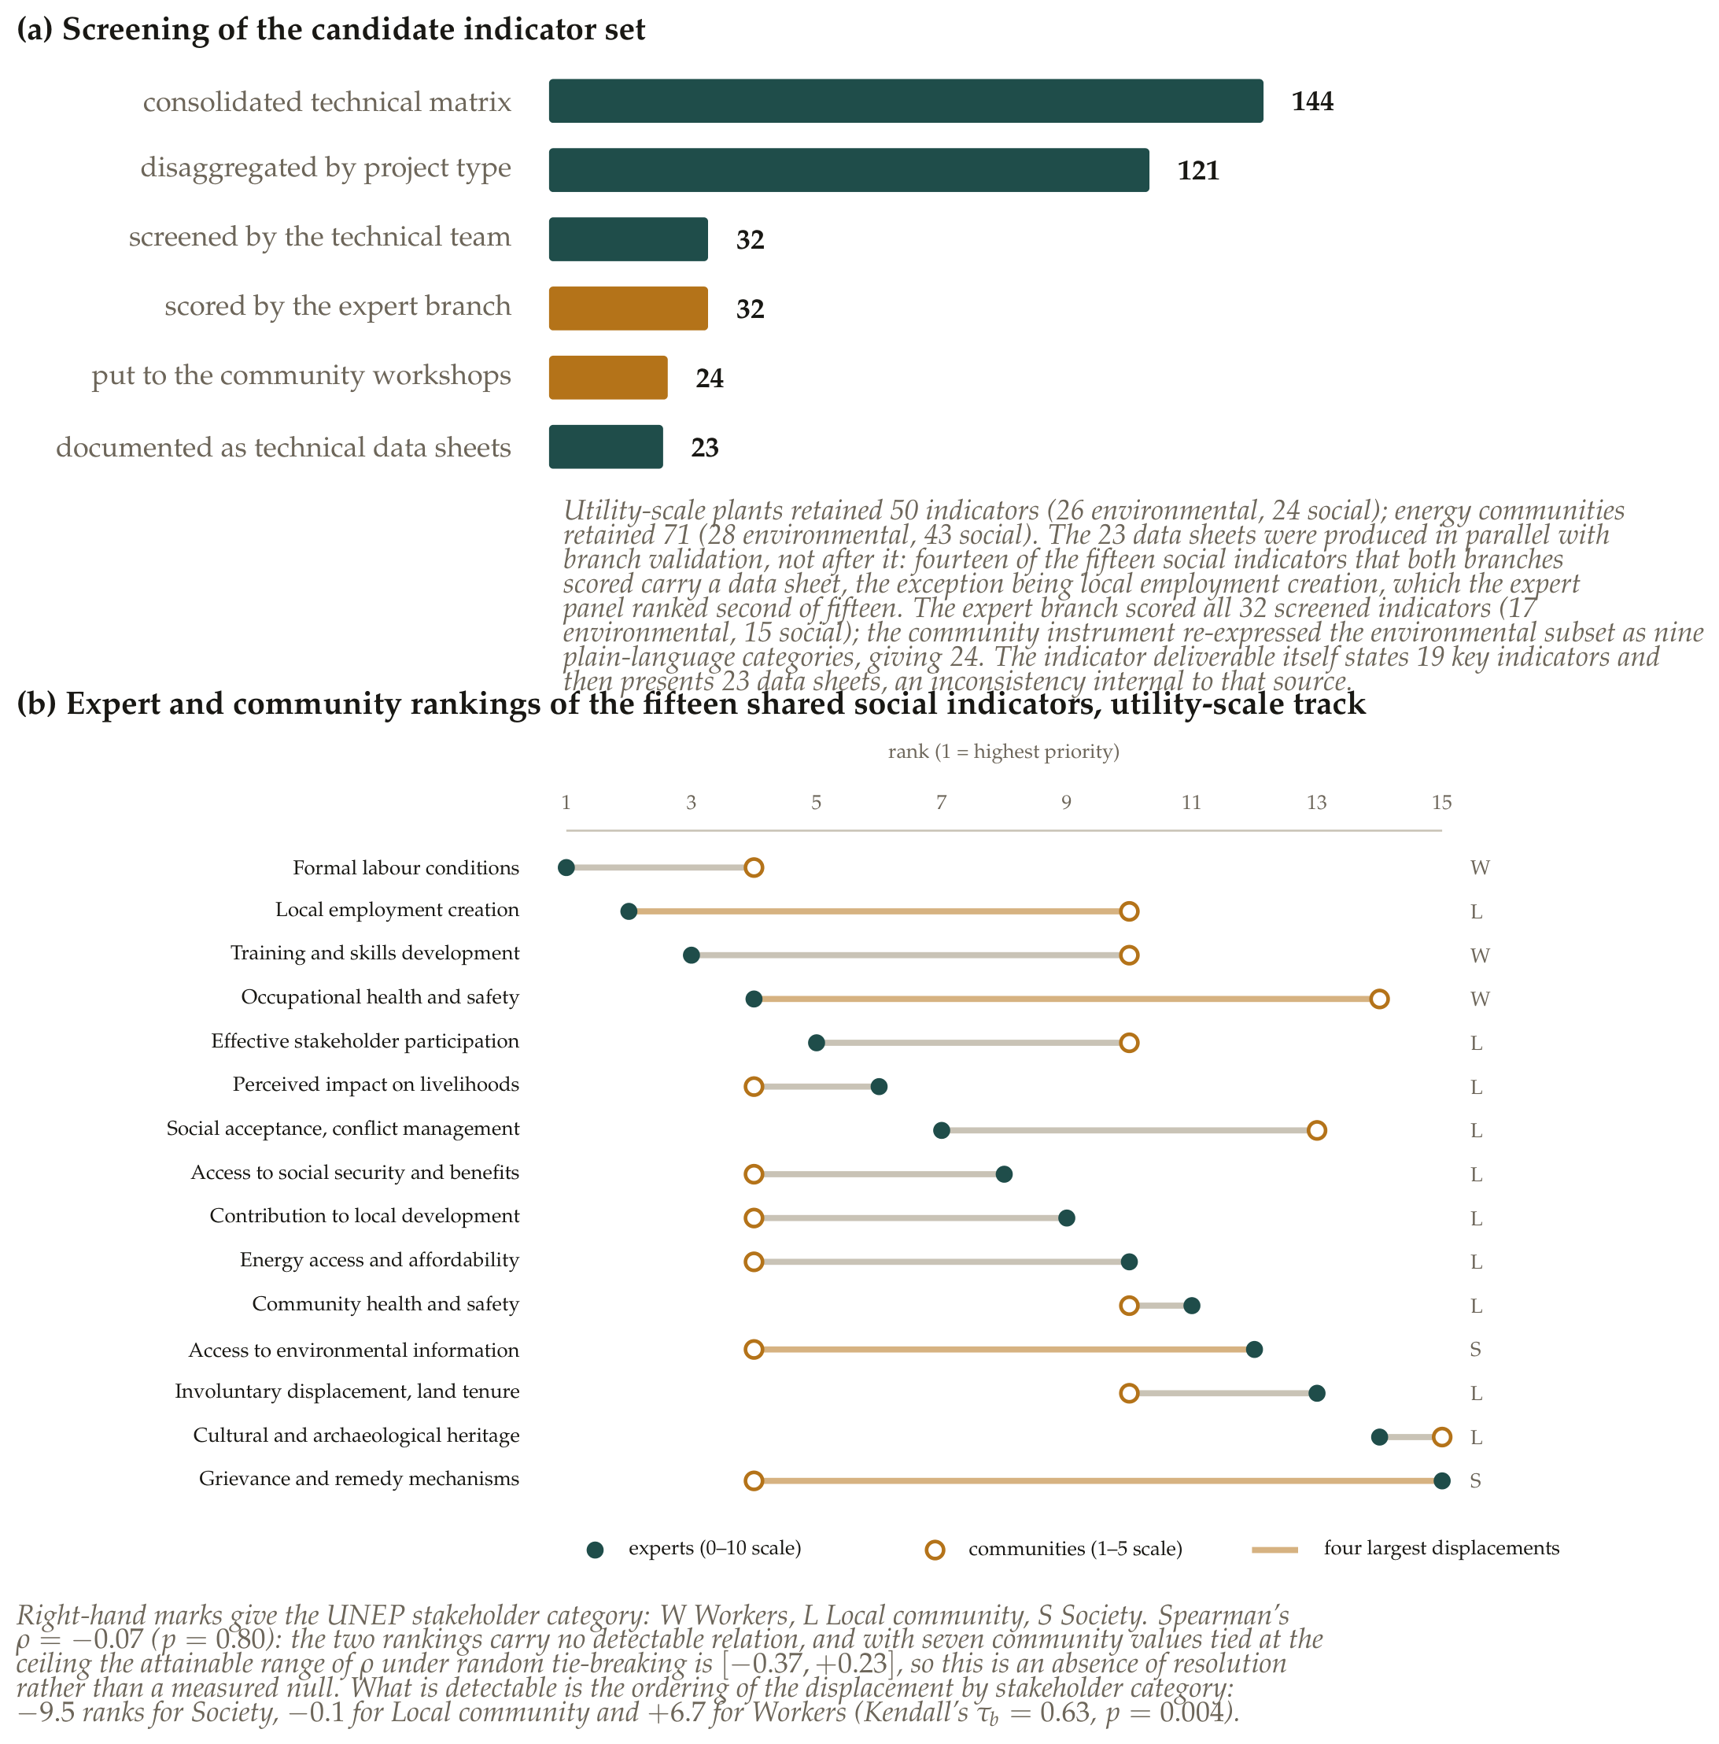
Figure 8.
Sensitivity of harmonised photovoltaic indicators to measured quantities. (a) Reference global warming potentials re-scaled by in-plane irradiation and performance ratio; manufacturing, balance-of-system and end-of-life inventories are held at the reference values, so the whole effect is the change in delivered energy. Performance ratio 0.75, band 0.70–0.80; multi-Si is retained because it remains widely installed in the Colombian fleet, although the 2026 IEA PVPS inventory edition discontinues its datasets. (b) Carbon payback time as a function of the emission factor of the displaced electricity, for the Caribbean scenario (1900 kWh m−2 yr−1, 1425 kWh kWp−1 yr−1). The three marked points are the factors the Colombian authorities publish for the same grid: 0.164 for corporate carbon-footprint accounting, 0.220 as the annual inventory average, and 0.660 as the combined margin for emissions displaced by new wind and solar projects. The 0.220 and 0.660 factors are published by the same institution for the same year and differ by a factor of 3.0; across the full set in force the indicator varies by a factor of 4.0 for the same installation.
Figure 8.
Sensitivity of harmonised photovoltaic indicators to measured quantities. (a) Reference global warming potentials re-scaled by in-plane irradiation and performance ratio; manufacturing, balance-of-system and end-of-life inventories are held at the reference values, so the whole effect is the change in delivered energy. Performance ratio 0.75, band 0.70–0.80; multi-Si is retained because it remains widely installed in the Colombian fleet, although the 2026 IEA PVPS inventory edition discontinues its datasets. (b) Carbon payback time as a function of the emission factor of the displaced electricity, for the Caribbean scenario (1900 kWh m−2 yr−1, 1425 kWh kWp−1 yr−1). The three marked points are the factors the Colombian authorities publish for the same grid: 0.164 for corporate carbon-footprint accounting, 0.220 as the annual inventory average, and 0.660 as the combined margin for emissions displaced by new wind and solar projects. The 0.220 and 0.660 factors are published by the same institution for the same year and differ by a factor of 3.0; across the full set in force the indicator varies by a factor of 4.0 for the same installation.
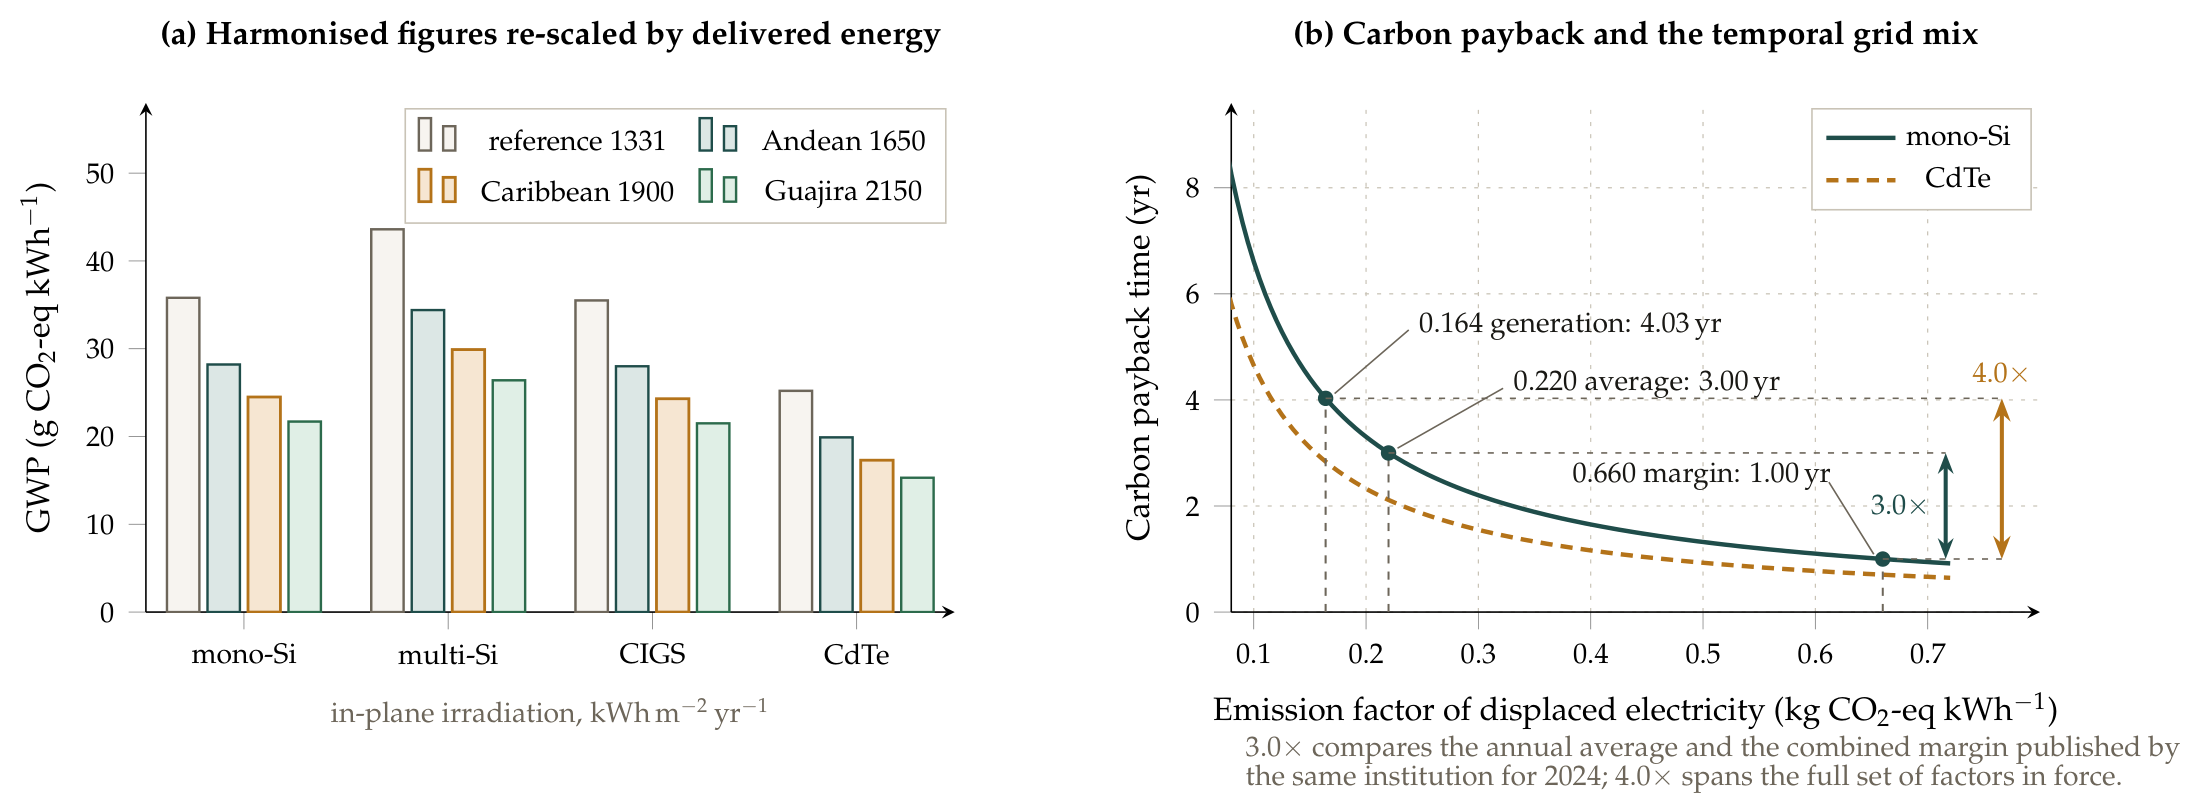
Figure 9.
Validation of the system as tested. (a) Mean response time of the public front end under increasing concurrent load, with zero errors at every step across 8500 samples—a total summed here from the four load steps reported separately in the source—and with content delivery network caching listed conditionally among the campaign’s preconditions, though whether it was enabled is not recorded. (b) Heuristic inspection against the ten Nielsen heuristics over a 44-item checklist: 29 passes, 8 failures, 6 not applicable and one item with no recorded result. Maximum recorded severity was 2 (minor); no major or catastrophic findings were recorded, and three heuristics returned no findings at all.
Figure 9.
Validation of the system as tested. (a) Mean response time of the public front end under increasing concurrent load, with zero errors at every step across 8500 samples—a total summed here from the four load steps reported separately in the source—and with content delivery network caching listed conditionally among the campaign’s preconditions, though whether it was enabled is not recorded. (b) Heuristic inspection against the ten Nielsen heuristics over a 44-item checklist: 29 passes, 8 failures, 6 not applicable and one item with no recorded result. Maximum recorded severity was 2 (minor); no major or catastrophic findings were recorded, and three heuristics returned no findings at all.
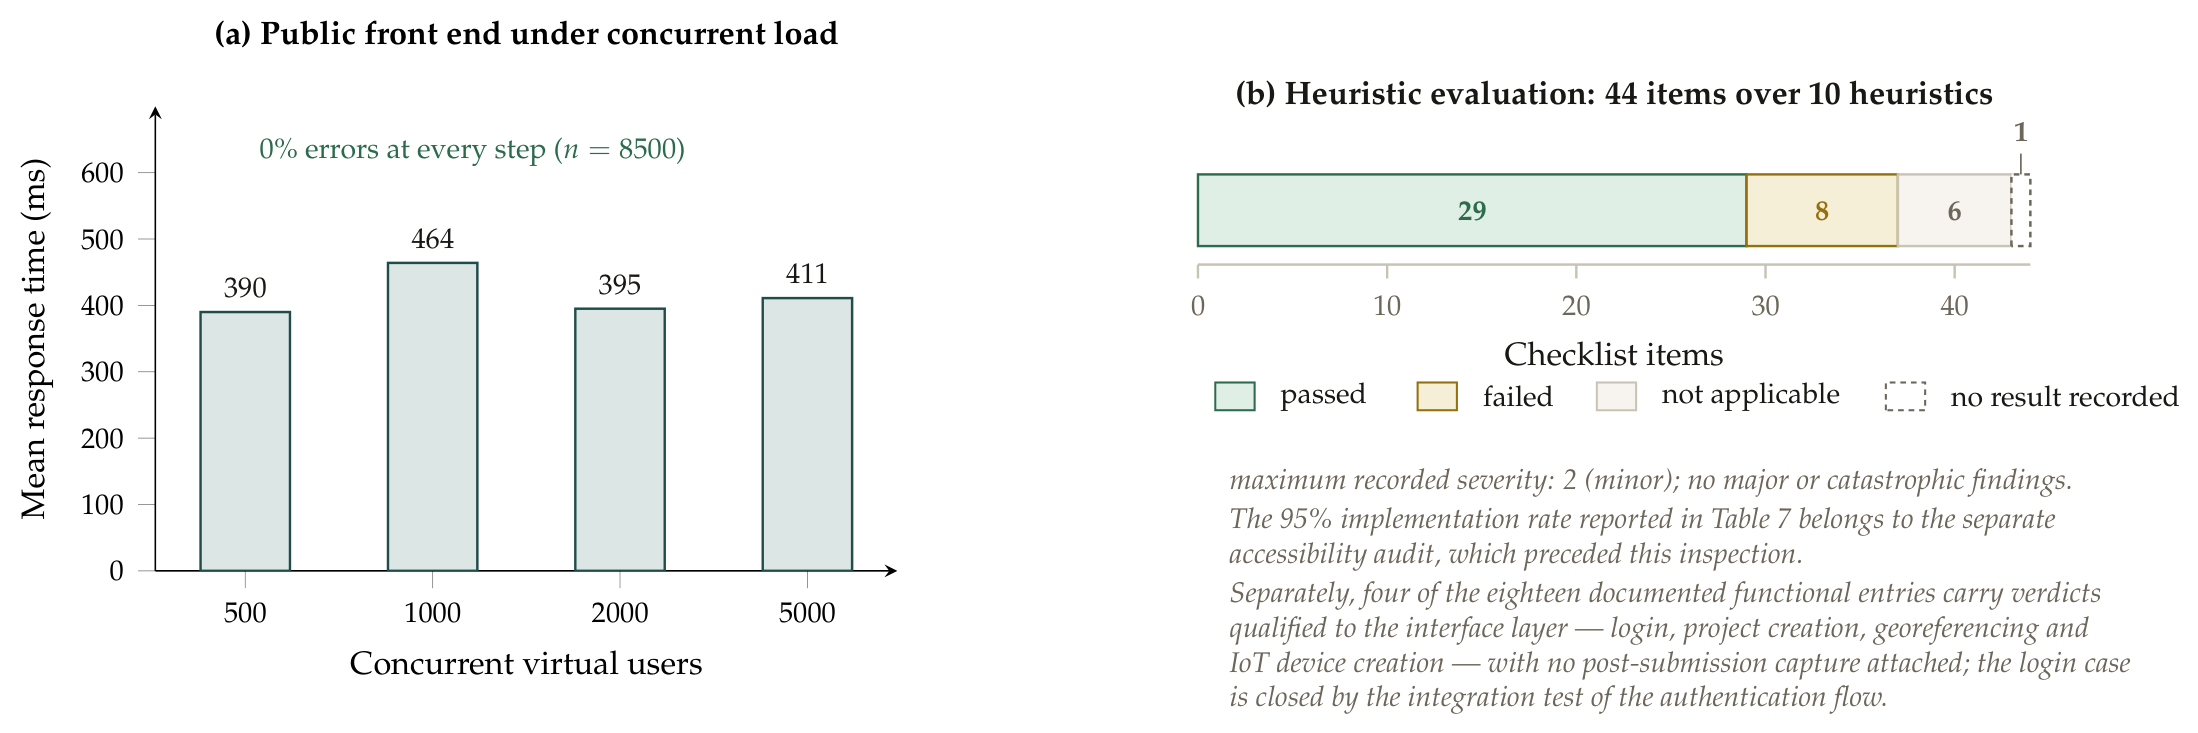
Figure 10.
Prioritisation of enabling technologies by nineteen experts from five national bodies. (a) Objective criterion weights obtained by CRITIC, recomputed by us from the published decision matrix; the source publishes only the three leading weights and reports 16.69% for ease of integration where the recomputation returns 15.69%. The five remaining weights are shown as a combined residual and given individually in Table S5. (b) Ordering by TOPSIS closeness coefficient, recomputed from the same matrix, with the recommended deployment sequence marked. The two are inverted by design.
Figure 10.
Prioritisation of enabling technologies by nineteen experts from five national bodies. (a) Objective criterion weights obtained by CRITIC, recomputed by us from the published decision matrix; the source publishes only the three leading weights and reports 16.69% for ease of integration where the recomputation returns 15.69%. The five remaining weights are shown as a combined residual and given individually in Table S5. (b) Ordering by TOPSIS closeness coefficient, recomputed from the same matrix, with the recommended deployment sequence marked. The two are inverted by design.
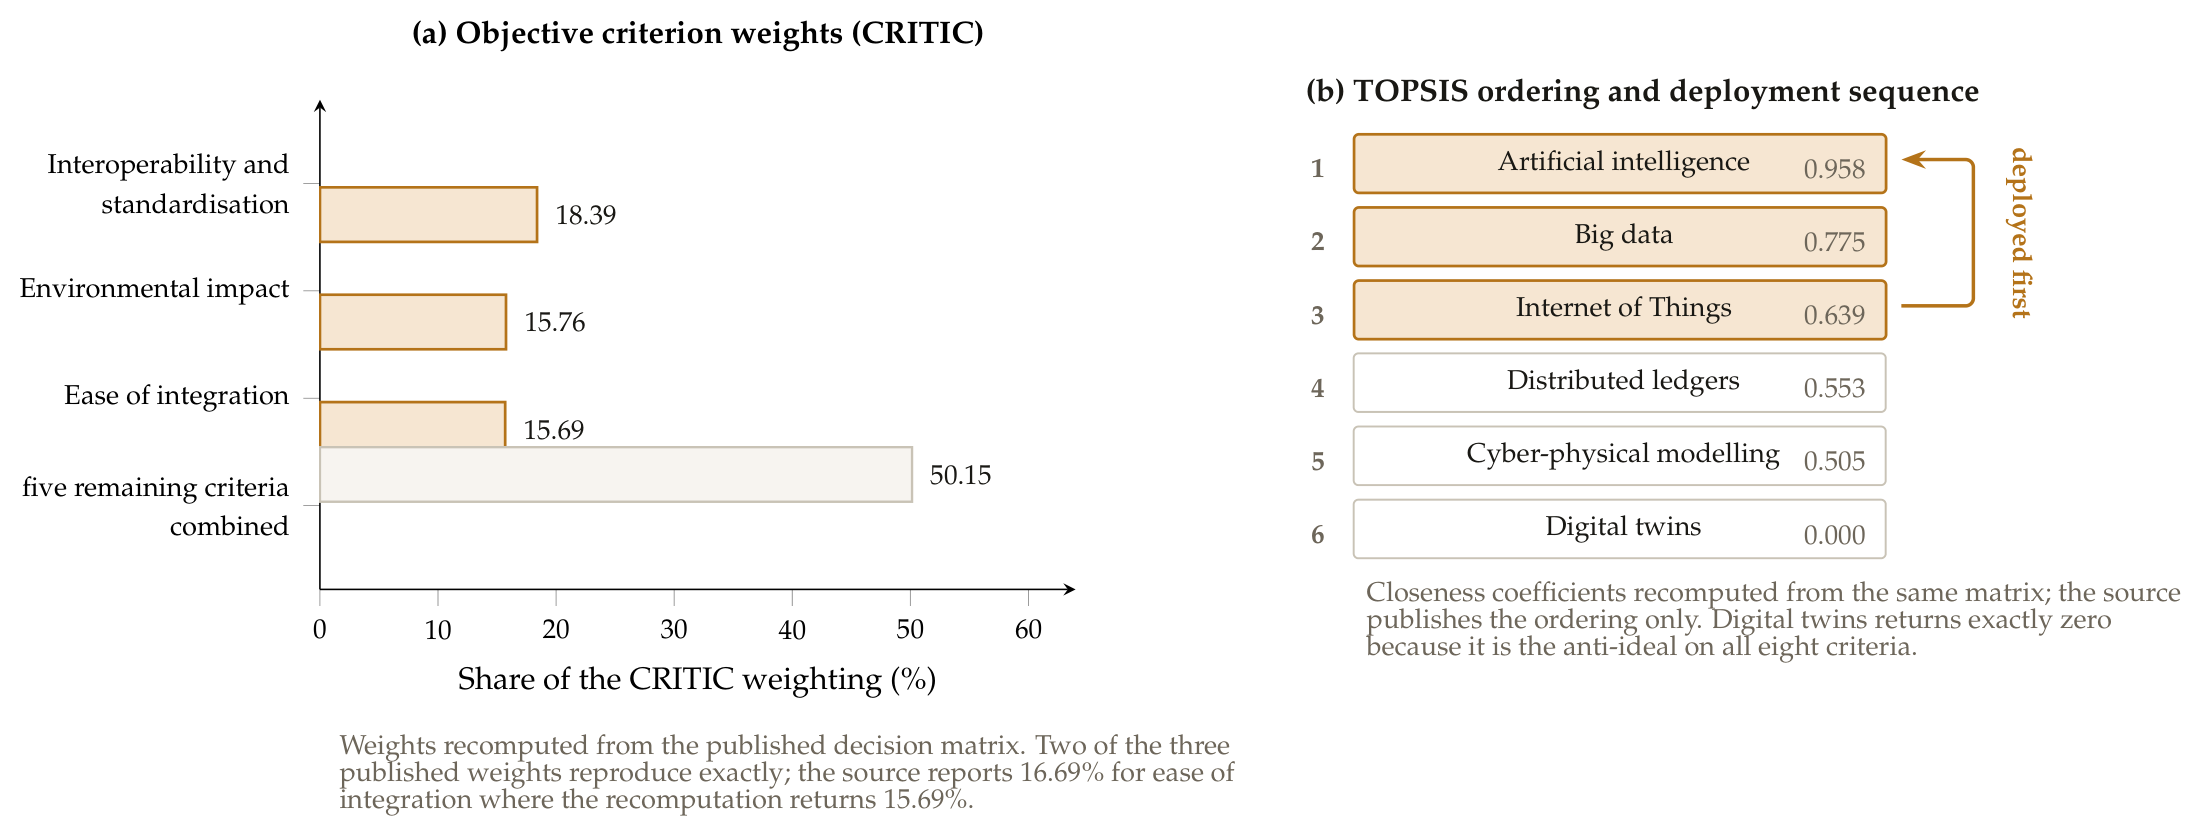

Table 1.
Positioning against the closest prior art. Entries describe what each study reports, not what its architecture could in principle support—including for the present work, whose telemetry path is exercised end to end against a test instance rather than fed by field measurement.
Table 1.
Positioning against the closest prior art. Entries describe what each study reports, not what its architecture could in principle support—including for the present work, whose telemetry path is exercised end to end against a test instance rather than fed by field measurement.
| Study | Domain | Inventory source | Provenance | Social dimension |
|---|---|---|---|---|
| Tao et al. [30] | Discrete manufacturing | RFID and bill of materials | Not addressed | Absent |
| An et al. [47] | Wind turbines | Embedded proprietary sensors | Not addressed | Absent |
| Ferrari et al. [32] | Ceramic tiles | Enterprise resource planning | Not addressed | Absent |
| Papadopoulos et al. [48] | Island energy community | External APIs, operational and simulated | Not addressed | Investment appraisal only |
| Ahmad Affandi et al. [49] | Photovoltaics | Modelled temporal scenarios | Not addressed | Absent |
| Trofimenko et al. [33] | Freight logistics | RFID, IoT and MES/ERP | Not addressed | Absent |
| Albelwi [34] | Building construction | BIM, EPD and sensor streams; proxy values in results | Not addressed | Absent |
| Kahn et al. [44] | Federal LCA data repository | Curated agency datasets; no sensors | Canonical flow list, UUID lineage | Absent |
| Vasheghani Farahani and Treiblmaier [45] | Photovoltaic telemetry logging | Field telemetry, 10,268 records over 135 h | SHA-256 chain, Merkle roots anchored on Ethereum, transactions evidenced | No life cycle inventory |
| This work | Photovoltaics | Sensor telemetry through a versioned semantic mapping layer; exercised against a test instance, not yet field-fed | Hash-chained and tamper-evident under single custody, with an anchoring interface exercised against a permissioned instance | 15 social indicators scored by communities |
Table 2.
Specification of the architecture, with the implementation status of each element. The status column is reported so that the scope of the empirical claims in Section 4 is unambiguous. No deliverable assigns implementation states to architectural elements; the status column is our own reading of the project record, and the version numbers in the technology column are those of the integration test environment (Section 3.9), not of a pinned production specification.
Table 2.
Specification of the architecture, with the implementation status of each element. The status column is reported so that the scope of the empirical claims in Section 4 is unambiguous. No deliverable assigns implementation states to architectural elements; the status column is our own reading of the project record, and the version numbers in the technology column are those of the integration test environment (Section 3.9), not of a pinned production specification.
| Element | Function | Technology | Protocol | Status |
|---|---|---|---|---|
| Web front end | Role-differentiated interface, capture and consultation | React | HTTPS | implemented |
| Interoperability API | Orchestration of operations and integrations; audit trail | .NET 8 | REST/JSON | implemented |
| Consumption API | Reads, KPIs and dataset export | .NET 8 | REST/JSON, CSV | implemented |
| IoT connector | Device registration, variable discovery, telemetry retrieval | .NET 8 | REST, SDK | implemented |
| Semantic mapping engine | Operator-validated, versioned key resolution | .NET 8 | internal | implemented |
| LCA connector | Project creation, inventory submission, run control | .NET 8 | REST | implemented |
| Provenance store | Append-only hash chain with break detection | relational store | internal | implemented |
| Ledger anchoring interface | Hash anchoring and external verification | .NET 8, Web3 | REST, Web3 | exercised |
| ETL | Ingestion, validation, normalisation, dimensional load | Python 3 | scheduled jobs | exercised, test data |
| Data lake | Raw telemetry, partitioned by date and device | object storage | files | partial |
| Dimensional warehouse | Star schema over production, LCA and community facts | relational | SQL | partial |
| Operational database | Transactional entities and audit trail | relational, EF Core | SQL | implemented |
| Predictive engine | Forecasting and anomaly detection for dashboards | Python | REST | laboratory |
| IoT platform | Device management and time-series storage | ThingsBoard CE 3.6 | MQTT, HTTP | implemented |
| LCA engine | Impact assessment execution | openLCA, headless | REST | implemented |
| Field sensor layer | Environmental and operational acquisition | sensor nodes | MQTT, HTTP/TLS | specified |
implemented: built and exercised in the delivered system. exercised: built and exercised against a test instance, not against field telemetry or a production ledger; for the anchoring interface, end-to-end on-chain verification is not fully evidenced in the record (Section 3.8). partial: built with reduced scope. laboratory: trained or prototyped, not in service. specified: designed but not built. The specified sensor layer names solar radiation among its prioritised variables but fixes no instrument specification for it, and specifies no metering point for active power or delivered energy; see Section 5.6.
Table 3.
Quantified non-functional requirements adopted for the deployment. These are design thresholds agreed with the operating institution; measured values, where the test campaign captured them, are reported in Table 8.
Table 3.
Quantified non-functional requirements adopted for the deployment. These are design thresholds agreed with the operating institution; measured values, where the test campaign captured them, are reported in Table 8.
| Requirement | Threshold |
|---|---|
| Read latency, queries returning up to 100 rows | 95th percentile ≤ 800 ms |
| Ingestion latency, from receipt to availability | 95th percentile ≤ 5 s |
| Impact assessment run, medium inventories | 95th percentile ≤ 5 min, asynchronous |
| Time base for all records | ISO 8601 UTC, NTP offset ≤ 1 s |
| Geospatial reference for all geometries | EPSG:4326 |
| Telemetry payloads | JSON Schema, SI units, normalised MQTT topics |
| Transport security | TLS 1.2 or above; MQTT over TLS with per-device mutual TLS or signed token |
| Interface versioning | OpenAPI 3, semantic versioning |
| Accessibility of public interfaces | WCAG 2.1 level AA |
| Invalid records | quarantined and logged, never silently discarded |
| Ingestion semantics | idempotent under duplication and reordering |
Table 4.
Environmental indicators carried to technical data sheets, with modellability in openLCA as recorded in the technical screening table of the project record, and IoT observability as assessed in this work. Three of the nine documented indicators are endpoint or ecosystem categories that do not appear in the screening table, so no modellability attribute is recorded for them; the corresponding midpoint categories are recorded as modellable.
Table 4.
Environmental indicators carried to technical data sheets, with modellability in openLCA as recorded in the technical screening table of the project record, and IoT observability as assessed in this work. Three of the nine documented indicators are endpoint or ecosystem categories that do not appear in the screening table, so no modellability attribute is recorded for them; the corresponding midpoint categories are recorded as modellable.
| Indicator | Calculation | Unit | Method basis | openLCA | IoT |
|---|---|---|---|---|---|
| Greenhouse gases | , scopes 1–3 | kg CO2eq kWh−1 | IPCC GWP100 | yes | partial |
| Net water consumption | , scarcity weighted | m3eq kWh−1 | AWARE [90] | yes | high |
| Energy payback time | yr | IEA PVPS T12 | no | very high | |
| Carbon payback time | yr | IEA PVPS T12 | no | very high | |
| Cumulative energy demand | over carriers | MJ kWh−1 | CED | yes | low |
| Land occupation and transformation | area × duration × biodiversity factor | m2yr kW−1 | ReCiPe midpoint [91] | yes | medium |
| Human health | , fate and exposure | DALY | USEtox [92] | n.r. | low |
| Resources | , marginal replacement cost | USD t−1 | ReCiPe endpoint | n.r. | low |
| Biodiversity loss | over pressures | species yr | ReCiPe endpoint | n.r. | medium |
n.r.: not recorded in the screening table. , embodied primary energy; , annual generation; , grid primary-energy conversion efficiency; , life cycle emissions; , annual avoided emissions.
Table 5.
Expert and community scores for the fifteen social indicators put to both branches in the same wording, utility-scale solar park track. Expert values are grand means over the four criterion-level scores of the two momentos of 21 July 2025 on a 0–10 scale, with their across-criteria range; the workshop recorded thirty-three attendees, the utility-scale momentos drew respondents each and the energy-community momentos, used in the comparisons reported in the text, and . Community values are means of the group-level consensus scores of 25 July 2025 on a 1–5 scale, pooled across the three social working groups (two utility-scale, one energy community); occupational health and safety was scored by two of the three. Pooling is necessary because separating the tracks leaves a single group, and for some indicators a single score, on each side; the two track-matched checks are asymmetric and both are reported in the text. Ranks are average ranks and rank is the community rank minus the expert rank. Stakeholder categories follow [59,60]; the crosswalk is ours and was fixed before the ordered test reported in the text was run. Spearman’s (). Per-respondent and per-group data are Tables S10 and S11, the crosswalk Table S12, and the complete robustness suite Table S13.
Table 5.
Expert and community scores for the fifteen social indicators put to both branches in the same wording, utility-scale solar park track. Expert values are grand means over the four criterion-level scores of the two momentos of 21 July 2025 on a 0–10 scale, with their across-criteria range; the workshop recorded thirty-three attendees, the utility-scale momentos drew respondents each and the energy-community momentos, used in the comparisons reported in the text, and . Community values are means of the group-level consensus scores of 25 July 2025 on a 1–5 scale, pooled across the three social working groups (two utility-scale, one energy community); occupational health and safety was scored by two of the three. Pooling is necessary because separating the tracks leaves a single group, and for some indicators a single score, on each side; the two track-matched checks are asymmetric and both are reported in the text. Ranks are average ranks and rank is the community rank minus the expert rank. Stakeholder categories follow [59,60]; the crosswalk is ours and was fixed before the ordered test reported in the text was run. Spearman’s (). Per-respondent and per-group data are Tables S10 and S11, the crosswalk Table S12, and the complete robustness suite Table S13.
| Social indicator | Stakeholder | Experts (0–10) | Comm. | rank | ||
|---|---|---|---|---|---|---|
| category | score | min–max | rank | score / rank | ||
| Formal labour conditions | Workers | 9.50 | 9.0–10.0 | 1 | 5.00 / 4 | |
| Local employment creation | Local comm. | 9.29 | 9.0–9.7 | 2 | 4.67 / 10 | |
| Training and skills development | Workers | 9.00 | 8.7–9.7 | 3 | 4.67 / 10 | |
| Occupational health and safety | Workers | 8.92 | 7.7–9.5 | 4 | 4.00 / 14 | |
| Effective stakeholder participation | Local comm. | 8.88 | 8.5–9.0 | 5 | 4.67 / 10 | |
| Perceived impact on local livelihoods | Local comm. | 8.63 | 7.3–9.5 | 6 | 5.00 / 4 | |
| Social acceptance and conflict management | Local comm. | 8.58 | 8.5–8.7 | 7 | 4.33 / 13 | |
| Access to social security and benefits | Local comm. | 8.54 | 7.7–9.5 | 8 | 5.00 / 4 | |
| Contribution to local development | Local comm. | 8.38 | 7.3–9.7 | 9 | 5.00 / 4 | |
| Energy access, affordability and reliability | Local comm. | 8.17 | 7.3–8.7 | 10 | 5.00 / 4 | |
| Community health and safety | Local comm. | 8.04 | 6.3–10.0 | 11 | 4.67 / 10 | |
| Access to environmental and social information | Society | 7.92 | 6.7–10.0 | 12 | 5.00 / 4 | |
| Involuntary displacement and land tenure risk | Local comm. | 7.50 | 5.7–8.7 | 13 | 4.67 / 10 | |
| Cultural and archaeological heritage | Local comm. | 7.25 | 4.7–9.0 | 14 | 3.33 / 15 | |
| Grievance and remedy mechanisms | Society | 6.75 | 6.0–7.3 | 15 | 5.00 / 4 | |
Table 6.
Sensitivity of the ordered stakeholder test to the crosswalk and to the community column. correlates the category order (Society, Local community, Workers—outermost to innermost) against rank; permutation p from 200,000 pairing permutations, computed by File S14. Every single reassignment we or the reviewers could justify leaves the result nominally significant; the conjunction of the two most adversarial readings does not. The full suite, including Jonckheere–Terpstra and the leave-one-out results, is Table S13.
Table 6.
Sensitivity of the ordered stakeholder test to the crosswalk and to the community column. correlates the category order (Society, Local community, Workers—outermost to innermost) against rank; permutation p from 200,000 pairing permutations, computed by File S14. Every single reassignment we or the reviewers could justify leaves the result nominally significant; the conjunction of the two most adversarial readings does not. The full suite, including Jonckheere–Terpstra and the leave-one-out results, is Table S13.
| Reading | p | perm. p | |
|---|---|---|---|
| As published (Table 5, Table S12) | 0.626 | 0.004 | 0.002 |
| Local employment creation read as Workers a | 0.719 | 0.001 | <0.001 |
| Access to information read as Local community | 0.555 | 0.012 | 0.009 |
| Grievance mechanisms read as Local community | 0.527 | 0.017 | 0.015 |
| Social benefits read as Workers | 0.496 | 0.022 | 0.023 |
| Both Society indicators read as Local community | 0.455 | 0.043 | 0.048 |
| Both Society as Local community and benefits as Workers | 0.324 | 0.151 | 0.176 |
| Community column restricted to the two utility-scale groups | 0.632 | 0.004 | 0.002 |
a The grouping used in an earlier draft, corrected to Local community after a reviewer pointed out that UNEP places local employment there. We record it because the correction cost us the stronger statistic.
Table 7.
The two environmental instruments. The left-hand column is the seventeen-indicator midpoint set scored by the expert panel, with its grand mean over the four criterion-level scores of the two momentos with three or more respondents on 21 July 2025 (0–10 scale, utility-scale track); the momento on Colombian relevance and comparability recorded a single respondent and is excluded, so this ranking is computed without the criterion that names the national context. The energy-community environmental grand means quoted in Section 4 average six criteria rather than four, because no momento was excluded on that track. The right-hand columns give the nine plain-language categories put to the community workshops with their mean group score (1–5), aligned to the midpoint set where the correspondence is unambiguous. Blank cells on the right are indicators the communities were not asked about; a question mark marks a correspondence the source record does not state and which we do not resolve.
Table 7.
The two environmental instruments. The left-hand column is the seventeen-indicator midpoint set scored by the expert panel, with its grand mean over the four criterion-level scores of the two momentos with three or more respondents on 21 July 2025 (0–10 scale, utility-scale track); the momento on Colombian relevance and comparability recorded a single respondent and is excluded, so this ranking is computed without the criterion that names the national context. The energy-community environmental grand means quoted in Section 4 average six criteria rather than four, because no momento was excluded on that track. The right-hand columns give the nine plain-language categories put to the community workshops with their mean group score (1–5), aligned to the midpoint set where the correspondence is unambiguous. Blank cells on the right are indicators the communities were not asked about; a question mark marks a correspondence the source record does not state and which we do not resolve.
| Expert instrument: midpoint set | score | rank | Community instrument: category | score |
|---|---|---|---|---|
| Greenhouse gas emissions | 8.75 | 1 | climate change | 3.67 |
| Carbon payback time | 7.91 | 2 | — | |
| Energy payback time | 7.69 | 3 | — | |
| Ozone depletion potential | 7.63 | 4 | — | |
| Cumulative energy demand | 7.59 | 5 | — | |
| Land occupation and transformation | 7.09 | 6 | — | |
| Fossil resource use (embodied energy) | 6.81 | 7 | use of fossil fuels | 3.00 |
| Alternative ozone depletion potential | 6.75 | 8 | — | |
| Net water consumption | 6.59 | 9 | water use | 1.00 |
| Particulate matter effects | 6.53 | 10 | clean air (?) | 3.67 |
| Mineral and metal resource use | 6.41 | 11 | use of minerals and metals | 3.33 |
| Tropospheric ozone formation | 6.25 | 12 | clean air (?) | 3.67 |
| Human toxicity (non-carcinogenic) | 6.19 | 13 | toxicity to people | 3.00 |
| Acidification potential | 6.09 | 14 | clean air (?) | 3.67 |
| Freshwater ecotoxicity | 5.91 | 15 | toxicity to the environment | 3.33 |
| Ionising radiation | 5.44 | 16 | — | |
| Eutrophication potential | 4.94 | 17 | river and lake pollution | 2.00 |
| — | loss of animals and plants | 2.67 | ||
| Indicators in instrument | 17 | 9 | ||
Table 8.
Validation results for the system as tested. Values in the last column are measured unless marked otherwise; entries marked “not instrumented” identify quantities the test campaign did not capture and are carried into the limitations of Section 5.6. All figures are from the test environment described in Section 3.9.
Table 8.
Validation results for the system as tested. Values in the last column are measured unless marked otherwise; entries marked “not instrumented” identify quantities the test campaign did not capture and are carried into the limitations of Section 5.6. All figures are from the test environment described in Section 3.9.
| Level | Measure | Result |
|---|---|---|
| Functional | End-to-end functional tests a | 8 |
| Functional | Documented test scenarios in the deliverable body a | 18 |
| Functional | Pass rate; critical or blocking defects | 100%; none |
| Unit and integration | Test cases executed, all levels | 45 (8 / 30 / 7) |
| Unit | Code coverage against an 80% threshold, controller layer d | 90% |
| Integration | Code coverage against an 80% threshold, controller layer d | 87% |
| Integration | Device creation with IoT platform synchronisation | 5.2 s, pass |
| Integration | Telemetry retrieval with key discovery and date filtering | 3.5 s, pass |
| Integration | Full authentication flow | 2.3 s, pass |
| Integration | Company, project and georeferencing flow | 3.8 s, pass |
| Integration | Community engagement flow | 4.1 s, pass |
| Operational | Device creation with remote registration | 1.8 s |
| Operational | Telemetry query returning more than 1000 records | 2.5 s |
| Operational | Standard API response time | < 500 ms |
| Operational | Operations involving external services | < 3 s |
| Operational | Availability during the test period | 99.8% |
| Load b | Concurrent virtual users, mean response, error rate | 500: 390 ms, 0% |
| Load | 1000: 464 ms, 0% | |
| Load | 2000: 395 ms, 0% | |
| Load | 5000: 411 ms, 0% | |
| Load | Saturation within the tested range | none observed |
| Load | Percentiles, throughput, server resource use | not instrumented |
| Code quality | Mean cyclomatic complexity | 8 |
| Code quality | XML documentation of public methods | 95% |
| Interface | Heuristic items: pass / fail / not applicable / unrecorded c | 29 / 8 / 6 / 1 of 44 |
| Interface | Maximum recorded severity | 2 (minor) |
| Interface | Number of evaluators | not stated in record |
| Accessibility audit c | Findings implemented in the second design iteration | 95% |
a The source deliverable reports functional testing in two granularities that do not reconcile: 18 documented scenario-level entries in its body—its own numbering and the closing report both say seventeen—and 8 end-to-end functional tests in its consolidated 45-case breakdown. Both partitions sum to 45, so neither can be preferred on that ground; we report both and use the documented body counts wherever a case-level verdict is needed. See Section 3.9. b Content delivery network caching is listed conditionally among the campaign’s preconditions and the evaluator attributes the absence of degradation partly to it, though whether it was enabled is not recorded; the source also notes that the 5 s ramp-up for 2000 threads is aggressive. The figures establish headroom for the public endpoint rather than server capacity. c The heuristic inspection and the accessibility audit are separate exercises: the 95% implementation rate belongs to the accessibility audit, which preceded the second design iteration, and not to the heuristic inspection, which followed it and still returned eight failures. d Coverage is measured over the controller layer. The mapping engine, the hash chain and the openLCA connector carry no dedicated unit tests, and two of the three fall inside the 80% target the emerging-technologies deliverable sets on critical domains; see Section 3.9.
Table 9.
CRITIC–TOPSIS decision matrix. Scores are geometric means of nineteen expert responses on a one-to-five scale, collected in a single technical session with participants from the hydrocarbons agency, the energy planning unit, the institute for non-interconnected zones, the licensing authority and the ministry of mines and energy, using a QuestionPRO instrument. CRITIC weights and TOPSIS closeness coefficients were computed in a spreadsheet implementation by the project team; the source record reports the ranking and three criterion weights but no closeness coefficients. We recomputed both from the matrix below, reproducing two of the three published weights exactly and correcting the third from 16.69% to 15.69%. The matrix, the full recomputed weight vector and the recomputed closeness coefficients are given in machine-readable form as Table S5, labelled as recomputed.
Table 9.
CRITIC–TOPSIS decision matrix. Scores are geometric means of nineteen expert responses on a one-to-five scale, collected in a single technical session with participants from the hydrocarbons agency, the energy planning unit, the institute for non-interconnected zones, the licensing authority and the ministry of mines and energy, using a QuestionPRO instrument. CRITIC weights and TOPSIS closeness coefficients were computed in a spreadsheet implementation by the project team; the source record reports the ranking and three criterion weights but no closeness coefficients. We recomputed both from the matrix below, reproducing two of the three published weights exactly and correcting the third from 16.69% to 15.69%. The matrix, the full recomputed weight vector and the recomputed closeness coefficients are given in machine-readable form as Table S5, labelled as recomputed.
| Criterion | IoT | Big data | Digital twins | Ledger | AI | CPS modelling |
|---|---|---|---|---|---|---|
| Environmental impact | 4.076 | 4.373 | 2.352 | 2.862 | 4.317 | 3.315 |
| Social impact | 3.898 | 4.573 | 2.605 | 4.129 | 4.317 | 3.641 |
| Technological maturity | 3.981 | 4.573 | 2.702 | 3.776 | 4.373 | 4.129 |
| Implementation and maintenance cost | 3.807 | 3.594 | 2.993 | 3.728 | 3.949 | 3.520 |
| Ease of integration | 2.724 | 3.245 | 2.169 | 2.993 | 3.520 | 3.438 |
| Adaptability to complex territories | 2.724 | 3.064 | 1.741 | 2.825 | 3.594 | 3.245 |
| Interoperability and standardisation | 3.807 | 4.317 | 2.862 | 4.129 | 4.373 | 3.017 |
| Community acceptance and legitimacy | 3.366 | 3.104 | 1.888 | 3.129 | 4.129 | 2.492 |
| Rank (TOPSIS) | 3 | 2 | 6 | 4 | 1 | 5 |
Disclaimer/Publisher’s Note: The statements, opinions and data contained in all publications are solely those of the individual author(s) and contributor(s) and not of MDPI and/or the editor(s). MDPI and/or the editor(s) disclaim responsibility for any injury to people or property resulting from any ideas, methods, instructions or products referred to in the content. |
© 2026 by the authors. Licensee MDPI, Basel, Switzerland. This article is an open access article distributed under the terms and conditions of the Creative Commons Attribution (CC BY) license.
Copyright: This open access article is published under a Creative Commons CC BY 4.0 license, which permit the free download, distribution, and reuse, provided that the author and preprint are cited in any reuse.