

Submitted:
08 September 2026
Posted:
09 September 2026
You are already at the latest version
Abstract
This study investigates the pathway through which short-term macroeconomic dynamics impact the financial performance of publicly listed residential real estate firms in Israel, addressing a gap in the literature that often focuses solely on macro-level housing market aggregates. We employ Structural Equation Modeling (SEM) on 190 firm-year observations from 38 companies spanning the high-volatility period of 2020–2024. The model, which demonstrated strong overall explanatory power, maps the linkages from core macroeconomic inputs (interest rates, construction costs) to corporate profitability. Core results reveal a stark divergence in the efficacy of macroeconomic tools: While Central Bank interest rate hikes powerfully suppress transaction volumes, corporate profitability is primarily driven by the positive and significant transmission of Construction Input Index (CII) inflation to housing prices. Crucially, this study quantifies the effect of Israel’s unique institutional feature: the widespread contractual indexation of pre-sale agreements. This mechanism functions as an effective risk-transfer conduit, insulating developers from cost volatility and allowing them to convert market price appreciation into significantly enhanced corporate performance. Furthermore, maintaining a strong capital structure (higher Equity/Assets ratio) is shown to be vital for firm resilience. The findings suggest that effective policy aimed at price moderation must target structural supply rigidity and rising input costs rather than relying exclusively on demand-side monetary interventions.
Keywords:
real estate companies
; Israeli economy
; residential real estate
; housing market
1. Introduction
Over the past two decades, the Israeli residential real estate sector has undergone considerable volatility, shaped by a range of interrelated factors. Key among these are sustained demographic trends, including population growth and household formation [1,2,3], alongside macroeconomic shifts such as changes in interest rates, inflation, and credit conditions [4]. In addition, a series of regulatory reforms (including planning policies, taxation measures, and credit restrictions), have significantly influenced both supply and demand dynamics in the housing market [5,6,7,8]. Finally, the sector has also been affected by major external disruptions, including global and local shocks such as pandemics and armed conflicts [9,10,11]
Despite the extensive literature on housing markets and macroeconomic cycles, relatively few studies have focused specifically on how short-term macroeconomic developments affect the financial performance of publicly listed residential real estate companies in Israel. This study seeks to fill that gap by examining the relationship between key macroeconomic indicators and the financial outcomes of firms operating in Israel’s residential property sector. The paper also contextualizes these findings in light of recent events, including the COVID-19 pandemic, the Ukraine war, and the 2023 Iron Swords conflict, which introduced new sources of risk and uncertainty into the Israeli housing market.
This study seeks to bridge this gap by examining the relationship between key short-term macroeconomic indicators and the financial outcomes of publicly traded residential real estate firms in Israel. We develop an integrated conceptual framework, modelled via structural equations, that maps the linkages from core macroeconomic inputs (interest rates, construction costs, household income) to market outcomes (transaction volumes, housing prices) and ultimately to firm-specific operational performance (EBITDA/Financial Expenses and corporate profitability). The analysis is contextualized within the high-volatility environment of 2020–2024, providing timely insights into corporate resilience during periods of extreme uncertainty.
Our contribution is manifold, offering significant theoretical, empirical, and practical value to the literature on real estate finance, macro-finance, and corporate financial performance: First, theoretically and empirically, we establish and rigorously test an integrated conceptual framework that links short-term macroeconomic changes directly to firm-specific financial outcomes, thereby moving beyond analyses that focus solely on housing prices or purely firm-level factors. Our findings confirm that while monetary policy effectively cools transaction volumes, the primary mechanism driving corporate profitability is the direct positive transmission of Construction Input Index (CII) inflation to housing prices. Second, we quantify the critical function of institutional features, specifically the contractual indexation mechanism unique to the Israeli market. We demonstrate that the Houses Pricing Index (HPI) positively and significantly drives firm operational performance. This is attributed to the systematic practice of linking pre-sale purchase agreements to the Construction Input Index, which serves as an effective mechanism for ex ante risk hedging and cost volatility transfer from the developer to the buyer. In a supply-constrained environment, this institutional arrangement enables publicly listed firms to successfully capitalize on inflation and structural scarcity, allowing for the capture of economic rents fueled by market inflexibility. Third, we provide essential Policy Implications. Our analysis reveals that Central Bank interest rate hikes, while effective at restricting demand, fail to address the fundamental inflationary drivers rooted in structural supply rigidity and rising input costs. This suggests that policy interventions aimed at price moderation must focus on supply-side solutions, such as tackling the costly and slow planning and zoning processes and potentially addressing the direct costs embodied in the Construction Input Index.
Finally, the study offers valuable Managerial and Investor Implications. We underscore the importance of capital structure, showing that higher Equity/Assets ratios enhance firm performance, providing resilience against the intensified credit risk associated with tighter macroprudential regulation and rising interest rates. For investors, the findings suggest that residential real estate securities may function as a partial hedge against domestic inflation, indicating that monitoring macroeconomic inputs, particularly the CII and the Central Bank Interest Rate, is crucial for assessing future firm performance.
The remainder of the paper is structured as follows. A literature review is presented in section 2. The research method and the empirical results are described in sections 3 and 4, accordingly. Section 5 discusses the findings, conclusions and the study’s contribution. Finally, section 6 presents the limitations, and highlights future implications.
2. Literature Review
2.1. The Israeli Residential Real Estate Sector
The real estate sector is characterized by lengthy planning and project approval processes [12], alongside land use planning policies that cause supply to respond more slowly than demand [13,14,15,16]. Construction cycles tend to be relatively long, often exceeding ten years, both in residential and non-residential construction. These characteristics underscore the relatively weak correlation between the residential construction input price index and the housing price index. For example, between 2020 and 2024, the residential construction input price index increased by 15.8%, whereas the housing price index rose by 45.7% [17] .
A sustained increase in real housing prices began in Israel in 2008 [7], averaging about 2.9% annually, characterized by long price cycles [18]. This rate is not unusual internationally: OECD real prices grew 1.9% annually (1970–2019), while Israel’s rose 2.7%, still within OECD norms. Yakhin and Gamrasni [2021] found that nearly half of the 2008–2011 price increase was attributable to under-pricing (13.7%) of housing in the preceding years. This finding is consistent with Dovman et al. [2012], who argued that much of the 2008 price increase stemmed from historically low housing prices between 1996 and 2007 [19].
2.2. Macroeconomic Factors, Characteristics and Risks
As noted by the Bank of Israel [20], demand for residential housing is subject to cyclical fluctuations driven by macroeconomic factors and by specific characteristics and risks, as follows:
2.2.1. Competitors
The Israeli residential real estate sector is characterized by a large number of competing developers and companies, contributing to a highly fragmented and competitive market landscape [21]. This dynamic competition exerts continuous pressure on firms to secure strategic land reserves in order to sustain operations and maintain future project pipelines. Consequently, substantial capital is routinely allocated toward land acquisition, often ahead of full planning approvals [22].
However, the sector faces structural constraints due to a persistent shortage of available land for residential construction, especially in high-demand urban centers such as Tel Aviv, Jerusalem, and the central region. This scarcity is driven in part by restrictive land-use policies, bureaucratic planning procedures, and a significant portion of land under state ownership, which slows down the release and development of new plots [23,24]. As a result, the imbalance between limited land supply and growing housing demand has contributed to sustained price increases in the housing market over the past two decades [21].
2.2.2. Population Growth
Since the 1980s, the Israeli residential real estate sector has been primarily driven by relatively stable household demand [22]. This demand is closely linked to persistent population growth and the perception of housing as a long-term investment vehicle, largely due to continuous increases in home prices across decades [12]. Israel’s population has grown at a faster pace than most OECD countries, fueled by high birth rates [25], steady immigration (notably from the former Soviet Union in the 1990s and more recently from countries such as France and Ukraine), and overall demographic momentum. This consistent growth exerts ongoing pressure on the housing market, particularly in urban and central regions.
As Yakhin and Gamrasni [2021] argue, the combination of rising household incomes and demographic expansion intensifies housing demand. When this growing demand meets a relatively inflexible or declining supply (due to regulatory bottlenecks, land shortages, and lengthy planning procedures) housing prices rise [18]. The upward pressure on prices is further exacerbated by the financialization of housing, where residential real estate is increasingly viewed not only as a place of residence but as a means of preserving and growing capital.
Rising home prices, in turn, serve as a signal to the construction industry and real estate developers, incentivizing further investment in housing development. This process often results in an expansion of the housing stock, particularly in peripheral areas where land is more readily available. However, critics argue that much of this expansion is not sufficiently aligned with employment centers or infrastructure, thus perpetuating spatial inequality and limiting the effectiveness of supply-side responses.
The cyclical dynamic population growth fueling demand, leading to price increases, which then stimulate construction has become a defining feature of Israel’s housing market, and continues to shape both market outcomes and policy debates in the country.
2.2.3. Construction Inputs
In addition to a reduction in construction starts, which leads to a growing mismatch between demand and available housing stock, limited labor availability and rising construction costs are key structural factors driving price increases in the Israeli housing market [18]. The sector has long depended on a stable supply of foreign labor [26], particularly Palestinian workers and, to a lesser extent, workers from Eastern Europe and Asia. However, geopolitical instability, policy restrictions, and security-related work stoppages have led to recurrent labor shortages, particularly during periods of conflict or border closures. These shortages directly impact construction timelines, increase labor costs, and further constrain the housing supply pipeline.
In parallel, prices of raw materials required for construction (such as cement, steel, aggregates, and insulation) along with their transportation costs, are subject to short-term price volatility that can be extreme. This volatility is affected by global supply chain disruptions, fluctuations in energy and shipping prices, and geopolitical events, such as the Russia–Ukraine war, which significantly affected the availability and cost of basic construction inputs in Israel and globally. These fluctuations directly influence the Residential Construction Input Price Index, which tracks the cost dynamics of building materials [12].
Since the main contractor is typically responsible for procuring raw materials, and purchase agreements are indexed to the input price index, increases in material prices are directly passed on to overall construction costs, contributing to higher final housing prices. Conversely, the practice of indexing sale prices in pre-sale purchase agreements to the same input index mitigates contractors' exposure to cost fluctuations. However, this mechanism also transfers cost risks to buyers, further exacerbating housing affordability challenges.
From a macroeconomic perspective, for a given level of housing prices, an increase in construction costs (whether due to labor constraints or material price inflation) reduces the profitability of new projects and can lead to delays or cancellations in planned construction. This contraction in housing supply, when met with sustained demand, contributes to a further rise in prices. Thus, increasing construction input costs (both in materials and labor) not only elevate housing prices but also suppress new construction activity, thereby reinforcing the structural shortage in the housing inventory [18].
2.2.4. Regulation Environment
The Israeli residential real estate sector operates within a highly regulated environment, in which a combination of financial, fiscal, and planning policies shapes both demand and supply dynamics. One of the most influential actors in this domain is the Bank of Israel, whose macroprudential directives are designed to limit systemic risk in the financial sector. For instance, recent guidelines constrain banks’ exposure to the real estate market by imposing limits on loan-to-value (LTV) and debt-to-income (DTI) ratios, as well as on the total volume of mortgages banks may issue relative to their capital reserves (Bank of Israel, 2024a). While these measures enhance financial stability, they may also restrict credit availability, particularly for first-time homebuyers and lower-income households, thereby indirectly affecting demand levels.
In parallel, governmental fiscal tools such as the Zero VAT Law (which was ultimately not implemented), the Third Apartment Tax, and the "Buyer’s Price" ("Mechir LeMishtaken") program have been introduced at various times to moderate speculative demand, reduce investment-driven transactions, and improve access to affordable housing for eligible populations (Midrug, 2024). However, the implementation and effectiveness of these tools have been uneven. For example, the "Buyer’s Price" program faced criticism for distorting market incentives, leading to inefficiencies in land allocation and delays in project completions (Cohen, 2022b).
On the supply side, rigidities are primarily institutional and regulatory. The planning and zoning approval process in Israel is centralized, complex, and time-consuming, involving multiple layers of bureaucracy at both national and local levels. This regulatory complexity significantly delays the transition from land designation to actual construction, often spanning several years. These constraints are consistent with cross-national findings that highlight how planning regulations contribute to supply inflexibility, particularly in countries with tight land-use controls and limited responsiveness to market signals [5,6].
As a result, when housing demand rises due to demographic or economic factors, the supply system struggles to adjust accordingly. The adjustment, therefore, occurs primarily through price mechanisms rather than quantitative expansion of housing stock. In such a context, price fluctuations do not necessarily reflect speculative bubbles but rather underlying structural mismatches between demand and regulated supply.
2.2.5. Planning and Project Approval Processes
Generally, the real estate sector is characterized by lengthy planning and project approval processes [12], alongside land use planning policies that cause supply to respond more slowly than demand [13,14,15,16]. Construction cycles tend to be relatively long, often exceeding ten years, both in residential and non-residential construction. These characteristics underscore the relatively weak correlation between the residential construction input price index and the housing price index. For example, between 2020 and 2024, the residential construction input price index increased by 15.8%, whereas the housing price index rose by 45.7% [17].
2.2.6. Interest Rates
Interest rates have a significant impact on the construction sector, as the Bank of Israel’s policy rate constitutes an integral component of mortgage loans in the economy [18]. Consequently, an increase in the Bank of Israel’s interest rate leads to higher mortgage rates and tighter mortgage lending conditions, thereby reducing the purchasing power of homebuyers and causing a decline in housing demand. Furthermore, real estate companies are exposed to fluctuations in the Bank of Israel’s interest rate due to its effect on the cost of credit for financing their operations [21].
Hence, higher interest rates depress prices, reduce construction, and decrease supply [27]. Nagar and Segal [2011] highlighted monetary policy’s role in the 2008 price rally [28] . Yakhin and Gamrasni [2021] indicated that the short-term real interest rate explains about one-quarter of the housing price rise during 2008–2011), with monetary policy’s direct impact about 45% weaker than the effect of the short-term real interest rate [18]. Their analysis also pointed to a persistent housing shortage since 2007, which has exerted continuous upward pressure on prices at an average rate of 1.8% annually in real terms. Nagar and Segal (2011) and Weiner and Fuerst (2017) similarly observed that higher interest rates tend to depress housing prices and emphasized monetary policy as the central explanatory factor behind the 2008 price surge [28,29] . In contrast, Yakhin and Gamrasni (2021) viewed monetary policy as secondary [18].
The low interest rate environment prevailing until 2022 is primarily attributed to Israel’s policy response to the global economic crisis of 2008, which was characterized by a worldwide decline in interest rates. This low-rate environment stimulated an increase in housing demand in Israel [30]. In 2022, housing price growth accelerated to approximately 17% - a significant increase compared to previous years and the highest rate observed in about twelve years. As a result, investments in residential construction and infrastructure increased (Bank of Israel, 2024b). To curb inflation in Israel during that year, the Bank of Israel initiated a gradual interest rate hike, a trend that continued through 2023 [31].
2.2.7. Exchange Rates
Exchange rate fluctuations influence the residential real estate sector in Israel through multiple and interrelated channels, each affecting different segments of the market.
First, fluctuations in exchange rates directly impact the wages of foreign construction workers, particularly those from countries such as China, Moldova, and Thailand, whose contracts are often denominated in or linked to foreign currencies such as the U.S. dollar or euro. A depreciation of the Israeli shekel increases the shekel-denominated cost of these wage commitments, thereby raising overall labor costs for contractors (Bank of Israel, 2023). Given the sector’s reliance on foreign labor due to ongoing shortages in domestic skilled workers, this effect is both immediate and significant [32].
Second, exchange rates affect the prices of imported raw materials used in residential construction. Key construction inputs such as steel, aluminium, insulation materials, and mechanical systems are largely imported. When the shekel depreciates, the cost of these imports rises, increasing the input costs for developers and contractors [33]. This rise in costs is typically passed on to end consumers, either directly through higher home prices or indirectly through delayed or downsized projects. In line with international findings, construction sectors in small open economies are particularly vulnerable to currency volatility due to their dependence on global supply chains.
Third, exchange rate movements shape housing demand from foreign residents and investors. When foreign currencies such as the U.S. dollar or euro appreciate against the shekel, Israeli real estate becomes more affordable for foreign buyers, increasing their purchasing power and incentivizing investment (particularly in high-end urban markets such as Tel Aviv, Herzliya, and Jerusalem). Conversely, a strong shekel can deter such investment by making local assets more expensive in foreign currency terms [34]. Fluctuations in foreign demand (often driven by macroeconomic conditions abroad), can contribute to localized price pressures and reduce housing affordability for domestic buyers.
Moreover, in times of geopolitical uncertainty or financial volatility, exchange rate instability can affect investor sentiment, encouraging capital inflows into perceived "safe assets" like real estate. In Israel’s case, this is particularly relevant for Jewish diaspora investors, who may view real estate holdings in Israel as both a financial investment and an identity-driven asset [35].
2.2.8. Credit Risk
The real estate sector is characterized by high exposure to credit risk. The primary sources of credit for construction companies are banks and bond issuances in the capital market. The sustained increase in banks’ exposure to housing loans and loans in the income-producing real estate sector, which pose systemic risks to the banking system, has prompted intensified regulatory intervention in bank lending practices in recent years. This intervention has led, among other effects, to prolonged lending approval processes and stricter conditions for financing projects in the sector [36]. For instance, in March 2022, the Bank of Israel’s Banking Supervision Department issued a directive requiring banks to allocate additional capital for land financing - both for existing and new loans [20]. The rising credit risk in the construction sector is reflected in increased provisions for credit losses related to banking credit extended to the sector [30]. This tightening is further exacerbated during economic slowdowns, which may complicate access to financing for the real estate and construction industries [37].
Additional sources of credit for the residential real estate sector include institutional investors that provide construction financing and contractual guarantees under the Israeli Sale Law, non-bank financial institutions specializing in credit and equity completion for residential real estate companies, and the corporate bond market, which serves as a source of both secured and unsecured corporate debt financing [36].
2.2.9. Inflation Level
The relationship between inflation and housing markets has long attracted scholarly attention, particularly in economies that experienced prolonged periods of price instability. In the Israeli context, during the years 1974–1996, the country faced sustained high inflation, including episodes of hyperinflation in the early 1980s. Specifically, periods of higher and more volatile inflation were associated with lower real house prices, as households and investors demanded higher returns to compensate for the greater uncertainty in real returns. Nonetheless, housing was also perceived as a partial hedge against unexpected inflation, offering a degree of protection by preserving purchasing power over time. This duality where housing both suffers from and buffers inflation effects, makes the asset class particularly sensitive to inflationary dynamics.
Supporting these findings, Yakhin and Gamrasni [2021] highlight the importance of explicitly incorporating inflation volatility into asset pricing models related to real estate. Their analysis shows that such inclusion improves explanatory power, especially in environments with significant macroeconomic uncertainty. They argue that housing markets do not merely respond to expected inflation but are especially sensitive to inflation surprises (unexpected deviations from projected price levels) which influence discount rates, investment decisions, and long-term housing affordability [18].
2.2.10. Capital Market Risk
Worzala and Sirmans [2003] highlighted that benefits of international real estate stock as an investment alternative, concluding that diversification gains are possible but are often reduced if currency risk is included in the analysis [38] . Ooi and Liow [2004] suggests that size, book-to-market value, capital structure, market diversification and interest rates have significant influence on the performance of real estate securities [39]. Additionally, Liow had identified significant features in the volatility dynamics of real estate security markets at national, regional, and global levels, including clustering, predictability, persistence, and asymmetry [40,41]. It has been shown that global real estate market volatility positively influences the time-varying betas of Asia-Pacific markets, while exerting a negative effect on the betas of European markets and the UK. This finding also suggests that time-varying beta estimates relative to the global real estate index provide better explanatory power than those based on general global equity indices. Weiner and Fuerst (2017) further explored the influence of capital market risk factors on housing prices and argued heightened risk in the capital markets leads investors to shift capital into housing, thereby increasing demand and driving up prices (Weiner & Fuerst, 2017).
2.3. Key External Events During 2020-2024
2.3.1. The Outbreak of the COVID-19 Pandemic
In December 2019, the outbreak of the COVID-19 virus began in China, prompting policymakers worldwide, including those in Israel, to implement restrictive measures such as prohibitions on gatherings, flight restrictions, and limitations on business operations. These actions aimed to contain the pandemic and reduce infection rates. Consequently, a significant slowdown occurred across various sectors of the economy, leading to a 2.0% contraction in Israel’s real Gross Domestic Product (GDP) in 2020 compared to 2019 [42].
Publicly traded real estate companies benefited from the economic growth in their primary markets, particularly in Israel, which positively influenced their capacity to expand operations, supported by favorable capital market conditions and banking sector support. The prevailing low-interest-rate environment and strong capital-raising capabilities enabled most firms in the sector to enter the crisis with relatively healthy liquidity positions compared to previous downturns [43].
Furthermore, capital markets and other financial institutions demonstrated relative tolerance toward the negative operational impacts experienced by these companies, acknowledging the exceptional nature of the crisis and adopting a long-term perspective. As a result, during the crisis period, the majority of firms continued to enjoy an accommodative financing environment, characterized by comparatively low yields and ongoing issuance of debt and refinancing of bank loans [43]. Israel’s expansionary policy response to the crisis, including the gradual removal of most restrictions and a return to near-normal economic activity in 2021–2022, contributed to substantial GDP growth rates of 9.4% and 6.3% in those years, respectively [31].
2.3.2. Wars
On February 24, 2022, Russia launched a military invasion of Ukraine. According to publications by the Research Department of the Bank of Israel [20], the war's effects have been primarily felt through significant increases in energy and commodity prices, as well as ongoing disruptions to global supply chains. These factors, combined with the Israeli economy’s return to employment levels exceeding those prior to the COVID-19 crisis, contributed to rising inflation rates in 2021 and 2022.
On October 7, 2023, Israel entered the “Iron Swords” war. The outbreak of hostilities led to a slowdown in business activity across the Israeli economy [44] and subsequently prolonged project completion timelines due to labor shortages caused by lockdowns in the West Bank and the blockade of the Gaza Strip, as well as the departure of foreign workers owing to the conflict [30]. Numerous local authorities decided to halt construction site operations, resulting in reduced productivity in the workforce of construction companies operating in the sector during the war months.
Labor shortages in the construction industry, disruptions in the supply of imported goods (including building materials), due to the war, and threats to maritime shipping routes to Israel, have contributed to price increases and a slowdown in housing sales within projects [12]. Specifically, rising construction input price indices and consumer price inflation have led to higher project construction costs, which are indexed accordingly. On the other hand, this dynamic has partially increased the revenues of real estate companies from the sale of apartments, which are also linked to the residential construction input price index.
Additionally, the rise in global antisemitism during the war period [30] has generated an influx of immigrants to Israel, thereby boosting housing demand and partially contributing to upward pressure on housing prices. This effect is particularly pronounced given the significant slowdown in state-led land marketing processes and the prospect of future interest rate reductions, which may further stimulate housing demand.
In light of the preceding literature review, the following relationship were hypothesized:
H1: The Construction Input Index (CII) annual change affects positively and significantly the Houses Pricing Index annual change. As inputs to build houses increase, the prices of houses increase as well.
H2: As the Gross Average Income Per Household increases, the Total Number of Deals (housing deals) increases too.
H3: As the Central Bank Interest increases, funding for housing is more expensive, and therefore the Total Number of Deals (housing deals) decreases.
H4: As the Total Number of Deals (housing deals) increases, the Houses Pricing Index annual change increases too.
H5: As the Houses Pricing Index annual change increases, the Firms' [EBITDA / (financial expenses)] increase too. EBIDTA=Earnings Before Interest, Depreciation, Taxes, and Amortization. This is an indicator for better firm performance. As the Houses Pricing Index annual change increases, the performance of firms increases too.
H6: As firms' Equity/Assets increases, firms' leverage decreases, and [EBITDA / (financial expenses)] increases, i.e., improved. This is a control for firms' level of risk.
H7: As [EBITDA / (financial expenses)] increases, firms' Operating Profit (%) and Gross Profit (%) increase too. That is, the increase in [EBITDA / (financial expenses)] improves other firms' performance indicators, such as Operating Profit (%) and Gross Profit (%).
3. Methodology
3.1. Research Population
To define the research population, data were collected from a public source - the "Tel Aviv Real Estate Index" of the Tel Aviv Stock Exchange, which comprises 90 publicly traded companies engaged in real estate activities as of 2025 [45]. Since this study focuses specifically on companies operating in the residential real estate sector, a sub-population was defined by selecting from among these 90 firms - those for which at least 90% of their average annual revenue during the years 2020–2024 derived from the sale of residential units, or whose board of directors' report, accompanying the financial statements, explicitly stated that their primary business activity involves the construction and sale of residential properties. Based on these criteria, the research population included 38 companies.
3.2. Model and Estimation
Table 1 reports the descriptive statistics of the variables which were employed in the Structural Estimation Model (SEM). The data includes 190 firm-year observations. The years in the data are from 2020 to 2024. There are 38 firms in the data. For one firm in the data for a single year, the operating profit and gross profit were not included because of a division in zero. This is a single observation, and the SEM was conducted with missing values to maximize the information in the data.
4. Results
Table 3 reports the results of the SEM and Table 4 reports the results of the standardized coefficients. Table 5 reports the R-Square goodness of fit. As shown in the tables, all the hypotheses are significant at the 1% level, except for the impact of [EBITDA / (financial expenses)] on the Gross Profit which is significant at the 5% level. The overall R-Square is 0.9173 (Table 5). Though, it should be noted that most of the explained variance arrives from the Macro data (such as the Central Bank Interest impact on the Total Number of Deals or the Construction Input Index impact on the Houses Pricing Index).
5. Discussion and Conclusions
This study investigated the transmission mechanism through which short-term macroeconomic dynamics impact the financial performance of publicly listed Israeli residential real estate firms during a period marked by significant global and local volatility (2020–2024).
Employing a Structural Equation Model (SEM), the findings revealed a statistically significant relationship across all hypothesized paths (H1–H7). The model demonstrated strong explanatory power (R-Square of 0.9173 overall), with the majority of the variance explained by macroeconomic inputs impacting the market-level outcomes (Total Number of Deals and Houses Pricing Index).
The empirical results confirm and extend prior literature focusing on the drivers of the Israeli housing market, particularly concerning the interaction of monetary policy, input costs, and corporate financial health. Consistent with existing research (Yakhin & Gamrasni, 2021; Nagar & Segal, 2011; Weiner & Fuerst, 2017), the study confirms that Central Bank Interest rates exert a powerful negative influence on the Total Number of Deals (Standardized coefficient: -1.6787). This finding supports the theoretical premise that rising interest rates increase the cost of mortgage credit, thereby reducing the purchasing power of homebuyers and suppressing housing demand. The effect observed is significantly strong, indicating that monetary policy remains the dominant short-term lever for cooling transaction volumes. Simultaneously, the positive effect of Gross Average Income Per Household (Standardized coefficient: 1.0722) on the Total Number of Deals confirms the role of sustained demographic trends and rising incomes in driving demand in Israel.
A core finding is the highly significant positive impact of the Construction Input Index (CII) on the Houses Pricing Index (HPI) (H1, Standardized coefficient: 0.5954). This confirms that construction costs, driven by material and labor price inflation, are directly and effectively transmitted into final housing prices. This mechanism is crucial in the Israeli context, where the supply system is characterized by rigidities, lengthy planning, and complex land-use policies. The inelastic supply means that demand and cost pressures adjust primarily through the price mechanism. Notably, this cost pass-through occurs despite the relatively weak overall correlation observed historically between the CII and HPI, as evidenced by the 2020–2024 period where the HPI rise (45.7%) significantly outpaced the CII rise (15.8%).
The significance of this study lies in bridging the macro-level indicators (interest rates, costs, prices) with the micro-level outcome of the public firm’s operational performance (H5 and H7).
The Corporate Profitability Channel (H5 and H7): The empirical evidence strongly suggests that increases in the Houses Pricing Index positively and significantly increase the firms’ key operational performance indicator, EBITDA/Financial Expenses (H5, Standardized coefficient: 0.1937). This improvement, in turn, positively affects both Operating Profit (%) and Gross Profit (%) (H7). This linkage confirms that residential real estate firms successfully capitalize on price appreciation driven by market dynamics and cost inflation.
Two primary mechanisms explain this effective translation of price inflation into corporate profits: [1] Risk Transfer via Indexation: The widespread practice in Israel of indexing pre-sale purchase agreements to the Construction Input Index means that increases in material and labor costs are often passed directly to the buyer. This contractual mechanism mitigates the exposure of contractors to cost volatility. By shifting the cost risk, the firms secure higher revenues commensurate with the HPI increase, optimizing their EBITDA relative to financial expenses. [2] Quasi-Rent Capture from Structural Supply Inflexibility: The highly fragmented but structurally constrained nature of the Israeli market allows firms that successfully navigate bureaucratic planning procedures and secure land reserves to capture economic rents generated by the persistent structural housing shortage (Yakhin & Gamrasni, 2021). The high demand, fueled by demographic growth and the view of housing as a capital preservation vehicle, sustains the upward price trend that directly benefits developers.
Financial Structure and Risk Mitigation (H6): The finding that a higher Equity/Assets ratio (lower leverage/risk) leads to improved performance (EBITDA/Financial Expenses) (H6, Standardized coefficient: 0.1195) is highly relevant. Given the sector's high exposure to credit risk and intensified macroprudential regulation (e.g., new capital allocation requirements for land financing), maintaining a strong capital structure is crucial for enhancing operational results and resilience against tightening credit conditions induced by rising interest rates.
This study makes several specific contributions to the real estate finance and corporate performance literature. First, the research establishes a rigorous, testable conceptual framework linking short-term macroeconomic inputs (interest rates, costs) through market outputs (deals, prices) to firm-specific financial outcomes. This moves beyond analyses focusing solely on housing prices or purely firm-level factors, offering a holistic view of the transmission mechanism. Second, the findings quantify the critical role of contractual indexation in mediating cost and price inflation, demonstrating how this specific institutional feature in a supply-constrained market serves as a primary driver of corporate profitability and risk management for developers. Third, by focusing on the unique period of 2020–2024, characterized by global shocks (COVID-19, Ukraine War) and local conflicts ("Iron Swords" conflict), the study illustrates how underlying structural constraints and financial mechanisms allow publicly listed real estate firms to maintain profitability, even when facing severe external operational challenges such as labor shortages and supply chain disruptions. Fourth, while Central Bank interest rate hikes are highly effective in reducing demand (H3), they fail to address the fundamental inflationary drivers rooted in supply rigidity and rising input costs (H1). Policymakers seeking to reduce prices must target the Construction Input Index - either through subsidies, easing supply chain dependencies, or reducing administrative burdens, and, crucially, accelerate the complex, multi-layered planning and zoning processes that perpetuate the structural supply deficit.
The study has managerial Implications as well: Firms must prioritize capital management, as demonstrated by the positive impact of higher Equity/Assets ratios (H6). High equity levels are necessary to maintain financial stability and secure favorable financing in an environment of high credit risk and intensified regulatory scrutiny. Furthermore, strategic land acquisition remains paramount, as access to land reserves is crucial for competitive advantage and pipeline sustainability in the structurally constrained urban centers.
Additionally, the study suggests that Israeli residential real estate securities may act as a partial hedge against domestic inflation, given the strong relationship between rising input costs and subsequent firm revenue growth (H1 and H5). Therefore, investors should monitor the macroeconomic inputs - specifically the Construction Input Index and Central Bank Interest Rate, as primary indicators of future firm performance. Companies demonstrating conservative leverage (high Equity/Assets) are likely to exhibit greater resilience and profitability (H6).
5.1. Limitations and Future Research
Although this study enhances the understanding of perceived RMM, which is a significant driver of CAATTs adoption, it is important to acknowledge certain limitations. First, the data spans the highly turbulent 2020–2024 period, influenced by extraordinary external shocks (pandemics, conflicts). While the study captures the impact of these short-term dynamics, the findings may reflect an atypical market environment, potentially overstating the intensity of certain relationships relative to long-term cycles. Second, while the model successfully explained the variance in market-level outputs, it provided limited explanatory power for the final firm-level profitability. This suggests that substantial variance in corporate profitability is driven by unobserved idiosyncratic firm-specific factors (e.g., project management efficiency, strategic timing of land acquisition, specific debt structures) not captured by the macro - and aggregate financial ratios employed. Third, the reliance on institutional mechanisms unique to Israel, such as the mandated indexing of sale contracts, limits the immediate generalizability of the profitability findings to markets with different contractual and planning rigidities (Caldera & Johansson, 2013).
Therefore, future research should augment the SEM framework by integrating detailed, firm-specific operational and managerial data, such as project inventory turnover, efficiency in securing building permits, or specific land reserve valuation, to better explain the large unobserved variance in final profitability. Furthermore, a cross-country comparative study focusing on how varying contractual pricing mechanisms (indexation vs. fixed-price contracts) mediate the transmission of input cost inflation (CII) to corporate profitability could isolate the unique impact of the Israeli model. Additionally, given the sector’s vulnerability to geopolitical events affecting labor supply and material logistics (Schein, 2024; Emmanuel et al., 2025), developing quantifiable measures of geopolitical and security risk indices and incorporating them into asset pricing models would offer richer insights into volatility dynamics.
Funding
No funding was received for this study.
References
- Cohen, E. The rise in Israel’s real estate prices: sociodemographic aspects. Isr. Aff. 2018, 24[1], 108–27. [Google Scholar] [CrossRef]
- Cohen, E. The impact of sociodemographic trends on house prices in Israel and the role of public policy in regulating them. Isr. Aff. 2022, 28[2], 249–70. [Google Scholar] [CrossRef]
- Levine, D.; Sussman, S.; Aharon-Gutman, M.; Yavo Ayalon, S. Population demographic tracking and estimation tool: a simulation-dashboard for urban redevelopment’s demographic implications in Israel. Front Built Environ. 2024, 10. [Google Scholar] [CrossRef]
- Ilek, A.; Cohen, N.; Chen Zion, Y. Assessing the Impact of Monetary and Macroprudential Policies on Israel’s Housing Market: A DSGE Model Approach [SSRN Scholarly Paper] [Internet]; Social Science Research Network: Rochester, NY, 2024; Available online: https://papers.ssrn.com/abstract=5013620.
- Caldera, A.; Johansson, Å. The price responsiveness of housing supply in OECD countries. J. Hous. Econ. 2013, 22[3], 231–49. [Google Scholar] [CrossRef]
- Cavalleri, C.; Cournede; Ozsögüt. How responsive are housing markets in the OECD? National level estimates [OECD Economics Department Working Papers] [Internet]. Vol. 1589. 2019 Dec [cited 2025 Nov 26]. (OECD Economics Department Working Papers). OECD Econ. Dep. Work. Pap. no.: 1589. Available online: https://www.oecd.org/en/publications/how-responsive-are-housing-markets-in-the-oecd-national-level-estimates_4777e29a-en.html.
- Cohen, E. The Nature of Israel’s Public Policy Aimed at Curbing the Rise in Property Prices from 2008-2015, as a Derivative of the Country’s Governance Structure. Econ. Sociol. 2016, 9[2], 73. [Google Scholar] [CrossRef]
- Cohen, E. Regulating Demand or Supply: Examining Israel’s Public Policy for Reducing Housing Prices During 2015–2019. Hous. Policy Debate 2022, 32[3], 533–48. [Google Scholar] [CrossRef]
- Di Liddo, F.; Anelli, D.; Morano, P.; Tajani, F. The Impacts of COVID-19 on Real Estate Market Dynamics: A Systematic Literature Review of Emerging Trends. Buildings 2023, 13[9], 2334. [Google Scholar] [CrossRef]
- Emmanuel, O.; Białko, M.; Nikolaiev, V. The Construction Industry in a War-Ravaged Region: Examination of Challenging Factors [Internet]. 2025 [cited 2025 Nov 26. Available online: https://www.mdpi.com/2076-3417/15/6/2900.
- Schein, A. The effects of the Gaza War on Israel’s economy: one year on. Isr. Aff. 2024, 30[5], 925–38. [Google Scholar] [CrossRef]
- 12. Midrug. Professional Information. Annual Outlook for 2025י [Internet]. 2024. Available online: https://www.midroog.co.il/he/articles.
- Giang, D.T.H.; Sui Pheng, L. Role of construction in economic development: Review of key concepts in the past 40 years. Habitat Int. 2011, 35[1], 118–25. [Google Scholar] [CrossRef]
- Leamer, E.E. Housing IS the Business Cycle [Working Paper] [Internet]; National Bureau of Economic Research, 2007 [cited 2025 Nov 26; Available online: https://www.nber.org/papers/w13428.
- Leung, C. Macroeconomics and housing: a review of the literature. In Journal of Housing Economics; Housing and the Macroeconomy: The Nexus, 1 Dec 2004; Volume 13[4], pp. 249–67. [Google Scholar] [CrossRef]
- Sun, M.Y.; Mitra, M.P.; Simone, M.A. The Driving Force behind the Boom and Bust in Construction in Europe; International Monetary Fund, 2013; p. 37 p. [Google Scholar]
- Central Bureau of Statistics. Topics-Economy, Environment and Infrastructure [Internet]. 2024 [cited 2025 Nov 26. Available online: https://www.cbs.gov.il/he/cbsnewbrand/Pages/default.aspx.
- Yakhin, Y.; Gamrasni, I. Bank of Israel research [Internet] Long-Run Equilibrium and Short-Run Dynamics. 2021 [cited 2025 Nov 26. Available online: https://www.boi.org.il/roles/research-and-publications/all-researches.
- Dovman, P.; Ribon, S.; Yakhin, Y. The Housing Market in Israel 2008-2010: Are House Prices a “Bubble”? [SSRN Scholarly Paper] [Internet]; Social Science Research Network: Rochester, NY, 2012 [cited 2025 Nov 26; Available online: https://papers.ssrn.com/abstract=2195647.
- 20. Bank of Israel. All Research. Financial Stability Report – First Half of 2023 [Internet]. 2023. Available online: https://www.boi.org.il/publications/regularpublications/financial-stability.
- 21. Maalot S&P Global Ratings. maalot.co.il/BusinessPage?publicationCategoryIDs=43&page=3 [Internet]. 2024. Available online: https://www.maalot.co.il/BusinessPage?publicationCategoryIDs=43&page=3.
- 22. Midrug. Professional Information. Rating of Residential Real Estate Firms. 2020. Available online: https://www.midroog.co.il/he/articles.
- Alfasi, N.; Fenster, T. A tale of two cities: Jerusalem and Tel Aviv in an age of globalization. Cities 2005, 22[5], 351–63. [Google Scholar] [CrossRef]
- Quigley, J.M.; Rosenthal, L.A. The Effects of Land Use Regulation on the Price of Housing: What Do We Know? What Can We Learn? Cityscape 2005, 8[1], 69–137. [Google Scholar]
- Cohen, E. Public Policy for Regulating the Congestion in Delivery Rooms in Israel: Alternatives, Consequences, and Recommendations. Societies 2025, 15[2], 47. [Google Scholar] [CrossRef]
- Cohen, E. Public policy for increasing employment in the construction industry and its contribution to the regulation of housing prices – the case of Israel. Isr. Aff. 2021, 27[6], 1110–29. [Google Scholar] [CrossRef]
- 27. Midrug. Professional Information. The Increase in Interest Rates Elevates Credit Risk in the Residential Real Estate Development Sector in Israel. י [Internet]. 2023. Available online: https://www.midroog.co.il/he/articles.
- Nagar, W.; Segal, G. What Explains the Developments in Home Prices and Rents in Israel between 1999 and 2010? Social Science Research Network: Rochester, NY, 2014 [cited 2025 Nov 27; Available online: https://papers.ssrn.com/abstract=2545042.
- Weiner, D.; Fuerst, F. The Dynamics of House Prices in Israel and the Effect of the Investor’s Fear Gauge. J. Hous. Res. 2017, 26[1], 95–117. [Google Scholar] [CrossRef]
- 30. The Knesset. Information and Research Center. The Impact of the Iron Swords War on the Construction Sector. 2023. Available online: https://main.knesset.gov.il:443/activity/info/research/pages/incident.aspx?ver=2&docid=e7b3370b-b177-ee11-815f-005056aac6c3.
- 31. Bank of Israel. All Research. Financial Stability Report – First Half of 2024 [Internet]. 2024. Available online: https://www.boi.org.il/publications/regularpublications/financial-stability.
- He, W. Effects of the exchange rate on sectoral profits, value added, wages and employment [Internet]. 2011. [Google Scholar] [CrossRef]
- Kasim, O.; Ajayi, S.; Omirin, O.; Alabi, A. The impact of foreign exchange rate on building materials and residential building construction cost in Nigeria (1999-2021). Acta Structilia 2023, 30[2], 61–93. [Google Scholar] [CrossRef]
- Umoru, D.; Tedunnjaiye, O.D. REAL WAGES, EXCHANGE RATE VARIATION AND DEMAND FOR RESIDENTIAL HOUSING. J. Acad. Res. Econ. (JARE) 2023, 15[1], 53–64. [Google Scholar]
- Qi, X.Z.; Ning, Z.; Qin, M. Economic policy uncertainty, investor sentiment and financial stability—an empirical study based on the time varying parameter-vector autoregression model. J. Econ. Interact. Coord. 2022, 17[3], 779–99. [Google Scholar] [CrossRef]
- 36. Midrug. Professional Information. The Increase in Interest Rates Elevates Credit Risk in the Residential Real Estate Development Sector in Israel [Internet]. 2023. Available online: https://www.midroog.co.il/he/articles.
- 37. Bank of Israel. All Research. Financial Stability Report – Second Half of 2024 [Internet]. 2024. Available online: https://www.boi.org.il/publications/regularpublications/financial-stability.
- Worzala, E.; Sirmans, C.F. Investing in International Real Estate Stocks: A Review of the Literature. Urban Stud. 2003, 40(5–6), 1115–49. [Google Scholar] [CrossRef]
- Ooi, J.; Liow, K.H. Risk-Adjusted Performance of Real Estate Stocks: Evidence from Developing Markets: Journal of Real Estate Research. No 4 [Internet] 2004 [cited 2025 Nov 30, Vol 26. Available online: https://www.tandfonline.com/doi/abs/10.1080/10835547.2004.12091145.
- Liow, K.H. Full article: The Dynamics of Return Volatilty and Systematic Risk in International Real Estate Security Markets [Internet]. 2007 [cited 2025 Nov 30. Available online: https://www.tandfonline.com/doi/full/10.1080/09599910701297663.
- Liow, K.H. Firm value, growth, profitability and capital structure of listed real estate companies: an international perspective [Internet]. 2010 [cited 2025 Nov 30. Available online: https://www.tandfonline.com/doi/full/10.1080/09599916.2010.500459.
- 42. Midrug. Professional Information. Rating of Residential Real Estate Firms [Internet]. 2020. Available online: https://www.midroog.co.il/he/articles.
- 43. Bank of Israel. All Research. Financial Stability Report – First Half of 2022. 2022. Available online: https://www.boi.org.il/publications/regularpublications/financial-stability.
- Migdad, M.; Migdad, A.; Migdad, I.; Hassoun, A. Economic Devastation: The Impact of the Israeli War on Gaza’s Work and Economic Growth | SpringerLink [Internet]. 2025 [cited 2025 Nov 30. Available online: https://link.springer.com/chapter/10.1007/978-3-031-88500-6_14.
- 45. Tel Aviv Stock Exchange. Market Data [Internet]. 2025. Available online: https://market.tase.co.il/en/market_data.
- Capon, N.; Farley, J.U.; Hoenig, S. Determinants of Financial Performance: A Meta-Analysis | Management Science [Internet]. 1990 [cited 2025 Nov 30. Available online: https://pubsonline.informs.org/doi/abs/10.1287/mnsc.36.10.1143.
- Delen, D.; Kuzey, C.; Uyar, A. Measuring firm performance using financial ratios: A decision tree approach. Expert Syst. With Appl. 2013, 40[10], 3970–83. [Google Scholar] [CrossRef]
- Gleason, K.C.; Mathur, L.K.; Mathur, I. The Interrelationship between Culture, Capital Structure, and Performance: Evidence from European Retailers - ScienceDirect [Internet]. 2000 [cited 2025 Nov 30. Available online: https://www.sciencedirect.com/science/article/pii/S0148296399000314.
- Migliaccio, G.; De Palma, A. Profitability and financial performance of Italian real estate companies: quantitative profiles | International Journal of Productivity and Performance Management | Emerald Publishing [Internet]. 2024 [cited 2025 Nov 30. Available online: https://www.emerald.com/ijppm/article/73/11/122/1226449/Profitability-and-financial-performance-of-Italian.
- Ramezani, C.A.; Soenen, L.; Jung, A. Growth, Corporate Profitability, and Value Creation. Financ. Anal. J. 2002, 58[6], 56–67. [Google Scholar] [CrossRef]
- Seretidou, D.; Billios, D.; Stavropoulos, A. Integrative Analysis of Traditional and Cash Flow Financial Ratios: Insights from a Systematic Comparative Review. Risks 2025, 13[4], 62. [Google Scholar] [CrossRef]
- Varaiya, N.; Kerin, R.A.; Weeks, D. The relationship between growth, profitability, and firm value - Varaiya - 1987 - Strategic Management Journal - Wiley Online Library [Internet]. 1987 [cited 2025 Nov 30. Available online: https://sms.onlinelibrary.wiley.com/doi/abs/10.1002/smj.4250080507.
- Yat Hung, C.; Ping Chuen Albert, C.; Chi Man Eddie, H. Capital structure and profitability of the property and construction sectors in Hong Kong. J. Prop. Invest. Financ. 2002, 20[6], 434–53. [Google Scholar] [CrossRef]
- Bank of Israel. Information and Statistics [Internet]. 2025. Available online: https://embed.vp4.me/LandingPage,624c1870-703e-49db-b25b-a7b5338bc281,537969.aspx?r=1014.
Figure 1.
The diagram of the SEM model.
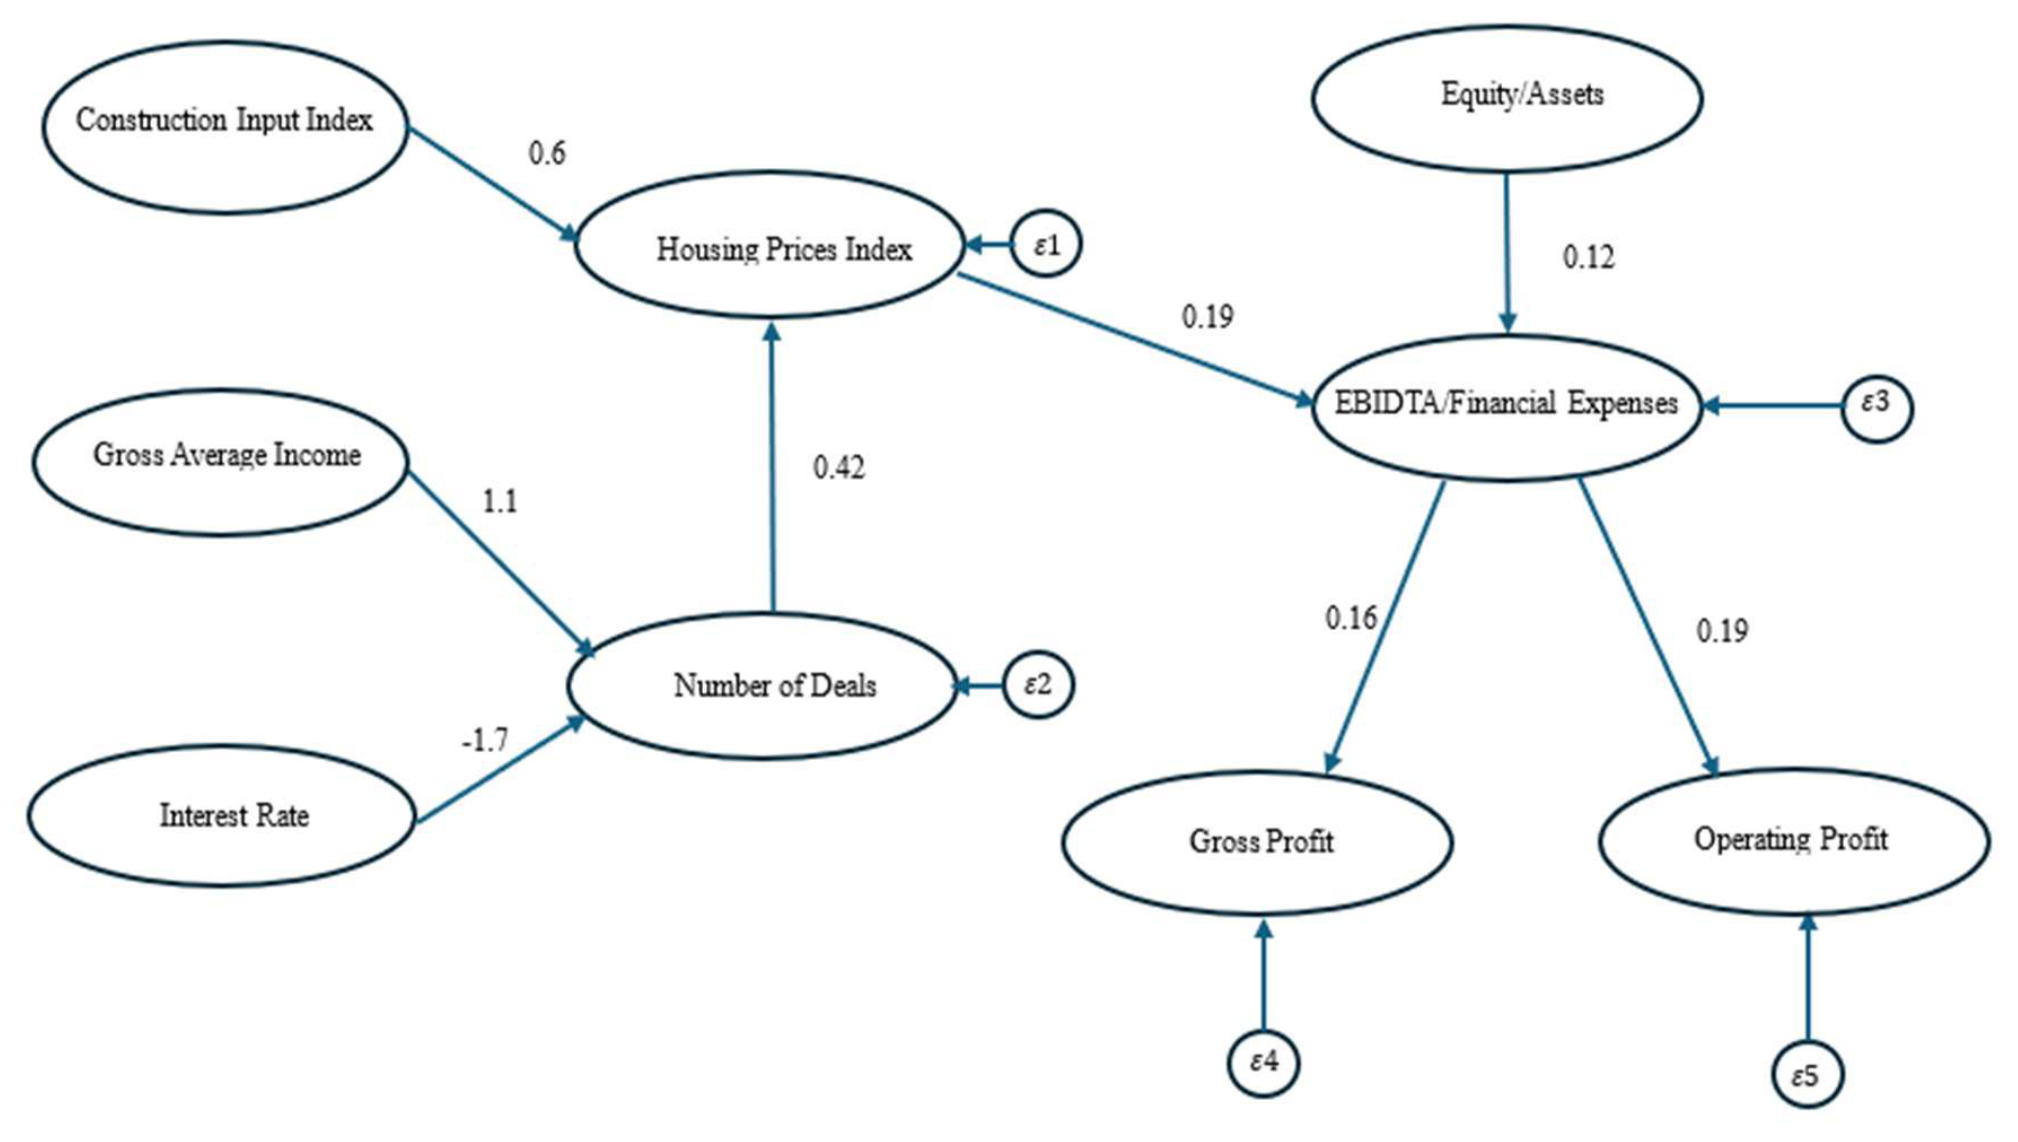

Table 1.
Descriptive Statistics of the Variables.
| Table 1 reports the descriptive statistics of the variables in the SEM model. The data includes 190 firm-year observations. The years in the data are from 2020 to 2024. There are 38 firms in the data. For one firm in the data for a single year, the operating profit and gross profit were not included because of a division in zero. This is a single observation, and the SEM was conducted with missing values to maximize the information in the data. | |||||
| Variables | N | Mean | Std. dev. | Min | Max |
| Operating Profit (%) * | 189 | 0.1959 | 0.3675 | -1.9771 | 2.0293 |
| Gross Profit (%) * | 189 | 0.2119 | 0.1851 | -1.5752 | 0.7746 |
| Equity/Assets * | 190 | 0.2803 | 0.2074 | -1.9446 | 0.7396 |
| EBITDA/Financial Expenses * | 190 | 4.5401 | 7.1967 | -26.9464 | 51.4869 |
| Total Number of Deals ** | 190 | 108506.2 | 25378.95 | 71739 | 151000 |
| Houses Pricing Index ** | 190 | 7.7000 | 5.8039 | -1.0000 | 14.7000 |
| Construction Input Index ** | 190 | 3.1600 | 1.8559 | 0.5000 | 5.6000 |
| Central Bank Interest *** | 190 | 2.5400 | 2.0615 | 0.1000 | 4.7500 |
| Gross Average Income Per Household ** | 190 | 20881.2 | 1109.8850 | 19287 | 22013 |
Notes: * These financial ratios were measured using data extracted from the companies’ annual financial statements for the years 2020–2024. The selection of the ratios is based on established practices and findings in academic literature addressing financial performances and real estate firms [40,46,47,48,49,50,51,52,53]. ** Data source: Central Bureau of Statistics, reference: [17]. *** Data source: Bank of Israel interest rates, reference: [54].
Table 2.
Correlations Matrix.
| Table 2 reports the correlations between the variables in the SEM model. The data includes 190 firm-year observations. The years in the data are from 2020 to 2024. There are 38 firms in the data. For one firm in the data for a single year, the operating profit and gross profit were not included because of a division in zero. This is a single observation, and the SEM was conducted with missing values to maximize the information in the data. | |||||||||
| Variables | Operating Profits | Gross Profit | Equity/ Assets |
EBITDA/ Financial Expenses |
Total Number of Deals | Gross Average Income Per Household | Houses Pricing Index | Construction Input Index | Central Bank Interest |
| Operating Profits | 1 | ||||||||
| Gross Profit | 0.6707 | 1 | |||||||
| Equity/Assets | 0.3591 | 0.3708 | 1 | ||||||
| EBITDA/Financial Expenses | 0.1958 | 0.1655 | 0.2238 | 1 | |||||
| Total Number of Deals | 0.1077 | 0.0697 | 0.0263 | 0.2138 | 1 | ||||
| Gross Average Income Per Household | -0.0214 | -0.0216 | 0.0204 | -0.0458 | -0.4004 | 1 | |||
| Houses Pricing Index | 0.1009 | 0.0828 | 0.0277 | 0.21 | 0.78 | 0.18 | 1.00 | ||
| Construction Input Index | 0.0523 | 0.0307 | 0.0278 | 0.19 | 0.66 | 0.29 | 0.83 | 1 | |
| Central Bank Interest | -0.0724 | -0.066 | 0.0072 | -0.14 | -0.74 | 0.88 | -0.31 | -0.0819 | 1.00 |
Table 3.
Results of the SEM.
| Table 3 reports the results of the SEM. The data includes 190 firm-year observations. The years in the data are from 2020 to 2024. There are 38 firms in the data. For one firm in the data for a single year, the operating profit and gross profit were not included because of a division in zero. This is a single observation, and the SEM was conducted with missing values to maximize the information in the data. The target variables are in Italic. There are 1,000 iterations. Results are significant at least at the 5% level. | ||||
| Est. | OIM std. err. | z | P>z | |
| Structural | ||||
| Total Number of Deals | ||||
| Central Bank Interest | -20723.12 | 793.1753 | -26.13 | 0.00 |
| Gross Average Income Per Household | 24.6276 | 1.4732 | 16.72 | 0.00 |
| _cons | -353111.4 | 29024.83 | -12.17 | 0.00 |
| Houses Pricing Index | ||||
| Total Number of Deals | 0.0001 | 0.00 | 8.90 | 0.00 |
| Construction Input Index | 1.7733 | 0.1409 | 12.58 | 0.00 |
| _cons | -7.8514 | 0.91 | -8.63 | 0.00 |
| EBITDA/Financial Expenses | ||||
| Houses Pricing Index | 0.2493 | 0.0864 | 2.89 | 0.004 |
| Equity/Assets | 6.5430 | 2.4181 | 2.71 | 0.007 |
| _cons | 0.7867 | 1.0503 | 0.75 | 0.454 |
| Gross Profit (%) | ||||
| EBITDA/Financial Expenses | 0.0043 | 0.0018 | 2.31 | 0.021 |
| _cons | 0.1924 | 0.0157 | 12.25 | 0.00 |
| Operating Profit (%) | ||||
| EBITDA/Financial Expenses | 0.0100 | 0.0036 | 2.75 | 0.006 |
| _cons | 0.1500 | 0.0310 | 4.84 | 0.00 |
Table 4.
Results of the SEM - Standardized.
| Table 4 reports the standardized results of the SEM. The data includes 190 firm-year observations. The years in the data are from 2020 to 2024. There are 38 firms in the data. For one firm in the data for a single year, the operating profit and gross profit were not included because of a division in zero. This is a single observation, and the SEM was conducted with missing values to maximize the information in the data. The target variables are in Italic. There are 1,000 iterations. Results are significant at least at the 5% level. | ||||
| Standardized | Est. | OIM std. err. | z | P>z |
| Structural | ||||
| Total Number of Deals | ||||
| Central Bank Interest | -1.6787 | 0.0339 | -49.5300 | 0.0000 |
| Gross Average Income Per Household | 1.0722 | 0.0538 | 19.9400 | 0.0000 |
| _cons | -13.9276 | 0.9942 | -14.0100 | 0.0000 |
| Houses Pricing Index | ||||
| Total Number of Deals | 0.4229 | 0.0468 | 9.0400 | 0.0000 |
| Construction Input Index | 0.5954 | 0.0419 | 14.2000 | 0.0000 |
| _cons | -1.4283 | 0.1459 | -9.7900 | 0.0000 |
| EBITDA/Financial Expenses | ||||
| Houses Pricing Index | 0.1937 | 0.0656 | 2.9500 | 0.0030 |
| Equity/Assets | 0.1195 | 0.0440 | 2.7200 | 0.0070 |
| _cons | 0.1112 | 0.1498 | 0.7400 | 0.4580 |
| Gross Profit (%) | ||||
| EBITDA/Financial Expenses | 0.1632 | 0.0698 | 2.3400 | 0.0190 |
| _cons | 1.0426 | 0.1059 | 9.8400 | 0.0000 |
| Operating Profit (%) | ||||
| EBITDA/Financial Expenses | 0.1931 | 0.0690 | 2.8000 | 0.0050 |
| _cons | 0.4096 | 0.0901 | 4.5500 | 0.0000 |
Table 5.
Goodness of Fit.
| Table 5 reports the Goodness-of-Fit and Adjusted R-Square for SEM. The data includes 190 firm-year observations. The years in the data are from 2020 to 2024. There are 38 firms in the data. For one firm in the data for a single year, the operating profit and gross profit were not included because of a division in zero. This is a single observation, and the SEM was conducted with missing values to maximize the information in the data. The target variables are in Italic. mc = Correlation between dependent variable and its prediction. mc2 = mc^2 is the Bentler–Raykov squared multiple correlation coefficient. | ||||||
| Dependent | Variance | |||||
| variables | Fitted | Predicted | Residual | R-squared | mc | mc2 |
| Observed | ||||||
| Total Number of Deals | 643,000,000 | 525,000,000 | 117,000,000 | 0.81731 | 0.9041 | 0.8173 |
| Houses Pricing Index | 30.2163 | 22.9472 | 7.2690 | 0.7594 | 0.8715 | 0.7594 |
| EBITDA/Financial Expenses | 50.0354 | 2.6400 | 47.3954 | 0.0528 | 0.2297 | 0.0528 |
| Gross Profit (%) | 0.0341 | 0.0009 | 0.0331 | 0.0266 | 0.1632 | 0.0266 |
| Operating Profit (%) | 0.1342 | 0.0050 | 0.1292 | 0.0373 | 0.1931 | 0.0373 |
| Overall | 0.9173 | |||||
Disclaimer/Publisher’s Note: The statements, opinions and data contained in all publications are solely those of the individual author(s) and contributor(s) and not of MDPI and/or the editor(s). MDPI and/or the editor(s) disclaim responsibility for any injury to people or property resulting from any ideas, methods, instructions or products referred to in the content. |
© 2026 by the authors. Licensee MDPI, Basel, Switzerland. This article is an open access article distributed under the terms and conditions of the Creative Commons Attribution (CC BY) license (http://creativecommons.org/licenses/by/4.0/).
Copyright: This open access article is published under a Creative Commons CC BY 4.0 license, which permit the free download, distribution, and reuse, provided that the author and preprint are cited in any reuse.