
Submitted:
08 September 2026
Posted:
09 September 2026
You are already at the latest version
Abstract
Upland cotton (Gossypium hirsutum L.) dominates Xinjiang's cotton production, but the narrow genetic base of modern cultivars limits further yield gains. Here, 356 Xinjiang upland cotton accessions (184 northern, 172 southern) were genotyped at 280 elite trait locus–trait combinations (270 unique markers) using a liquid-phase chip. Pairwise kinship was inferred with the KING-robust estimator and cross-validated by IBS similarity, population structure was examined by PCA, and a marker-weighted comprehensive elite genotype index (S) was constructed. The overall missing rate was 0.43%, and five identical and 101 near-identical accession pairs were detected. PC1 and PC2 explained only 9.81% and 7.29% of the variation, with substantial regional overlap. Index S ranged from 0.39 to 0.57, led by Tkuo, Y80, Ba 44435, Ziyu R040068 and Youzhi 5; salt tolerance (0.07), lint yield (0.14), seed index (0.19) and fiber strength (0.22) were the main deficiencies. After excluding close relatives, 62,252 crosses (98.52%) satisfied the constraint, and 30 crosses (19 inter-regional) were recommended, the best being Ziyu TY112 × Tkuo (joint coverage U = 0.65). These parents and crosses provide candidates for parental selection, pending field validation.
Keywords:
upland cotton
; liquid-phase chip
; elite allele
; kinship
; parental selection
1. Introduction
More than 90% of China's cotton is now produced in Xinjiang, and the yield and fiber quality of upland cotton (Gossypium hirsutum L.) cultivars grown there rank among the highest worldwide. Further yield gains, however, are constrained by a narrow genetic base: genomic analyses indicate that the genetic composition of Chinese upland cotton cultivars is highly concentrated, with roughly 85% of the elite allelic variation derived from a small number of early-introduced germplasm accessions, leaving limited raw variation available for breeding[1,2,3]; cultivars bred in Xinjiang are further derived from a handful of backbone parents, and DNA fingerprinting studies have revealed high genetic similarity among cultivars together with cases of synonymy[4,5]. Given that the germplasm inventory can hardly be expanded in the short term, whether breeders can accurately identify usable elite allelic variation within existing materials and avoid the redundancy caused by crossing close relatives bears directly on breeding efficiency[6].
The tools for germplasm evaluation have advanced with genotyping technology. Early SSR-based diversity analyses provided a first sketch of the genetic composition of Chinese upland cotton germplasm[7], and solid-phase SNP arrays such as CottonSNP63K and CottonSNP80K subsequently supported large-scale germplasm studies at higher throughput[8,9]. Liquid-phase chips, which are based on genotyping by target sequencing (GBTS), have emerged in recent years: their loci can be customized on demand, genotyping costs are low, and no specific platform is required. In cotton, a 40K liquid-phase chip[10] and a 10K breeding chip integrating thousands of functional loci[11] have been released. Unlike randomly distributed background markers, functional-locus chips are designed around validated marker-trait associations and read out the genotypic value of target traits directly in breeding materials, so that evaluation shifts from descriptions of population structure to judgements of breeding value[11].
Germplasm evaluation ultimately feeds into decisions on parental crossing. Classical core collection theory aims to retain maximal genetic diversity with a minimal sample size[12,13], and its criterion is genetic representativeness; breeding practice cares more about the carriage and complementarity of elite alleles, and the two criteria rank the same set of materials differently[14,15,16]. Crossing is also subject to several constraints. Parents should be sufficiently unrelated to avoid inbreeding depression, yet maximizing marker-based genetic distance cannot substitute for trait complementarity, because the association between marker genetic distance and heterosis is moderate and varies with trait and marker type[17,18]. Genomic selection shows promise for early-generation prediction[19,20,21], but it offers limited direct support for the upstream decision of which parents to select and which crosses to make. Integrating functional-locus genotypes, kinship constraints and quantified allelic complementarity into a single crossing framework would make parental selection more operational.
In this study, 356 upland cotton accessions from Xinjiang (184 from northern Xinjiang and 172 from southern Xinjiang) were genotyped with a liquid-phase chip at 280 elite trait locus-trait combinations (270 unique markers). After data quality control, pairwise kinship was inferred with the KING-robust algorithm[22] and cross-validated by IBS genetic similarity, and population structure was examined by principal component analysis. A comprehensive elite genotype index weighted by marker number was constructed, and crossing schemes were formulated on the basis of joint elite allele coverage after excluding close relatives and highly concordant genotypes, with the aim of providing directly usable candidate parents and cross lists for parental selection and germplasm innovation in upland cotton.
2. Materials and Methods
2.1. Plant Materials and Genotype Data
A panel of 356 upland cotton accessions from Xinjiang, comprising 184 from northern Xinjiang and 172 from southern Xinjiang, was analyzed, including lines bred by individual breeding institutions and introduced cultivars (lines). Each accession was genotyped with the Zheda Mianxin 41K single nucleotide polymorphism (SNP) liquid-phase chip based on genotyping by target sequencing (GBTS)[10]. Published marker-trait association information was used to annotate the elite trait loci into four states: elite homozygous (Elite), heterozygous (Het), unfavorable homozygous (Bad) and missing (Missing), yielding 280 locus-trait combinations (270 unique markers, 10 of which were associated with multiple traits). The 36 original trait codes included synonyms of the same trait [e.g. GOT(LP) and LP both denote lint percent; Sympodia/Sympodial and FBN both denote fruiting branch number; the wilt series and VW both denote Verticillium wilt resistance] and six composite index traits formed as ratios of two traits (BW/FL boll weight-length index, FS/FL strength-length index, SI/FL seed index-length index, LP/SI lint percent-seed index, SI/LP seed index-lint percent index and LI/LP lint index-lint percent index), which were merged into 28 traits. These traits cover plant height (PH), fruiting branch number (FBN), boll number (BN), boll weight (BW), lint percent (LP), seed index (SI), lint yield (SCY) and fiber quality [fiber length (FL), fiber strength (FS), fiber uniformity (FU), fiber elongation (FE) and micronaire (FM)], as well as the stress-resistance traits Verticillium wilt resistance (VW), salt tolerance (SALT) and heat tolerance (HEAT). Cultivar and line names are romanized from Chinese throughout this article.
2.2. Genotype Coding and Quality Control
The Elite, Het and Bad states were coded as elite allele dosages of 2, 1 and 0, respectively, and Missing was treated as missing data. Per accession, the numbers of missing and heterozygous markers were counted; per marker, the missing rate, elite allele frequency and minor allele frequency (MAF) were calculated. The elite allele frequency was estimated as p = the sum of dosages divided by twice the number of non-missing samples. Data analysis was performed in Python 3.13.
2.3. Kinship Inference
Pairwise kinship was inferred with the KING-robust algorithm[22]. Based on the expected difference in shared locus states, the algorithm estimates pairwise kinship coefficients φ without prior population allele frequencies, producing a within-family (φW) and a between-family (φB) estimator; the kinship coefficient was taken as the larger of the two. Classification thresholds followed Manichaikul et al.[22]: φ > 0.354 for duplicate/twin pairs, 0.177 < φ ≤ 0.354 for first-degree, 0.0884 < φ ≤ 0.177 for second-degree and 0.0442 < φ ≤ 0.0884 for third-degree relatives. Because most accessions are highly inbred lines (overall heterozygosity of only 6.96%) and the denominator of the KING estimator depends on the number of heterozygous loci, its absolute values may be poorly calibrated in this panel. Genome-wide IBS genetic similarity and pairwise Hamming distances (the number of loci with discordant genotypes) were therefore computed as cross-validation. Close-relative exclusion applied a dual criterion: KING kinship coefficient φ ≥ 0.0884 (second-degree or closer) or Hamming distance ≤ 2.
2.4. Population Structure Analysis
After removing monomorphic markers, 266 polymorphic markers were retained. Missing genotypes were imputed with expected dosages and standardized by elite allele frequency before principal component analysis (PCA). The first two principal components were extracted, and the score distributions of accessions from the two regions were compared.
2.5. Comprehensive Elite Genotype Index
For each accession, the elite allele carrier rate in trait k, Ek (the mean dosage across the loci of that trait, with missing loci excluded from the denominator), was weighted by wk, the proportion of markers for trait k among all valid markers (renormalized over the traits valid for each accession), to construct the comprehensive elite genotype index S = ΣwkEk. S ranges from 0 to 1 and reflects the weighted mean level of elite allele carriage across all elite traits.
2.6. Parental Crossing Strategy
For all pairwise combinations of the 356 accessions (63,190 in total), pairs with second-degree or closer kinship (KING φ ≥ 0.0884) or highly concordant genotypes (Hamming distance ≤ 2) were excluded first. For the remaining crosses, the joint elite allele coverage U = Σwk·max(E1k, E2k) (with weights renormalized over traits having data for at least one parent) and the complementarity gain Comp = U - (S1 + S2)/2 were calculated. Crosses were ranked by U in descending order, and parents were deduplicated in the recommended scheme (each parent participates in at most one cross, preventing a few top-ranked accessions from occupying all recommendations), yielding 30 recommended crossing schemes.
3. Results
3.1. Genotype Data Quality
The overall missing rate across the 356 accessions at 280 locus-trait combinations was 0.43%, with at most five missing markers in any single accession, indicating good data quality (Figure 1a); each accession carried 19.42 heterozygous markers on average (Figure 1b). The elite allele frequency per marker showed a bimodal distribution (Figure 1c). After removing 14 monomorphic markers (MAF = 0), 71 polymorphic markers still had MAF below 0.05, suggesting that directional selection has acted on these elite trait markers and that low-frequency elite alleles account for a certain proportion. Among the 28 traits, lint percent (LP) had the most markers (34), followed by fiber elongation (FE, 30), seed index (SI, 28), fiber strength (FS, 27) and fiber length (FL, 24) (Figure 2a).
3.2. Kinship
The median IBS genetic similarity across all accession pairs was 0.78 (P5-P95: 0.68-0.88). Five pairs of accessions with identical genotypes were detected (Table 1). Among them, the northern Xinjiang accession Jingkang 1 was identical to both Hexin Ta 2 and Tahe 2 Xiaoling (the latter two differing from each other at one marker), suggesting the presence of synonymous or possibly duplicated accessions. The only inter-regional pair among the five comprised the northern Xinjiang line CF Ta 2 Tigao and the southern Xinjiang cultivar Xinluzhong 84; the two were identical at all shared markers yet come from different cotton regions, and their names share no correspondence. Because part of the panel was introduced from other breeding institutions, this pair more likely reflects synonymy arising during germplasm exchange than a chance identity between independently bred cultivars; its exact correspondence remains to be verified against pedigree records and should be screened in parent selection. In addition, 101 pairs of highly concordant accessions with Hamming distances of 1-2 were detected, giving 106 pairs in total with Hamming distance ≤ 2. Combining the KING estimator (φ ≥ 0.0884, second-degree or closer) with genotype concordance, 938 close or highly concordant pairs were identified, comprising 5 identical pairs, 101 highly concordant pairs, 164 KING duplicate-level pairs, 250 first-degree pairs and 418 second-degree pairs. The KING kinship matrix and the IBS similarity matrix showed consistent overall patterns with clear block-diagonal structure (Figure 3).
3.3. Population Structure
PC1 and PC2 explained 9.81% and 7.29% of the total genetic variation, respectively. Accessions from northern and southern Xinjiang overlapped substantially in the PC1-PC2 plane. The difference in mean PC1 scores between regions was statistically significant (Welch's t-test, P = 0.004) but small in magnitude (Cohen's d = 0.31), with regional origin explaining only 2.31% of the PC1 variance (Figure 4b), indicating weak differentiation and closely related genetic backgrounds between the two regional pools.
3.4. Genetic Evaluation of Elite Alleles
The comprehensive elite genotype index S ranged from 0.39 to 0.57 with a median of 0.45 (Figure 5a). The top five accessions were Tkuo (0.571, southern Xinjiang), Y80 (0.537, northern Xinjiang), Ba 44435 (0.534, southern Xinjiang), Ziyu R040068 (0.528, northern Xinjiang) and Youzhi 5 (0.525, southern Xinjiang) (Figure 5b, Table 2), which can serve as core parents for pyramiding elite alleles. Across traits, fiber uniformity (FU, 0.85), first fruiting branch position (FFBP, 0.85) and lint percent (0.75) showed the highest mean carrier rates among single traits, whereas salt tolerance (0.07), lint yield (SCY, 0.14), seed index (0.19) and fiber strength (0.22) showed the lowest (Figure 2b); these four traits constitute the main genetic deficiencies of this panel and the priority targets for introgression.
3.5. Parental Crossing Strategy
After excluding pairs with second-degree or closer kinship or highly concordant genotypes, 62,252 crosses (98.52% of all 63,190 combinations) satisfied the kinship constraint. Ranking by joint coverage U with parent deduplication yielded 30 recommended crossing schemes (Figure 6b; the top 10 crosses are listed in Table 3), of which 19 were inter-regional northern × southern Xinjiang crosses (63.33%). The cross with the highest joint coverage was Ziyu TY112 (northern Xinjiang) × Tkuo (southern Xinjiang) (U = 0.65, complementarity gain 0.12), followed by Ziyu R040068 (northern Xinjiang) × Zhongmian 96A (southern Xinjiang) (U = 0.63, complementarity gain 0.13). The IBS genetic distances between parents of the recommended crosses ranged from 0.25 to 0.41 with a median of 0.30, corresponding to the 92nd percentile of all candidate crosses (Figure 6a), balancing the control of inbreeding depression risk against elite allele complementarity.
4. Discussion
The pattern of elite allele carriage in this panel was highly uneven across traits: traits long subjected to intense selection, such as lint percent, first fruiting branch position and fiber uniformity, had carrier rates above 0.75, whereas salt tolerance (0.07), lint yield (0.14), seed index (0.19) and fiber strength (0.22) were markedly low. This pattern is consistent with the selection history of upland cotton. A genomic analysis of Chinese cultivars bred over 70 years showed that nearly half of the loci associated with yield and fiber quality have pleiotropic effects, with widespread trade-offs and linkage drag among traits[1]; multi-environment association analyses by Zhu et al.[23] and the identification of loci favorable to both yield and quality by Wang et al.[24] likewise indicate that elite alleles for lint yield and fiber strength occur at limited frequencies in breeding populations and are difficult to combine. For salt tolerance, association analyses at both the germination and seedling stages have detected numerous small-effect loci with clear differentiation of salt-tolerance alleles among germplasm[25,26]; the carrier rate of only 0.07 in this panel suggests that elite salt-tolerance alleles have not yet entered the gene pool of the main Xinjiang breeding materials and should be introduced as a priority. Accordingly, the accessions identified here as carriers of elite alleles for deficient traits can be used as donor parents for targeted improvement.
Methodologically, this study examined the behaviour of the KING-robust estimator on inbred line materials. The estimator is built on the difference in shared heterozygous states between two individuals, requires no prior population allele frequencies and is robust to population structure[22], but its derivation assumes Hardy-Weinberg equilibrium. The accessions analyzed here are highly inbred lines with an overall heterozygosity of only 6.96% and about 19 heterozygous markers per accession on average; the resulting shrinkage of the estimator's denominator inflates its variance, and its absolute values depart from theoretical calibration, with a median kinship coefficient of -3.41 for unrelated pairs where values should cluster near zero. This study therefore did not rely on KING values alone for kinship classification, but used genome-wide IBS similarity and Hamming distances as cross-evidence and applied the dual exclusion criterion of φ ≥ 0.0884 or Hamming distance ≤ 2; all five genotype-identical pairs were verified individually. Future work should re-estimate kinship from genome-wide SNPs to obtain well-calibrated coefficients and classification thresholds.
The pronounced overlap of northern and southern Xinjiang accessions on the first two principal components (PC1 explaining only 9.81% of the variation) indicates that regional labels no longer effectively represent genetic differences within this panel. This result is unsurprising: parent exchange among Xinjiang breeding institutions is frequent, breeding objectives such as early maturity and machine picking are highly consistent, and long-term directional selection has homogenized the cultivar gene pools of the two cotton regions[4,27,28]; studies of elite U.S. upland cotton and race stock accessions similarly show that traditional ecological-region classification explains limited genetic differentiation[29]. For crossing practice, the intuition that inter-regional crosses are inherently superior does not hold; the genetic value of a cross should be quantified pair by pair. The value of the 19 inter-regional crosses in our recommendations was measured directly by joint coverage and IBS genetic distance rather than by regional labels.
The crossing recommendations of this study are centered on the joint elite allele coverage U of the two parents, which represents the expectation that progeny retain, for each trait, at least the higher of the two parents' elite allele carriage levels (trait-level complementarity), implicitly assuming that elite alleles are retained dominantly in progeny; the complementarity gain Comp measures how far parental complementarity exceeds the parental mean. Compared with the prediction of heterosis from molecular genetic distance[17,18], this index targets the functional loci of breeding-goal traits directly and acts through allelic complementarity rather than overdominance. Parent deduplication in the recommendations allows the 30 crosses to cover a broader range of parental lineages and facilitates parallel validation of multiple crosses, preventing a few high-index accessions from occupying all crosses. Because U is computed from marker-based trait-level carriage statistics, its dominance-complementarity assumption has not been verified in the field, and it does not incorporate phenotypic stability, general combining ability or specific combining ability; the final crosses should be validated in multi-year, multi-location field trials before large-scale use[30].
Within breeding workflows, the core parents, carriers of deficient-trait alleles and candidate cross lists produced here can be used directly in current molecular breeding systems. Functional-locus liquid-phase chips are already used for parent selection and marker-assisted selection at many breeding institutions, and genomic selection for traits such as lint percent and fiber length has reached practical value[11,20]; the locus genotype data from this study can serve as input for training populations and, combined with designed breeding strategies such as MAGIC, enable targeted pyramiding of elite alleles[1]. As the cost of liquid-phase chips falls and genotyping throughput rises[10], the functional-locus-linked workflow of evaluation, crossing and validation is expected to become routine in upland cotton germplasm innovation.
5. Conclusions
Using 280 elite trait locus-trait combinations (270 unique markers) on a liquid-phase chip, we completed the genetic evaluation and crossing strategy construction for 356 upland cotton accessions from Xinjiang. The overall genotype missing rate was 0.43%, indicating reliable data quality; genetic differentiation between regions was weak, but five pairs of genotype-identical and 101 pairs of highly concordant accessions were present, and synonymous materials should be screened during parent selection. The comprehensive elite genotype index S ranged from 0.39 to 0.57, with Tkuo (0.571), Y80 (0.537), Ba 44435 (0.534), Ziyu R040068 (0.528) and Youzhi 5 (0.525) ranking in the top five as candidate core parents; salt tolerance, lint yield, seed index and fiber strength were the main genetic deficiencies of this panel. Under the close-relative exclusion constraint, 30 crossing schemes were recommended (19 inter-regional), with the best cross Ziyu TY112 × Tkuo reaching a joint elite allele coverage of 0.65. These core parents, deficiency-trait carriers and recommended crosses provide candidates for parental selection, germplasm innovation and molecular design breeding in upland cotton, and their actual breeding value requires confirmation in multi-year, multi-location field trials.
Author Contributions
Conceptualization, S.X. and H.L.; methodology, S.X.; software, S.X.; formal analysis, S.X.; data curation, Y.L.; investigation, S.Y. and B.X.; writing—original draft preparation, S.X.; writing—review and editing, Q.M., J.L., X.N. and H.L.; visualization, S.X.; supervision, H.L.; project administration, H.L.; funding acquisition, H.L. All authors have read and agreed to the published version of the manuscript.
Funding
This research was funded by the Breeding of Early-maturing, Widely-adaptive and High-quality Machine-picked Cotton Varieties (grant number 2023A02003); the Molecular Breeding Technology Research and Design Breeding of Major Crops of Xinjiang Production and Construction Corps (grant number NCG202504); the Key Areas Science and Technology Program of Xinjiang Production and Construction Corps (grant number 2024AB001); the Modern Agricultural Industry Technology System of Xinjiang Uygur Autonomous Region (grant number XJARS-03-21); and the Major Science and Technology Special Project of Xinjiang Uygur Autonomous Region (grant number 2024A02002-5-5).
Institutional Review Board Statement
Not applicable.
Data Availability Statement
The genotype data presented in this study are available from the corresponding author upon reasonable request.
Conflicts of Interest
The authors declare no conflicts of interest.
References
- Li, Y.Q.; Si, Z.F.; Wang, G.P.; Shi, Z.L.; Chen, J.W.; Qi, G.A.; Jin, S.K.; Han, Z.G.; Gao, W.H.; Tian, Y.; et al. Genomic insights into the genetic basis of cotton breeding in China. Mol. Plant 2023, 16, 662–677. [CrossRef]
- Fang, L.; Wang, Q.; Hu, Y.; Jia, Y.H.; Chen, J.D.; Liu, B.L.; Zhang, Z.Y.; Guan, X.Y.; Chen, S.Q.; Zhou, B.L.; et al. Genomic analyses in cotton identify signatures of selection and loci associated with fiber quality and yield traits. Nat. Genet. 2017, 49, 1089–1098. [CrossRef]
- Ma, Z.Y.; He, S.P.; Wang, X.F.; Sun, J.L.; Zhang, Y.; Zhang, G.Y.; Wu, L.Q.; Li, Z.K.; Liu, Z.H.; Sun, G.F.; et al. Resequencing a core collection of upland cotton identifies genomic variation and loci influencing fiber quality and yield. Nat. Genet. 2018, 50, 803–813. [CrossRef]
- Li, J.H.; Jin, Y.L.; Qiao, Y.Q.; Xu, Z.; Hu, J.H.; Zhang, X.Y.; Sun, J.; Xue, F. Construction of DNA fingerprinting and genetic diversity analysis of 150 Xinjiang upland cotton varieties. Mol. Plant Breed. 2022, 20, 2983–3001.
- Wang, X.Y.; Li, X.Y.; Gong, Z.L.; Wang, J.D.; Fan, L.P.; Zheng, J.Y.; Liang, Y.J.; Guo, J.P.; Mamat, M.; Ai, X.T. Construction of DNA fingerprinting and genetic diversity analysis of Xinjiang upland cotton based on SSR markers. Cotton Sci. 2018, 30, 308–315.
- Han, Z.G.; Chen, H.; Cao, Y.W.; He, L.; Si, Z.F.; Hu, Y.; Lin, H.; Ning, X.Z.; Li, J.L.; Ma, Q.; et al. Genomic insights into genetic improvement of upland cotton in the world's largest growing region. Ind. Crops Prod. 2022, 183, 114929. [CrossRef]
- Chen, G.; Du, X.M. Genetic diversity of source germplasm of upland cotton in China as determined by SSR marker analysis. Acta Genet. Sin. 2006, 33, 733–745. [CrossRef]
- Hinze, L.L.; Hulse-Kemp, A.M.; Wilson, I.W.; Zhu, Q.H.; Llewellyn, D.J.; Taylor, J.M.; Spriggs, A.; Fang, D.D.; Ulloa, M.; Burke, J.J.; et al. Diversity analysis of cotton (Gossypium hirsutum L.) germplasm using the CottonSNP63K array. BMC Plant Biol. 2017, 17, 37. [CrossRef]
- Cai, C.P.; Zhu, G.Z.; Zhang, T.Z.; Guo, W.Z. High-density 80 K SNP array is a powerful tool for genotyping G. hirsutum accessions and genome analysis. BMC Genom. 2017, 18, 654. [CrossRef]
- Si, Z.F.; Jin, S.K.; Li, J.Y.; Han, Z.G.; Li, Y.Q.; Wu, X.N.; Ge, Y.X.; Fang, L.; Zhang, T.Z.; Hu, Y. The design, validation, and utility of the 'ZJU CottonSNP40K' liquid chip through genotyping by target sequencing. Ind. Crops Prod. 2022, 188, 115629. [CrossRef]
- Zhang, X.Y.; Sun, Z.W.; Cao, M.Y.; Wang, H.Z.; Gu, Q.S.; Yang, J.; Tang, S.X.; Ke, H.F.; Zhang, D.M.; Wu, L.Q.; et al. MianxinNo.1: a modern cultivar genome-informed SNP array based on cGPS technology for genomics-assisted breeding in cotton. Theor. Appl. Genet. 2026, 139, 208. [CrossRef]
- Frankel, O.H. Genetic perspectives of germplasm conservation. In Genetic Manipulation: Impact on Man and Society; Arber, W.; Illmensee, K.; Peacock, W.J.; Starlinger, P., Eds.; Cambridge University Press: Cambridge, UK, 1984; pp. 161–170.
- Brown, A.H.D. Core collections: a practical approach to genetic resources management. Genome 1989, 31, 818–824. [CrossRef]
- Han, P.; Tian, X.M.; Wang, Y.; Huang, C.; Ma, Y.Z.; Zhou, X.F.; Yu, Y.; Zhang, D.W.; Xu, H.J.; Cao, Y.; et al. Construction of a core germplasm bank of upland cotton (Gossypium hirsutum L.) based on phenotype, genotype and favorable alleles. Genet. Resour. Crop Evol. 2022, 69, 2399–2411. [CrossRef]
- Zhang, X.; Liu, Y.; Qian, Y.Y.; Wang, G.E.; Wang, H.J.; Jiao, X.F.; Xie, H.; Cui, S.F.; Li, J.L. Genetic diversity analysis and primary core germplasm construction of upland cotton (Gossypium hirsutum L.). Acta Agric. Boreali-Sin. 2023, 38, 26–33.
- Li, C.Q.; Dong, C.G.; Zhao, H.H.; Wang, J.; Du, L.; Ai, N.J. Identification of superior parents with high fiber quality using molecular markers and phenotypes based on a core collection of upland cotton (Gossypium hirsutum L.). Mol. Breed. 2022, 42, 30. [CrossRef]
- Sarfraz, Z.; Iqbal, M.S.; Pan, Z.E.; Jia, Y.H.; He, S.P.; Wang, Q.L.; Qin, H.D.; Liu, J.H.; Liu, H.; Yang, J.; et al. Integration of conventional and advanced molecular tools to track footprints of heterosis in cotton. BMC Genom. 2018, 19, 776. [CrossRef]
- Geng, X.L.; Qu, Y.J.; Jia, Y.H.; He, S.P.; Pan, Z.E.; Wang, L.R.; Du, X.M. Assessment of heterosis based on parental genetic distance estimated with SSR and SNP markers in upland cotton (Gossypium hirsutum L.). BMC Genom. 2021, 22, 123. [CrossRef]
- Li, Z.T.; Liu, S.M.; Conaty, W.; Zhu, Q.H.; Moncuquet, P.; Stiller, W.; Wilson, I. Genomic prediction of cotton fibre quality and yield traits using Bayesian regression methods. Heredity 2022, 129, 103–112. [CrossRef]
- Islam, M.S.; Fang, D.D.; Jenkins, J.N.; Guo, J.; McCarty, J.C.; Jones, D.C. Evaluation of genomic selection methods for predicting fiber quality traits in upland cotton. Mol. Genet. Genom. 2020, 295, 67–79. [CrossRef]
- Billings, G.T.; Jones, M.A.; Rustgi, S.; Bridges, W.C.; Holland, J.B.; Hulse-Kemp, A.M.; Campbell, B.T. Outlook for implementation of genomics-based selection in public cotton breeding programs. Plants 2022, 11, 1446. [CrossRef]
- Manichaikul, A.; Mychaleckyj, J.C.; Rich, S.S.; Daly, K.; Sale, M.; Chen, W.M. Robust relationship inference in genome-wide association studies. Bioinformatics 2010, 26, 2867–2873. [CrossRef]
- Zhu, G.Z.; Hou, S.; Song, X.H.; Wang, X.; Wang, W.; Chen, Q.J.; Guo, W.Z. Genome-wide association analysis reveals quantitative trait loci and candidate genes involved in yield components under multiple field environments in cotton (Gossypium hirsutum). BMC Plant Biol. 2021, 21, 250. [CrossRef]
- Wang, P.P.; He, S.P.; Sun, G.F.; Pan, Z.E.; Sun, J.L.; Geng, X.L.; Peng, Z.; Gong, W.F.; Wang, L.R.; Pang, B.Y.; et al. Favorable pleiotropic loci for fiber yield and quality in upland cotton (Gossypium hirsutum). Sci. Rep. 2021, 11, 15935. [CrossRef]
- Yuan, Y.C.; Xing, H.X.; Zeng, W.G.; Xu, J.L.; Mao, L.L.; Wang, L.Y.; Feng, W.; Tao, J.C.; Wang, H.R.; Zhang, H.J.; et al. Genome-wide association and differential expression analysis of salt tolerance in Gossypium hirsutum L. at the germination stage. BMC Plant Biol. 2019, 19, 394. [CrossRef]
- Sun, Z.W.; Li, H.L.; Zhang, Y.; Li, Z.K.; Ke, H.F.; Wu, L.Q.; Zhang, G.Y.; Wang, X.F.; Ma, Z.Y. Identification of SNPs and candidate genes associated with salt tolerance at the seedling stage in cotton (Gossypium hirsutum L.). Front. Plant Sci. 2018, 9, 1011. [CrossRef]
- Wang, J.D.; Zhang, Z.L.; Gong, Z.L.; Liang, Y.J.; Ai, X.T.; Sang, Z.W.; Guo, J.P.; Li, X.Y.; Zheng, J.Y. Analysis of the genetic structure and diversity of upland cotton groups in different planting areas based on SNP markers. Gene 2022, 809, 146042. [CrossRef]
- Shi, J.B.; Zhang, Y.B.; Wang, N.; Xu, Q.H.; Huo, F.C.; Liu, X.H.; Yan, G.T. Genetic diversity and population structure analysis of upland cotton (Gossypium hirsutum L.) germplasm in China based on SSR markers. Genet. Resour. Crop Evol. 2023, 70, 2671–2682. [CrossRef]
- Zhu, L.L.; Tyagi, P.; Kaur, B.; Kuraparthy, V. Genetic diversity and population structure in elite U.S. and race stock accessions of upland cotton (Gossypium hirsutum). J. Cotton Sci. 2019, 23, 38–47. [CrossRef]
- Gnanasekaran, M.; Thiyagu, K. Gene action, combining ability and standard heterosis for seed cotton yield and fibre quality components in upland cotton. Electron. J. Plant Breed. 2021, 12, 325–334. [CrossRef]
Figure 1.
Quality assessment of genotype data. (a) Distribution of missing markers per accession; (b) Distribution of heterozygous markers per accession; (c) Distribution of elite allele frequency per marker.
Figure 1.
Quality assessment of genotype data. (a) Distribution of missing markers per accession; (b) Distribution of heterozygous markers per accession; (c) Distribution of elite allele frequency per marker.
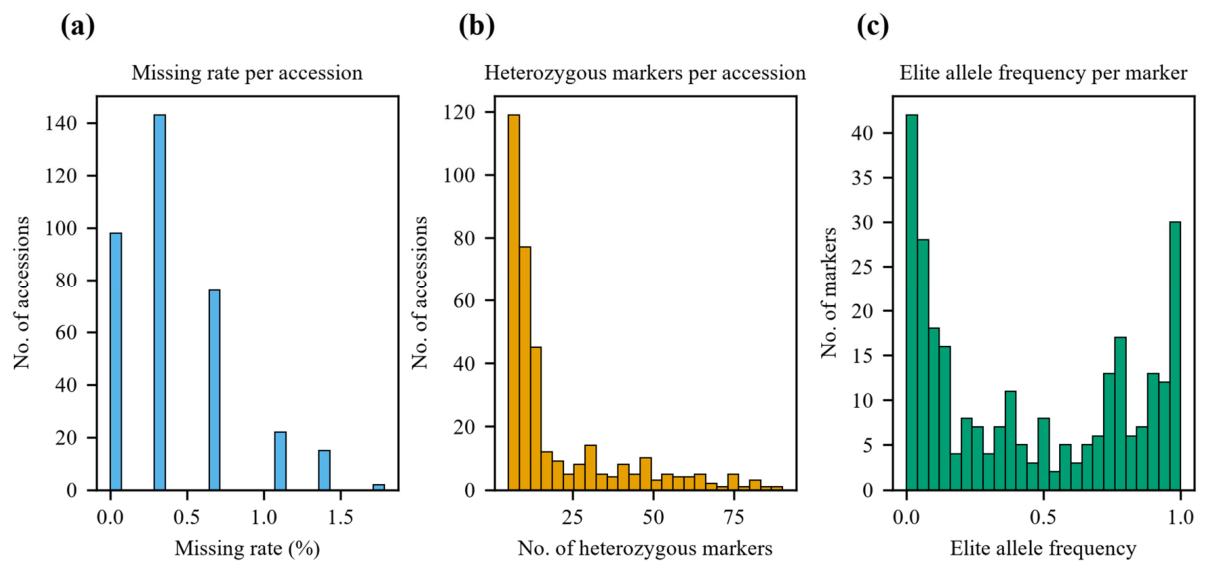
Figure 2.
Marker composition and population carrier rates of elite traits. (a) Number of markers per trait; (b) Mean elite allele carrier rate per trait.
Figure 2.
Marker composition and population carrier rates of elite traits. (a) Number of markers per trait; (b) Mean elite allele carrier rate per trait.
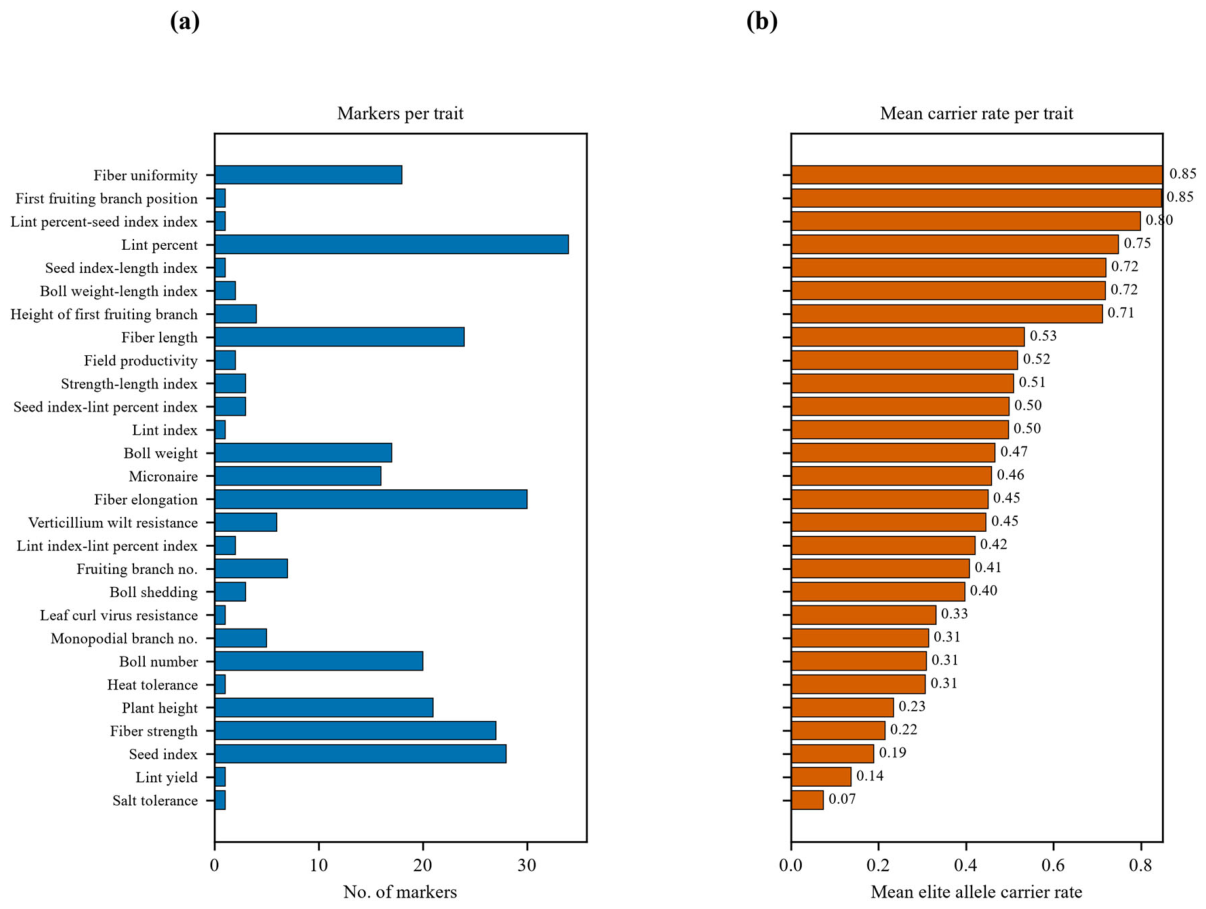
Figure 3.
Heatmaps of genetic relatedness. (a) KING-robust kinship coefficients; (b) IBS genetic similarity. Accessions were ordered by hierarchical clustering on IBS distance, with regional origins indicated by the top strips.
Figure 3.
Heatmaps of genetic relatedness. (a) KING-robust kinship coefficients; (b) IBS genetic similarity. Accessions were ordered by hierarchical clustering on IBS distance, with regional origins indicated by the top strips.
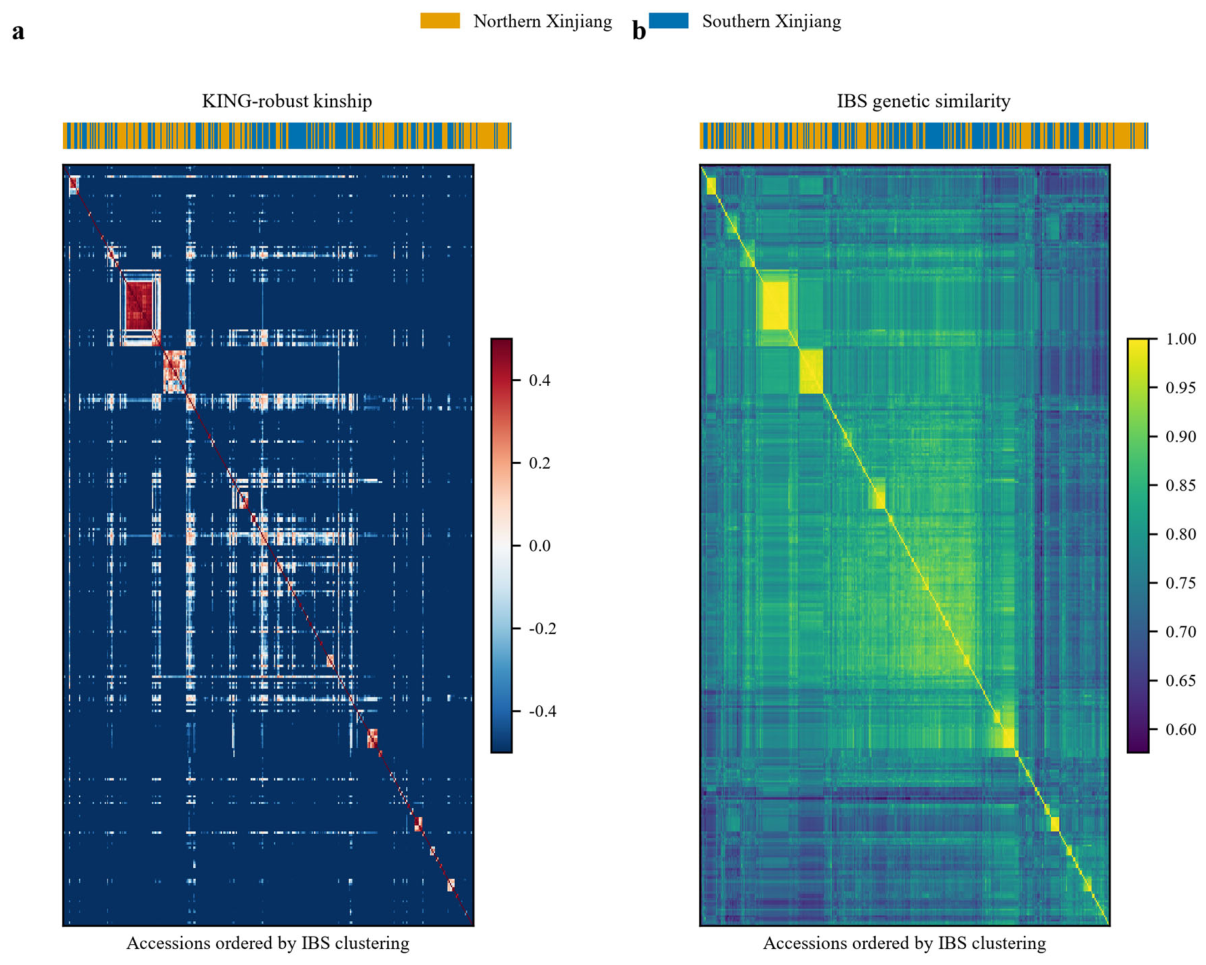
Figure 4.
Principal component analysis of population structure. (a) PC1-PC2 scatter plot; (b) Comparison of PC1 scores between regions.
Figure 4.
Principal component analysis of population structure. (a) PC1-PC2 scatter plot; (b) Comparison of PC1 scores between regions.
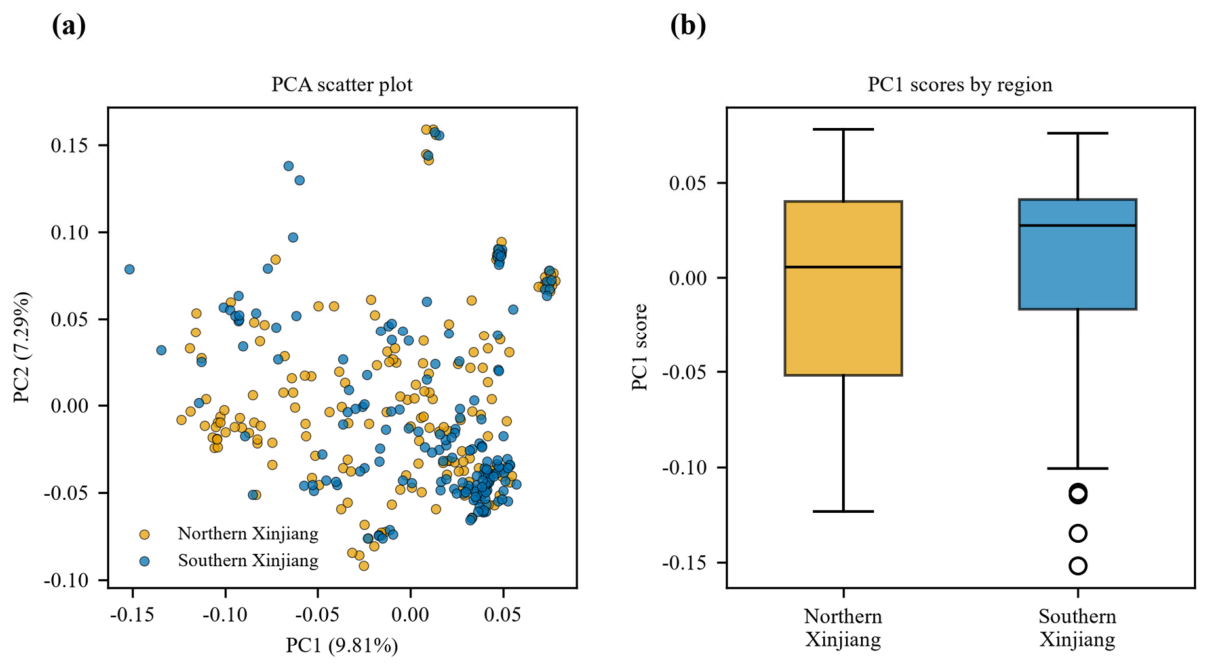
Figure 5.
Comprehensive evaluation of elite genotypes. (a) Distribution of index S; (b) Top 15 accessions ranked by index S.
Figure 5.
Comprehensive evaluation of elite genotypes. (a) Distribution of index S; (b) Top 15 accessions ranked by index S.
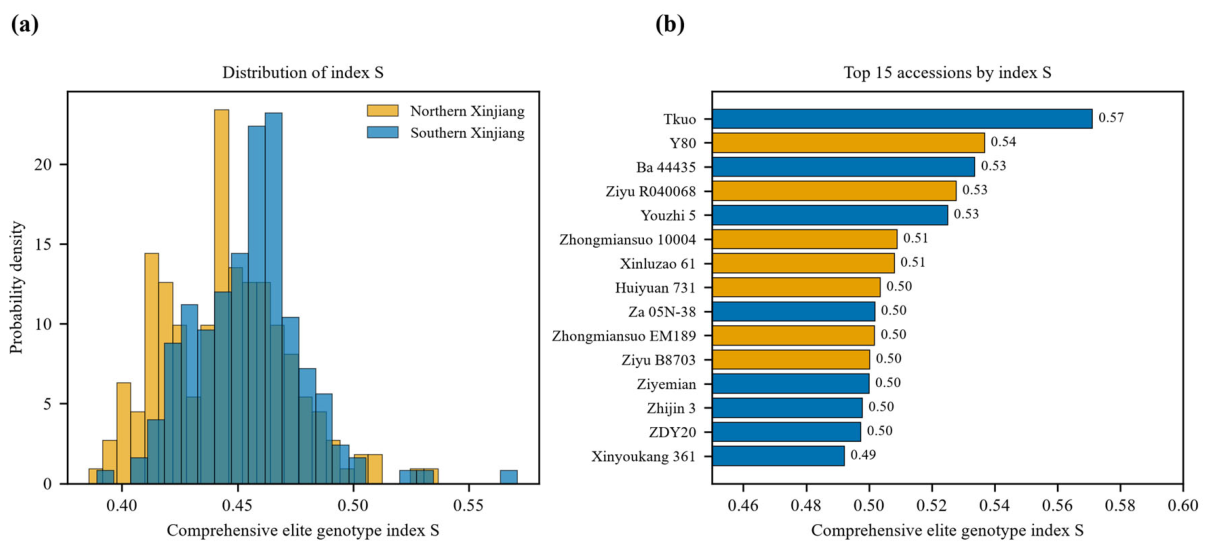
Figure 6.
Parental crossing strategy. (a) IBS genetic distance versus joint elite allele coverage of candidate crosses; (b) Top 30 recommended crosses.
Figure 6.
Parental crossing strategy. (a) IBS genetic distance versus joint elite allele coverage of candidate crosses; (b) Top 30 recommended crosses.
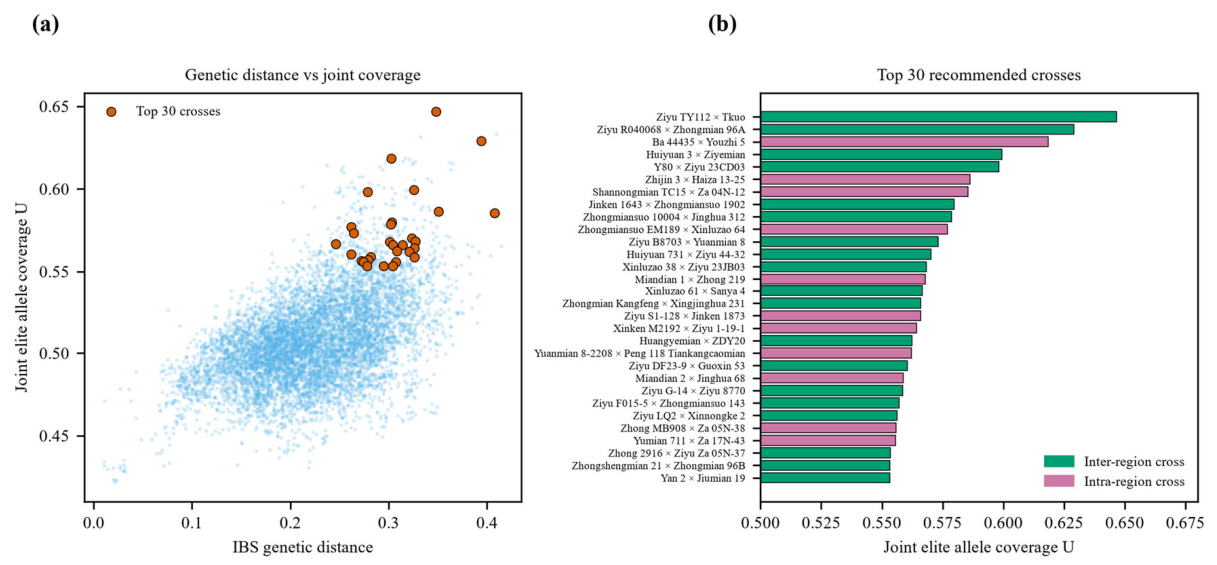

Table 1.
Accession pairs with identical genotypes. Cultivar names are romanized from Chinese.
| Accession ID 1 | Germplasm name 1 | Region 1 | Accession ID 2 | Germplasm name 2 | Region 2 |
|---|---|---|---|---|---|
| NK031 | Zhong 1201 | Northern Xinjiang | NK116 | Hexin X19075 | Northern Xinjiang |
| NK061 | Zhong M17433 | Northern Xinjiang | NK134 | Huiyuan 720 | Northern Xinjiang |
| NK077 | Jingkang 1 | Northern Xinjiang | NK127 | Hexin Ta 2 | Northern Xinjiang |
| NK077 | Jingkang 1 | Northern Xinjiang | NK131 | Tahe 2 Xiaoling | Northern Xinjiang |
| NK101 | CF Ta 2 Tigao | Northern Xinjiang | NK171 | Xinluzhong 84 | Southern Xinjiang |
Table 2.
Top 15 accessions ranked by comprehensive elite genotype index. Cultivar names are romanized from Chinese.
Table 2.
Top 15 accessions ranked by comprehensive elite genotype index. Cultivar names are romanized from Chinese.
| Rank | Accession ID | Germplasm name | Region | Comprehensive index S |
|---|---|---|---|---|
| 1 | NK373 | Tkuo | Southern Xinjiang | 0.571 |
| 2 | NK002 | Y80 | Northern Xinjiang | 0.537 |
| 3 | NK256 | Ba 44435 | Southern Xinjiang | 0.534 |
| 4 | NK112 | Ziyu R040068 | Northern Xinjiang | 0.528 |
| 5 | NK336 | Youzhi 5 | Southern Xinjiang | 0.525 |
| 6 | NK058 | Zhongmiansuo 10004 | Northern Xinjiang | 0.509 |
| 7 | NK161 | Xinluzao 61 | Northern Xinjiang | 0.508 |
| 8 | NK039 | Huiyuan 731 | Northern Xinjiang | 0.504 |
| 9 | NK403 | Za 05N-38 | Southern Xinjiang | 0.502 |
| 10 | NK057 | Zhongmiansuo EM189 | Northern Xinjiang | 0.502 |
| 11 | NK117 | Ziyu B8703 | Northern Xinjiang | 0.500 |
| 12 | NK295 | Ziyemian | Southern Xinjiang | 0.500 |
| 13 | NK253 | Zhijin 3 | Southern Xinjiang | 0.498 |
| 14 | NK259 | ZDY20 | Southern Xinjiang | 0.497 |
| 15 | NK186 | Xinyoukang 361 | Southern Xinjiang | 0.492 |
Table 3.
Recommended parental combinations (top 10 crosses). N, northern Xinjiang; S, southern Xinjiang. Cultivar names are romanized from Chinese.
Table 3.
Recommended parental combinations (top 10 crosses). N, northern Xinjiang; S, southern Xinjiang. Cultivar names are romanized from Chinese.
| No. | Parent 1 | Parent 2 | S of parent 1 | S of parent 2 | Joint coverage U | Complementarity gain | IBS genetic distance |
|---|---|---|---|---|---|---|---|
| 1 | Ziyu TY112 (N) | Tkuo (S) | 0.49 | 0.57 | 0.65 | 0.12 | 0.35 |
| 2 | Ziyu R040068 (N) | Zhongmian 96A (S) | 0.53 | 0.46 | 0.63 | 0.13 | 0.39 |
| 3 | Ba 44435 (S) | Youzhi 5 (S) | 0.53 | 0.53 | 0.62 | 0.09 | 0.30 |
| 4 | Huiyuan 3 (N) | Ziyemian (S) | 0.47 | 0.50 | 0.60 | 0.12 | 0.33 |
| 5 | Y80 (N) | Ziyu 23CD03 (S) | 0.54 | 0.48 | 0.60 | 0.09 | 0.28 |
| 6 | Zhijin 3 (S) | Haiza 13-25 (S) | 0.50 | 0.47 | 0.59 | 0.10 | 0.35 |
| 7 | Shannongmian TC15 (S) | Za 04N-12 (S) | 0.49 | 0.47 | 0.59 | 0.11 | 0.41 |
| 8 | Jinken 1643 (N) | Zhongmiansuo 1902 (S) | 0.46 | 0.48 | 0.58 | 0.11 | 0.30 |
| 9 | Zhongmiansuo 10004 (N) | Jinghua 312 (S) | 0.51 | 0.46 | 0.58 | 0.09 | 0.30 |
| 10 | Zhongmiansuo EM189 (N) | Xinluzao 64 (N) | 0.50 | 0.48 | 0.58 | 0.08 | 0.26 |
Disclaimer/Publisher’s Note: The statements, opinions and data contained in all publications are solely those of the individual author(s) and contributor(s) and not of MDPI and/or the editor(s). MDPI and/or the editor(s) disclaim responsibility for any injury to people or property resulting from any ideas, methods, instructions or products referred to in the content. |
© 2026 by the authors. Licensee MDPI, Basel, Switzerland. This article is an open access article distributed under the terms and conditions of the Creative Commons Attribution (CC BY) license (http://creativecommons.org/licenses/by/4.0/).
Copyright: This open access article is published under a Creative Commons CC BY 4.0 license, which permit the free download, distribution, and reuse, provided that the author and preprint are cited in any reuse.