

Submitted:
07 September 2026
Posted:
08 September 2026
You are already at the latest version
Abstract
Significant regional variation was observed in colony composition, productivity, and disease prevalence. Modern colonies (colonies housed in frame hives) produced significantly higher honey yields than traditional colonies (horizontal cylindrical wooden hive), and colony composition was a stronger determinant of productivity than disease prevalence. Multiple regression indicated that the proportion of modern colonies positively influenced honey yield, while geographical region was the primary predictor of high Varroa destructor infestation. No significant predictors were identified for high Nosema sp. incidence. PCA and cluster analyses identified four distinct production system typologies differing in colony composition, productivity, and disease burden. Beekeepers identified imported bees, biosecurity risks, predator pressure, inadequate disease management, and marketing constraints as the major challenges affecting sector performance. The findings provide an evidence-based framework for developing a National Honeybee Sector Development Strategy focused on strengthening disease surveillance, biosecurity, extension, advisory and value chain interventions along with conservation and genetic improvement of Apis mellifera jemenitica. These interventions will enhance honey production, reduce colony losses, improve pollination services, and support the long-term sustainability and resilience of Saudi Arabia's apiculture sector.
Keywords:
Apis mellifera jemenitica
; Apis mellifera
; honeybee health
; honey production
; production systems
; Saudi Arabia
1. Introduction
Beekeeping is an important component of sustainable agriculture, contributing to rural livelihoods, biodiversity conservation, and food security through the production of honey and other hive products, as well as through pollination of agricultural and natural ecosystems [1,2,3,4,5]. Globally, more than 92 million [61] managed honeybee colonies produce approximately 1.9 million tonnes of honey annually. Bees and other pollinators provide pollination services that support over one-third of crop species, by volume, and nearly 75% of globally important food crop types [6,7]. The economic value of insect pollination is estimated at more than US$235–577 billion annually, highlighting the strategic importance of healthy and productive honeybee populations for sustainable agrifood systems [7,8].
In the Kingdom of Saudi Arabia, beekeeping represents an important source of income for rural communities, particularly in the southwestern mountainous regions where traditional apiculture has been practiced for centuries. The sector comprises approximately two million managed colonies, including both indigenous Apis mellifera jemenitica and imported package bees, supporting around 25,000 beekeeping households [9]. Indigenous honey produced from floral sources such as Sidr (Ziziphus spina-christi), Talh (Vachellia seyal), and Samar (Acacia tortilis) commands premium prices because of its distinctive quality, medicinal value, and strong consumer demand [10,11].
Despite its potential, the Saudi beekeeping sector faces several challenges that constrain productivity and long-term sustainability. Honey yields remain relatively low compared with many commercial beekeeping systems worldwide, reflecting the combined effects of harsh climatic conditions, seasonal forage shortages, dependence on imported bees, disease pressure [58], and variations in management practices [12,13]. The predominance of migratory beekeeping, coupled with increasing environmental stress associated with climate change, further complicates sustainable colony management and increases the risk of disease transmission among apiaries [14,15,16].
Honeybee health is another important factor affecting productivity. Parasites and pathogens [58], such as Varroa destructor [62] and Nosema species, have become major constraints to apiculture worldwide because they reduce colony strength, increase mortality, impair honey production, and contribute to colony losses [17,18,19,20,21]. However, colony performance is influenced not only by disease but also by genetics, nutrition, forage availability, colony management, and environmental conditions [22,23,24,25]. Consequently, improving productivity requires an integrated understanding of these interacting factors rather than focusing on disease alone. Another important issue for Saudi Arabia is balancing productivity improvement with conservation of indigenous honeybee genetic resources [57]. Although imported package bees generally produce higher honey yields under favorable conditions, the indigenous Apis mellifera jemenitica possesses exceptional adaptation to high temperatures, parasite / pathogen tolerance, drought, and arid environments [12,26,57]. Conserving locally adapted honeybee populations while improving their productivity through selective breeding is increasingly recognized as an important strategy for sustainable apiculture and climate resilience [27,28,57].
Globally, modern apiculture is increasingly adopting integrated approaches that combine genetic improvement [57], honeybee health management, improved nutrition through enhanced and diversified floral resources, digital technologies, and strengthened value chains to enhance productivity and resilience [29,30,31,32,33]. Precision apiculture, including IoT-based hive monitoring, sensor technologies, artificial intelligence, and decision-support systems, is creating new opportunities for continuous monitoring of colony health, productivity, and environmental conditions [34,35,36]. These innovations are particularly relevant for Saudi Arabia, where significant opportunities exist to improve colony management, strengthen biosecurity, expand extension services, and enhance honey quality and marketing.
Although several studies have investigated specific aspects of Saudi apiculture, including the biology of Apis mellifera jemenitica, honey production, and individual diseases [10,11,12,13], a comprehensive national assessment integrating production systems, colony composition, productivity, honeybee health, and beekeeper constraints has been lacking. Such information is essential for understanding the diversity of production systems, identifying factors affecting productivity, and developing targeted interventions to strengthen the sustainability and competitiveness of the Saudi beekeeping sector. Therefore, the objectives of this study were to:
- Characterize the structure of the beekeeping sector across major beekeeping regions of Saudi Arabia;
- Evaluate regional variation in colony composition, honey production, and honeybee disease prevalence;
- Identify the key factors influencing honey productivity;
- Classify production systems using multivariate statistical approaches; and
- Identify priority interventions to improve the productivity, sustainability, and resilience of the Saudi apiculture sector.
The findings provide a national evidence base for strengthening beekeeping development through improved genetics, colony management, biosecurity, extension services, and value-chain development, while supporting the sustainable growth of the sector.
2. Materials and Methods
2.1. Study Area and Sampling
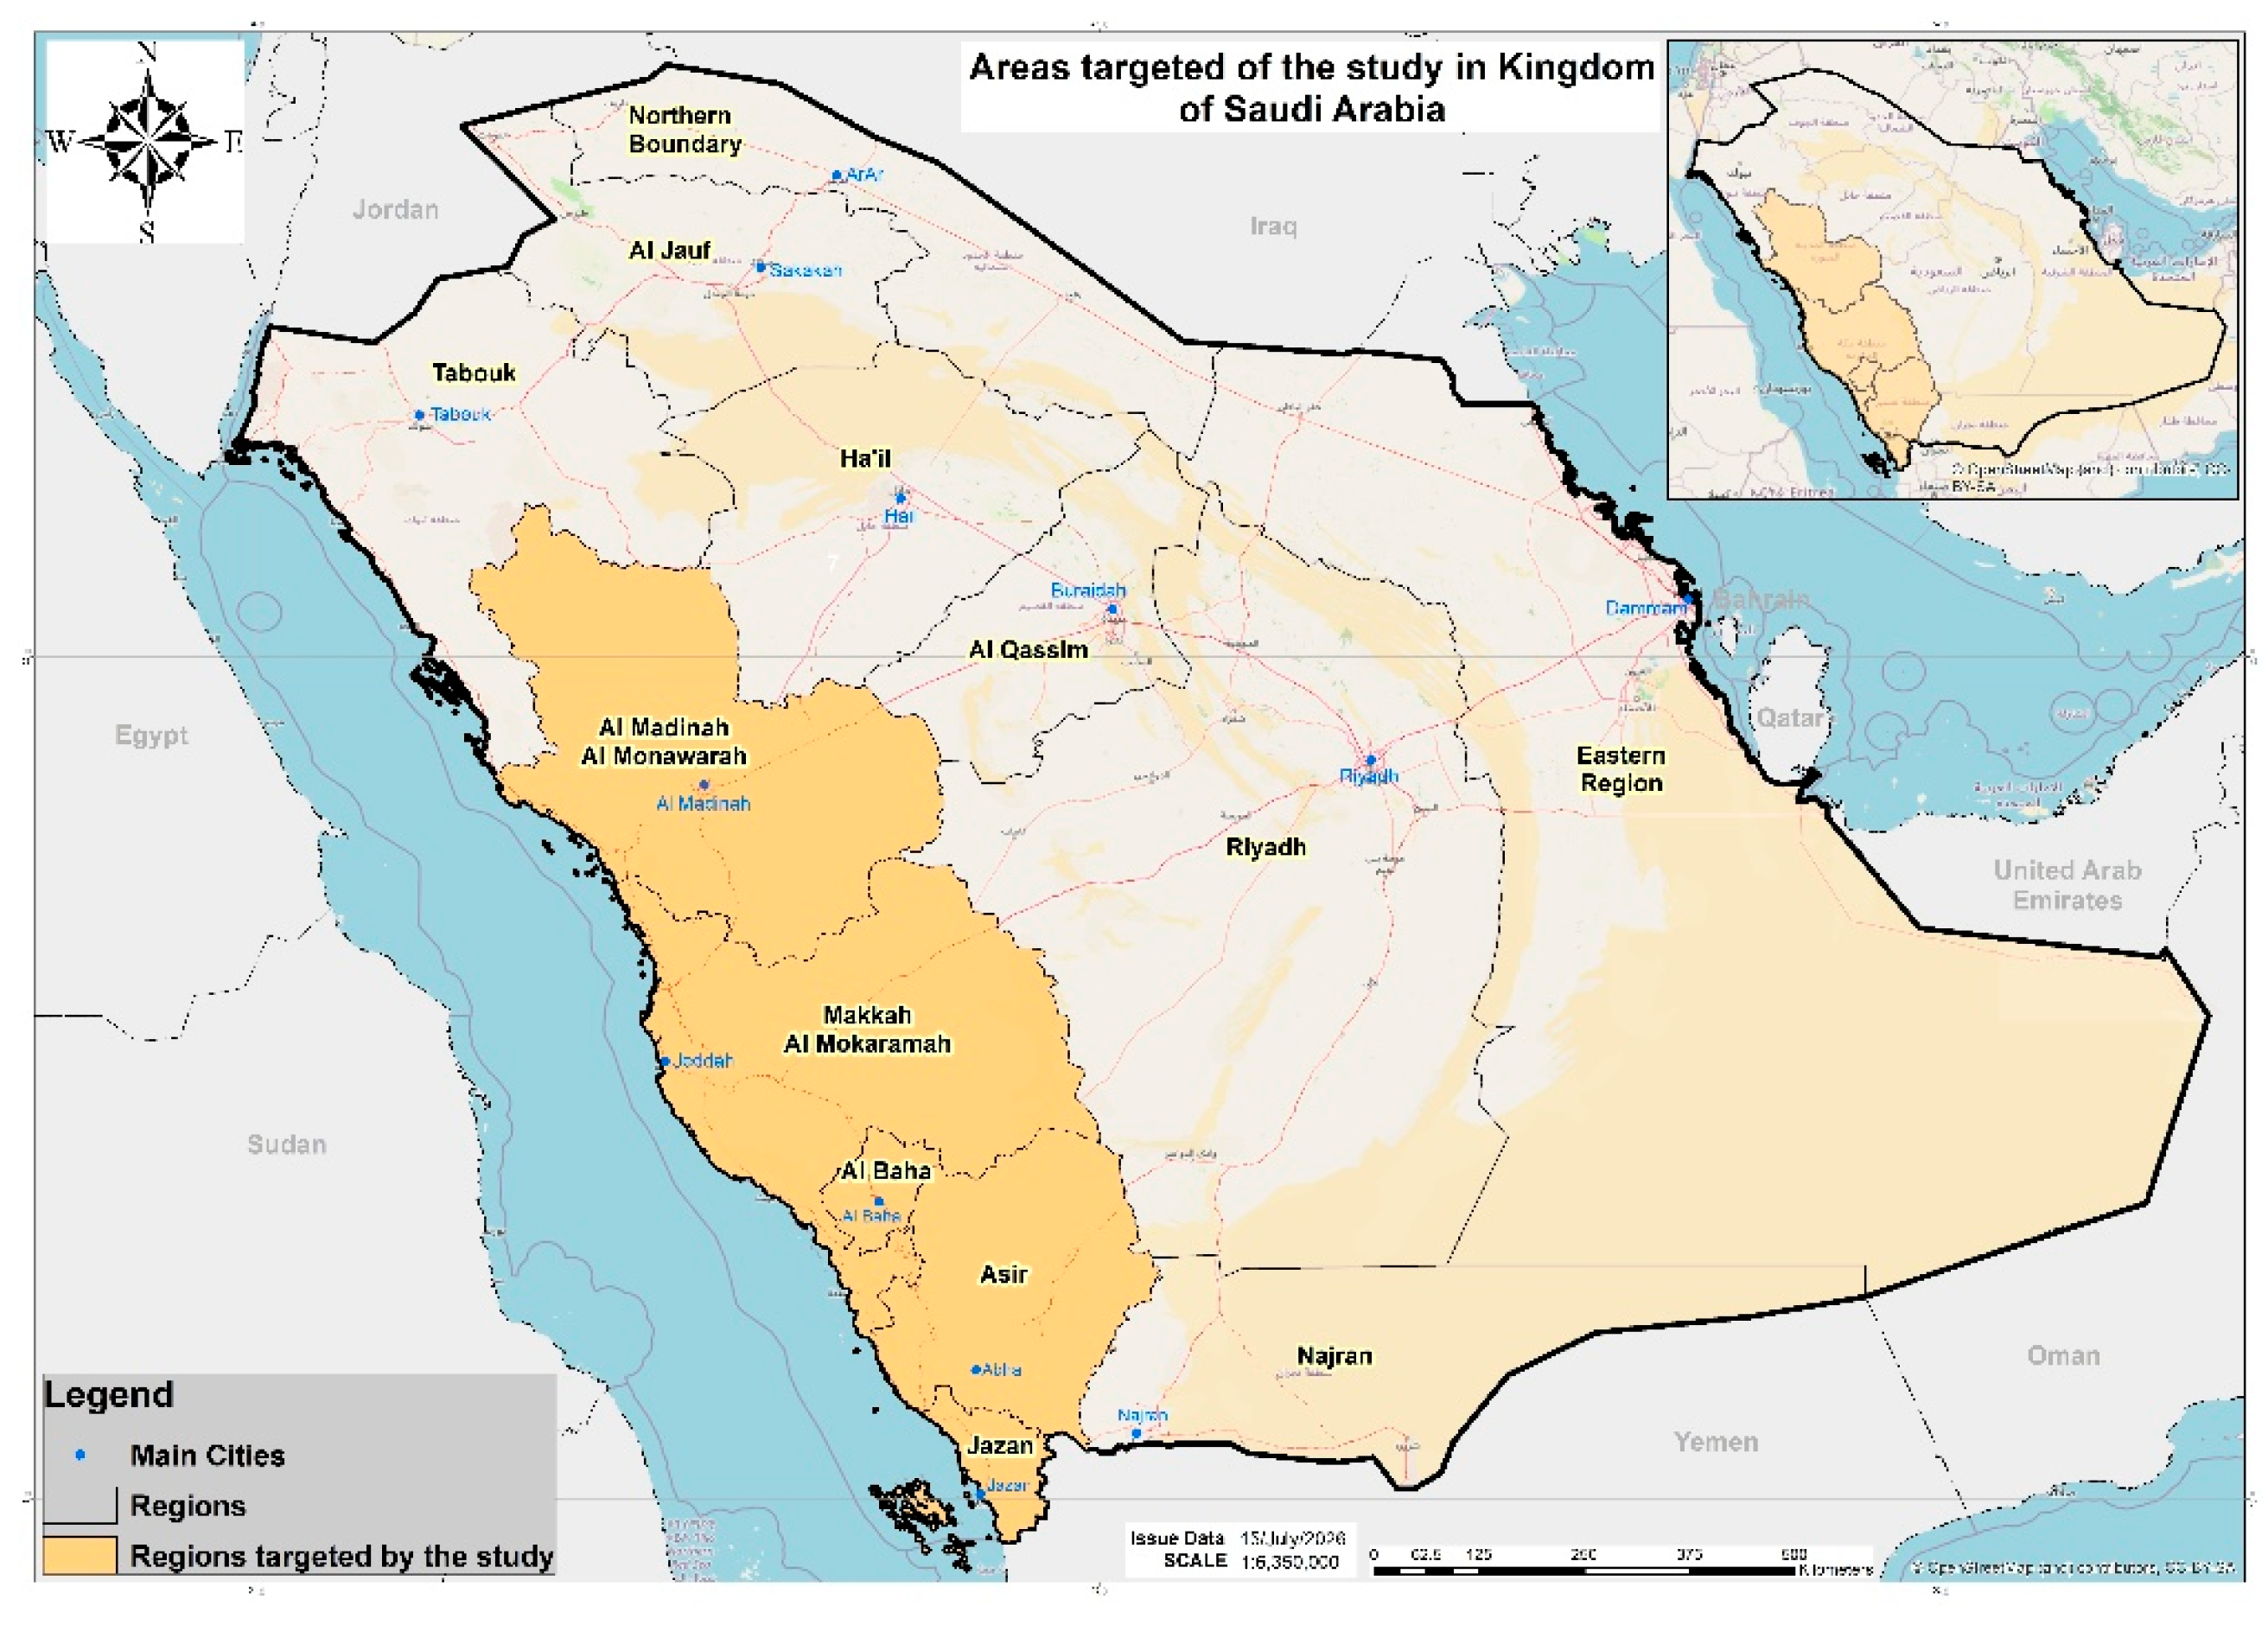
The study was conducted across five major beekeeping regions of Saudi Arabia: Al-Baha, Al-Madinah, Asir, Jazan, and Makkah. These regions represent diverse agroecological conditions, ranging from the relatively high-rainfall southwestern highlands to the arid and semi-arid environments of Makkah and Al-Madinah. Saudi beekeeping is predominantly migratory, with colonies moved seasonally to exploit flowering resources. Indigenous Apis mellifera jemenitica colonies coexist with imported package bees, resulting in varied production systems and management intensities.
A cross-sectional survey of 98 apiaries was conducted in collaboration with regional offices of the Ministry of Environment, Water and Agriculture. A purposive sampling method was applied, and the apiaries were selected to capture variation in apiary size, colony composition, and management practices. Beekeepers were interviewed using a structured questionnaire and field observations were used to verify key apiary characteristics. Participation was voluntary.
Figure 1.
Distribution of surveyed apiaries across the five major beekeeping regions of Saudi Arabia (Jazan, Makkah, Asir, Al-Baha, and Al-Madinah), where beekeeping is predominantly concentrated.
Figure 1.
Distribution of surveyed apiaries across the five major beekeeping regions of Saudi Arabia (Jazan, Makkah, Asir, Al-Baha, and Al-Madinah), where beekeeping is predominantly concentrated.
2.2. Data Collection and Variables
The questionnaire was developed with input from apiculture specialists, veterinarians, and extension personnel and was pre-tested before use. Information was collected on apiary location, numbers and proportions of traditional and modern (Langstroth) colonies, honey production, major diseases and pests, and beekeeper-reported constraints
The main variables included apiary structure, honey productivity, honeybee health, and production constraints. Apiary structure was described by traditional, modern, (Langstroth) colonies, and total colony numbers and their proportional composition. Honey production was recorded for three harvest seasons and summarized as annual production and yield per colony. Health assessment focused on Varroa destructor and Nosema prevalence, expressed as the percentage of affected colonies. Regarding Varroa infestation, honeybee colonies were examined using the powdered sugar shake method. Nosema infection was assessed based on the presence of clinical signs, including the inspection of brood combs, the presence of crawling bees in front of the hives, and abnormal bee mortality. Heavy infestations of Varroa destructor and Nosema spp. in honey bee (Apis mellifera) colonies are typically characterized by mite loads exceeding 3–5% per 100 adult bees and spore counts surpassing 1 × 10⁶ spores per bee, respectively; notably, for Nosema, diagnosis relied on the visual assessment of clinical symptoms For logistic regression, disease prevalence was classified into high and non-high incidence categories. Reported constraints were coded into broader themes, including biosecurity, disease management, predators, marketing, governance, logistics, treatment services, environmental limitations, and beekeeper practices.
2.3. Statistical Analysis
Statistical analyses were performed using jamovi (version 2.5) and R (version 4.3.1), with statistical significance set at p < 0.05 [37,38]. Continuous variables were summarized using means, standard deviations, medians, and ranges, whereas categorical variables were described using frequencies and percentages.
Regional differences in colony structure, honey production, and disease prevalence were assessed using one-way analysis of variance. Paired t-tests were used to compare honey production by traditional and modern colonies within the same apiaries. Relationships among colony composition, production, and disease variables were examined using correlation analysis. Multiple linear regression was used to identify factors associated with honey yield per colony, including region, total colony number, colony composition, and Varroa and Nosema prevalence. Separate models were fitted for traditional and modern colony percentages to avoid multicollinearity.
Binary logistic regression was used to identify factors associated with high Varroa and Nosema incidence. Results were expressed as odds ratios with 95% confidence intervals, and model fit was assessed using residual deviance and Akaike Information Criterion. Principal component analysis was conducted using standardized colony structure, productivity, and disease variables to identify the main dimensions of variation among apiaries. Apiaries were further grouped into quadrants based on their first two principal component scores. K-means cluster analysis was then applied to classify apiaries into production system typologies, with the number of clusters selected using the elbow method and biological interpretability. Beekeeper constraints were summarized by frequency and percentage. Results were presented using boxplots, bar charts, heat maps, PCA plots, and cluster diagrams.
3. Results
3.1. Characteristics of the Surveyed Apiaries
A total of 98 apiaries were surveyed across five major beekeeping regions of Saudi Arabia, namely Al-Madinah, Al-Baha, Asir, Jazan, and Makkah. Makkah (42 apiaries) and Jazan (34 apiaries) represented the largest proportion of the surveyed apiaries, whereas Al-Madinah contributed only two apiaries. Considerable variation was observed in apiary size and colony composition among regions. Overall, surveyed apiaries contained an average of 225 colonies, comprising approximately 124 traditional colonies and 146 modern colonies. Apiaries in Asir and Jazan generally maintained larger populations of local colonies, whereas Makkah contained the highest numbers of modern colonies, reflecting regional differences in production systems and management practices.
Figure 2.
Study area showing the distribution of surveyed apiaries across the selected regions. Jazan and Makkah accounted for 78% of the surveyed apiaries. This uneven regional representation reflects the purposive sampling strategy adopted to include apiaries participating in the Sustainable Rural Agricultural Development (SRAD) project (https://my.gov.sa/en/services/228305) interventions.
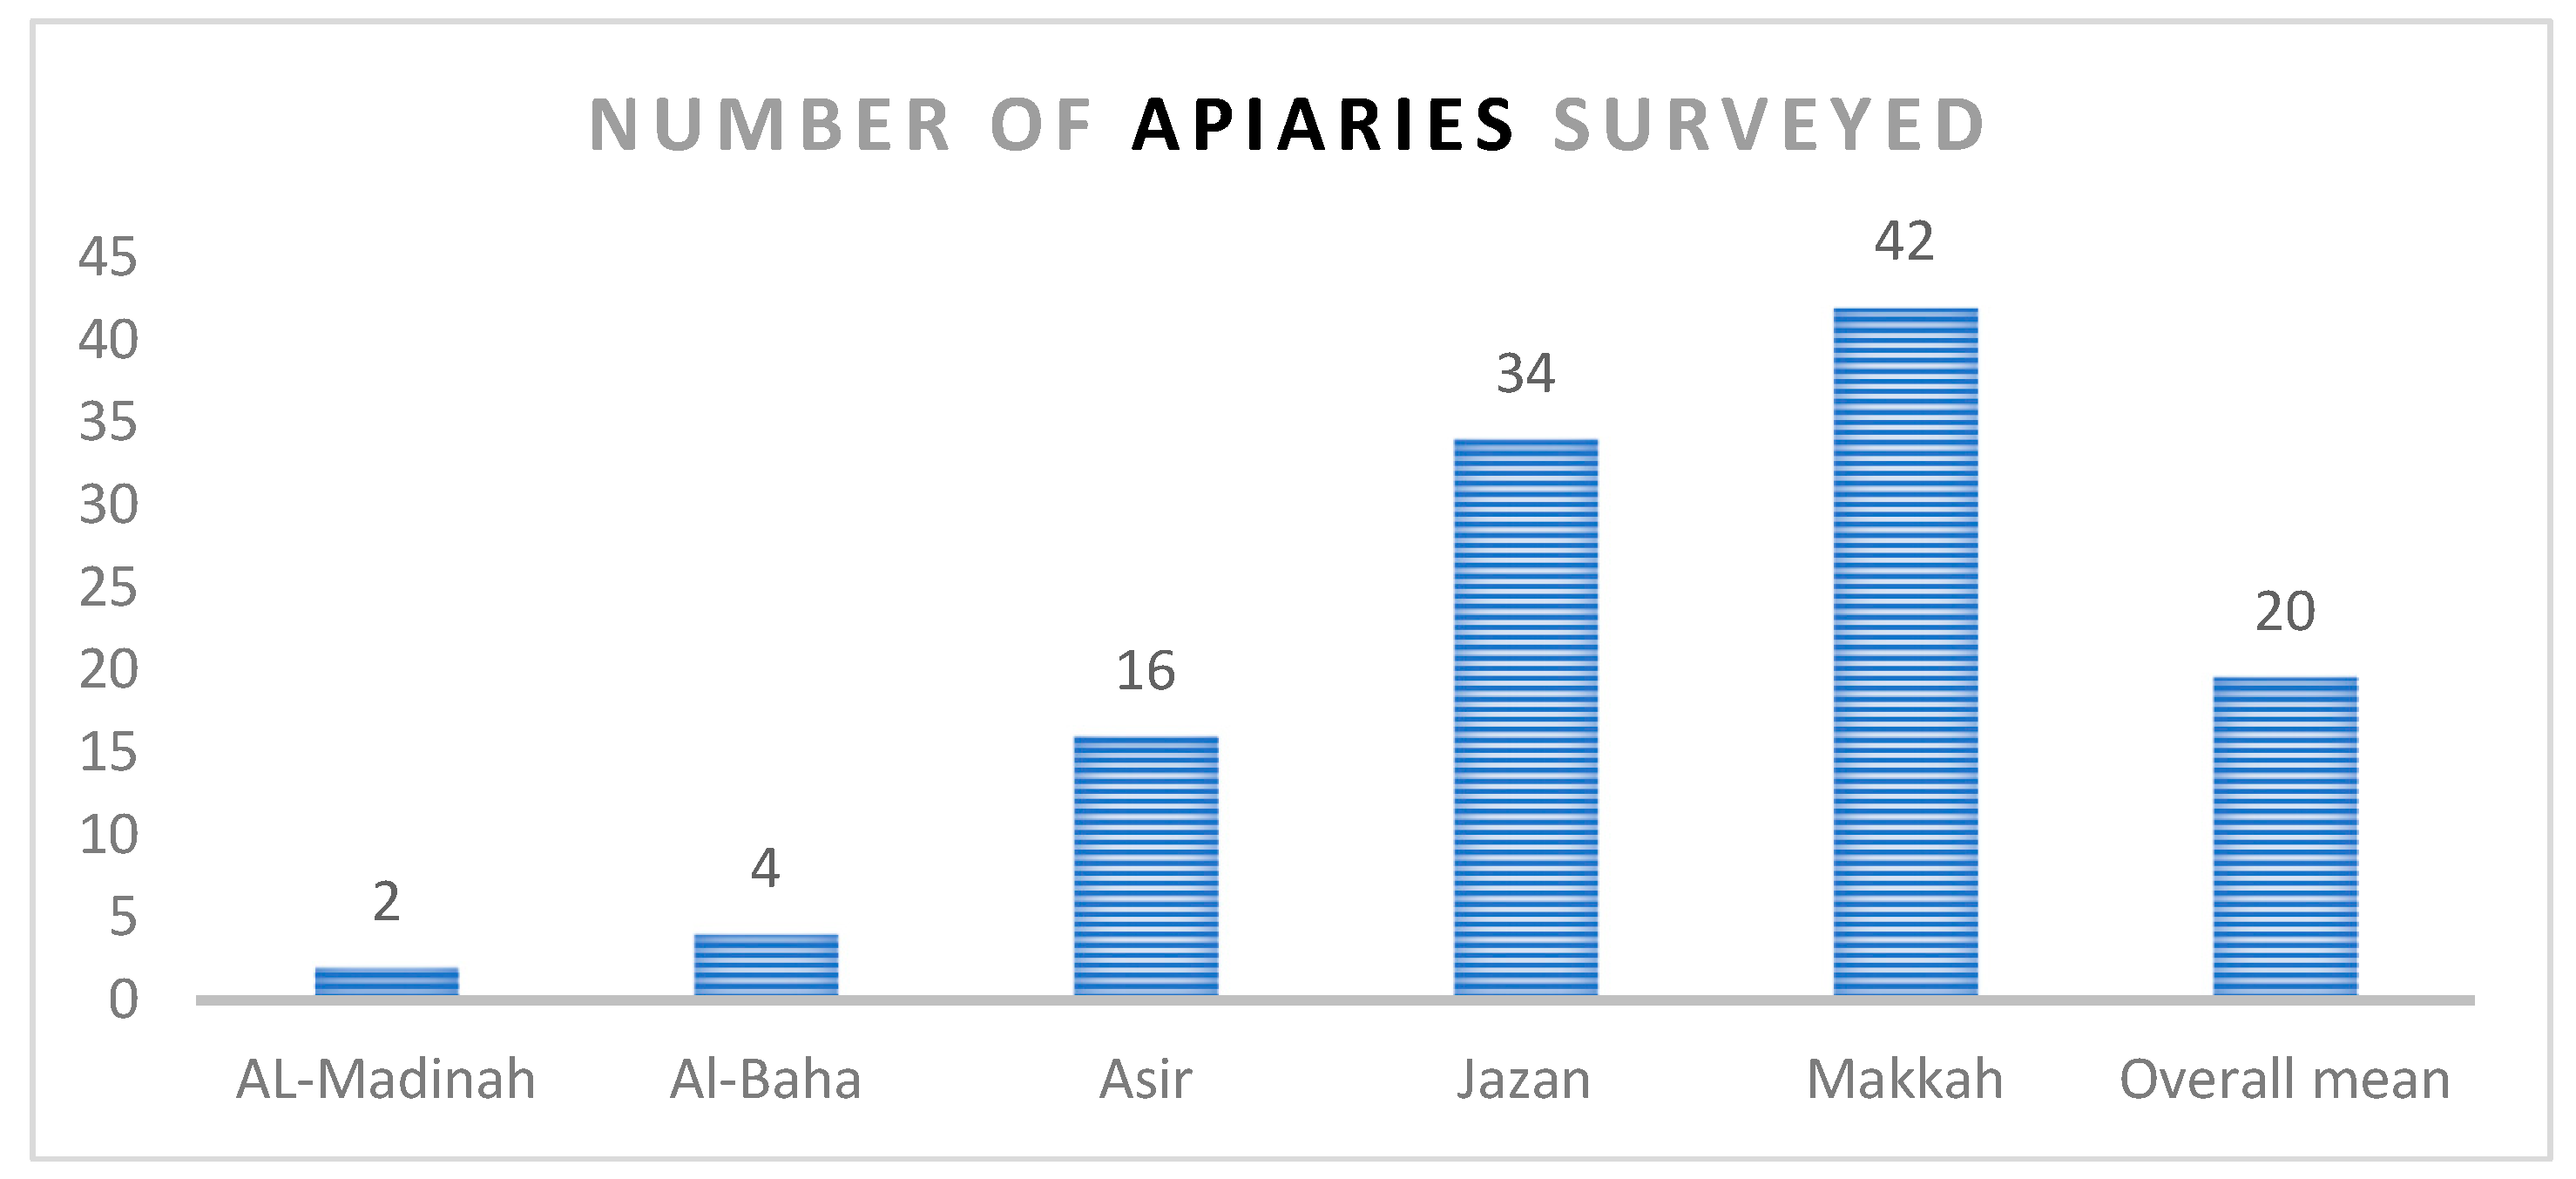

Table 1.
Number and size of traditional, modern, and total honeybee colonies across the surveyed regions.
Table 1.
Number and size of traditional, modern, and total honeybee colonies across the surveyed regions.
| Region | Number of apiaries surveyed | Mean No of colonies | Median No of colonies | Minimum No of colonies | Maximum No of colonies | |
| Traditional Colonies | Al-Madinah | 1 | 10 | 10 | 10 | 10 |
| Al-Baha | 4 | 43 | 40 | 10 | 80 | |
| Asir | 15 | 237 | 180 | 20 | 641 | |
| Jazan | 31 | 211 | 200 | 20 | 550 | |
| Makkah | 30 | 122 | 100 | 10 | 500 | |
| Overall mean | 16 | 124 | 106 | 14 | 356 | |
| Modern Colonies | Al-Madinah | 2 | 125 | 125 | 100 | 150 |
| Al-Baha | 4 | 68 | 60 | 50 | 100 | |
| Asir | 11 | 154 | 150 | 60 | 300 | |
| Jazan | 20 | 186 | 105 | 15 | 950 | |
| Makkah | 36 | 198 | 170 | 50 | 600 | |
| Overall mean | 15 | 146 | 122 | 55 | 420 | |
| Total Colonies | Al-Madinah | 2 | 130 | 130 | 110 | 150 |
| Al-Baha | 4 | 110 | 115 | 70 | 140 | |
| Asir | 16 | 328 | 275 | 80 | 641 | |
| Jazan | 34 | 302 | 228 | 80 | 1250 | |
| Makkah | 42 | 257 | 205 | 60 | 700 | |
| Overall mean | 20 | 225 | 191 | 80 | 576 |
Colony size varied substantially among the surveyed regions and between colony types. Asir and Jazan maintained the largest traditional colony populations, whereas Makkah and Jazan had the largest modern colony populations. Overall, surveyed apiaries contained an average of 124 traditional colonies, 146 modern colonies, and 225 total colonies, reflecting considerable variation in apiary size across regions. Total colonies represent the total number of honeybee colonies per apiary, including both traditional and modern colonies.
3.2. Regional Distribution of Traditional and Modern Colonies
Across all surveyed apiaries, traditional colonies represented 41.4% of the total colonies, while modern colonies accounted for 58.6%. Although the overall proportions of traditional and modern colonies were not significantly different at the national level (paired t-test, P = 0.89), significant regional differences in colony composition were ob-served (ANOVA, P < 0.001). Jazan and Asir were characterized by higher proportions of traditional colonies, whereas Makkah and Al-Madinah contained predominantly modern colonies, demonstrating distinct regional production systems.
Figure 3.
Distribution of traditional (mentioned as local in the figure) and modern honeybee colonies across the surveyed regions. Al-Madinah had the highest proportion of modern honeybee colonies, whereas traditional colonies predominated in Jazan and Asir. Across all surveyed regions, traditional and modern colonies accounted for approximately 41% and 59% of the total colony population, respectively.
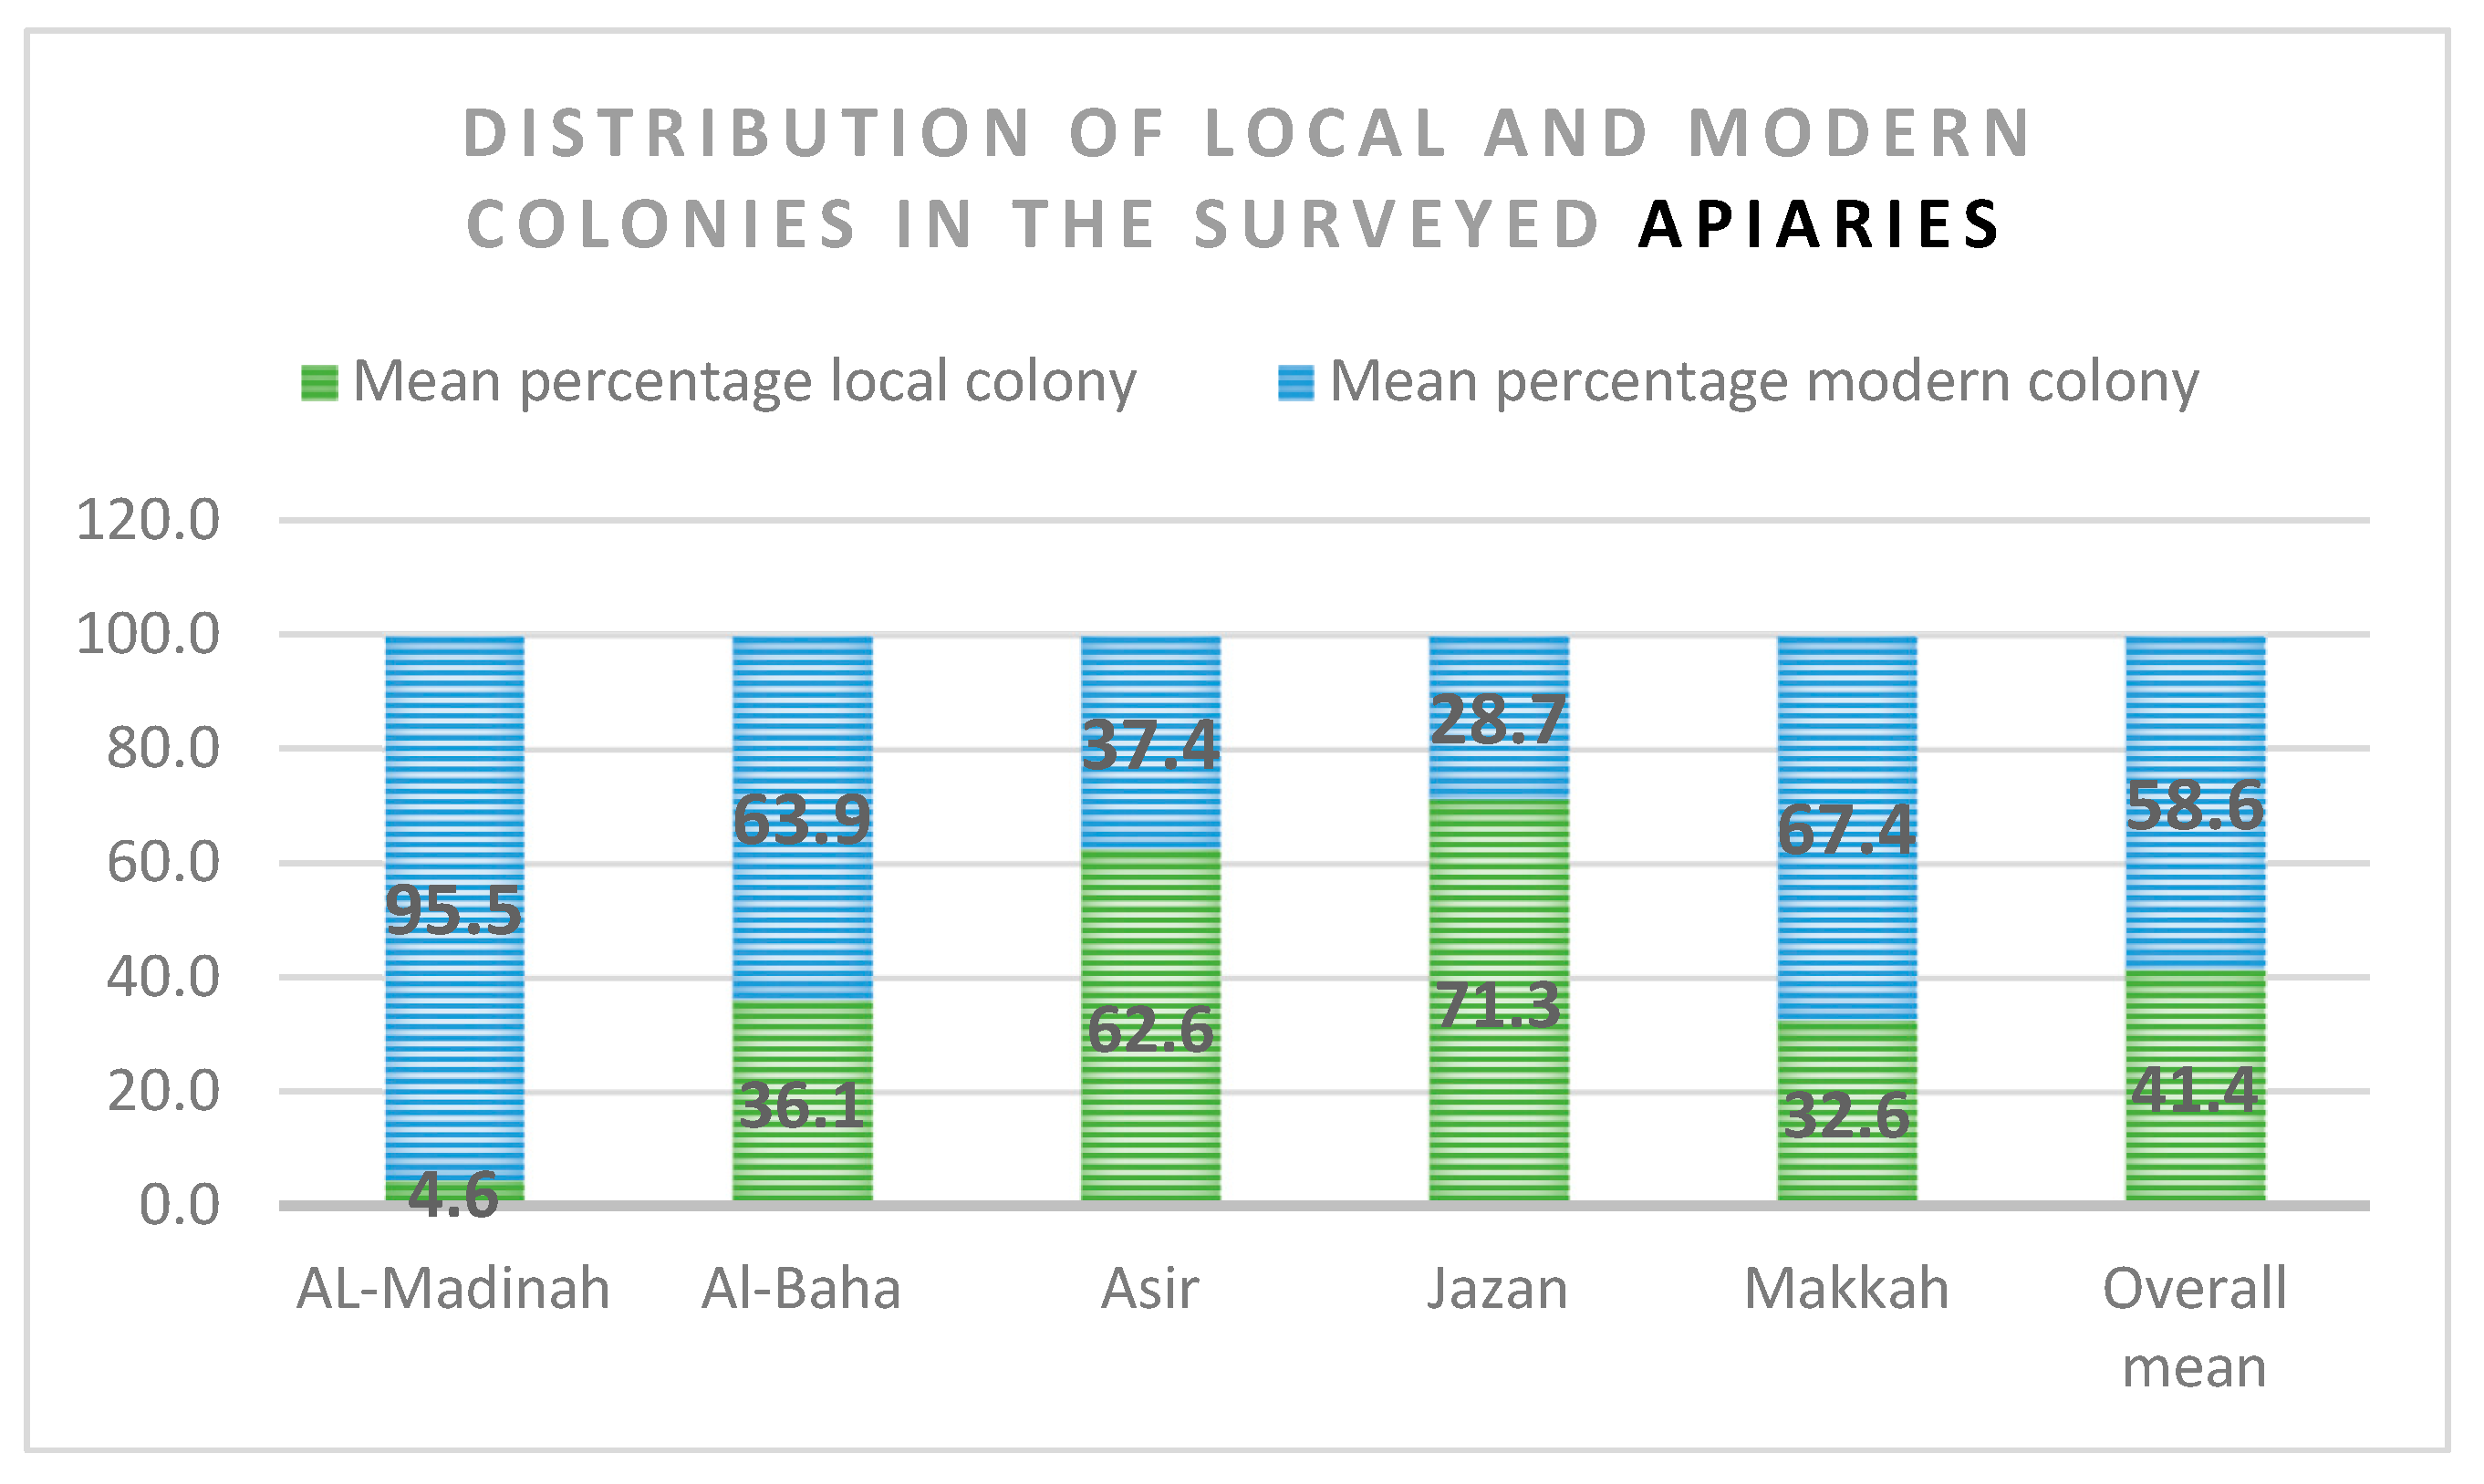
There were no significant differences between the overall proportions of traditional and modern colonies across apiaries (t = 0.130, df = 97, p = 0.896) while there were significant differences in the proportions of traditional and modern honeybee colonies across regions ((F = 18.9, p < 0.001).
Table 2.
Paired t-test comparing the proportion of traditional and modern honeybee colonies across the surveyed apiaries.
Table 2.
Paired t-test comparing the proportion of traditional and modern honeybee colonies across the surveyed apiaries.
| Paired Samples T-Test | |||||
| Statistic | df | Pp | |||
| % Traditional colony vs | % Modern Colony | Student’s t | 0.130 | 97.0 | .896 |
| Note. Hₐ μMeasure 1 - Measure 2 ≠ 0 | |||||
The result (t = 0.130, df = 97, p = 0.896) indicates no statistically significant difference between the overall proportions of traditional in the table) and modern colonies in the surveyed apiaries.
Table 3.
Welch’s one-way ANOVA comparing the proportions of traditional and modern honeybee colonies among the surveyed regions.
Table 3.
Welch’s one-way ANOVA comparing the proportions of traditional and modern honeybee colonies among the surveyed regions.
| One-Way ANOVA (Welch’s) | ||||
| F | df1 | df2 | Pp | |
| % Traditional colony | 18.9 | 4 | 10.1 | <.001 |
| % Modern colony | 18.9 | 4 | 10.1 | <.001 |
The results (F = 18.9, p < 0.001) indicate that the proportions of both traditional and modern honeybee colonies differed significantly among the surveyed regions.
The number of traditional colonies differed significantly among regions (ANOVA, P = 0.003), indicating substantial regional variation. Asir and Jazan maintained significantly larger numbers of traditional colonies than Al-Baha and Makkah. In contrast, the number of modern colonies did not differ significantly among regions (P = 0.605).
Table 4.
One-way ANOVA comparing the mean number of traditional honeybee colonies among the surveyed regions of Saudi Arabia.
Table 4.
One-way ANOVA comparing the mean number of traditional honeybee colonies among the surveyed regions of Saudi Arabia.
| ANOVA – Traditional colony | |||||
| Sum of Squares | Df | Mean Square | F | p | |
| Region | 278565 | 4 | 69641 | 4.48 | .003 |
| Residuals | 1.18e+6 | 76 | 15554 | ||
The ANOVA result (F = 4.48, p = 0.003) indicates a significant difference in the mean number of traditional honeybee colonies among the surveyed regions.
Table 5.
One-way ANOVA comparing the mean number of modern honeybee colonies among the surveyed regions of Saudi Arabia.
Table 5.
One-way ANOVA comparing the mean number of modern honeybee colonies among the surveyed regions of Saudi Arabia.
| ANOVA – Modern colony | |||||
| Sum of Squares | df | Mean Square | F | p | |
| Region | 76486 | 4 | 19122 | 0.684 | .605 |
| Residuals | 1.90e+6 | 68 | 27956 | ||
The mean number of modern honeybee colonies did not differ significantly among the surveyed regions (F = 0.684, p = 0.605). This indicates that modern colony populations were relatively similar across regions despite differences in apiary size and management practices.
3.3. Honey Production and Productivity
Seasonal Honey Production
Honey production generally increased across successive harvesting periods, particularly for traditional colonies. A significant increase in honey production was observed between the first and third harvests for traditional colonies (P = 0.029), whereas seasonal differences were not significant for modern colonies.
Figure 4.
Mean honey yield across successive harvests during the production year. Honey yield showed a gradual increasing trend from the first to the third harvest. However, the overall increase across harvests was not statistically significant.
Figure 4.
Mean honey yield across successive harvests during the production year. Honey yield showed a gradual increasing trend from the first to the third harvest. However, the overall increase across harvests was not statistically significant.
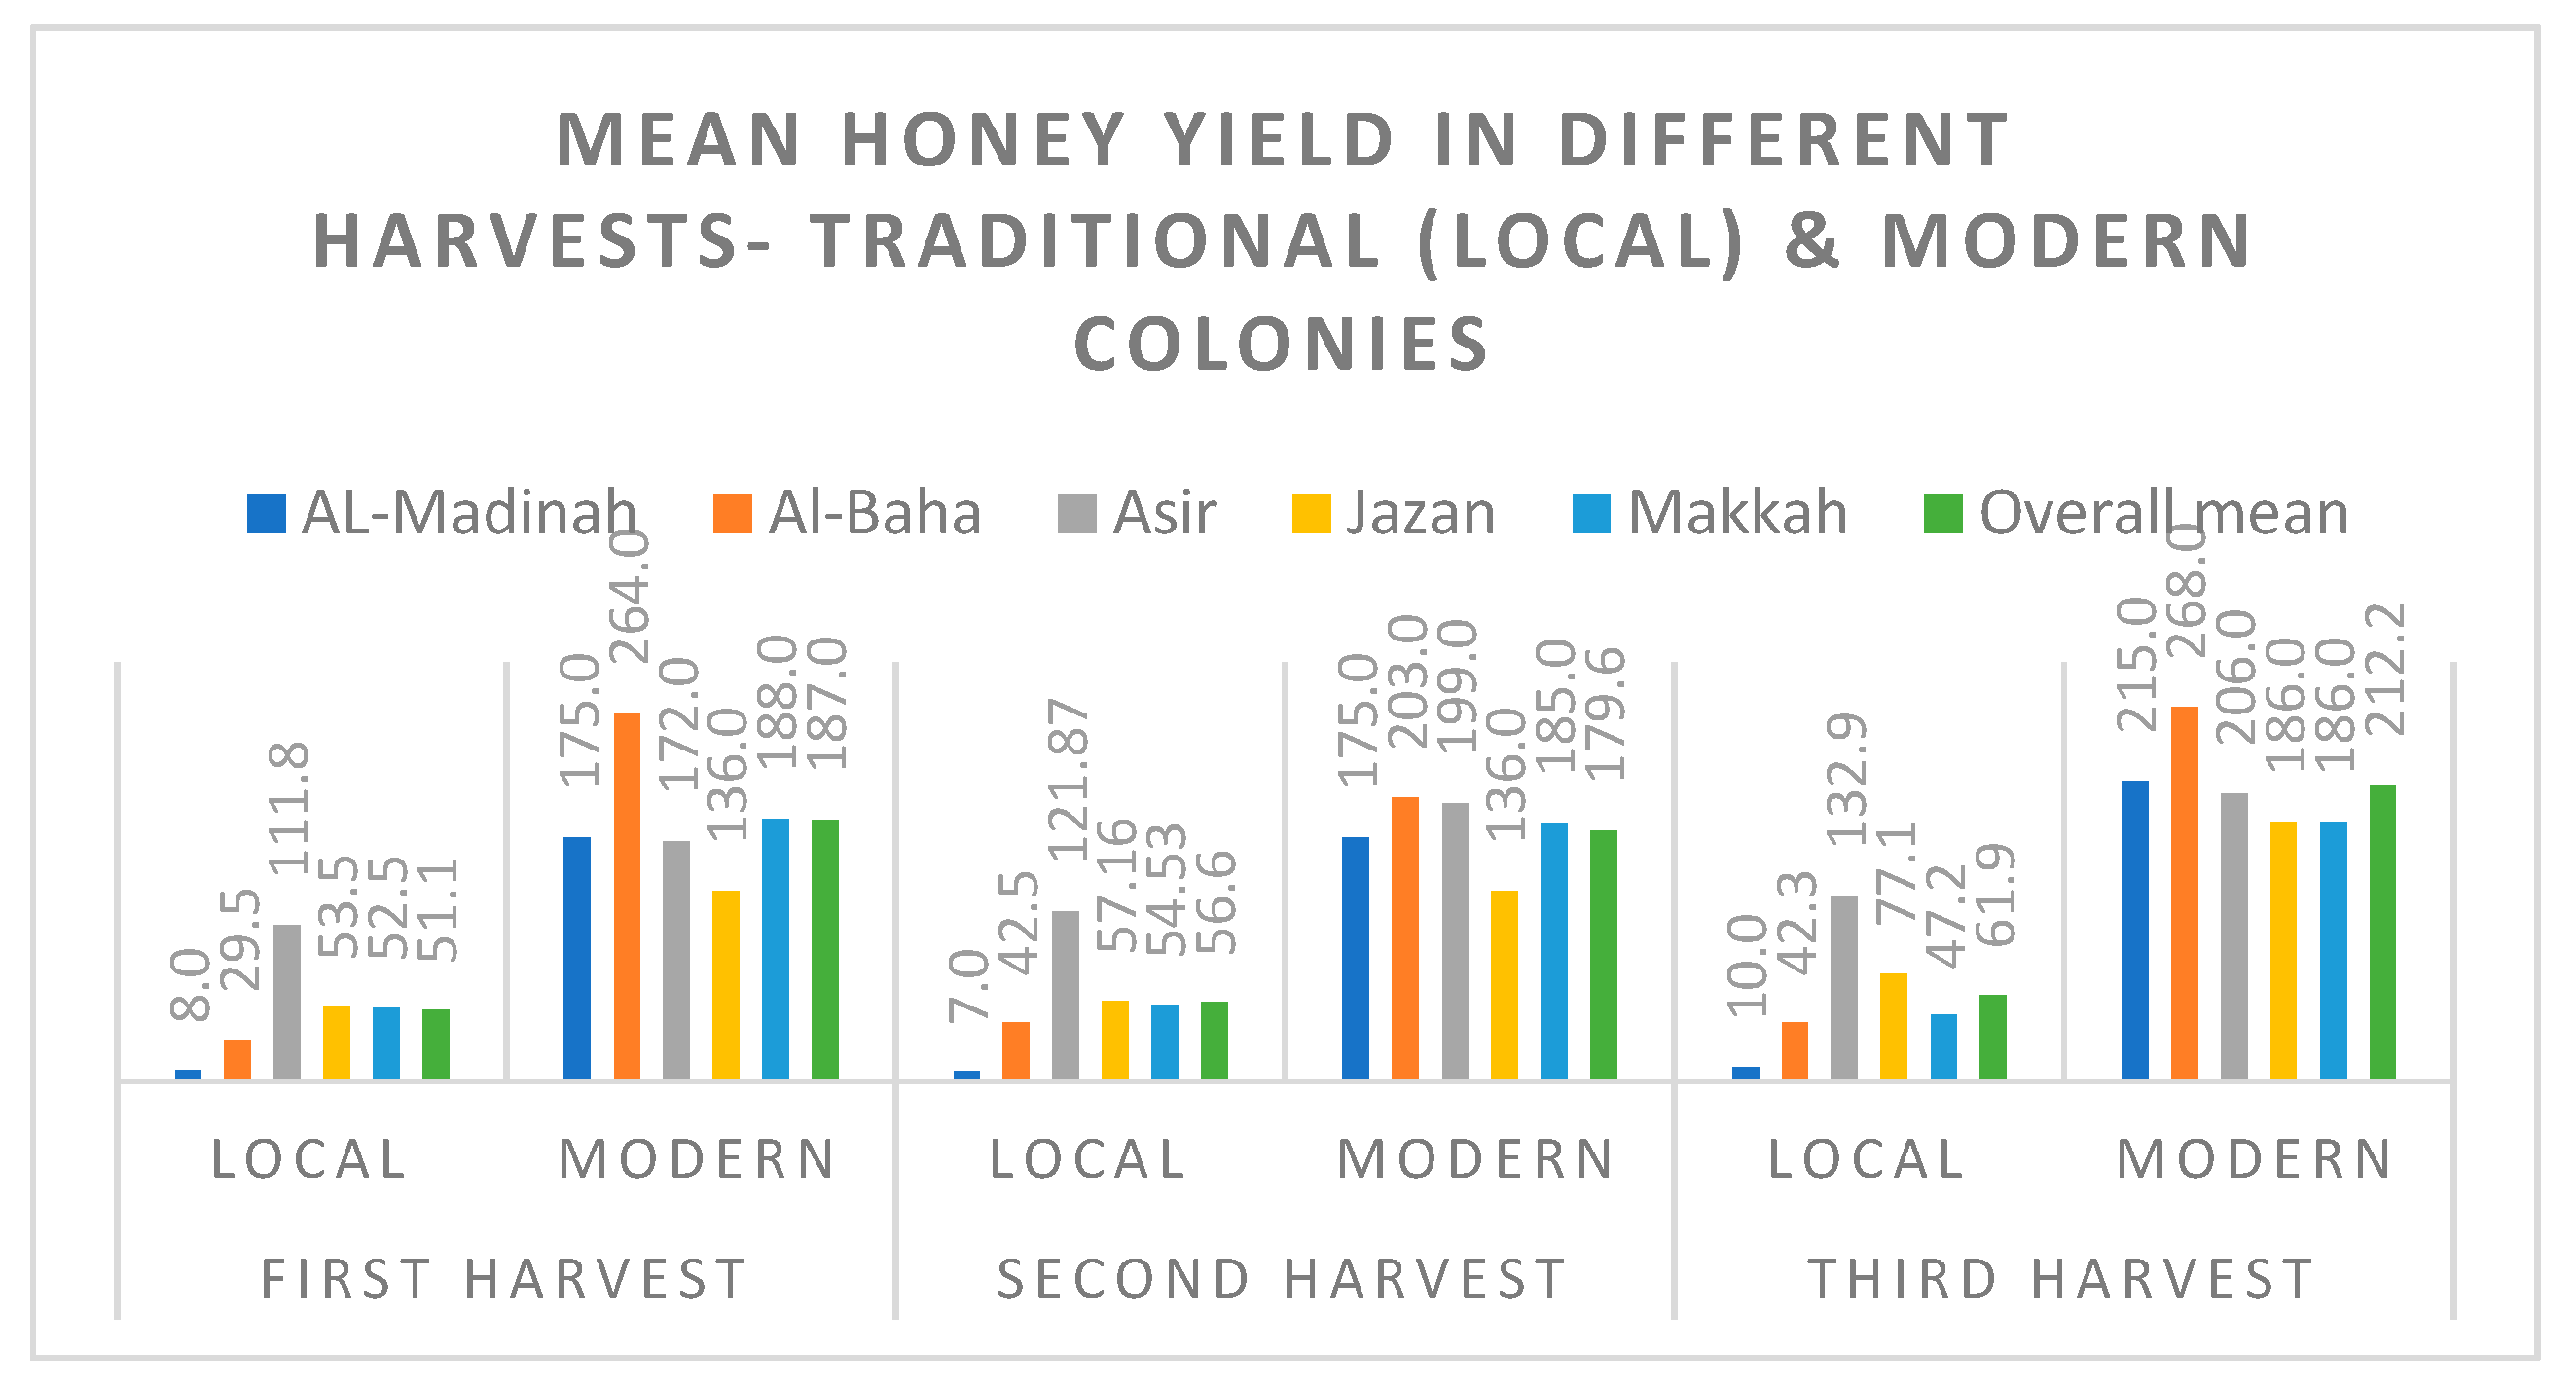
Table 6.
Pairwise comparisons of mean honey yield from traditional honeybee colonies across the first, second, and third harvests using paired t-tests.
Table 6.
Pairwise comparisons of mean honey yield from traditional honeybee colonies across the first, second, and third harvests using paired t-tests.
| Paired Samples T-Test | |||||||
| Statistic | df | p | Mean difference | SE difference | |||
| First harvest traditional | Second harvest traditional | Student’s t | -1.24 | 80.0 | .217 | -4.64 | 3.73 |
| Third harvest traditional | Student’s t | -2.23 | 80.0 | .029 | -11.64 | 5.23 | |
| Third harvest traditional | Second harvest traditional | Student’s t | 1.41 | 80.0 | .162 | 7.00 | 4.96 |
| Note. Hₐ μMeasure 1 - Measure 2 ≠ 0 | |||||||
The results indicate that honey yield increased significantly from the first to the third harvest (p = 0.029), whereas differences between the first and second harvests and between the second and third harvests were not statistically significant (p > 0.05).
Table 7.
Pairwise comparisons of mean honey yield from modern honeybee colonies across the first, second, and third harvests using paired t-tests.
Table 7.
Pairwise comparisons of mean honey yield from modern honeybee colonies across the first, second, and third harvests using paired t-tests.
| Paired Samples T-Test | |||||||
| Statistic | df | p | Mean difference | SE difference | |||
| First harvest modern | Second harvest modern | Student’s t | -0.0435 | 70.0 | .965 | -0.577 | 13.3 |
| Third harvest modern | Student’s t | -1.1781 | 70.0 | .243 | -21.662 | 18.4 | |
| Third harvest modern | Second harvest modern | Student’s t | 1.5772 | 72.0 | .119 | 19.959 | 12.7 |
| Note. Hₐ μMeasure 1 - Measure 2 ≠ 0 | |||||||
No statistically significant differences were observed in mean honey yield among the first, second, and third harvests for modern honeybee colonies (p > 0.05 for all pairwise comparisons), indicating relatively stable production across harvest periods.
Annual Honey Production
Modern colonies consistently produced substantially higher annual honey yields than traditional colonies. The paired t-test demonstrated that annual honey production from modern colonies was significantly greater than that from traditional colonies (P < 0.001). Two-way ANOVA further showed that colony type had a highly significant effect on annual honey production (P < 0.001), whereas neither geographical region nor the interaction between colony type and region significantly affected total honey production.
Figure 5.
Annual mean honey yield per apiary across the surveyed regions. The annual yield varied considerably among the surveyed regions. Al-Baha (798 kg) recorded the highest total annual honey production per farm (741 kg), followed by Asir (741 kg), whereas Jazan had the lowest total production (434 kg). In all regions, modern colonies consistently produced substantially higher honey yields than traditional colonies.
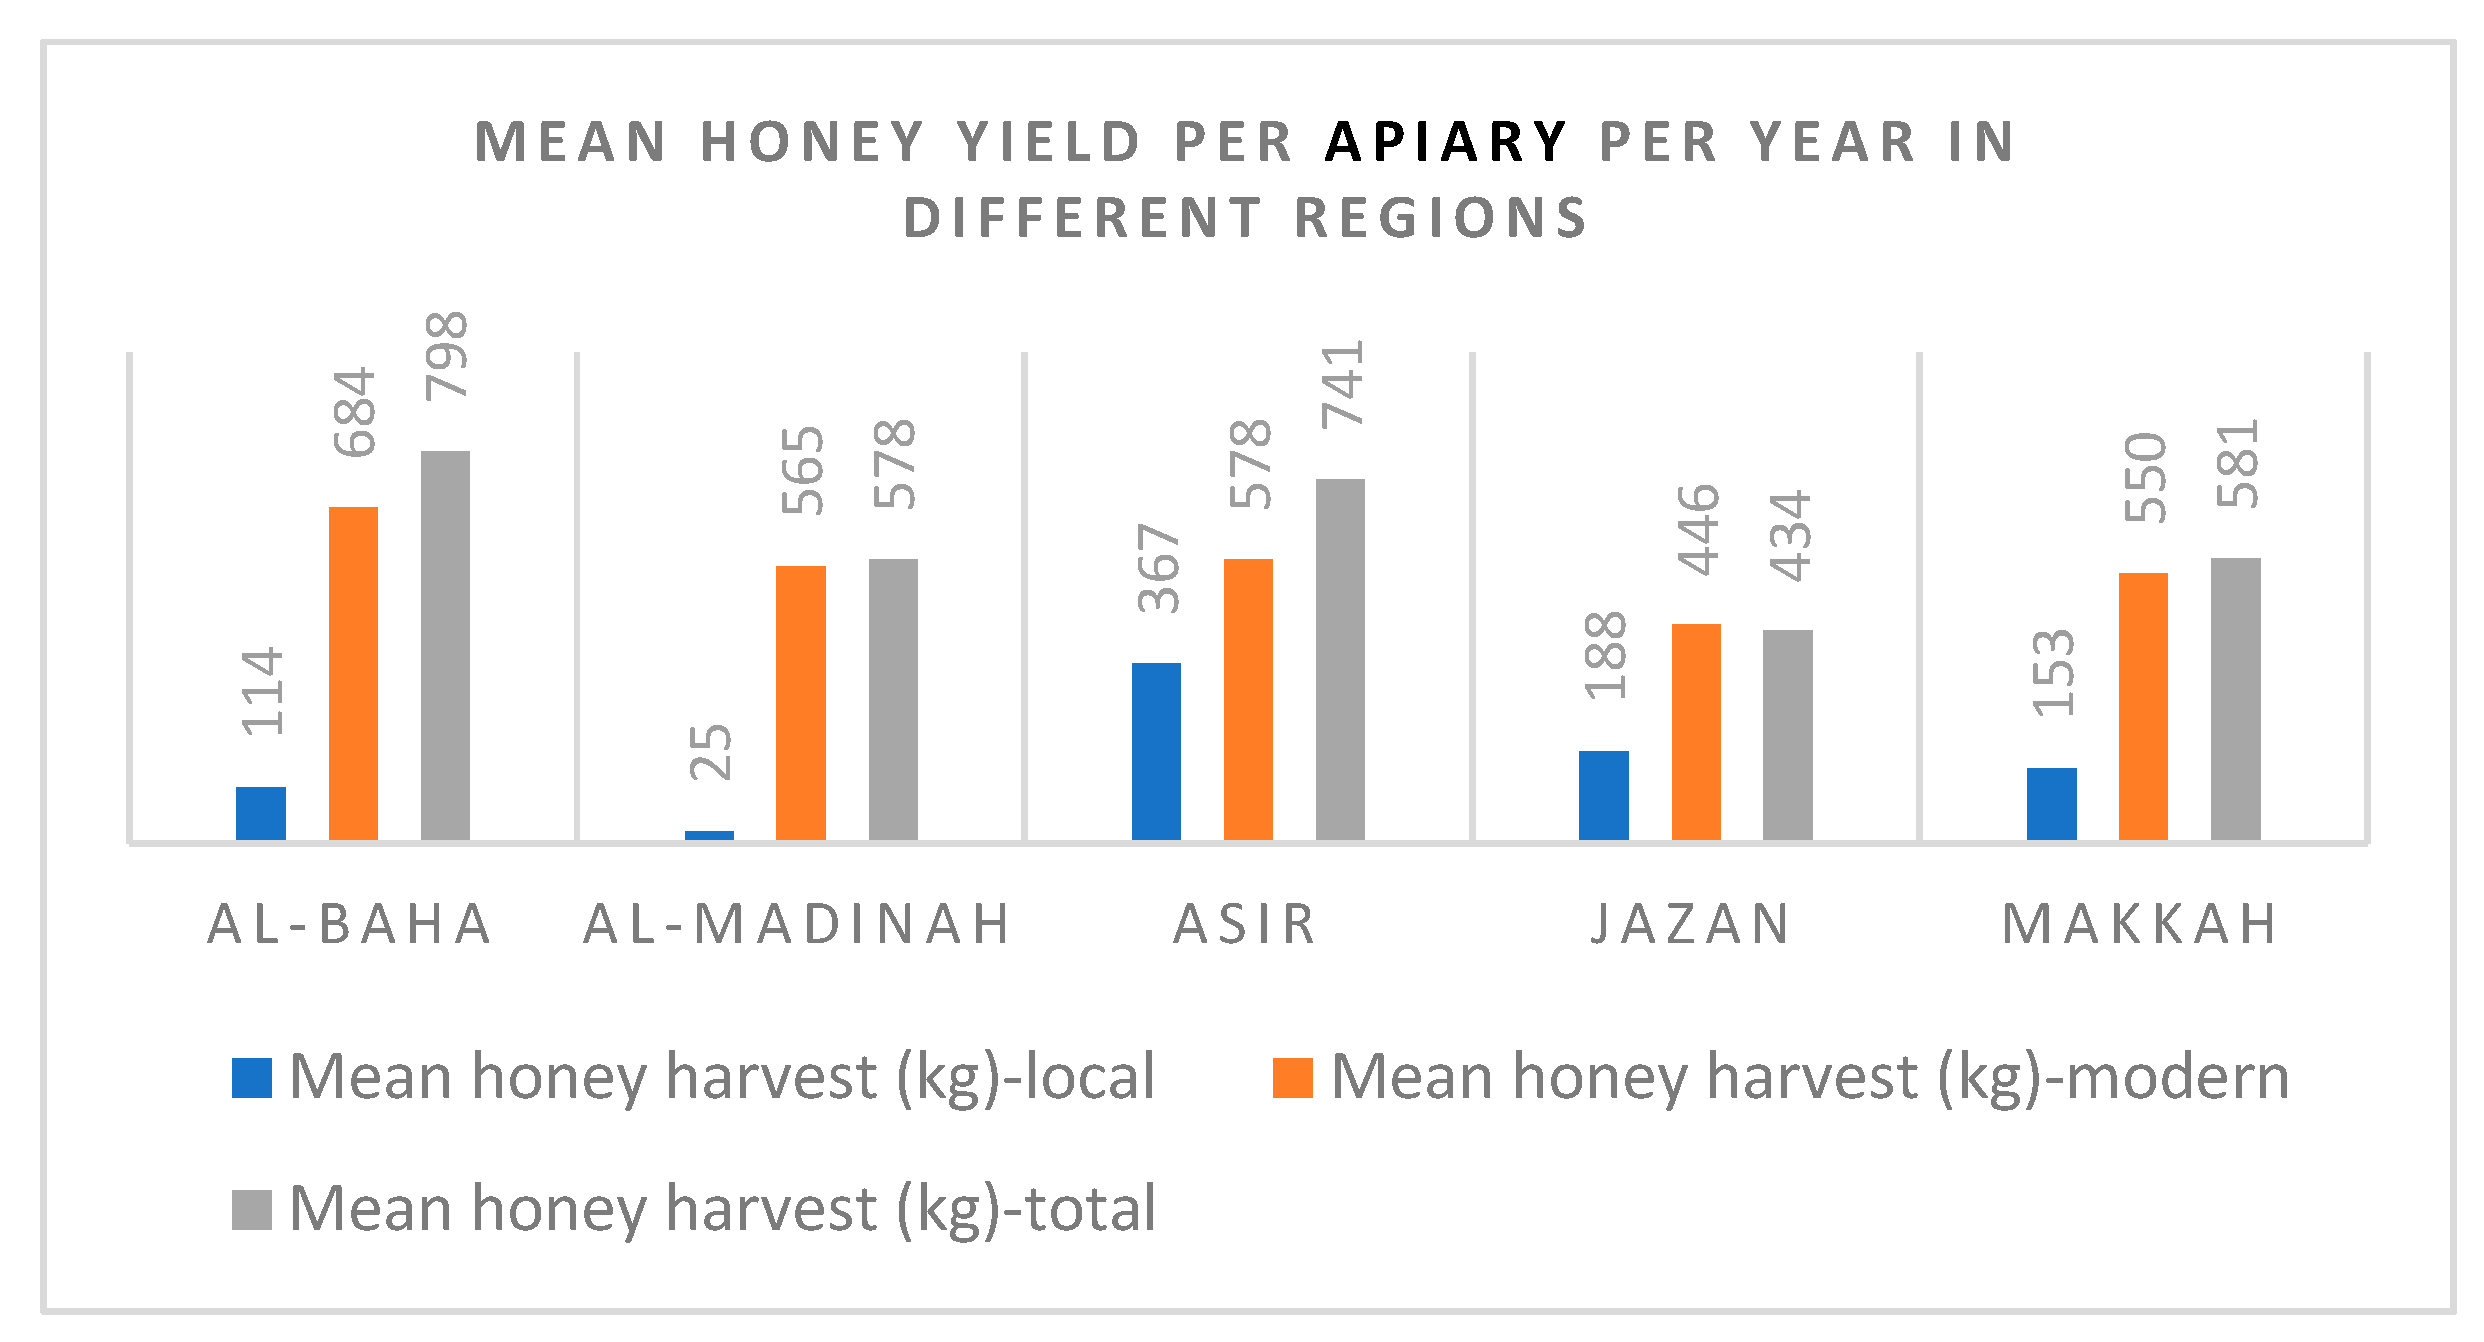
Table 8.
Paired t-test comparing total annual honey yield between traditional and modern honeybee colonies.
Table 8.
Paired t-test comparing total annual honey yield between traditional and modern honeybee colonies.
| Paired Samples T-Test | |||||||
| statistic | df | P | Mean difference | SE difference | |||
| Total harvest traditional | Total harvest modern | Student’s t | -5.77 | 55.0 | <.001 | -360 | 62.3 |
| Note. Hₐ μMeasure 1 - Measure 2 ≠ 0 | |||||||
Modern honeybee colonies produced a significantly higher total annual honey yield than traditional colonies (t = −5.77, df = 55, p < 0.001), with a mean difference of 360 kg per farm. This result indicates a substantially greater productivity of modern colonies under the surveyed production systems.
Table 9.
Two-way analysis of variance (ANOVA) evaluating the effects of colony type, region, and their interaction on total annual honey yield.
Table 9.
Two-way analysis of variance (ANOVA) evaluating the effects of colony type, region, and their interaction on total annual honey yield.
| Analysis of Variance Table | Response: Total yield | |||||
| df | Sum Sq | Mean Sq | F value | Pr(>F) | Sig | |
| Colony type | 1 | 4210289 | 4210289 | 34.8933 | 2.40E-08 | *** |
| Region | 4 | 454518 | 113629 | 0.9417 | 0.4417 | |
| Colony type: Region | 4 | 369323 | 92331 | 0.7652 | 0.5495 | |
| Residuals | 144 | 17375281 | 120662 | |||
| Signif. codes: 0 ‘***’ 0.001 ‘**’ 0.01 ‘*’ 0.05 ‘.’ 0.1 ‘ ’ 1 | ||||||
Colony type had a highly significant effect on total annual honey yield (F = 34.89, p < 0.001), whereas neither region (p = 0.442) nor the interaction between colony type and region (p = 0.550) significantly influenced total yield. These results indicate that differences in honey production were primarily attributable to colony type rather than geographic region or colony type × region interactions.
Honey Yield per Colony
Average honey yield per colony was 1.38 kg for traditional colonies managed with indigenous bee, 3.73 kg for modern colonies bred with imported bee, and 2.43 kg when both colony types were combined. Modern colonies produced significantly more honey per colony than traditional colonies (paired t-test, P < 0.001). Significant regional variation was also observed for traditional, modern, and combined colony yields (ANOVA, P < 0.001)
Table 10.
Descriptive statistics of honey yield per colony for traditional, modern, and combined honeybee colonies.
Table 10.
Descriptive statistics of honey yield per colony for traditional, modern, and combined honeybee colonies.
| Descriptives | ||||||
| No of farms | Mean | Median | SD | Minimum | Maximum | |
| Yield per colony (kg) -traditional | 78 | 1.38 | 1.15 | 0.869 | 0.100 | 6.20 |
| Yield per colony (kg)-modern | 73 | 3.73 | 2.66 | 3.220 | 0.000 | 16.00 |
| Yield per colony (kg) -combined | 98 | 2.43 | 1.80 | 2.443 | 0.000 | 16.30 |
Modern honeybee colonies recorded the highest mean honey yield per colony (3.73 kg), followed by the combined colony population (2.43 kg), while traditional colonies produced the lowest mean yield (1.38 kg), indicating substantially greater productivity of modern colonies under the surveyed production systems.
Table 11.
Paired t-test comparing honey yield per colony between traditional and modern honeybee colonies.
Table 11.
Paired t-test comparing honey yield per colony between traditional and modern honeybee colonies.
| Paired Samples T-Test | |||||||
| Statistic | df | p | Mean difference | SE difference | |||
| Yield per colony traditional | Yield per colony modern | Student’s t | -6.75 | 53.0 | <.001 | -2.43 | 0.360 |
| Note. Hₐ μMeasure 1 - Measure 2 ≠ 0 | |||||||
Modern honeybee colonies produced a significantly higher honey yield per colony than traditional colonies (t = −6.75, df = 53, p < 0.001). The mean difference of 2.43 kg per colony indicates that modern colonies substantially outperformed traditional colonies under the surveyed production conditions.
Table 12.
Descriptive statistics of honey yield per colony by colony type across the surveyed regions.
Table 12.
Descriptive statistics of honey yield per colony by colony type across the surveyed regions.
| Descriptive Statistics | |||||||
| Region | No of farms | Mean | Median | SD | Minimum | Maximum | |
| Yield per colony (kg) -traditional | Al-Madinah | 1 | 2.50 | 2.50 | - | 2.500 | 2.50 |
| Al-Baha | 4 | 2.98 | 2.45 | 2.330 | 0.800 | 6.20 | |
| Asir | 14 | 1.58 | 1.60 | 0.769 | 0.100 | 2.70 | |
| Jazan | 29 | 1.08 | 1.00 | 0.514 | 0.400 | 2.60 | |
| Makkah | 30 | 1.32 | 1.25 | 0.647 | 0.500 | 3.80 | |
| Yield per colony (kg)-modern | Al-Madinah | 2 | 5.10 | 5.10 | 4.384 | 2.000 | 8.20 |
| Al-Baha | 4 | 10.22 | 11.75 | 6.614 | 1.600 | 15.80 | |
| Asir | 11 | 3.60 | 3.00 | 2.161 | 1.580 | 8.93 | |
| Jazan | 20 | 3.30 | 2.79 | 1.992 | 0.000 | 9.60 | |
| Makkah | 36 | 3.21 | 2.40 | 2.867 | 1.100 | 16.00 | |
| Yield per colony (kg) -combined | Al-Madinah | 2 | 4.90 | 4.90 | 3.960 | 2.100 | 7.70 |
| Al-Baha | 4 | 7.30 | 7.75 | 5.266 | 1.100 | 12.60 | |
| Asir | 16 | 2.10 | 1.85 | 1.135 | 0.600 | 4.80 | |
| Jazan | 34 | 1.50 | 1.30 | 0.899 | 0.000 | 5.00 | |
| Makkah | 42 | 2.74 | 2.10 | 2.670 | 0.700 | 16.30 | |
Honey yield per colony varied considerably among regions and colony types. Al-Baha recorded the highest mean yield for both traditional (2.98 kg) and modern (10.22 kg) colonies, while modern colonies consistently produced higher yields than traditional colonies across all surveyed regions.
Figure 6, Figure 7 and Figure 8 (boxplots) show clear regional differences in honey yield per colony for traditional, modern, and combined colony types. Al-Baha consistently recorded the highest median yields and the greatest variability, particularly for modern colonies, whereas Jazan and Makkah generally showed lower median yields. Several high-yield outliers were observed, especially in Makkah and Jazan, indicating that a small number of apiaries achieved substantially better performance than the regional average. Overall, modern colonies produced higher yields than traditional colonies across most regions, while combined yield patterns reflected both colony composition and regional management conditions.
Table 13.
One-way ANOVA comparing honey yield per colony (combined) among the surveyed regions.
| Analysis of Variance Table | Response: Yield per colony all (combined) | |||||
| Df | Sum Sq | Mean Sq | F- value | Pr(>F) | Sig. | |
| Region | 4 | 142 | 35.49 | 7.55 | 2.60E-05 | *** |
| Residuals | 93 | 437.1 | 4.7 | |||
| Signif. codes: 0 ‘***’ 0.001 ‘**’ 0.01 ‘*’ 0.05 ‘.’ 0.1 ‘ ’ 1 | ||||||
Mean combined honey yield per colony differed significantly among the surveyed regions (F = 7.55, p < 0.001), indicating that regional factors such as climate, forage availability, and management practices significantly influenced colony productivity.
Table 14.
One-way ANOVA comparing honey yield per colony of traditional honeybee colonies among the surveyed regions.
Table 14.
One-way ANOVA comparing honey yield per colony of traditional honeybee colonies among the surveyed regions.
| Analysis of Variance Table | Response: Yield per colony - traditional | |||||
| Df | Sum Sq | Mean Sq | F-value | Pr(>F) | Sig. | |
| Region | 4 | 14.64 | 3.66 | 6.139 | 0.000258 | *** |
| Residuals | 73 | 43.53 | 0.596 | |||
| Signif. codes: 0 ‘***’ 0.001 ‘**’ 0.01 ‘*’ 0.05 ‘.’ 0.1 ‘ ’ 1 | ||||||
Mean honey yield per traditional colony differed significantly among the surveyed regions (F = 6.14, p < 0.001), indicating that regional factors such as environmental conditions, forage availability, and management practices significantly influenced the productivity of indigenous honeybee colonies.
Table 15.
One-way ANOVA comparing honey yield per colony of modern honeybee colonies among the surveyed regions.
Table 15.
One-way ANOVA comparing honey yield per colony of modern honeybee colonies among the surveyed regions.
| Analysis of Variance Table | Response: Yield per colony – modern | |||||
| Df | Sum Sq | Mean Sq | F-value | Pr(>F) | Significance | |
| Region | 4 | 186 | 46.5 | 5.644 | 0.000554 | *** |
| Residuals | 68 | 560.3 | 8.24 | |||
| Signif. codes: 0 ‘***’ 0.001 ‘**’ 0.01 ‘*’ 0.05 ‘.’ 0.1 ‘ ’ 1 | ||||||
Mean honey yield per modern colony differed significantly among the surveyed regions (F = 5.64, p < 0.001), indicating that regional differences in environmental conditions, forage resources, and management practices significantly affected the productivity of modern honeybee colonies.
3.4. Factors Influencing Honey Yield
Multiple linear regression analysis identified colony composition as the primary factor influencing honey yield. The regression model explained approximately 26.5% of the variation in overall honey yield (R² = 0.265). Apiaries with a higher proportion of modern colonies tended to produce greater honey yields, whereas increasing disease prevalence showed no statistically significant effect after adjusting for region and colony composition. Region remained an important predictor, with apiaries in Jazan producing significantly lower honey yields than those in the reference region. These findings indicate that colony composition and regional environmental conditions have greater influence on productivity than disease prevalence alone.
Table 16.
Multiple linear regression model (Model 1) identifying factors associated with honey yield per colony using the proportion of modern honeybee colonies as one of the predictors. Model-1: Yield Per Colony all ~Region + Total colony + % modern colony +Varroa disease % + Nosema disease %
Table 16.
Multiple linear regression model (Model 1) identifying factors associated with honey yield per colony using the proportion of modern honeybee colonies as one of the predictors. Model-1: Yield Per Colony all ~Region + Total colony + % modern colony +Varroa disease % + Nosema disease %
| Coefficients: | |||||
| Estimate | Std. Error | t value | Pr(>|t|) | Sig. | |
| Intercept | 6.404822 | 1.127197 | 5.682 | 1.66E-07 | *** |
| Region Al-Madinah | -3.181466 | 1.813971 | -1.754 | 0.082895 | |
| Region Asir | -4.381682 | 1.199778 | -3.652 | 0.000439 | *** |
| Region Jazan | -4.963544 | 1.164333 | -4.263 | 5.01E-05 | *** |
| Region Makkah | -4.344461 | 1.094195 | -3.97 | 0.000145 | *** |
| Total colony | -0.001561 | 0.001135 | -1.376 | 0.172351 | |
| Percent modern colony | 0.019692 | 0.006468 | 3.045 | 0.003065 | ** |
| Varroa disease percentage | -0.008315 | 0.006476 | -1.284 | 0.202497 | |
| Nosema disease percentage | 0.002926 | 0.005899 | 0.496 | 0.621082 | |
| Signif. codes: 0 ‘***’ 0.001 ‘**’ 0.01 ‘*’ 0.05 ‘.’ 0.1 ‘ ’ 1 | |||||
- Residual standard error: 2.065 on 89 degrees of freedom
- Multiple R-squared: 0.3446, Adjusted R-squared: 0.2857
- F-statistic: 5.85 on 8 and 89 DF, p-value: 5.309e-06
Model 1 explained 34.5% of the variation in honey yield per colony (R² = 0.345; Adjusted R² = 0.286) and was statistically significant (F = 5.85, p < 0.001). Region and the percentage of modern colonies were significant predictors of honey yield, whereas total colony size, Varroa prevalence, and Nosema prevalence were not significantly associated with productivity after adjustment for other variables.
Table 17.
Multiple linear regression model (Model 2) identifying factors associated with honey yield per colony using the proportion of traditional honeybee colonies as one of the predictors. Model 2: Yield Per Colony all ~Region + Total colony + % traditional colony +Varroa disease % + Nosema disease %
| Coefficients: | |||||
| Estimate | Std. Error | t value | Pr(>|t|) | Sig | |
| Intercept | 8.374013 | 1.086671 | 7.706 | 1.73E-11 | *** |
| Region Al-Madinah | -3.181466 | 1.813971 | -1.754 | 0.082895 | . |
| Region Asir | -4.381682 | 1.199778 | -3.652 | 0.000439 | *** |
| Region Jazan | -4.963544 | 1.164333 | -4.263 | 5.01E-05 | *** |
| Region Makkah | -4.344461 | 1.094195 | -3.97 | 0.000145 | *** |
| Total colony | -0.001561 | 0.001135 | -1.376 | 0.172351 | |
| Percent traditional colony | -0.019692 | 0.006468 | -3.045 | 0.003065 | ** |
| Varroa disease percentage | -0.008315 | 0.006476 | -1.284 | 0.202497 | |
| Nosema disease percentage | 0.002926 | 0.005899 | 0.496 | 0.621082 | |
| Signif. codes: 0 ‘***’ 0.001 ‘**’ 0.01 ‘*’ 0.05 ‘.’ 0.1 ‘ ’ 1 | |||||
- Residual standard error: 2.065 on 89 degrees of freedom
- Multiple R-squared: 0.3446, Adjusted R-squared: 0.2857
- F-statistic: 5.85 on 8 and 89 DF, p-value: 5.309e-06
Model 2 explained 34.5% of the variation in honey yield per colony (R² = 0.345; Adjusted R² = 0.286) and was statistically significant (F = 5.85, p < 0.001). Region and the percentage of traditional colonies were significant predictors of honey yield, with a higher proportion of traditional colonies being associated with lower productivity (β = −0.0197, p = 0.003). In contrast, total colony size, Varroa prevalence, and Nosema prevalence were not significant predictors after accounting for regional differences and colony composition.
3.5. Prevalence of Major Honeybee Diseases
Varroosis and Nosemosis (the species not differentiated) were the two principal diseases identified in the surveyed apiaries. Mean Varroa prevalence was approximately 30%, while mean Nosema prevalence averaged 33% across all apiaries. Varroa infestation did not differ significantly among regions, indicating widespread distribution throughout the Kingdom. In contrast, Nosema prevalence exhibited significant regional variation, with Jazan recording the highest levels of infection.
Table 18.
Summary statistics of Varroa and Nosema disease prevalence across surveyed apiaries.
| Descriptives | ||||||
| No. of farms | Mean | Median | SD | Minimum | Maximum | |
| Varroa disease percentage | 98 | 29.8 | 30.0 | 34.0 | 0 | 100 |
| Nosema disease percentage | 98 | 33.2 | 15.0 | 41.3 | 0 | 100 |
Across the 98 surveyed apiaries, Varroa and Nosema showed considerable variability in prevalence, ranging from 0% to 100%. The mean prevalence was 29.8% for Varroa and 33.2% for Nosema, indicating that both diseases are widespread but unevenly distributed among apiaries.
Figure 9 and Figure 10 (boxplots) - The boxplots indicate substantial variation in the incidence of Varroa and Nosema among the surveyed apiaries. Varroa infestation showed a median prevalence of approximately 30%, with values ranging from 0% to 100%, indicating that while many apiaries experienced moderate infestation levels, some were severely affected. In contrast, Nosema exhibited a lower median prevalence (approximately 10–15%) but a wider distribution, with several apiaries recording very high infection levels, resulting in a higher mean than the median. The broad range observed for both diseases highlights considerable heterogeneity in disease occurrence across apiaries and emphasizes the need for strengthened surveillance, improved biosecurity, and targeted disease management strategies.
Table 19.
Regional descriptive statistics of Varroa and Nosema prevalence in the surveyed apiaries.
| Descriptives | |||||||
| Region | No. of farms | Mean | Median | SD | Minimum | Maximum | |
| Varroa disease percentage | AL-Madinah | 2 | 0.0 | 0.0 | 0.0 | 0 | 0 |
| Al-Baha | 4 | 30.0 | 35.0 | 21.6 | 0 | 50 | |
| Asir | 16 | 31.3 | 0.0 | 44.4 | 0 | 100 | |
| Jazan | 34 | 23.5 | 0.0 | 43.1 | 0 | 100 | |
| Makkah | 42 | 35.7 | 40.0 | 19.3 | 0 | 70 | |
| Nosema disease percentage | AL-Madinah | 2 | 0.0 | 0.0 | 0.0 | 0 | 0 |
| Al-Baha | 4 | 20.0 | 25.0 | 14.1 | 0 | 30 | |
| Asir | 16 | 38.1 | 0.0 | 49.6 | 0 | 100 | |
| Jazan | 34 | 55.6 | 100.0 | 50.2 | 0 | 100 | |
| Makkah | 42 | 16.0 | 10.0 | 17.1 | 0 | 50 | |
Disease prevalence varied markedly among regions. Nosema prevalence was highest in Jazan, while Varroa prevalence was highest in Makkah; no cases of either disease were reported in the two surveyed apiaries from Al-Madinah.
Table 20.
Analysis of variance for Varroa prevalence across the surveyed regions.
| Anova table | |||||
| Df | Sum Sq | Mean Sq | F value | Pr(>F) | |
| Region | 4 | 4616 | 1154 | 0.999 | 0.412 |
| Residuals | 93 | 107380 | 1155 |
There were no significant regional differences in Varroa disease prevalence among the surveyed regions (F = 0.999, p = 0.412). This indicates that Varroa infestation was relatively widespread and occurred at comparable levels across the study regions.
Table 21.
Analysis of variance for Nosema disease prevalence across the surveyed regions.
| Anova table | |||||
| Df | Sum Sq | Mean Sq | F value | Pr(>F) | |
| Region | 4 | 32825 | 8206 | 5.76 | 0.000347 |
| Residuals | 93 | 132494 | 1425 |
Nosema prevalence differed significantly among the surveyed regions (F = 5.76, p < 0.001), indicating substantial regional variation in disease occurrence.
3.6. Major Constraints Reported by Beekeepers
Beekeepers identified a wide range of biological, management, and market-related constraints affecting the apiculture sector. The most frequently reported challenges were imported bees and associated biosecurity concerns, followed by predator attacks (particularly bee-eaters and Philanthus spp.), marketing and value-chain limitations (Table 22). Additional constraints included inadequate disease treatment services, overcrowding of apiaries during flowering seasons, weak enforcement of regulations governing migratory beekeeping, insufficient forage resources, and limited extension support (Table 22). Chi-square analyses indicated a significant association between challenge categories and the occurrence of high Varroa incidence, whereas associations with high Nosema incidence were weaker and not statistically significant. These findings highlight the importance of integrating disease management with improvements in biosecurity, governance, and market development.
Table 22.
Frequency and percentage distribution of specific challenges reported by surveyed beekeepers.
Table 22.
Frequency and percentage distribution of specific challenges reported by surveyed beekeepers.
| Specific challenges | Counts | % of Total |
| Apiary crowding in one place | 1 | 1.6% |
| Apiary close proximity - disease_ risk | 2 | 3.2% |
| Bee eater problem | 5 | 8.1% |
| Bee product marketing constraint | 4 | 6.5% |
| Poor Disease control system | 1 | 1.6% |
| Feeding timing issue | 1 | 1.6% |
| Forage scarcity | 1 | 1.6% |
| High cost of transport | 1 | 1.6% |
| Honey bee marketing constraint | 3 | 4.8% |
| Honey marketing constraint | 5 | 8.1% |
| Imported bee concern | 16 | 25.8% |
| Lack of group treatment facility | 2 | 3.2% |
| No bee protection regulation | 1 | 1.6% |
| Philanthus problem | 9 | 14.5% |
| Poor regulation enforcement | 1 | 1.6% |
| Poor treatment compliance | 3 | 4.8% |
| Seasonal apiary crowding | 3 | 4.8% |
| Transport constraint | 1 | 1.6% |
| Treatment support gap | 1 | 1.6% |
| Weak apiary regulation | 1 | 1.6% |
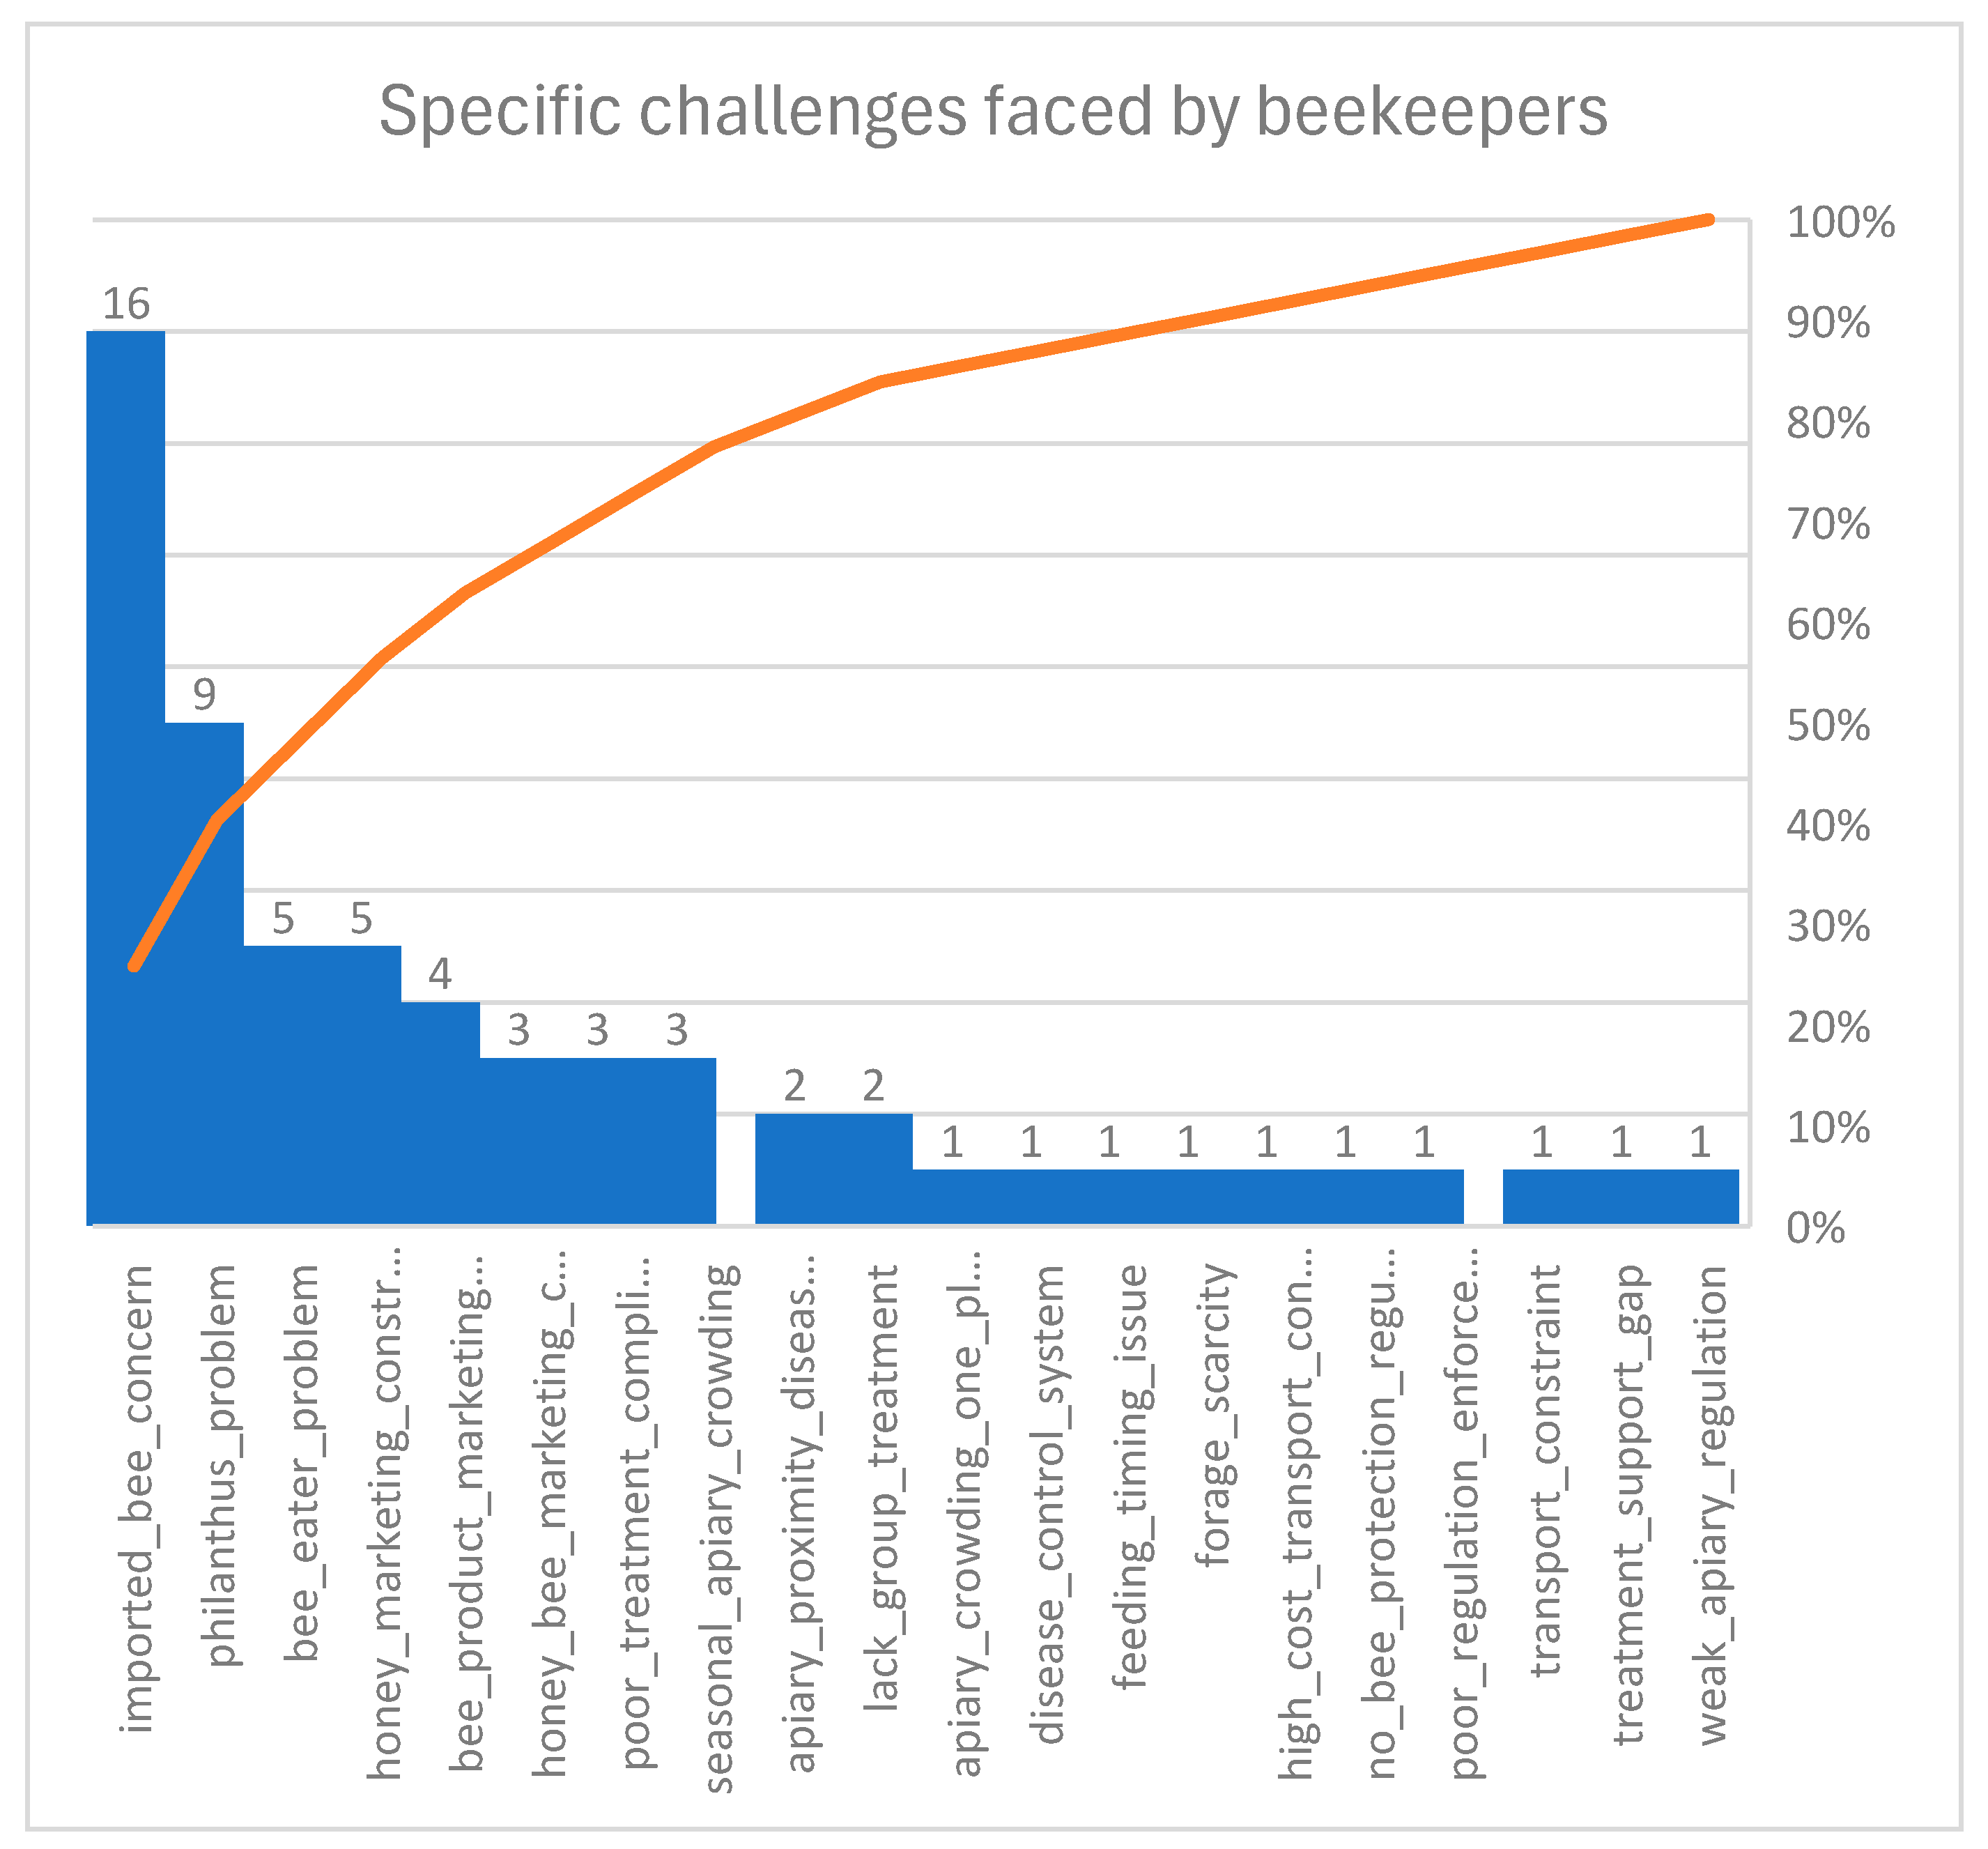
Concerns related to imported bees were the most frequently reported challenge (25.8%), followed by Philanthus predation (14.5%), bee-eater attacks, and honey marketing constraints (8.1% each).
Figure 11.
Challenges faced by beekeepers. Beekeepers identified concerns over imported bees as the most frequently reported challenge, followed by predation by Philanthus spp., honey marketing constraints, and bee-eater bird attacks.
Figure 11.
Challenges faced by beekeepers. Beekeepers identified concerns over imported bees as the most frequently reported challenge, followed by predation by Philanthus spp., honey marketing constraints, and bee-eater bird attacks.
3.7. Production System Typologies
Cluster analysis classified the surveyed apiaries into four distinct production systems. Cluster 1 consisted primarily of large apiaries dominated by traditional colonies with relatively low honey productivity and high disease prevalence. Cluster 2 represented intensive commercial operations with predominantly modern colonies but also exhibited the highest levels of Varroa and Nosema infection. Cluster 3 comprised relatively small apiaries characterized by modern colonies, the highest honey yield per colony (8.1 kg), and the lowest disease prevalence, representing the best-performing production system. Cluster 4 represented intermediate production systems with mixed colony composition and moderate productivity. Cluster 4 was characterized by 67.1% modern and 32.9% local colonies, with a mean honey yield of 2.0 kg per colony. Mean Varroa and Nosema prevalence were 32.4% and 27.6%, respectively, compared with 16.7% and 11.7% in Cluster 3
Figure 12.
Clustering of the apiaries. Cluster analysis identified four distinct beekeeping production system typologies, demonstrating substantial heterogeneity among the surveyed apiaries. The clusters were clearly separated based on their production characteristics, indicating differences in colony composition, productivity, and disease profiles, and highlighting the need for production system-specific management and development strategies rather than a uniform approach across the sector.
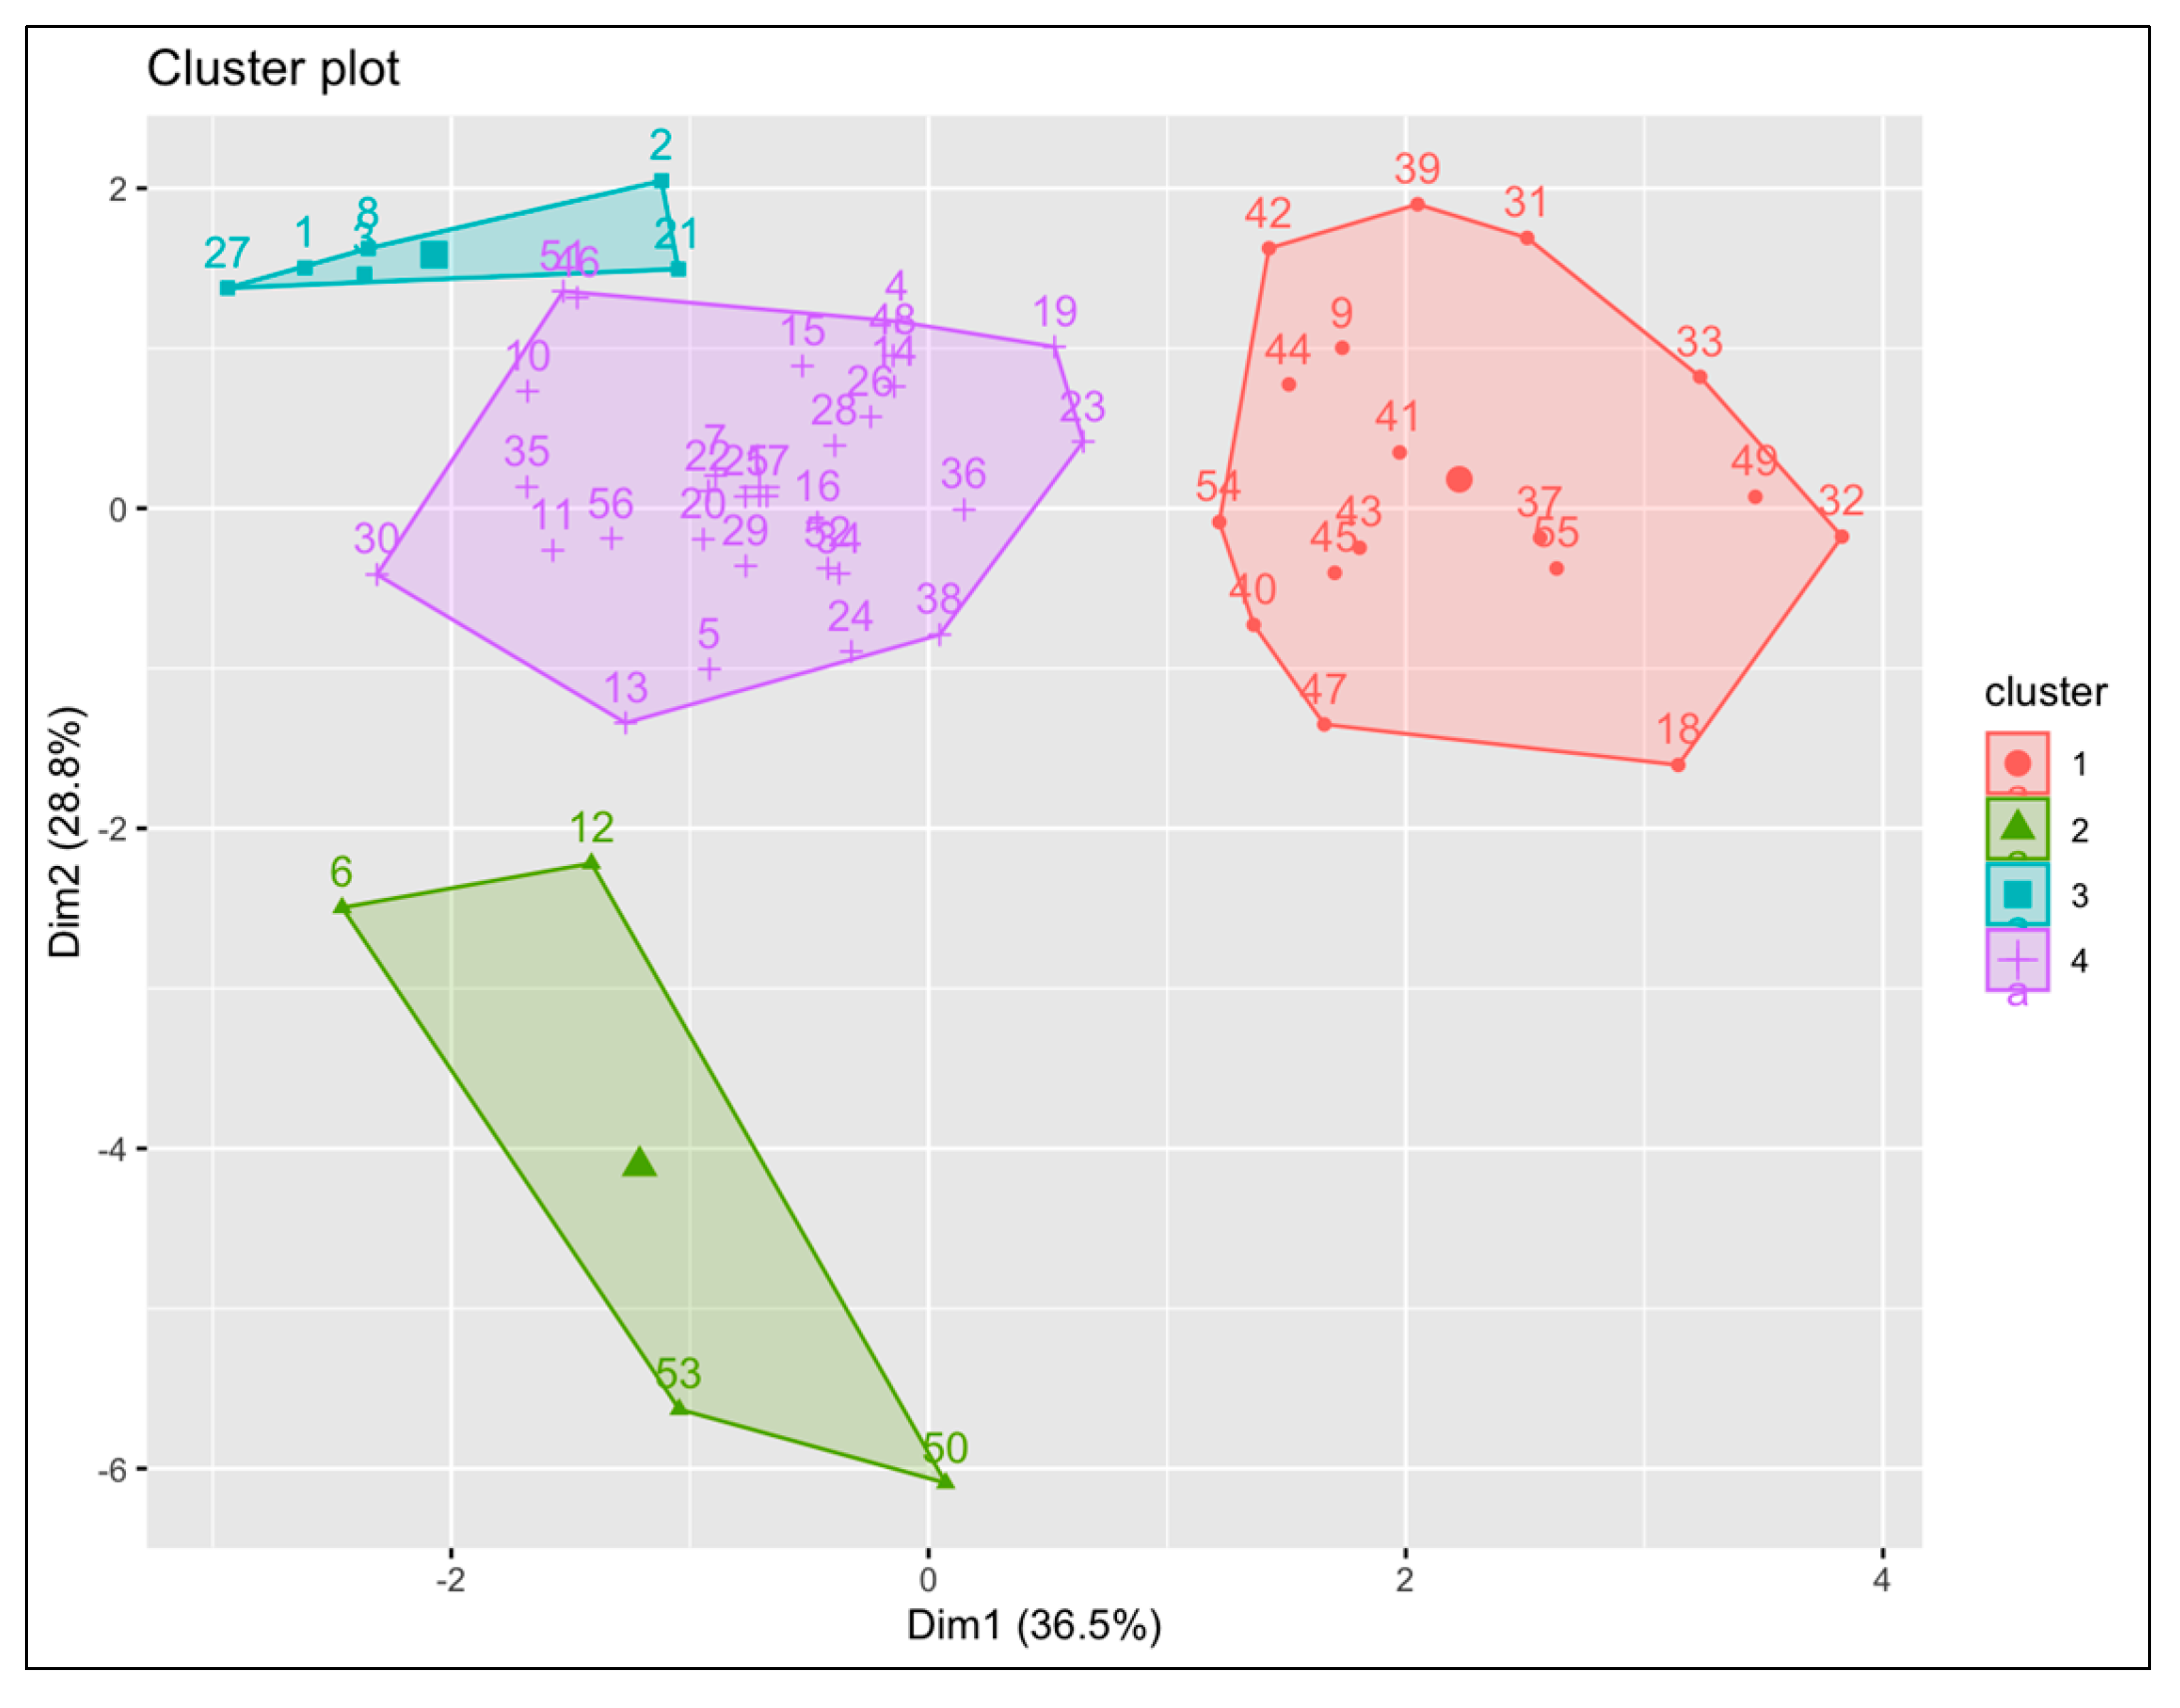
Table 23.
Summary characteristics of the production system clusters identified from cluster analysis.
Table 23.
Summary characteristics of the production system clusters identified from cluster analysis.
| Cluster | traditional colony (no.) | modern_colony (no.) | total_colony (no.) | Percent traditional_colony | percent_modern_colony | yield_percol_all (kg) | varoa_disease_percentage | Nosema_disease_percentage |
| 1 | 262.9 | 93.6 | 356.5 | 75.3 | 24.7 | 1.7 | 34.7 | 55.3 |
| 2 | 145.0 | 737.5 | 882.5 | 15.0 | 85.1 | 2.0 | 42.5 | 62.5 |
| 3 | 26.7 | 71.7 | 98.3 | 25.8 | 74.2 | 8.1 | 16.7 | 11.7 |
| 4 | 84.1 | 173.1 | 257.2 | 32.9 | 67.1 | 2.0 | 32.4 | 27.6 |
Cluster analysis identified four distinct beekeeping production system typologies. Cluster 1 was characterized by predominantly traditional colonies with low productivity and high disease prevalence, Cluster 2 by large commercial apiaries dominated by modern colonies, Cluster 3 by relatively small apiaries with the highest honey yield and the lowest disease prevalence, and Cluster 4 by mixed production systems with intermediate colony composition, productivity, and disease levels.
3.8. Principal Component Analysis
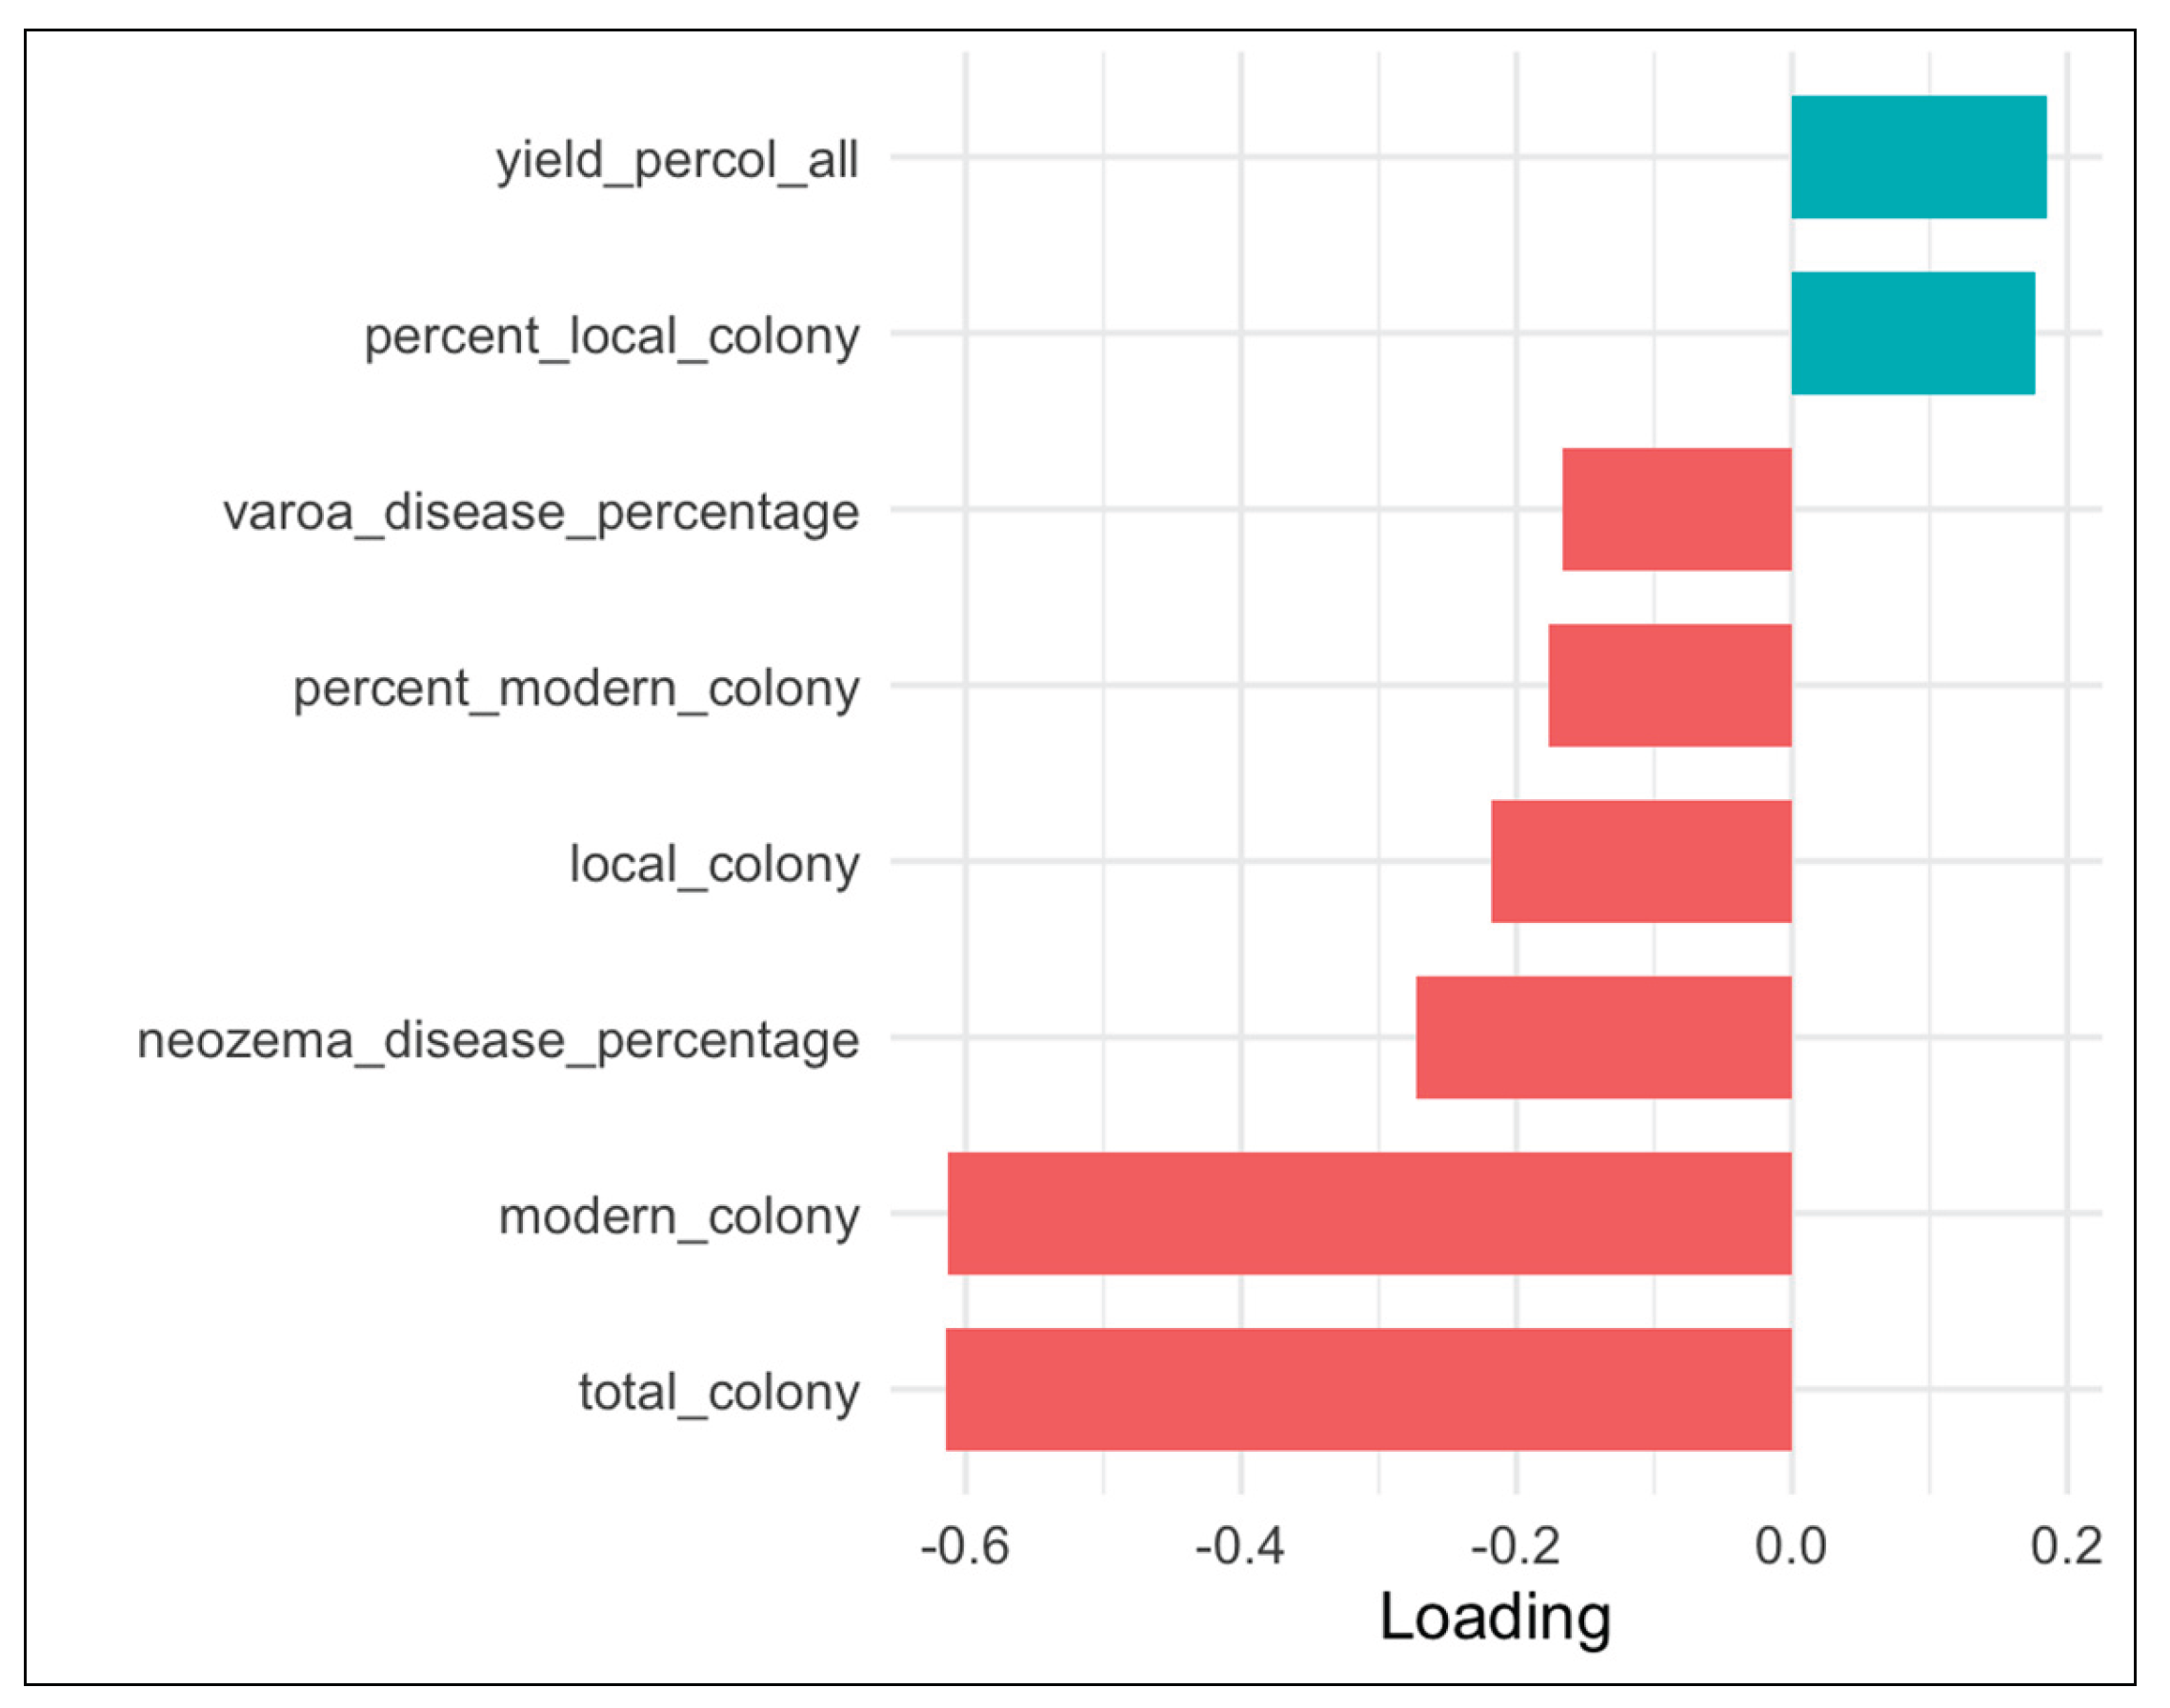
Principal Component Analysis (PCA) showed that the first two principal components explained 64.3% of the total variation among apiaries. The first principal component primarily represented a gradient in colony composition and apiary structure, separating large apiaries dominated by traditional colonies from those characterized by higher proportions of modern colonies. The second principal component reflected a productivity–health gradient, distinguishing highly productive apiaries with lower disease prevalence from those with greater disease burdens and lower productivity. The close association between Varroa and Nosema suggested that the two diseases frequently co-occurred, whereas honey yield showed an inverse relationship with disease prevalence. Quadrant analysis further identified four distinct groups of apiaries with differing management and production characteristics, supporting the results of the cluster analysis.
Figure 13.
PCA quadrants for the surveyed apiaries. The PCA quadrant classification separated the surveyed apiaries into four distinct groups based on the first two principal components, reflecting differences in colony composition, productivity, and disease characteristics. Apiaries in Quadrant 1 (high PC1, high PC2) exhibited the most favourable production profiles, whereas those in Quadrants 3 and 4 were associated with lower performance or contrasting production characteristics, demonstrating the diversity of beekeeping systems and the need for quadrant-specific management and development interventions.
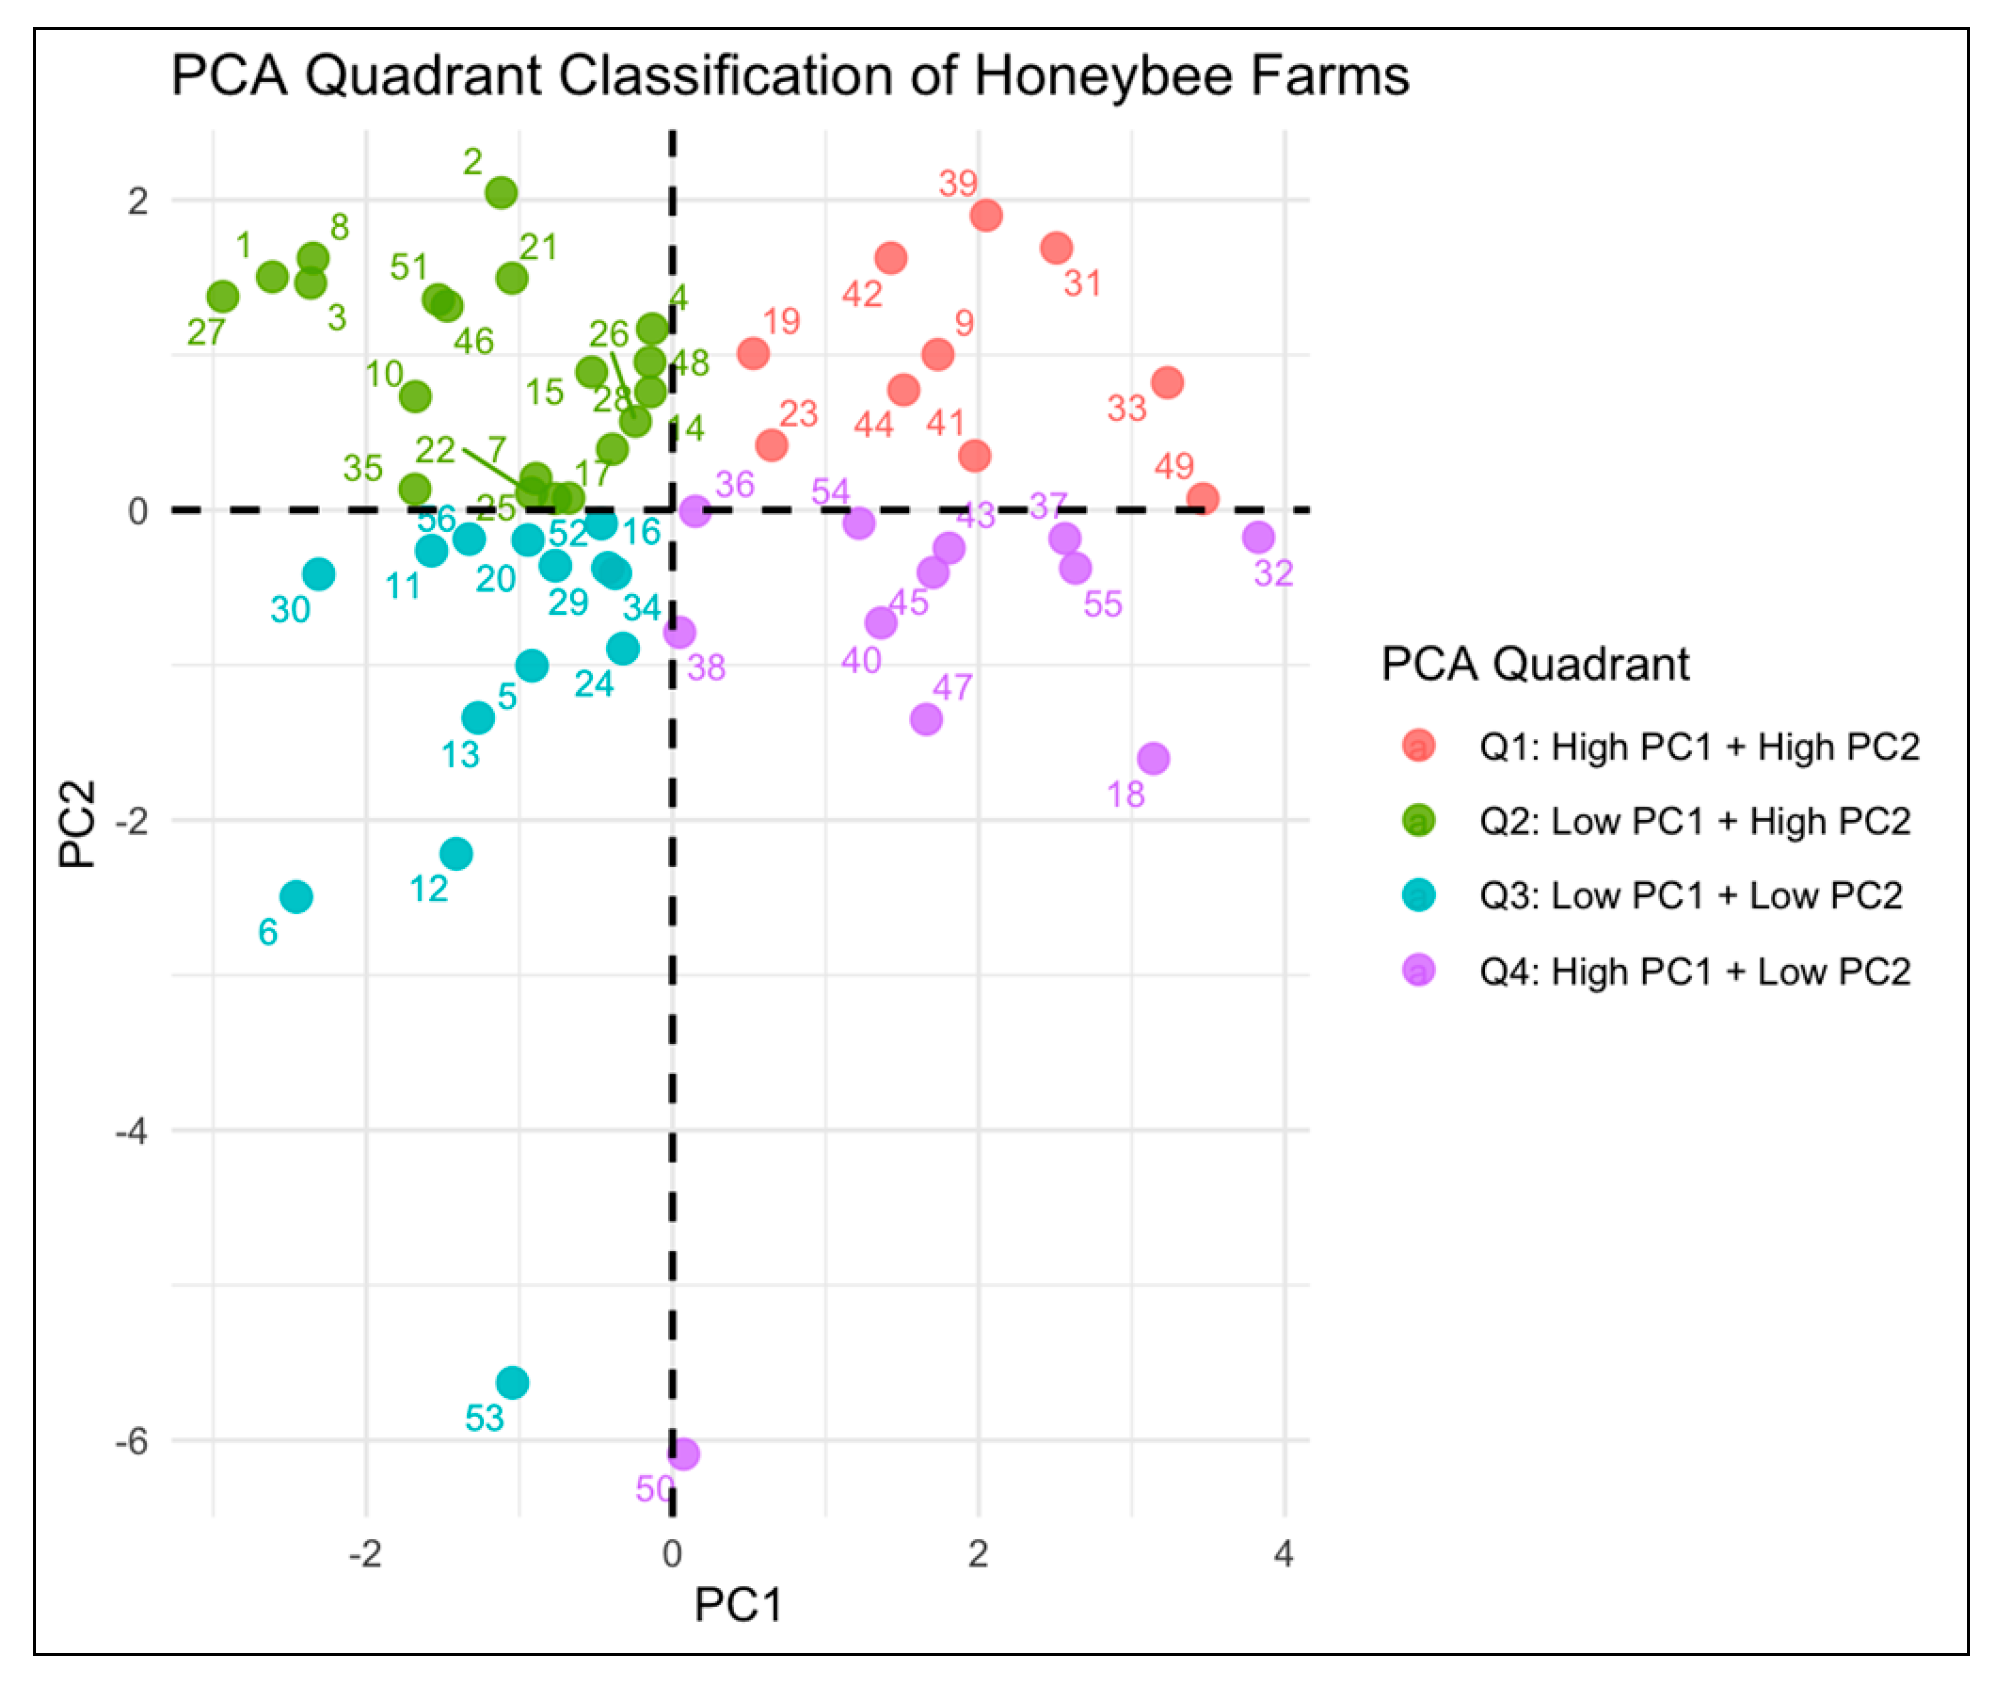
Table 24.
Interpretation of the four PCA quadrants representing beekeeping production system typologies.
Table 24.
Interpretation of the four PCA quadrants representing beekeeping production system typologies.
| Quadrant | Characteristics |
| Q1: High PC1 + High PC2 | Apiaries with characteristics positively associated with both PC1 and PC2. Usually larger/traditional-colony-oriented farms with some productivity or traditional colony influence. |
| Q2: Low PC1 + High PC2 | Apiaries associated more with modern colony percentage and higher yield. Potentially better-performing farms. |
| Q3: Low PC1 + Low PC2 | Apiaries with lower PC1 and PC2 values; often modern-colony farms but possibly with lower productivity or unusual disease/size profile. |
| Q4: High PC1 + Low PC2 | Apiaries associated with larger colony size and higher disease burden; may require disease control and management interventions. |
The four PCA quadrants represent distinct beekeeping production system typologies based on colony composition, productivity, colony size, and disease prevalence. They provide a practical framework for identifying groups of apiaries with similar characteristics and for designing targeted management, breeding, health, and extension interventions.
- PC1 represents a gradient in colony composition and apiary structure, contrasting large apiaries dominated by traditional colonies with apiaries characterized by a higher proportion of modern colonies
- PC2 primarily represents a productivity–health gradient, separating high-yield, low-disease apiaries from low-yield apiaries with higher disease prevalence
Figure 14.
Variable loadings on the first principal component (PC1) of the principal component analysis (PCA). The proportion and number of traditional colonies (mentioned as local colony in the figure) showed the strongest positive loadings on PC1, whereas the proportion of modern colonies had the strongest negative loading. These results indicate that PC1 primarily differentiates traditional colony-dominated production systems from modern colony-dominated systems, with smaller contributions from colony size, honey yield, and disease prevalence.
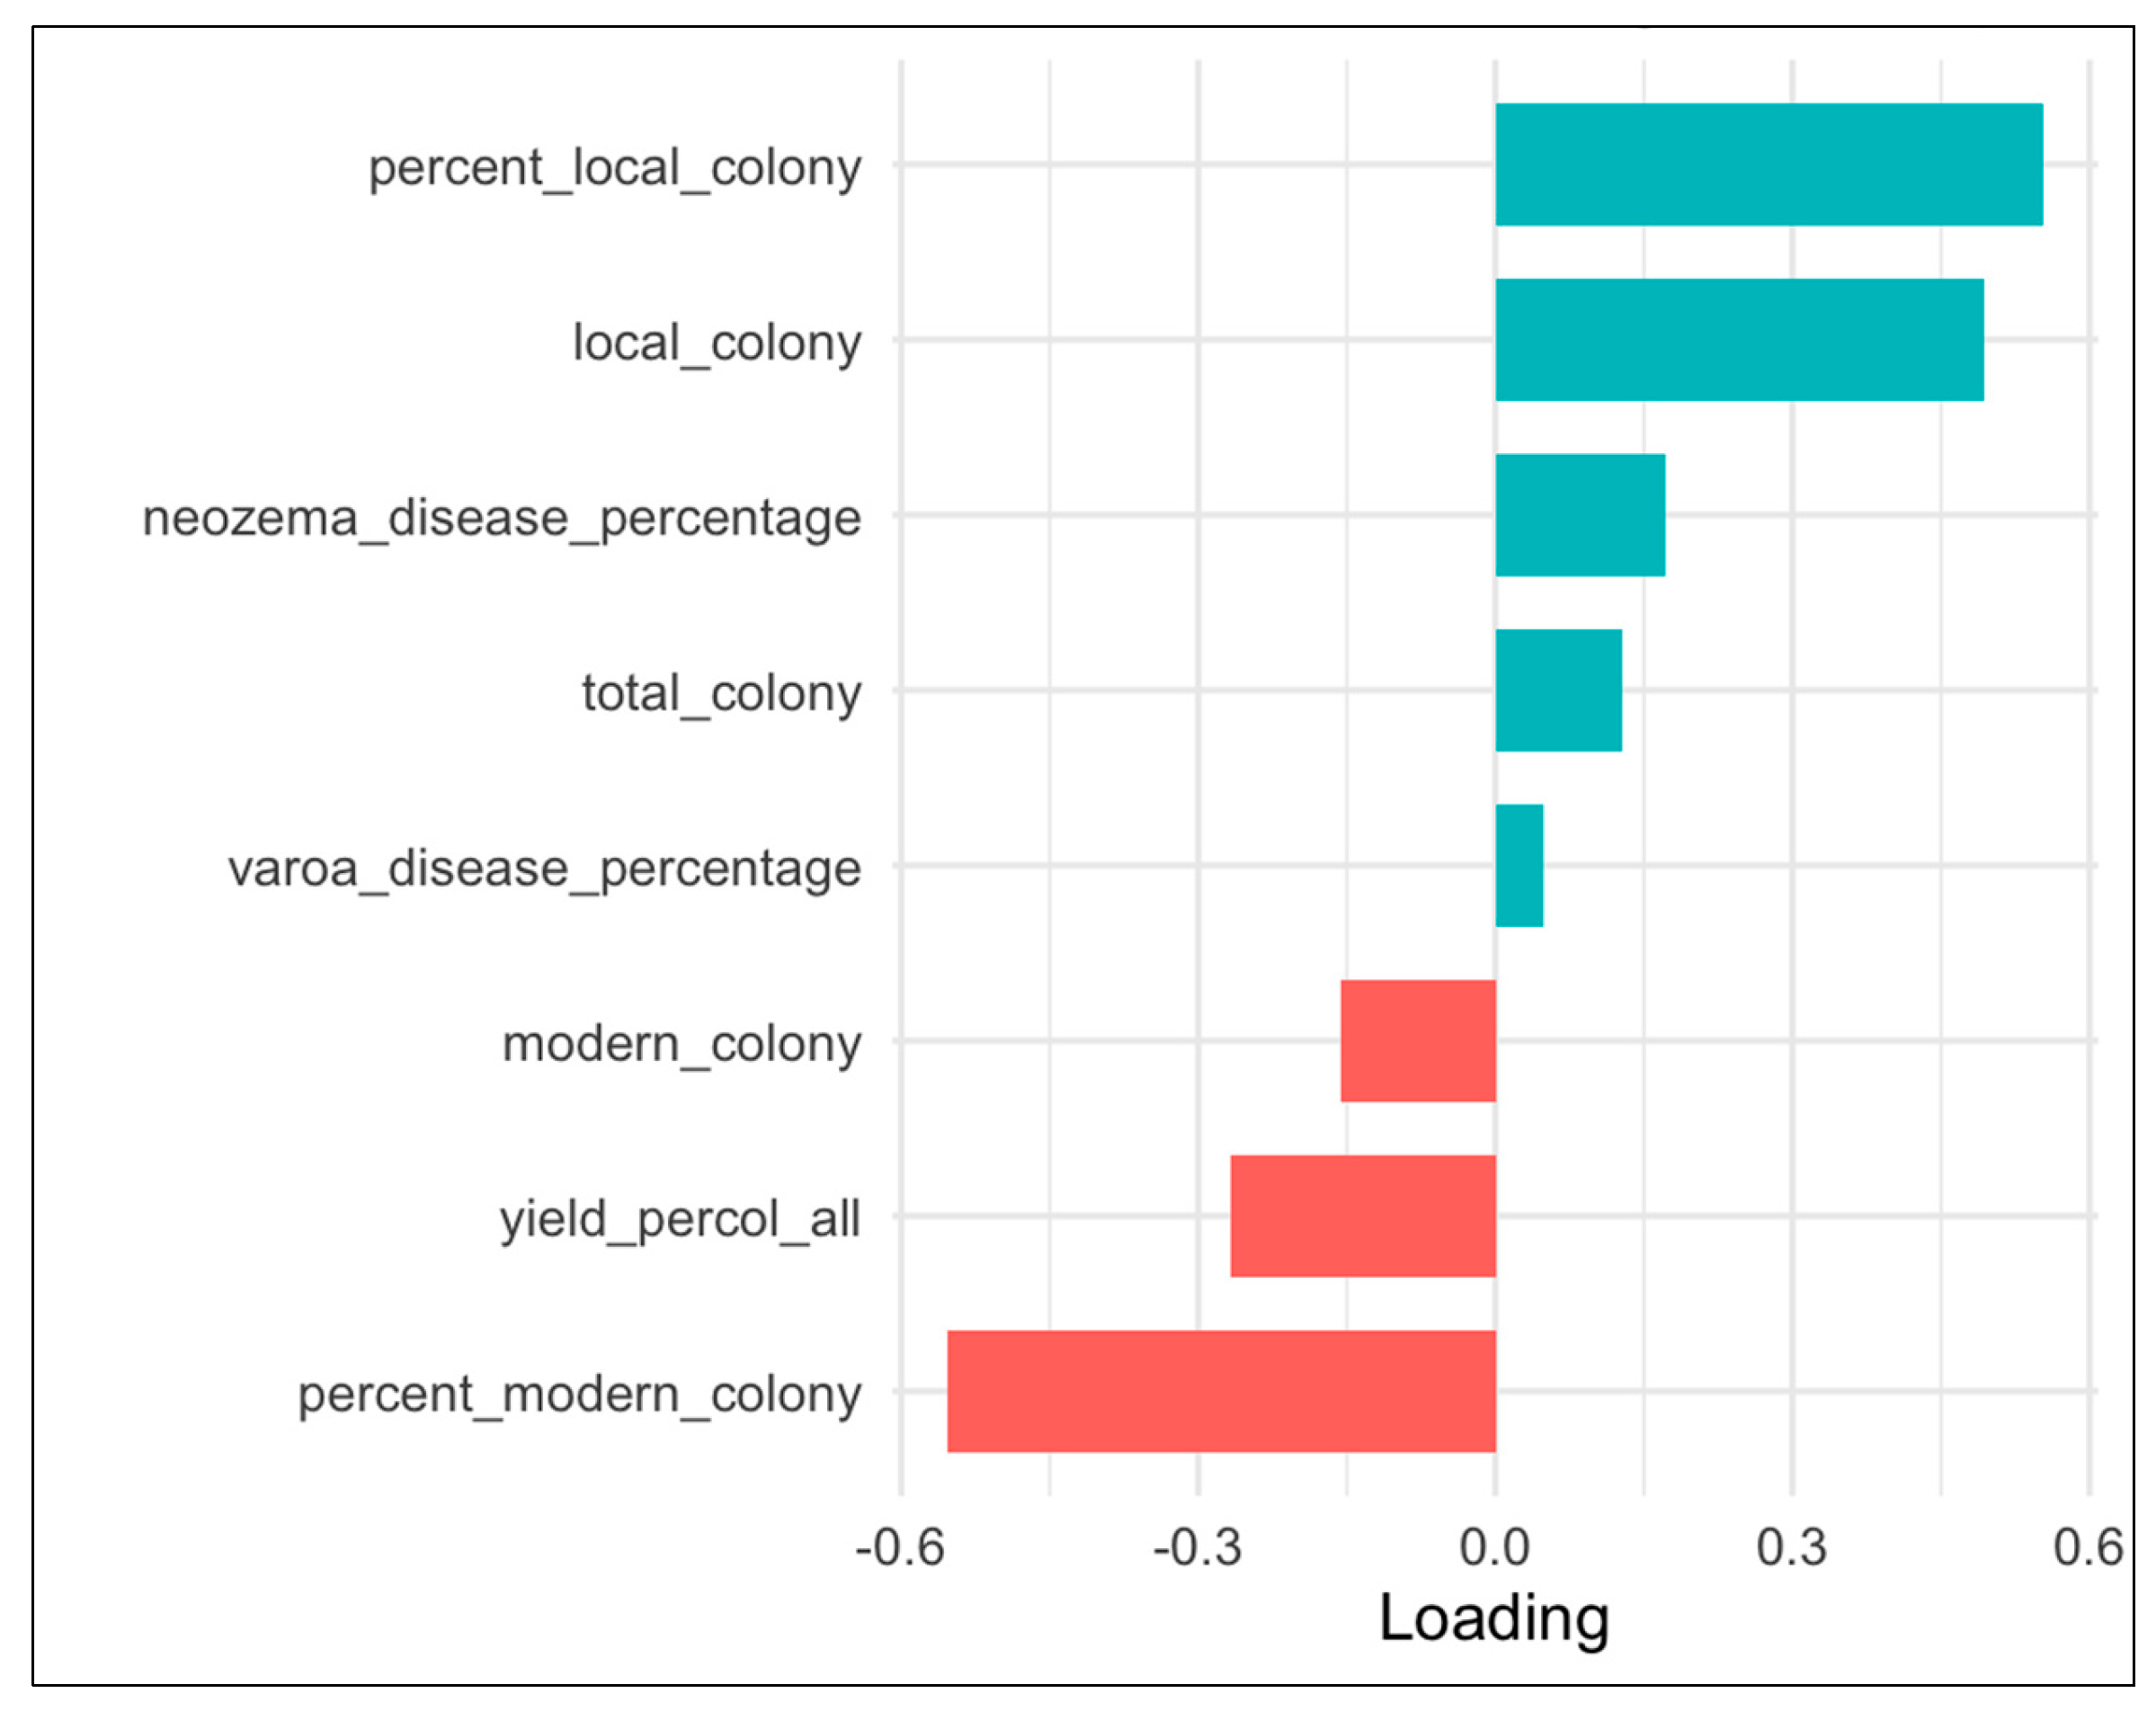
Figure 15.
Variable loadings on the second principal component (PC2) of the principal component analysis (PCA). Honey yield per colony and the proportion of traditional colonies (mentioned as local colony in the figure) showed the strongest positive loadings on PC2, whereas total colony size and the number of modern colonies had the strongest negative loadings. These results indicate that PC2 primarily distinguishes high-yield, traditional colony-based systems from larger, modern colony-dominated production systems.
4. Discussion
4.1. Overall Characterization
This study provides the first integrated national characterization of the Saudi Arabian beekeeping sector by combining information on apiary structure, colony composition, productivity, honeybee health, and beekeeper constraints. The findings demonstrate considerable regional variation in production systems, reflecting differences in climate, forage availability, management practices, and colony composition. Similar regional heterogeneity has been reported in other arid and semi-arid environments [59], emphasizing that environmental conditions, floral resources, and management practices strongly influence colony performance and honey production [39,40,41,42]. Such production diversity is characteristic of agricultural systems operating under variable climatic conditions and highlights the importance of developing region-specific interventions rather than uniform national recommendations [43,59]. The present study therefore provides a valuable baseline for guiding future development of the Saudi Arabian beekeeping sector.
4.2. Colony Composition and Productivity
These results indicate that colony type is the principal determinant of annual honey output across Saudi Arabia. Modern colonies produced significantly higher honey yields than traditional colonies, confirming previous studies demonstrating that selective breeding, improved queen quality, and commercial colony management enhanced honey production [27,28,44]. The results also suggest that both environmental conditions and management practices contribute to regional differences in productivity. Nevertheless, indigenous honeybees remain exceptionally well adapted to Saudi Arabia’s high temperatures, drought conditions, and limited forage availability, making them valuable genetic resources for sustainable apiculture [10,12,45]. Further, the findings indicate that traditional colonies respond more strongly to seasonal floral availability than modern colonies. Long-term sector development should therefore combine genetic improvement with conservation of indigenous honeybee populations [60], consistent with international recommendations promoting traditionally adapted breeding programmes under changing climatic conditions [27,29].
4.3. Honeybee Health
Varroa infestation was widespread across all study regions, whereas Nosema prevalence varied considerably among regions. These findings suggest that Varroa represents a national health challenge, whereas Nosema appears to be influenced by regional environmental or management factors. Although disease prevalence was not a significant predictor of honey yield in the regression models, apiaries with lower disease burdens consistently exhibited higher productivity. This finding supports growing evidence that colony performance depends on integrated management involving nutrition, genetics, biosecurity, and disease surveillance rather than treatment alone [17,18,19,20,21,22,23,24,25,46]. Studies in European countries and other regions have similarly shown that interactions among parasites, pathogens, nutrition, and environmental stress are major drivers of colony health and survival [18,20,47,60].
While intensifying the bee sector, differences in disease occurrence between traditional and more intensive commercial production systems should also be considered. Commercial beekeeping typically involves larger apiaries, higher colony densities, greater movement of colonies, and more frequent introduction or replacement of bees, all of which can increase opportunities for pathogen and parasite transmission. Previous studies have reported higher parasite burdens and physiological stress in commercially managed colonies compared with traditionally managed colonies, while experimental evidence indicates that high-density apiary configurations can facilitate Varroa transmission through increased drifting among colonies [63]. Migratory commercial beekeeping may further increase pathogen exposure through movement and congregation of colonies from different origins [63]. Therefore, although modern colonies in the present study showed higher productivity, intensification should be accompanied by strengthened biosecurity, routine disease surveillance, coordinated Varroa control, and regulation of colony movement to minimize disease risks.
4.4. Factors Affecting Productivity
Multiple regression analysis identified colony composition as the strongest determinant of honey production, while regional differences reflected variations in forage availability, climate, and management systems. The findings suggest that productivity is influenced by multiple interacting factors. While colony composition showed a stronger association with honey yield than disease prevalence in the statistical model, effective disease surveillance and control remain indispensable for safeguarding colony health and minimizing future productivity losses These findings suggest that improving honey production requires an integrated approach that combines genetic improvement, colony management, nutrition, forage development, and beekeeper capacity building in addition to disease control [22,23,24,25,29,48,60]. Similar conclusions have been reported from commercial beekeeping systems worldwide, where management practices often explain more variation in productivity than individual disease factors alone [44,49,60].
4.5. Production System Typologies
Principal component and cluster analyses identified four distinct beekeeping production system typologies differing in colony composition, apiary size, productivity, and disease burden, highlighting the heterogeneity of the Saudi Arabian beekeeping sector and the limitations of uniform development strategies. The typologies broadly differentiated traditional, commercial, and intermediate production systems, but also revealed substantial variation in performance within these groups. Cluster 1, dominated by local colonies (75.3%), represented relatively large traditional-oriented apiaries with low honey yield and a comparatively high disease burden, particularly Nosema. Cluster 2 represented the most intensive commercial system, characterized by the largest apiaries and a high proportion of modern colonies (85.1%), but relatively low honey yield and high Varroa and Nosema prevalence, indicating that increasing scale and use of modern colonies need to be accompanied by effective biosecurity and health management. In contrast, Cluster 3, although relatively small in apiary size, combined a predominance of modern colonies (74.2%) with the highest honey yield and lowest Varroa and Nosema prevalence, suggesting a potentially more efficient production model whose management practices warrant further investigation. Cluster 4 represented an intermediate system dominated by modern colonies (67.1%), with moderate apiary size and disease prevalence but relatively low productivity, indicating scope for improvement through better colony health, nutrition, and management.
The contrasting performance of the clusters, particularly Clusters 2 and 3, demonstrates that commercialization, apiary size, or a higher proportion of modern colonies alone does not necessarily result in greater productivity. Apiary typologies are therefore useful for designing targeted extension, technology transfer, and policy interventions that recognize differences in production environments and management objectives [31,32,43]. The production systems identified in this study provide a practical framework for developing cluster-specific breeding, disease and biosecurity management, extension, technology adoption, and investment strategies, while the practices associated with the high-performing Cluster 3 could be further investigated for potential adaptation and scaling across suitable beekeeping systems in Saudi Arabia.
4.6. Beekeeper Constraints
Beekeepers identified concerns related to imported bees, predator pressure, inadequate disease management, biosecurity, and marketing limitations as major constraints affecting sector performance. These findings indicate that productivity and sustainability are influenced by interacting with biological, technical, institutional, and market factors. Similar challenges have been reported in developing apiculture sectors, where limited extension and technical support, inadequate biosecurity, and weak value chains can constrain productivity and profitability [29,50,51].
The persistence of these constraints suggests that many challenges extend beyond the capacity of individual beekeepers and require stronger technical and institutional support. Uneven access to specialized extension, practical training, diagnostic and advisory services may limit early disease detection, effective pest and disease management, implementation of biosecurity measures, and adoption of improved practices. At the same time, broader issues such as bee imports, migratory colony movement, apiary crowding, predator management, and honey marketing require coordinated regulatory, institutional, and value-chain responses. Strengthening specialized apiculture extension, beekeeper organizations, diagnostic services, practical capacity development, regulatory mechanisms, and market support would therefore enable beekeepers to manage these constraints more effectively and contribute to improved sector performance. Thus, the constraints identified in this study reflect not only gaps in beekeeper knowledge and management capacity, but also limitations in extension support, institutional coordination, regulation, and market organization, indicating the need for a system-wide approach to sector development.
4.7. Implications for Sustainable Sector Development
The findings provide an evidence base for strengthening Saudi Arabia’s beekeeping sector through integrated interventions. Priority areas include conservation and genetic improvement of Apis mellifera jemenitica, strengthened biosecurity and disease surveillance, improved forage resources, wider adoption of good beekeeping practices, expansion of extension services, and increased use of precision apiculture technologies. Recent advances in digital hive monitoring, sensor technologies, and artificial intelligence offer new opportunities for improving colony health monitoring and management efficiency [34,35,36,52]. Collectively, these interventions would enhance productivity, reduce colony losses, improve pollination services, and strengthen the resilience and competitiveness of the sector in support of Saudi Vision 2030 and sustainable agrifood systems [7,8,53].
4.8. Strengths and Limitations
A major strength of this study is its comprehensive assessment of production systems, productivity, honeybee health, and beekeeper perceptions across five major beekeeping regions using robust multivariate statistical analyses. However, the cross-sectional design limits assessment of seasonal disease dynamics, and some regions were represented by relatively small sample sizes. Furthermore, the study focused primarily on Varroa and Nosema and did not include other important pathogens, forage quality, pesticide exposure, or climatic variables that may influence colony performance. Future research should incorporate longitudinal monitoring, molecular diagnostics, genomic characterization of indigenous honeybees, precision apiculture technologies, and economic analyses to provide a more comprehensive understanding of the factors influencing sustainable beekeeping under arid environmental conditions [24,27,34,46,54].
5. Conclusions
This study provides the first comprehensive national characterization of the Saudi Arabian beekeeping sector by integrating information on production systems, colony composition, honey production, honeybee health, and beekeeper constraints. The findings revealed considerable regional variation in production practices, productivity, and disease prevalence, demonstrating the diversity of beekeeping systems across the Kingdom. Modern colonies achieved significantly higher honey yields than traditional colonies, while colony composition emerged as a stronger determinant of productivity than disease prevalence. Although Varroa infestation was widespread and Nosema prevalence varied among regions, the results indicate that productivity is influenced by a combination of genetics, management, environmental conditions, and colony health rather than by disease alone [17,18,19,20,21,22,23,24,25,27,28,29].
The multivariate analyses identified four distinct production system typologies, highlighting the need for production system-specific interventions instead of uniform development strategies. Beekeepers identified imported bees, biosecurity risks, predator pressure, inadequate disease management, and marketing limitations as the principal constraints affecting sector performance. The constraints identified in this study reflect not only gaps in beekeeper knowledge and management capacity, but also limitations in extension support, institutional coordination, regulation, and market organization, indicating the need for a system-wide approach to sector development. These findings emphasize that sustainable improvement of the apiculture sector requires integrated interventions encompassing genetic improvement of indigenous honeybees, strengthened biosecurity and disease surveillance, improved forage resources, adoption of good beekeeping practices, enhanced extension services, and stronger value chains [29,31,43,50,51,52].
Overall, this study establishes a robust scientific baseline for evidence-based planning and future research on Saudi Arabia’s apiculture sector. The results provide practical guidance for government agencies, researchers, and development partners to prioritize investments that improve productivity while conserving the country’s valuable indigenous honeybee genetic resources. Implementing integrated strategies that combine improved genetics, honeybee health management, precision apiculture, and market development will enhance honey production, strengthen pollination services, improve rural livelihoods, and contribute to resilient and sustainable agrifood systems in support of Saudi Vision 2030 and global sustainable development goals [7,8,27,29,34,53,54,55,56].
6. Recommendations
Improving the sustainability and productivity of Saudi Arabia’s beekeeping sector requires an integrated approach. Priority should be given to establishing a national honeybee health surveillance system, strengthening biosecurity and regulation of imported bees, and implementing breeding programmes to conserve and improve the indigenous Apis mellifera jemenitica. Expanding extension services, promoting good beekeeping practices, improving forage resources, and adopting precision apiculture technologies will enhance colony health and productivity. In addition, strengthening research, honey quality assurance, certification, traceability, and value-chain development will improve sector competitiveness and beekeeper incomes. These efforts should be implemented through strong collaboration among government agencies, research institutions, beekeeper associations, the private sector, and international partners as part of an integrated strategy to support sustainable apiculture.
Author Contributions
Conceptualization, R.A, M.S , K.G and N.H.; methodology, R.A and M.S.; software, M.S.; validation K.G, N.H, A.S, M.A. and A.A.; formal analysis, M.S and R.A.; resources, A.S and N.H.; data curation, M.S.; writing, review and editing, M.S, R.A and K.G.; visualization, M.S.; supervision, K.G and N.H.; project administration, N.H.; funding acquisition, N.H. All authors have read and agreed to the published version of the manuscript.
Funding
This research was conducted under the Sustainable Rural Agricultural Development Program (SRAD), funded by the Kingdom of Saudi Arabia via a trust fund (UTF/SAU/051/SAU). The FAO implemented the project in collaboration with the Ministry of Environment, Water, and Agriculture, Kingdom of Saudi Arabia (MEWA).:
Institutional Review Board Statement
Not applicable.
Informed Consent Statement
Informed verbal consent was obtained from all the farmers involved in the study.
Data Availability Statement
Due to privacy agreements with participating farmers, the data are not publicly available.
Acknowledgments
The authors gratefully acknowledge the participation and cooperation of all the farmers, the dedication of the Field Technicians (Mushabab Alquhtani, Aali Alqarni), former FAO Technical Advisor Nuru Mohammed, and the support from the regional staff of the MEWA and the FAO-Saudi Arabia team.
Conflicts of Interest
The authors declare no conflict of interest.
References
- Klein, A.-M.; Vaissière, B.E.; Cane, J.H.; Steffan-Dewenter, I.; Cunningham, S.A.; Kremen, C.; Tscharntke, T. Importance of pollinators in changing landscapes for world crops. Proc. R. Soc. B Biol. Sci. 2007, 274, 303–313. [Google Scholar] [CrossRef] [PubMed]
- Potts, S.G.; Imperatriz-Fonseca, V.L.; Ngo, H.T.; Aizen, M.A.; Biesmeijer, J.C.; Breeze, T.D.; Dicks, L.V.; Garibaldi, L.A.; Hill, R.; Settele, J.; et al. Safeguarding pollinators and their values to human well-being. Nature 2016, 540, 220–229. [Google Scholar] [CrossRef] [PubMed]
- Food and Agriculture Organization of the United Nations (FAO). The State of the World’s Biodiversity for Food and Agriculture; FAO: Rome, Italy, 2019. [Google Scholar]
- Garibaldi, L.A.; Steffan-Dewenter, I.; Winfree, R.; et al. Wild pollinators enhance fruit set of crops regardless of honey bee abundance. Science 2013, 339, 1608–1611. [Google Scholar] [CrossRef] [PubMed]
- Ollerton, J.; Winfree, R.; Tarrant, S. How many flowering plants are pollinated by animals? Oikos 2011, 120, 321–326. [Google Scholar] [CrossRef]
- FAOSTAT. Crops and Livestock Products Database. Food and Agriculture Organization of the United Nations, Rome, Italy. Available online: https://www.fao.org/faostat/ (accessed on 1 April 2025).
- IPBES. The Assessment Report on Pollinators, Pollination and Food Production; Secretariat of the Intergovernmental Science-Policy Platform on Biodiversity and Ecosystem Services: Bonn, Germany, 2016. [Google Scholar]
- Gallai, N.; Salles, J.-M.; Settele, J.; Vaissière, B.E. Economic valuation of the vulnerability of world agriculture confronted with pollinator decline. Ecol. Econ. 2009, 68, 810–821. [Google Scholar] [CrossRef]
- Ministry of Environment; Water and Agriculture (MEWA). Annual Report of the Saudi Beekeeping Sector; MEWA: Riyadh, Saudi Arabia, 2023. [Google Scholar]
- Alqarni, A.S.; Hannan, M.A.; Owayss, A.A.; Engel, M.S. The indigenous honey bees of Saudi Arabia (Apis mellifera jemenitica). Bee World 2011, 88, 78–83. [Google Scholar] [CrossRef]
- Al-Ghamdi, A.; Adgaba, N.; Getachew, A.; Tadesse, Y. New approach for determination of an optimum honeybee colony’s carrying capacity based on productivity and nectar secretion potential of bee forage species. Saudi J. Biol. Sci. 2016, 23, 92–100. [Google Scholar] [CrossRef] [PubMed]
- Alqarni, A.S.; Balhareth, H.M.; Owayss, A.A. Performance evaluation of indigenous and exotic honeybee races under Saudi Arabian environmental conditions. Saudi J. Biol. Sci. 2014, 21, 256–263. [Google Scholar] [PubMed]
- Al-Ghamdi, A.; Nuru, A.; Khanbash, M.S.; Smith, D.R. Geographical distribution and population variation of indigenous honey bees in Saudi Arabia. Saudi J. Biol. Sci. 2017, 24, 1030–1038. [Google Scholar]
- Le Conte, Y.; Navajas, M. Climate change: Impact on honey bee populations and diseases. Rev. Sci. Tech. 2008, 27, 499–510. [Google Scholar]
- Goulson, D.; Nicholls, E.; Botías, C.; Rotheray, E.L. Bee declines driven by combined stress from parasites, pesticides and lack of flowers. Science 2015, 347, 1255957. [Google Scholar] [CrossRef] [PubMed]
- VanEngelsdorp, D.; Meixner, M.D. Historical review of managed honey bee populations in Europe and the United States and the factors affecting them. J. Invertebr. Pathol. 2010, 103, S80–S95. [Google Scholar] [PubMed]
- Rosenkranz, P.; Aumeier, P.; Ziegelmann, B. Biology and control of Varroa destructor. J. Invertebr. Pathol. 2010, 103, S96–S119. [Google Scholar] [CrossRef] [PubMed]
- Traynor, K.S.; Mondet, F.; de Miranda, J.R.; et al. Varroa destructor: A complex parasite, crippling honey bees worldwide. Trends Parasitol. 2020, 36, 592–606. [Google Scholar] [CrossRef] [PubMed]
- Nazzi, F.; Le Conte, Y. Ecology of Varroa destructor, the major ectoparasite of the western honey bee. Annu. Rev. Entomol. 2016, 61, 417–432. [Google Scholar] [PubMed]
- Fries, I. Nosema ceranae in European honey bees. J. Invertebr. Pathol. 2010, 103, S73–S79. [Google Scholar] [PubMed]
- Higes, M.; Martín-Hernández, R.; Meana, A. Nosema ceranae in Europe: An emergent type C nosemosis. Apidologie 2010, 41, 375–392. [Google Scholar]
- Dolezal, A.G.; Toth, A.L. Feedbacks between nutrition and disease in honey bee health. Curr. Opin. Insect Sci. 2018, 26, 114–119. [Google Scholar] [CrossRef] [PubMed]
- Brodschneider, R.; Crailsheim, K. Nutrition and health in honey bees. Apidologie 2010, 41, 278–294. [Google Scholar]
- Nicolson, S.W. Bee nutrition and floral resource ecology. Annu. Rev. Entomol. 2023, 68, 149–167. [Google Scholar]
- Simone-Finstrom, M.; Li-Byarlay, H. The role of nutrition in honey bee health. Curr. Opin. Insect Sci. 2018, 26, 1–6. [Google Scholar]
- Alattal, Y.; Alghamdi, A.; Alqarni, A.S. Adaptation of Apis mellifera jemenitica to arid environments of the Arabian Peninsula. Saudi J. Biol. Sci. 2023. [Google Scholar]
- Büchler, R.; Costa, C.; Hatjina, F.; et al. The influence of genetic origin and its interaction with environmental effects on the survival of Apis mellifera colonies. J. Apic. Res. 2014, 53, 205–214. [Google Scholar]
- Meixner, M.D.; Pinto, M.A.; Bouga, M.; Kryger, P.; Ivanova, E.; Fuchs, S. Standard methods for characterising subspecies and ecotypes of Apis mellifera. J. Apic. Res. 2013, 52, 1–28. [Google Scholar]
- Food and Agriculture Organization of the United Nations (FAO). Good Beekeeping Practices: Practical Manual on How to Identify and Control the Main Diseases of the Honeybee; FAO: Rome, Italy, 2021. [Google Scholar]
- World Organisation for Animal Health (WOAH). Terrestrial Animal Health Code; WOAH: Paris, France, 2024. [Google Scholar]
- Bradbear, N. Bees and Their Role in Forest Livelihoods . In FAO Non-Wood Forest Products Series No. 19; FAO: Rome, Italy, 2009. [Google Scholar]
- Dicks, L.V.; Breeze, T.D.; Ngo, H.T.; et al. A global-scale expert assessment of drivers and risks associated with pollinator decline. Nat. Ecol. Evol. 2021. [Google Scholar] [PubMed]
- United Nations Environment Programme (UNEP). Global Assessment Report on Biodiversity and Ecosystem Services; UNEP: Nairobi, Kenya, 2019. [Google Scholar]
- Zacepins, A.; Kviesis, A.; Pecka, A.; et al. Precision beekeeping: Challenges and opportunities. Biosyst. Eng. 2023. [Google Scholar]
- Meikle, W.G.; Holst, N. Application of continuous monitoring of honeybee colonies. Apidologie 2015, 46, 10–22. [Google Scholar]
- Edwards-Murphy, F.; Popovici, E.; et al. IoT technologies for precision apiculture: A review. Comput. Electron. Agric. 2016, 130, 94–102. [Google Scholar]
- The jamovi Project. jamovi. Version 2.5; Computer Software. 2024. Available online: https://www.jamovi.org (accessed on 1 April 2025).
- R Core Team. R: A Language and Environment for Statistical Computing; R Foundation for Statistical Computing: Vienna, Austria, 2024; Available online: https://www.R-project.org/ (accessed on 1 April 2025).
- Dicks, L.V.; Breeze, T.D.; Ngo, H.T.; Senapathi, D.; An, J.; Aizen, M.A.; Basu, P.; Buchori, D.; Galetto, L.; Garibaldi, L.A.; et al. A global-scale expert assessment of drivers and risks associated with pollinator decline. Nat. Ecol. Evol. 2021, 5, 1453–1461. [Google Scholar] [CrossRef] [PubMed]
- Vanbergen, A.J. The Insect Pollinators Initiative. Threats to an ecosystem service: Pressures on pollinators. Front. Ecol. Environ. 2013, 11, 251–259. [Google Scholar] [CrossRef]
- Potts, S.G.; Biesmeijer, J.C.; Kremen, C.; Neumann, P.; Schweiger, O.; Kunin, W.E. Global pollinator declines: Trends, impacts and drivers. Trends Ecol. Evol. 2010, 25, 345–353. [Google Scholar] [CrossRef] [PubMed]
- Le Conte, Y.; Navajas, M. Climate change: Impact on honey bee populations and diseases. Rev. Sci. Tech. 2008, 27, 499–510. [Google Scholar]
- Alvarez, S.; Paas, W.; Descheemaeker, K.; Tittonell, P.; Groot, J.C.J. Constructing typologies, a way to deal with farm diversity: General guidelines for the Humidtropics. Agric. Syst. 2018, 165, 212–226. [Google Scholar] [CrossRef]
- Seeley, T.D. Honeybee Ecology: A Study of Adaptation in Social Life; Princeton University Press: Princeton, NJ, USA, 2019. [Google Scholar]
- Alattal, Y.; Aljedani, D.; Alqarni, A.S. Current status and future perspectives of beekeeping in Saudi Arabia. Saudi J. Biol. Sci. 2023, 30, 103719. [Google Scholar] [CrossRef] [PubMed]
- Ramsey, S.D.; Ochoa, R.; Bauchan, G.; Gulbronson, C.; Mowery, J.D.; Cohen, A.; Lim, D.; Joklik, J.; Cicero, J.M.; Ellis, J.D.; et al. Varroa destructor feeds primarily on honey bee fat body tissue and not hemolymph. Proc. Natl. Acad. Sci. USA 2019, 116, 1792–1801. [Google Scholar] [CrossRef] [PubMed]
- Evans, J.D.; Schwarz, R.S. Bees brought to their knees: Microbes affecting honey bee health. Trends Microbiol. 2011, 19, 614–620. [Google Scholar] [CrossRef] [PubMed]
- Brodschneider, R.; Crailsheim, K. Nutrition and health in honey bees. Apidologie 2010, 41, 278–294. [Google Scholar] [CrossRef]
- Meikle, W.G.; Holst, N. Application of continuous monitoring of honeybee colonies. Apidologie 2015, 46, 10–22. [Google Scholar] [CrossRef]
- Bradbear, N. Bees and Their Role in Forest Livelihoods; Non-Wood Forest Products No. 19; Food and Agriculture Organization of the United Nations (FAO): Rome, Italy, 2009. [Google Scholar]
- Food and Agriculture Organization of the United Nations (FAO). Good Beekeeping Practices: Practical Manual on How to Identify and Control the Main Diseases of the Honeybee (Apis mellifera) . In Animal Production and Health Guidelines No. 25; FAO: Rome, Italy, 2021. [Google Scholar]
- Cecchi, S.; Terenzi, A.; Spinsante, S.; Orcioni, S. A smart sensor-based monitoring system for precision apiculture. Comput. Electron. Agric. 2020, 169, 105243. [Google Scholar] [CrossRef]
- Food and Agriculture Organization of the United Nations (FAO). The State of Food and Agriculture 2024; FAO: Rome, Italy, 2024. [Google Scholar]
- World Organisation for Animal Health (WOAH). Terrestrial Animal Health Code; WOAH: Paris, France, 2024. [Google Scholar]
- Convention on Biological Diversity (CBD). Kunming–Montreal Global Biodiversity Framework; CBD Secretariat: Montreal, QC, Canada, 2022; Available online: https://www.cbd.int/gbf (accessed on 1 April 2025).
- United Nations. Transforming Our World: The 2030 Agenda for Sustainable Development; United Nations: New York, NY, USA, 2015; Available online: https://sdgs.un.org/2030agenda (accessed on 1 April 2025).
- Wallberg, A.; Han, F.; Wellhagen, G.; Dahle, B.; Kawata, M.; Haddad, N.; Simões, Z. L. P.; Allsopp, M. H.; Kandemir, I.; De la Rúa, P.; Pirk, C. W.; Webster, M. T. A worldwide survey of genome sequence variation provides insight into the evolutionary history of the honeybee Apis mellifera. Nat. Genet. 2014, 46, 1081–1088. [Google Scholar] [PubMed]
- Hasegawa, N.; Techer, M. A.; Adjlane, N.; al-Hissnawi, M. S.; Antunez, K.; Beaurepaire, A.; Christmon, K.; Delatte, H.; Dukku, U. H.; Eliash, N.; El-Niweir, M. A. A.; Esnault, O.; Evans, J.; Haddad, N. J.; Locke, B.; Muñoz, I.; Noel, G.; Panziera, D.; Roberts, J. M. K.; De la Rua, P.; Shebl, M. A.; Stanimirovic, Z.; Rasmussen, D. A.; Mikheyev, A. S. Evolutionarily diverse origins of deformed wing viruses in western honeybees. Proc. Natl. Acad. Sci. (PNAS) 2023, 120. [Google Scholar] [CrossRef] [PubMed]
- Alkhatatbeh, H.; Sadder, M.; Haddad, N.; Al-Amad, I.; Brake, M.; Alsakarneh, N.; Alnajjar, A. Transcriptome analysis of historic olives reveals stress-specific biomarkers. Front. Plant Sci. 2025, 16. [Google Scholar] [CrossRef] [PubMed]
- Haddad, N.; Batainh, A.; Migdadi, O.; Saini, D.; Krishnamurthy, V.; Parameswaran, S.; Alhamuri, Z. Next generation sequencing of Apis mellifera syriaca identifies genes for Varroa resistance and beneficial beekeeping traits. Insect Sci. 2015, 23(4), 579–590. [Google Scholar] [CrossRef] [PubMed]
- Osterman, Julia; Aizen, Marcelo A.; Biesmeijer, Jacobus C.; Bosch, Jordi; Howlett, Brad G.; Inouye, David W.; Jung, Chuleui; Martins, Dino J.; Medel, Rodrigo; Pauw, Anton; Seymour, Colleen L.; Paxton, Robert J. Global trends in the number and diversity of managed pollinator species. Agric. Ecosyst. Environ. 2021, Volume 322, 107653. [Google Scholar] [CrossRef]
- Topolska, G. Varroa destructor (Anderson i Trueman, 2000); zmiana w klasyfikacji w obrebie rodzaju Varroa (Oudemans, 1904) [Varroa destructor (Anderson and Trueman, 2000); the change in classification within the genus Varroa (Oudemans, 1904)]. In Wiad Parazytol.; Polish, 2001; Volume 47, 1, pp. 151–5. [Google Scholar] [PubMed]
- Ptaszyńska, A.A.; Gancarz, M.; Hurd, P.J.; Borsuk, G.; Wiącek, D.; Nawrocka, A.; Strachecka, A. Oxidative stress, endoparasite prevalence and social immunity in bee colonies kept traditionally vs. those kept for commercial purposes. Insects 2020, 11, 293. [Google Scholar]
Figure 6.
Honey yield per traditional colony.
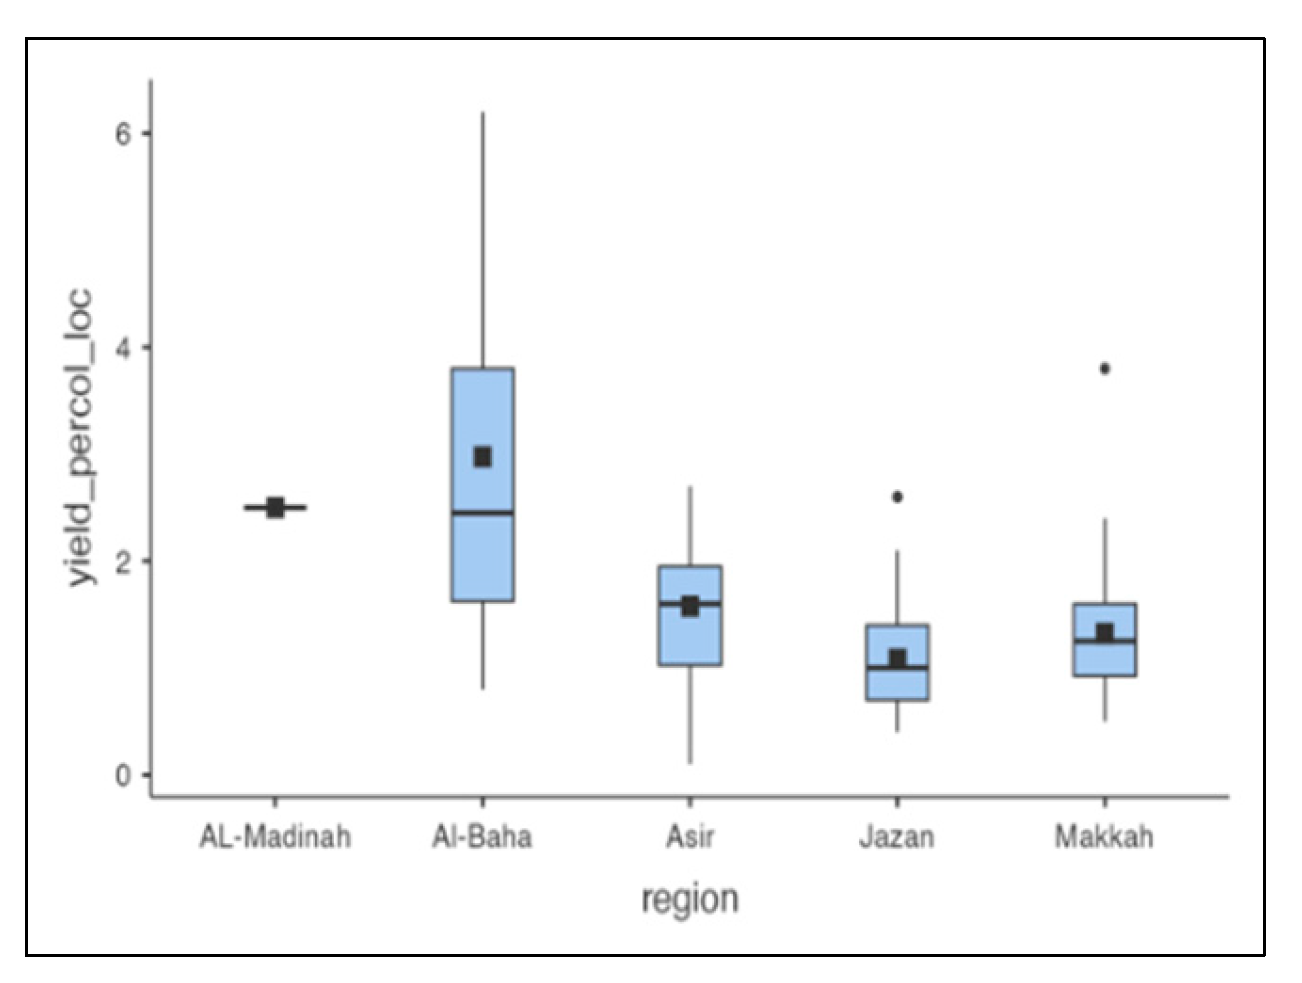
Figure 7.
Honey yield per modern colony.
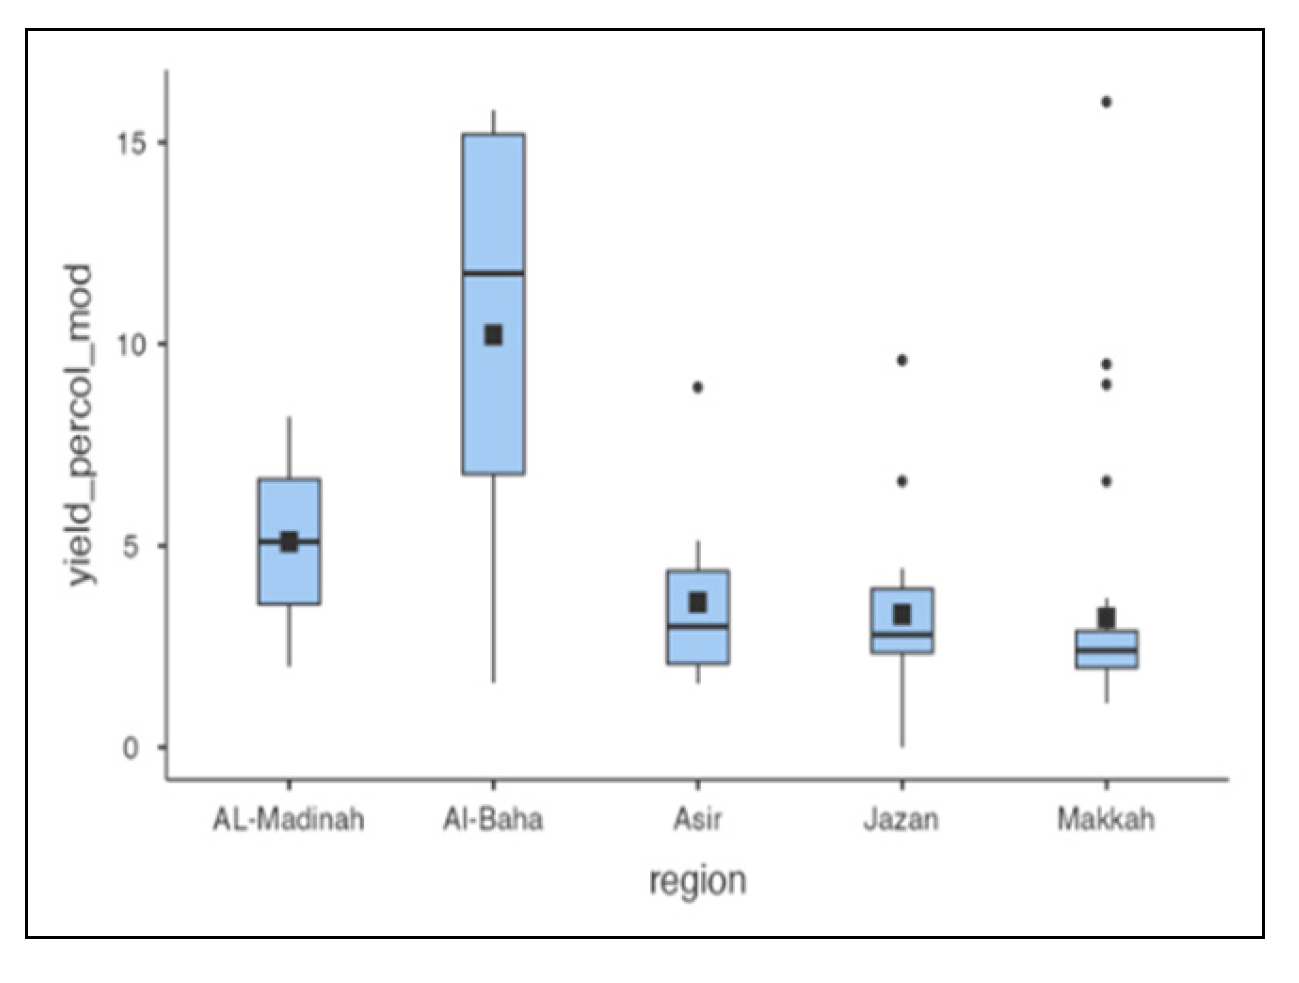
Figure 8.
Honey yield per colony – combined.
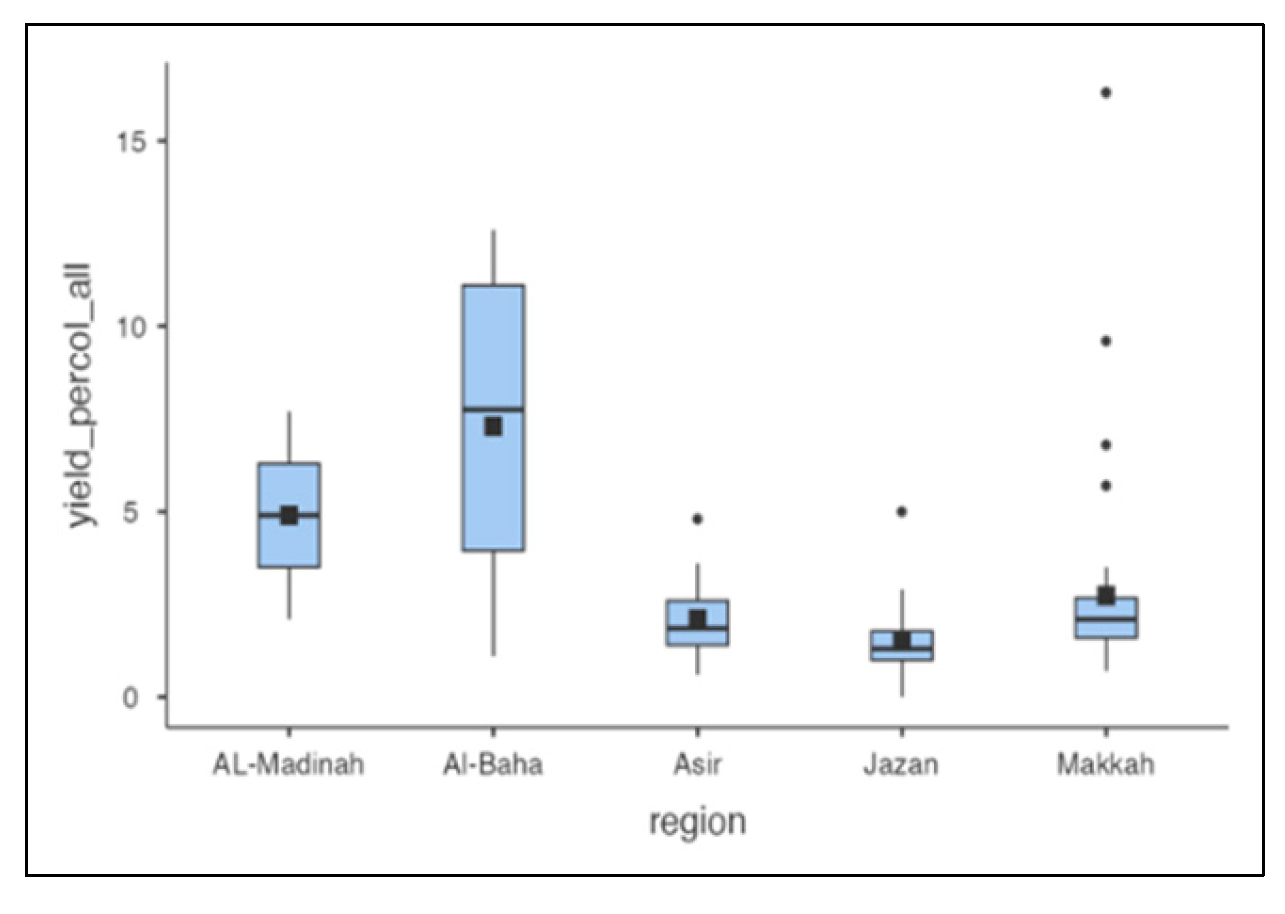
Figure 9.
Varroa occurrence.
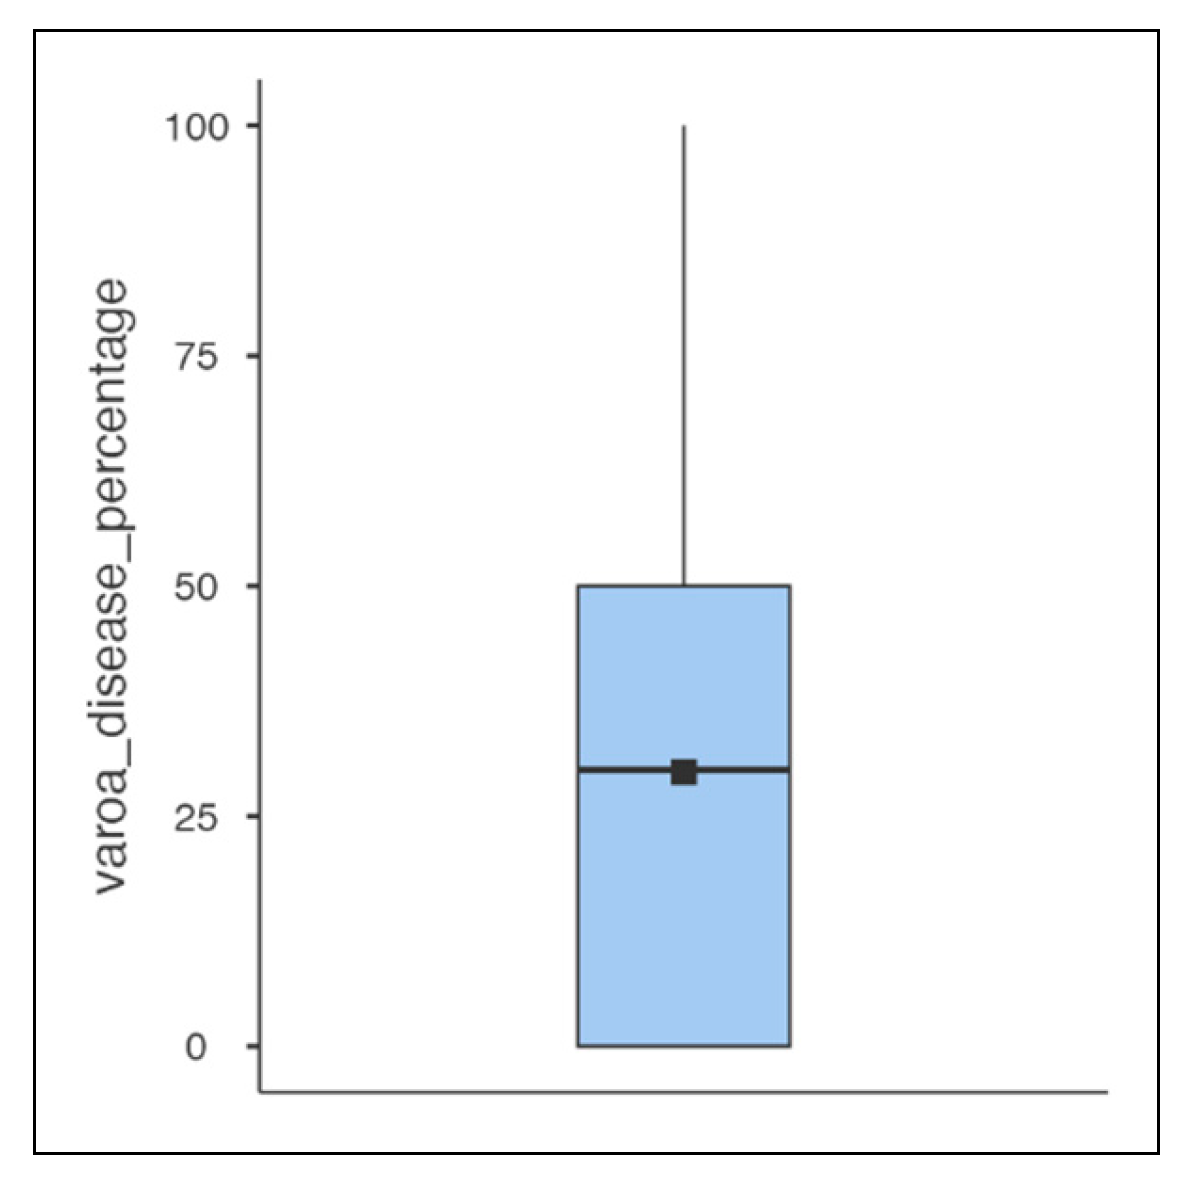
Figure 10.
Nosema occurrence.
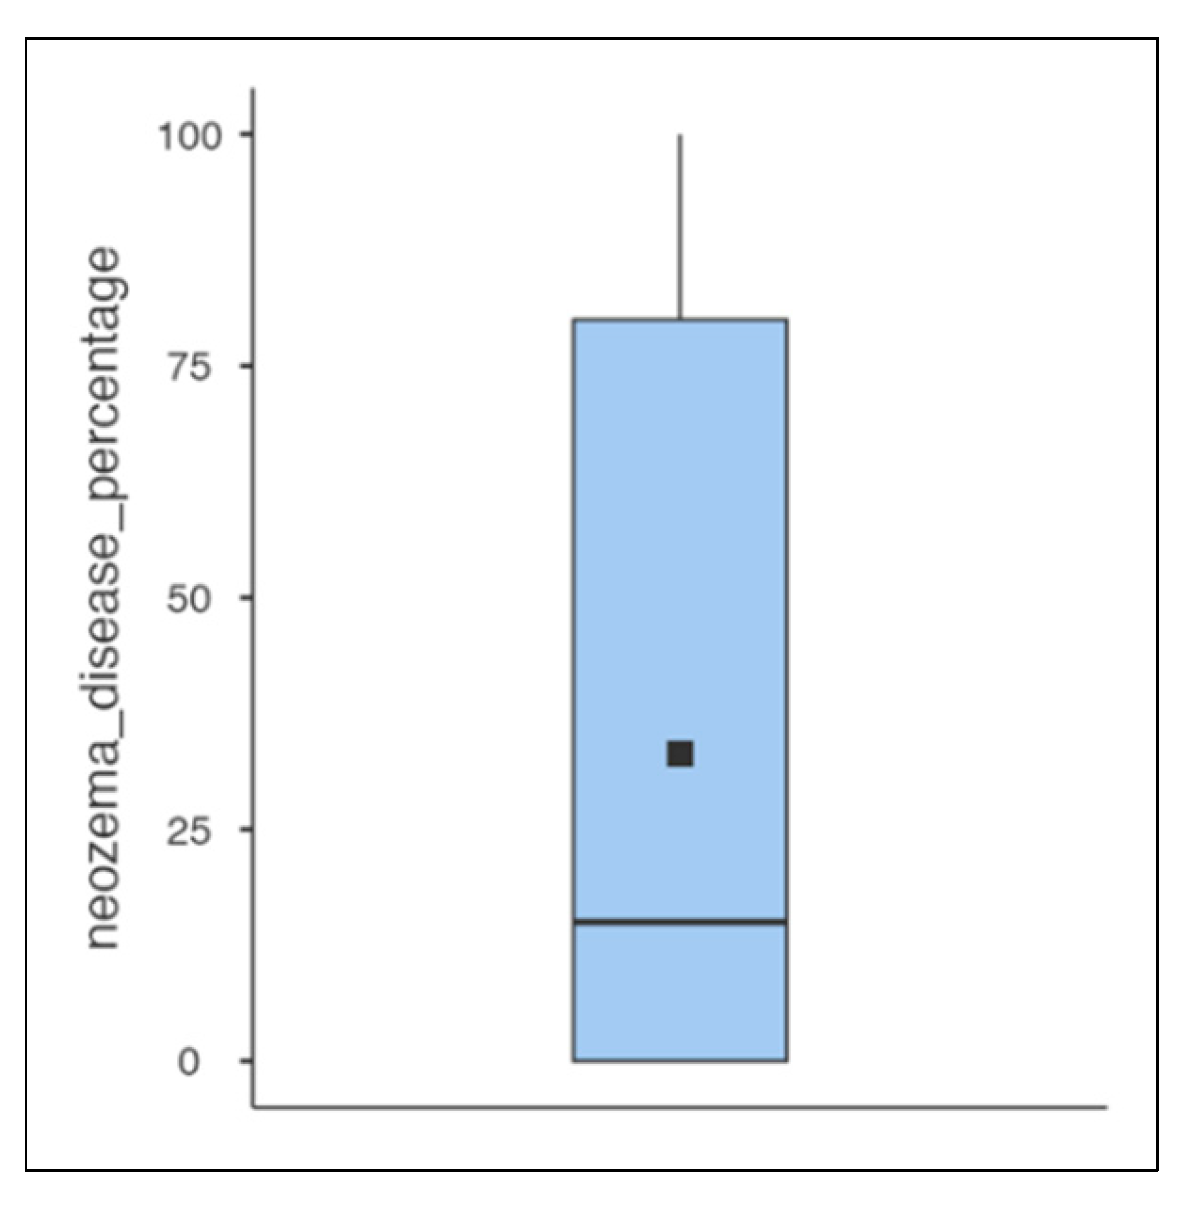
Disclaimer/Publisher’s Note: The statements, opinions and data contained in all publications are solely those of the individual author(s) and contributor(s) and not of MDPI and/or the editor(s). MDPI and/or the editor(s) disclaim responsibility for any injury to people or property resulting from any ideas, methods, instructions or products referred to in the content. |
© 2026 by the authors. Licensee MDPI, Basel, Switzerland. This article is an open access article distributed under the terms and conditions of the Creative Commons Attribution (CC BY) license (http://creativecommons.org/licenses/by/4.0/).
Copyright: This open access article is published under a Creative Commons CC BY 4.0 license, which permit the free download, distribution, and reuse, provided that the author and preprint are cited in any reuse.