

Submitted:
07 September 2026
Posted:
08 September 2026
You are already at the latest version
Abstract
Honey bee colony health is increasingly threatened by multiple stressors, resulting in unsustainable annual mortality rates. Proper nutrition supports colony resilience, but most supplementation strategies are hard to apply at commercial scale. This study is the first commercial-scale evaluation of Reishi (Ganoderma lucidum) extract supplementation, following 326 managed honey bee colonies (108 control, 218 supplemented) across 44 apiary sites over the period 2022–2026. Within each site, colonies were randomly assigned to receive Reishi extract by a dripping method or a syrup-only control. We measured colony and queen longevity, population dynamics, and Varroa destructor management using Kaplan–Meier survival curves, Bayesian Cox proportional hazards models, and a discrete Bayesian network. Supplemented colonies survived a mean of 367 days, compared with 247 days for controls. The 95% credible intervals for the Bayesian CoxPH hazard did not overlap between groups for either colony or queen survival. Querying the trained network showed an average mortality rate of 8% in supplemented colonies versus 14% in controls. That gap widened under Varroa pressure: a 13-percentage-point reduction (7% vs. 20%) when mite loads were rising, and a 23-point reduction (2% vs. 25%) in colonies with stable population size and increasing Varroa drop rates. Linear mixed-effects models on three-month colony-attribute percent changes matched these patterns, with supplementation linked to significant increases in frames of bees (p = 0.004) and frames of brood (p < 0.001). Mutual-information analysis of the network showed colony survival and frames of brood as the attributes most strongly tied to supplementation. These findings suggest that Reishi supplementation is a scalable approach to supporting colony robustness in commercial apiaries.
Keywords:
Apis mellifera
; Ganoderma lucidum
; mycology
; applied research
; Bayesian survival analysis
; discrete Bayesian network
1. Introduction
Global declines in pollinators raise major concerns due to our dependence on managed honey bees for crop pollination [1]. Recent studies have highlighted an increasing demand for pollination services that is not met by current managed honey bee stocks, combined with reductions in wild pollinator populations [2]. High annual colony mortality has been reported in multiple regions, creating additional challenges for the sustainability of agricultural pollination services [3].
Several key factors have been associated with increased colony losses, including Varroa destructor, other diseases and pests, lack of diversified forage sources, climate change, pesticide exposure, air quality, and combinations of these factors [4,5,6,7,8,9,10]. These multiple stressors reduce colony resilience and increase the operational burden on commercial beekeeping operations.
Recent studies suggest that the combined use of targeted supplements and treatments can create interactions between products with adverse effects on colony health [11,12]. Proper nutrition is a core driver of honey bee health [13], immunocompetence [14], and resilience to pests [15]. Unlike treatments that generally target particular pests or diseases, nutrition can have broader effects on colony condition.
Many commercially available supplements consist of targeted dietary components or microbial products. Probiotics are living microorganisms intended to confer a benefit to the host when administered in adequate amounts, whereas prebiotics are non-digestible compounds that selectively support beneficial members of the existing microbiota. While probiotics can be effective against some diseases [16], their performance may depend on regional and seasonal variation in the honey bee microbiota [17,18].
Applied mycology is a candidate approach to supporting colony resilience across diverse stressors. For example, Reishi (Ganoderma lucidum) has been described as a prebiotic in other systems [19,20,21], potentially supporting the microbiota without directly introducing new microbial taxa [22]. Empirical studies supplementing honey bees with diverse mushroom extracts have reported notable outcomes, including reduced Nosema ceranae infection [23] and reduced deformed wing virus load in infected colonies [24], as well as reported effects on Varroa destructor [25]. Specifically, supplementation of Ganoderma lucidum has been reported to reduce the abundance of some viruses associated with Varroa destructor [26].
To date, mushroom extracts evaluated in honey bees have rarely been validated under commercial beekeeping conditions. By leveraging high-resolution data captured at the hive level across routine inspections, we can quantify outcomes under realistic management and environmental variation [9,27,28]. We therefore present a large-scale field study evaluating Reishi extract supplementation and its association with colony and queen longevity, colony population indices, and Varroa-related metrics.
In this field study, we tested an extract made from the fruiting bodies of Ganoderma lucidum (Reishi) as a supplement for managed honey bee colonies. We hypothesized that Reishi supplementation would be associated with increased colony longevity and improved colony performance indices (e.g., frames of bees and brood). We also explored potential associations with honey reserves and colony defensiveness (gentleness/aggressiveness), recognizing that these endpoints may be influenced by multiple factors and should be interpreted cautiously.
2. Materials and Methods
2.1. Mushroom Cultivation
The Ganoderma lucidum strain was selected from the Mycelium Remedium culture library in Montréal (Québec). The mycelium was propagated through a protocol of incubation at 22 : 14 days on YMEA plates, 14 days in 2 g/L liquid malt extract medium, 21 days on rye grains, and 21 days on an agricultural-waste substrate, then fructified in an urban farming greenhouse apparatus (Mycelium Remedium Inc.). The fruiting chamber was maintained at 18– 24 , 60–80% relative humidity, 450–850 ppm CO2, and a 12 h photoperiod at 550 lux for the duration of cultivation. Mushrooms were collected at full maturity (no further growth at the cap margins), sliced to 4 mm thickness, and dehydrated for 72 h at 40 until reaching % moisture.
2.2. Reishi Extract Preparation
Reishi mushrooms were ground into a fine powder and subjected to a double extraction protocol developed internally by Mycelium Remedium Inc. Liposoluble compounds were extracted in 80% ethanol at 65 under 15 psi reflux for 24 h. Spent material was separated and the ethanolic extract was retained.
Hydrosoluble compounds were then extracted from the same material in demineralized water at 45– 85 for 48 h. The two extracts were recombined, ethanol was removed by distillation, and the resulting extract was blended into a sugar-syrup carrier.
2.2.1. Storage Stability and Handling
The extract-in-syrup supplement was prepared in batches and stored under conditions described in the revised protocol (temperature, maximum storage duration, and container type). Prior to application, the supplement was gently agitated to re-homogenize the mixture; we did not observe operationally meaningful separation that prevented dosing when handled as described.
2.3. Reishi Supplementation Method
At each of the 44 sites, colonies were eligible for supplementation events at approximately 10–14 day intervals during the active season (April–September), aligned with routine inspections. At each supplementation event, approximately 50% of colonies at that site were randomly assigned to receive Reishi supplement versus syrup-only control. Random assignment was conducted independently at each supplementation event, which allowed time-varying exposure (i.e., colonies could receive treatment at some events and not others). This design was chosen to emulate realistic commercial supplementation practices and to enable evaluation of time dependence.
For each colony, the beekeeper first performed an inspection and recorded colony attributes. Immediately after inspection, the colony received its assigned supplementation, the hive was closed, and the corresponding data entry was completed.
Treatment colonies received 50 mL of Reishi extract in syrup applied via a dripping method onto the top bars of brood frames; control colonies received 50 mL of syrup alone. The 50 mL dose was selected to (i) standardize delivery at commercial scale, (ii) minimize nutritional confounding from the carrier syrup itself, and (iii) reduce disturbance while providing repeated exposures over the season. We note that this volume is consumed rapidly by productive colonies and is not intended to create a stored reserve.
During the 2022 season, supplementation began in August at the five wintering sites (study initiation in fall 2022). In 2023–2025, supplementation was applied throughout the active season at the inspection-linked interval described above.
2.4. Colony Management
Colonies were wintered outdoors and fed 20 L sugar syrup prior to winter. Varroa management followed the commercial operation’s practices; highly infested “mite bomb” colonies were treated prior to winter when needed. Formic acid and oxalic acid applications were recorded as part of the management history. These treatment records were not used as primary covariates in all models reported here, but are retained in the dataset for transparency and for future/sensitivity analyses.
Queen events (e.g., observed queenlessness and beekeeper interventions such as requeening when performed as part of normal commercial management) were recorded when available through the monitoring system. Queen age and status were therefore treated as time-varying colony characteristics rather than being standardized at baseline; this is discussed as a limitation for causal interpretation over multi-year follow-up.
2.5. Data Collection and Description
All colonies were monitored with the Nectar Technologies system (Nectar Technologies Inc.), which records colony state, inspections, and management actions longitudinally at the hive level. Colonies were tracked from April 2022 through April 2026. All monitored colonies were provided by Miellerie Flavo Inc. (Ascot Corner, Québec).
At each inspection, we recorded frames of bees, frames of brood, frames of honey, queen status, colony state, supplementation status, defensiveness measured as sting count during inspection (capped at 10 stings by protocol), and Varroa drop rate. In some cases, only a subset of attributes were collected due to climatic or operational constraints.
2.5.1. Winter Mortality Checks
Colonies were monitored for survival year-round. During winter , apiaries were visited approximately every two weeks. Colony activity was assessed using a microphone to detect within-hive sound/activity; if no activity was detected, the hive was opened and mortality was confirmed as a deadout. The date of death was recorded as the inspection date of confirmation.
2.5.2. Data Preprocessing (Monthly Time Series)
Raw inspection records were aggregated into a month-end time series for each colony. For each colony and month, we computed (i) a binary colony status variable (alive vs. dead) derived from the recorded alive state within that month, (ii) colony age, and (iii) queen age and queen-state indicators derived from queen-management events (with predefined event labels excluded from defining queen replacement). Supplementation was summarized as the count of recorded Reishi events in that month.
For numeric inspection variables (frames of bees, brood, and honey; brood-pattern score; sting count; Varroa drop), monthly summaries were computed from available within-month observations. Apiary-level interactions were summarized as the number of other colonies present in the same yard during that month (unique hive identities minus one).
2.5.3. Frame of Bees Count
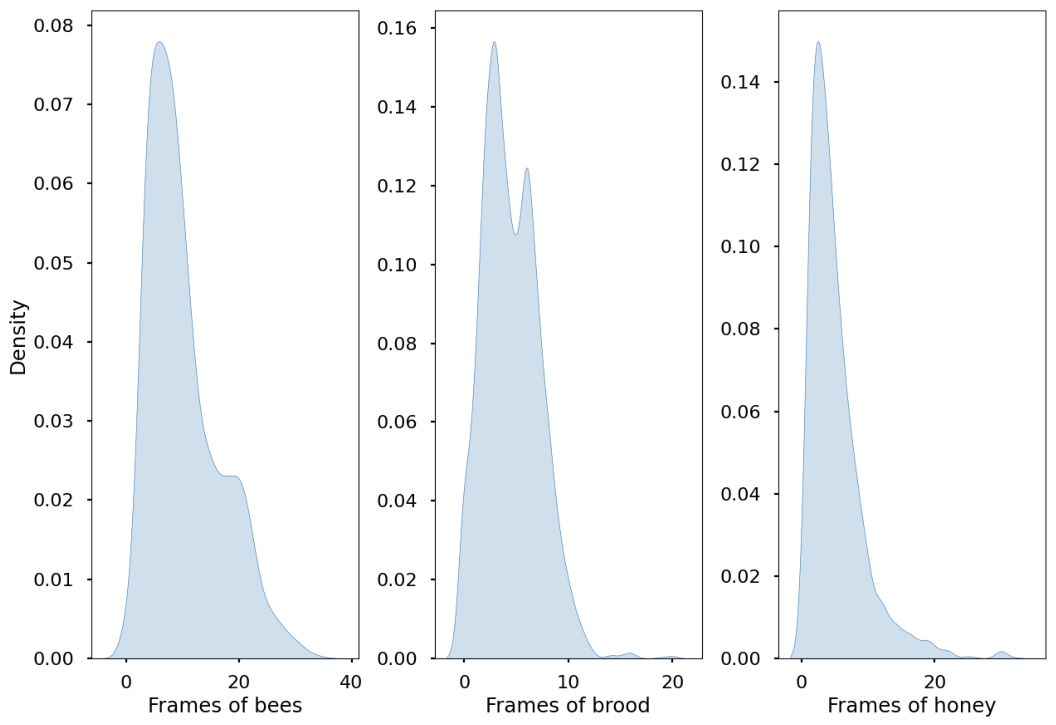
The frames of bees (i.e. FoB), brood and honey were estimated by looking at each frame during the inspection to get an accurate grading. If the frame was not covered fully, the portion of the frame covered was added to the total. Similarly when the structure of the frame was a mixed of honey and brood, the portions were added respectively. See the values distribution in Appendix A.1.
2.5.4. Sting Count (Defensiveness Proxy)
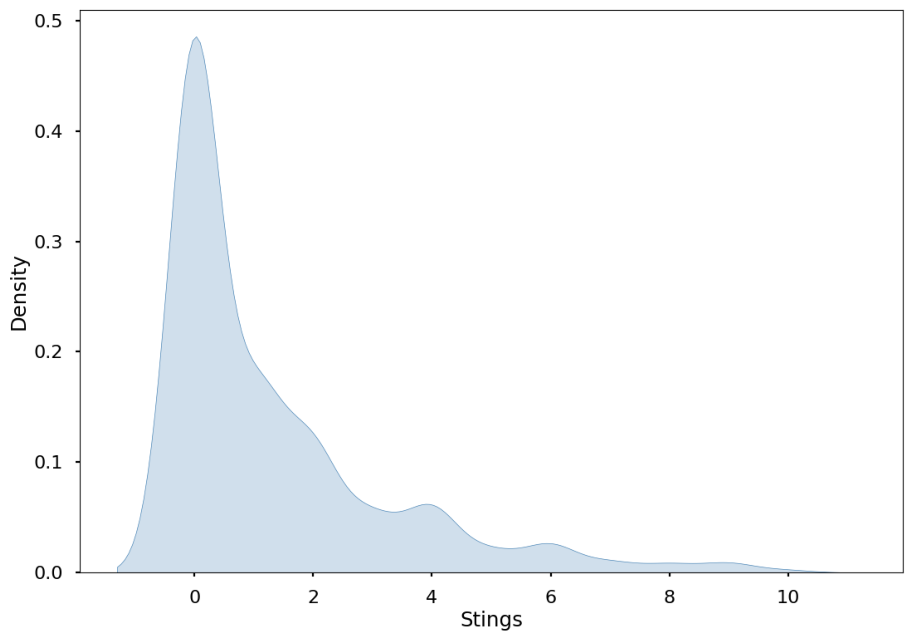
Defensiveness was assessed during inspections without protective equipment using a standardized field protocol. At each inspection, the beekeeper waved a hand over the colony entrance/frames for 10 s and recorded the number of stings received. For safety and standardization, counts were top-coded at 10 stings. In the raw inspection dataset, 246 of 30,246 non-missing observations (0.81%) were recorded at the cap (10 stings). This metric is used here as an operational proxy for defensiveness rather than a mechanistic endpoint, and we interpret any supplementation-related differences cautiously given the small dose and timing of supplementation.
To reduce cross-colony transfer of alarm pheromone cues, hands and tools were washed/cleaned between inspections. The distribution of sting counts is provided in Appendix A.2.
2.5.5. Brood Pattern
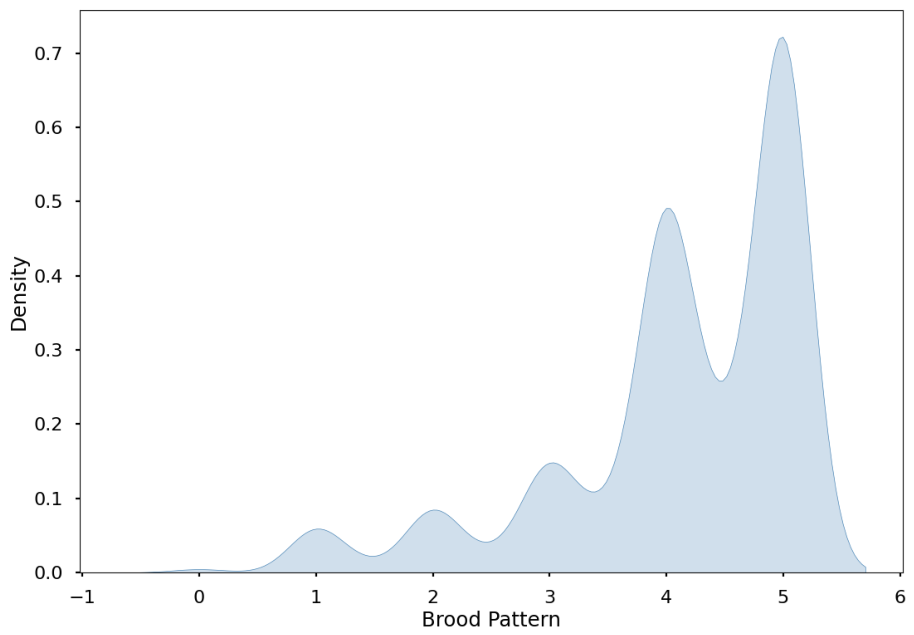
Brood pattern was qualitatively evaluated at each visit on a 1–5 scale. A score of 5 represents dense brood with a rim of honey and pollen reserves adjacent to brood; a score of 1 represents a highly spotty brood pattern. The distribution is provided in Appendix A.3.
2.5.6. Varroa Drop Rate
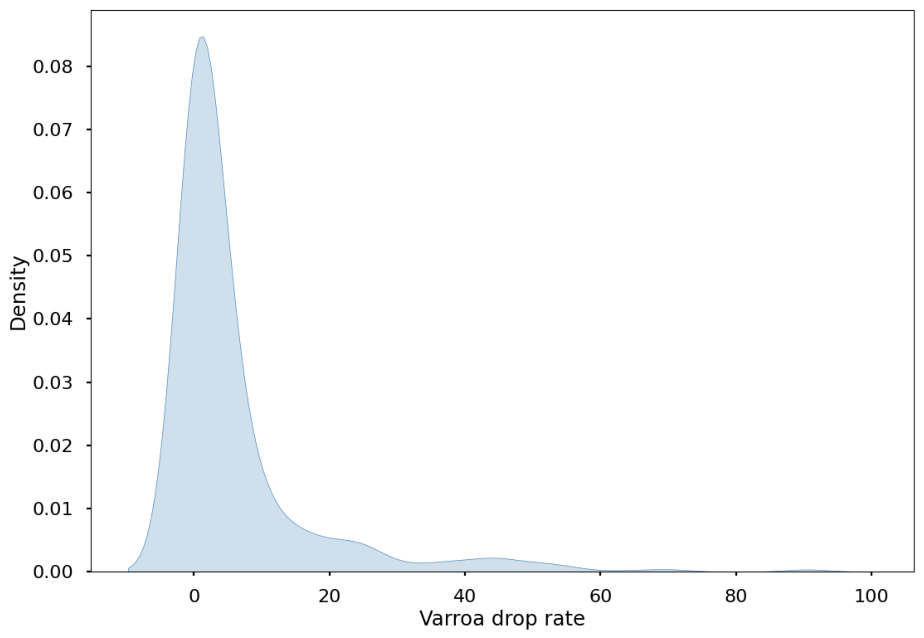
Varroa drop rate was estimated at each visit by counting mites on the bottom board. Bottom boards were cleaned after each inspection. The distribution is provided in Appendix A.4.
2.6. Statistical Analysis
In all analyses, supplementation exposure was summarized as the summed number of applications within a three-month rolling window to reduce survivorship bias (colonies that survive longer have more opportunities to receive supplementation). Colonies tracked for less than 45 days were excluded to reduce bias from early management failures (e.g., split failures) unrelated to colony collapse.
2.6.1. Baseline Balance
Because supplementation assignment could vary over time (re-randomized at each event), we report descriptive baseline balance between colonies that were ever supplemented versus never supplemented. Baseline values were defined as the last observation prior to the first recorded supplementation event for ever-supplemented colonies (and the first observation for never-supplemented colonies). Summary statistics and standardized mean differences are reported in Appendix Table A1.
2.6.2. Colony and Queen Longevity
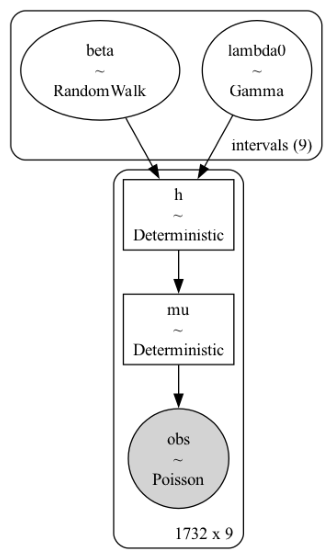
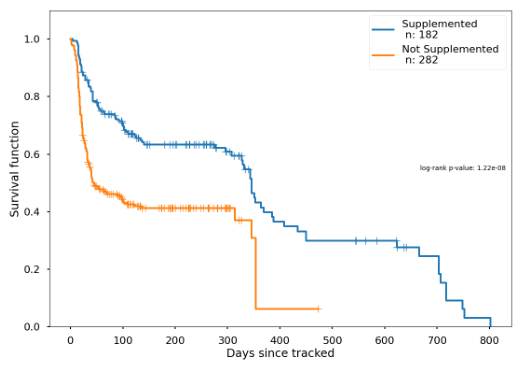
Colony and queen longevity were evaluated using Kaplan–Meier estimators (with log-rank tests for group comparisons) and Bayesian Cox proportional hazards (CoxPH) models. For Kaplan–Meier summaries, colonies were classified as supplemented if their cumulative supplementation count over the tracking period exceeded 1 event; queens were classified as supplemented if their associated colony received any supplementation event. We fitted both a standard CoxPH model (Eq. 1) [29] and an extended CoxPH model with time-varying covariates (Eq. 2):
Bayesian models were fitted in PyMC (v5.25.1) using Hamiltonian Monte Carlo (NUTS). For the time-varying survival specification, we used a piecewise baseline hazard with interval-specific Gamma priors and a Gaussian random walk prior on the time-varying supplementation effect (to encourage smooth temporal variation). Priors were specified a priori (i.e., not derived from exploratory analyses on the same dataset) to avoid data leakage.
Figure 1.
CoxPH survival model definition
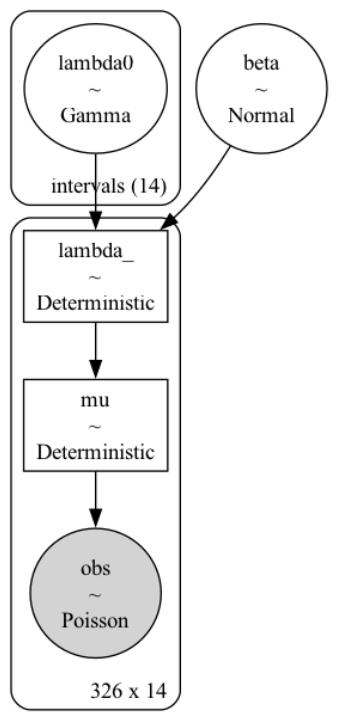
We also explored competing-risk formulations, but ultimately analyzed queen and colony longevity in separate models because some colony failures are plausibly mediated by queen failure. We corrected records where colonies were logged as deadouts without an explicit prior “queenless” state to improve robustness of queen-status labels.
Figure 2.
Time-varying CoxPH survival model definition
2.6.3. Colony Attributes (Delta Analysis)
Colony attributes were analyzed as changes (deltas) rather than absolute values. Using percent-change deltas partially mitigates baseline (intercept) differences between colonies and focuses inference on within-colony change rates rather than absolute levels. For each colony and attribute, we computed three-month percent changes using the pct_change(3) method in pandas library for frames of bees, frames of brood, frames of honey, Varroa drop rate, brood-pattern score, and sting count. These delta variables can be negative (decreases), zero (no change), or positive (increases).
To align supplementation exposure with subsequent changes, we defined a three-month rolling supplementation count and shifted it forward by one time step (“applied_previous_month”): for each colony, Reishi supplementation was summed over a rolling window of length 3 with a minimal period of 1 and then shifted using shift(-1) in pandas. For plotting, exposure was binarized (Supplemented if , otherwise Control).
Because percent-change calculations can yield missing values and infinities, we replaced missing values with 0 and converted infinite values to 0 prior to model fitting, consistent with the implemented analysis script.
For each attribute, we fitted linear mixed-effects models (Eq. 3) with a colony-specific random intercept (group = hive identity) and the binary supplementation exposure as a fixed effect:
Because repeated monthly measurements within a colony are likely temporally correlated, we interpret mixed-model p-values cautiously and treat them as supportive rather than definitive. Models were fitted with the statsmodels library using Restricted Maximum Likelihood.
2.6.4. Bayesian Network for Colony Attribute Dynamics
To integrate multiple colony attributes within a single interpretable framework, we built a discrete Bayesian network linking supplementation exposure, colony performance indices, Varroa-related metrics, and survival. The network was built on monthly changes computed from inspection time series.
For frames of bees, brood, and honey, we forward-filled missing values within colony, computed percent change, and then applied a rolling mean over a three month window. Varroa drop rate was transformed similarly, using a three-step percent change followed by a rolling mean. Supplementation exposure was encoded as a three-month rolling sum shifted forward to align with subsequent outcomes.
Continuous change variables were discretized into three states (decreased / stable / increased) based on sign. Colony mortality was encoded as a binary variable derived from colony alive-state coding in the processed dataset (dead if the monthly state indicator was ). Queen age was binned into yearly categories. The fitted network structure (Figure 3) was specified from a combination of prior biological knowledge and study design assumptions; sting count was not included in the network.
Parameter learning was performed in pgmpy (v1.0.0) using a Bayesian estimator with a Bayesian Dirichlet equivalent uniform (BDeu) prior (equivalent sample size = 10). We evaluated predictive performance for colony mortality with 5-fold cross-validation (structure fixed; CPDs refit per fold). Discrimination was good (ROC-AUC = 0.83), whereas threshold-based classification at 0.5 was limited by class imbalance (F1 = 0.10; recall = 0.06); therefore, we emphasize probabilistic outputs (e.g., conditional mortality probabilities) rather than binary classification. We additionally assessed uncertainty of conditional mortality probabilities using bootstrap refits of CPDs; bootstrap 95% intervals for key scenarios are reported in Appendix Table A2.
3. Results
3.1. Effect of Reishi Supplementation on Colony and Queen Longevity
For both colony and queen longevity, the standard CoxPH model was selected given its better convergence and the lack of clear time dependence in the Kaplan–Meier curves (Appendix C). Posterior estimates from the Bayesian CoxPH models indicate differences between supplemented and control groups (Figure 4 and Figure 5). Because supplementation exposure is time-varying and colonies could cross over between supplemented and control status at different supplementation events, these results are interpreted as associations under the implemented design rather than as definitive causal effects.
3.2. Effect of Reishi Supplementation on Colony Dynamics
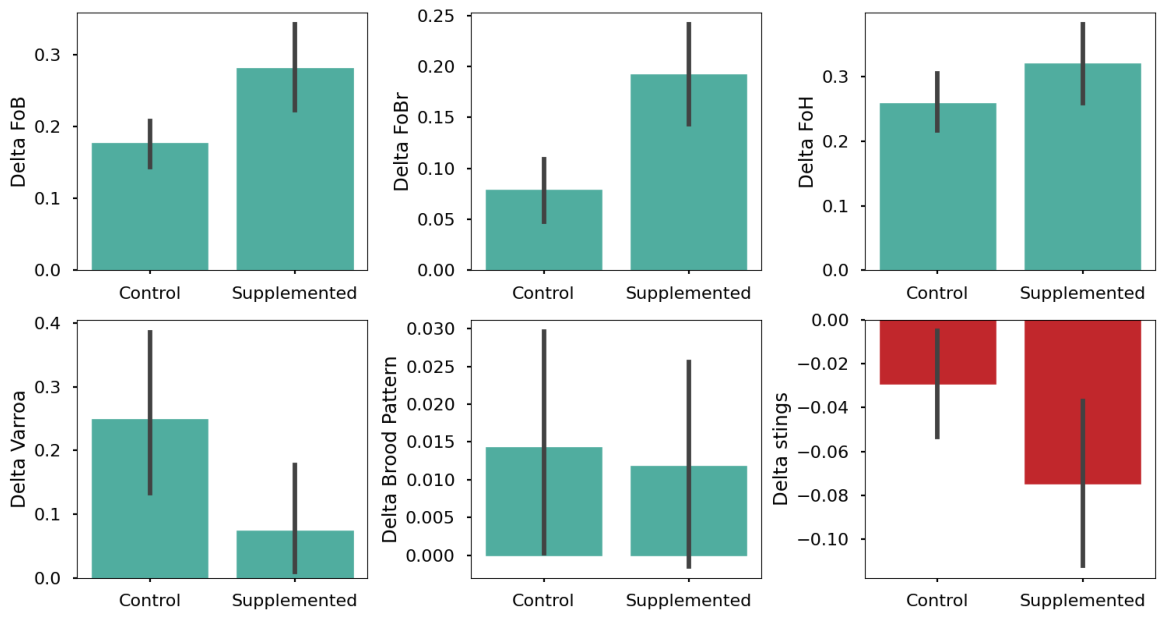
Differences in mean three-month percent-change values (pct_change(3)) between supplemented and control colonies were detected for frames of bees and frames of brood (Appendix B). Sensitivity analyses using alternative within-colony correlation structures (random-slope mixed models; GEE with exchangeable and AR(1) correlations) yielded consistent positive supplementation coefficients across specifications for both frames of bees and frames of brood (Appendix Table A3 and Table A4). Patterns were also observed for Varroa drop rate and honey-store changes, whereas brood-pattern scores were broadly similar between groups.
Figure 6.
Three-month percent change (delta) in hive attributes for supplemented and control colonies. Negative values (red bars) indicate decreases relative to the value three months earlier, while positive values (green bars) indicate an increase.
Figure 6.
Three-month percent change (delta) in hive attributes for supplemented and control colonies. Negative values (red bars) indicate decreases relative to the value three months earlier, while positive values (green bars) indicate an increase.
3.3. Discrete Bayesian Network
We used the trained Bayesian network to estimate conditional mortality probabilities under different combinations of colony-state changes. Table 1 summarizes model-based conditional mortality probabilities (in %) for each scenario.
Across scenarios, the network estimates lower mortality probabilities for supplemented colonies in most strata, with the magnitude of the difference varying by frames-of-bees change and Varroa drop-rate change. Bootstrap refits indicate that these conditional probability estimates are directionally consistent across resamples, with wider uncertainty in higher-mortality strata (Appendix A2). These quantities are conditional model outputs and are presented as decision-support summaries of learned dependencies (not as mechanistic causal estimates).
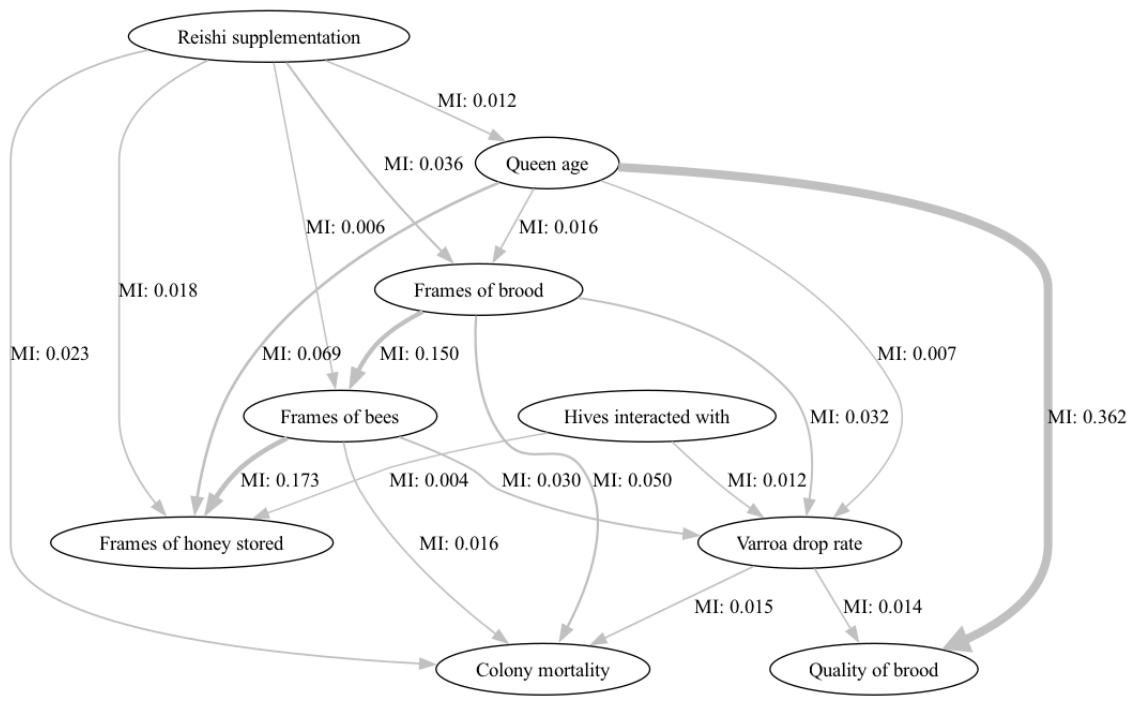
We report mutual information values computed from the Bayesian network after parameter learning. Mutual information summarizes the strength of statistical dependence between pairs of variables (higher values indicate stronger dependence), and can be used as a descriptive check that learned relationships align with expected colony dynamics. In this network, the strongest dependencies involving supplementation were observed with survival and frames of brood, with additional dependence with honey stores, queen longevity, and frames of bees. Strong expected relationships were also present among frames of brood, frames of bees, and frames of honey.
Figure 7.
Bayesian network annotated with mutual information values on edges (higher values indicate stronger dependence).
Figure 7.
Bayesian network annotated with mutual information values on edges (higher values indicate stronger dependence).
4. Discussion
This study presents a commercial-scale evaluation of Reishi (Ganoderma lucidum) extract supplementation in managed honey bee colonies. Evidence is convergent across multiple analytical approaches: survival analyses (Kaplan–Meier/log-rank and Bayesian CoxPH), delta models of colony attribute change, and a discrete Bayesian network. The consistency of these independent views of the data supports a robust association between supplementation and improved colony outcomes in this commercial setting.
Uncertainty in Bayesian network conditional mortality estimates was quantified by bootstrap refits; the corresponding intervals (Table A2; Table A1) are generally consistent with the direction of the main patterns reported in Table 1.
Given the time-varying supplementation design (re-randomization at each event, allowing cross-over) and the observational complexity of commercial management, we interpret these findings as associations consistent with a beneficial effect, rather than as definitive causal estimates.
Although no strong time-varying effect was detected in survival curves, the three-month rolling exposure summary reduced survivorship bias and provided a practical representation of recent supplementation history. Operationally, the supplementation protocol can be integrated into routine inspections and feeding events.
The observed associations with queen longevity may reflect broader improvements in colony condition, as disease and stressors can impair queen performance [30]. Relationships among brood production, colony strength, and Varroa destructor dynamics are complex [31]; in our data, colonies with increasing brood often exhibited slower increases in Varroa drop rates under supplementation, suggesting a potential buffering effect that warrants controlled follow-up.
Prior work has suggested that Ganoderma lucidum extracts can reduce the load of some viruses associated with Varroa [26], and compounds such as chitin-derived components may influence wound healing [32]. Reishi extracts are also reported to contain amino acids [33], and nutritional components could plausibly contribute to observed colony growth dynamics [34,35].
We observed inconsistent effects on honey stores, despite the typical relationship between colony strength and production [36]. This may reflect measurement limitations in field conditions and/or allocation of resources toward brood and adult biomass rather than storage.
Sterols are micronutrient lipids that help build cell membranes, act as signaling molecules, and serve as precursors to steroid hormones [37]. In honey bees, phytosterols such as 24-methylenecholesterol have been linked to colony growth and worker longevity [38,39]. Because insects cannot synthesize sterols de novo, colonies must obtain phytosterols from pollen resources [38]. Variation in pollen sterol composition and simplified forage landscapes may limit access to some sterols [40]; therefore, one hypothesis is that Reishi extract could contribute sterol-like nutritional components that support colony growth, which should be tested directly in controlled studies.
5. Limitations
This study was conducted under commercial beekeeping conditions and therefore includes time-varying management decisions and environmental heterogeneity that can complicate causal inference. First, supplementation was randomized independently at each supplementation event, allowing treatment cross-over over time. While we summarized recent exposure using a three-month rolling window, baseline balance and time-dependent confounding cannot be fully ruled out. Baseline balance comparisons (Appendix Table A1) indicate non-negligible differences for some attributes (e.g., frames of brood and hive age), reinforcing the need for cautious causal interpretation.
Second, repeated measurements within colonies are likely temporally autocorrelated. We therefore assessed sensitivity of delta-model inferences to alternative correlation structures (mixed models with random slopes for time; GEE with exchangeable and AR(1) working correlations), and report these results in Appendix Table A3 and Table A4.
Third, winter mortality dates were monitored year-round with approximately biweekly winter checks (acoustic activity screening followed by opening and confirmation when inactive), which reduces concern about interval censoring in survival analyses.
Finally, Bayesian analyses are sensitive to prior choices. We used weakly informative priors and conducted prior-sensitivity checks, but confirmatory conclusions should be supported by additional independent datasets and/or pre-registered analyses.
6. Conclusions
Reishi (Ganoderma lucidum) extract supplementation was associated with improved colony and queen survival and with more favorable colony population dynamics in this commercial-scale field dataset. Because supplementation exposure was time-varying and implemented via repeated event-level randomization, further work (including controlled trials and additional field validation under alternative management regimes) is needed to confirm causality, optimize dosing, and identify mechanisms.
Author Contributions
For research articles with several authors, a short paragraph specifying their individual contributions must be provided. The following statements should be used “Conceptualization, N.C and G.R.; methodology, N.C.; software, N.C.; validation, G.R, T.M, J.L., M.F.F. and B.H; formal analysis, N.C. and M.F.F.; investigation, N.C.; resources, N.C.; data curation, N.C. and E.H.; writing—original draft preparation, N.C.; writing—review and editing, T.M, E.H., M.F.F., G.R. and B.H.; visualization, N.C.; project administration, N.C. and G.R.; funding acquisition, N.C. and G.R.
Data Availability Statement
Dataset and code are available at https://github.com/NicoCoallier/cubee
Acknowledgments
We would like to honor the memory of Alexandre Coallier who truly believed in our project and allowed us to achieve this work with his financial support and creative vision. He heavily contributed to this research by inspiring the N.C. and G.R.
Conflicts of Interest
N.C. is the CTO of Nectar and the co-owner of Miellerie Flavo which provided the research hives and the tracking software. M.F.F. is a data scientist at Nectar. G.R. is the owner of Mycelium Remedium. N.C. and G.R. are the onwer of a Cubee, a company partly funding this research.
Appendix A. Baseline Balance

Table A1.
Baseline balance between colonies ever supplemented versus never supplemented. Baseline is defined as the last observation prior to the first supplementation event for ever-supplemented colonies, and the first observation for never-supplemented colonies. Values are mean (SD) with standardized mean difference (SMD).
Table A1.
Baseline balance between colonies ever supplemented versus never supplemented. Baseline is defined as the last observation prior to the first supplementation event for ever-supplemented colonies, and the first observation for never-supplemented colonies. Values are mean (SD) with standardized mean difference (SMD).
| Variable | Ever supplemented | Never supplemented | SMD |
|---|---|---|---|
| Frames of bees (FoB) | 7.73 (5.55) | 5.42 (2.97) | 0.52 |
| Frames of brood (FoBr) | 4.18 (2.59) | 2.54 (1.32) | 0.80 |
| Frames of honey (FoH) | 3.57 (2.70) | 2.55 (1.51) | 0.47 |
| Brood pattern score | 4.27 (0.84) | 4.17 (0.91) | 0.12 |
| Sting count | 1.03 (1.60) | 1.53 (2.26) | −0.25 |
| Hive interactions (count) | 16.38 (11.22) | 18.19 (12.59) | −0.15 |
| Hive age (days) | 70.12 (98.94) | 11.43 (9.92) | 0.83 |
| Queen age (days) | 59.50 (94.70) | 8.94 (7.79) | 0.75 |
| Varroa drop rate | 0.96 (1.68) | 2.00 (–) | – |
Appendix B. Data Distribution
Appendix B.1. Frames of Bees, Brood and Honey Distribution
Figure A1.
Distribution of frames of bees, brood and honey.
Appendix B.2. Stings Distribution
Figure A2.
Distribution of stings count.
Appendix B.3. Brood Pattern Distribution
Figure A3.
Distribution of brood pattern.
Appendix B.4. Varroa Distribution
Figure A4.
Distribution of varroa drop rate.
Appendix C. Bayesian Network Validation
Appendix C.1. Bootstrap Uncertainty for Conditional Mortality Probabilities
Table A2 reports bootstrap summaries for model-based conditional mortality probabilities for the same scenarios as Table 1. Values are reported as mean probability and 95% bootstrap interval.
Table A2.
Bootstrap summaries of conditional mortality probabilities from the Bayesian network. Evidence variables are the discretized three-month change states for frames of bees and Varroa drop rate. CI: bootstrap 2.5th and 97.5th percentiles.
Table A2.
Bootstrap summaries of conditional mortality probabilities from the Bayesian network. Evidence variables are the discretized three-month change states for frames of bees and Varroa drop rate. CI: bootstrap 2.5th and 97.5th percentiles.
| Group | Frames of bees | Varroa drop rate | Mean | CI low | CI high |
|---|---|---|---|---|---|
| Supplemented | Decreased | Increased | 0.069 | 0.045 | 0.098 |
| Supplemented | Stable | Increased | 0.019 | 0.011 | 0.046 |
| Supplemented | Increased | Increased | 0.023 | 0.008 | 0.055 |
| Supplemented | Decreased | Decreased | 0.012 | 0.005 | 0.030 |
| Supplemented | Stable | Decreased | 0.013 | 0.005 | 0.025 |
| Supplemented | Increased | Decreased | 0.018 | 0.010 | 0.027 |
| Control | Decreased | Increased | 0.203 | 0.129 | 0.281 |
| Control | Stable | Increased | 0.276 | 0.140 | 0.418 |
| Control | Increased | Increased | 0.064 | 0.006 | 0.134 |
| Control | Decreased | Decreased | 0.116 | 0.039 | 0.198 |
| Control | Stable | Decreased | 0.160 | 0.016 | 0.361 |
| Control | Increased | Decreased | 0.044 | 0.011 | 0.079 |
Appendix D. Delta-Model Sensitivity Analyses
Appendix D.1. Sensitivity to Within-Colony Correlation Assumptions
To assess sensitivity of the estimated supplementation effect to within-colony correlation assumptions, we refit delta models using alternative approaches: (i) mixed-effects models with random intercept only, (ii) mixed-effects models with a random slope for time, and generalized estimating equations (GEE) with (iii) exchangeable and (iv) AR(1) working correlation structures. The key sensitivity objective is whether the sign and magnitude of the supplementation coefficient are stable across specifications. Table A3 summarizes the estimated coefficient for supplementation exposure (applied_previous_month) across outcomes.
Table A3.
Sensitivity analyses for delta models: estimated supplementation coefficient (SE) for exposure (applied_previous_month) under alternative correlation structures.
Table A3.
Sensitivity analyses for delta models: estimated supplementation coefficient (SE) for exposure (applied_previous_month) under alternative correlation structures.
| Outcome | MixedLM (RI) | MixedLM (RI+RS time) | GEE (Exch.) | GEE (AR1) |
|---|---|---|---|---|
| FoB | () | () | () | () |
| FoBr | () | () | () | () |
| FoH | () | () | () | () |
| Varroa | () | () | () | () |
| stings | () | () | () | () |
| brood pattern | () | () | () | () |
Table A4.
Sensitivity analyses for delta models: p-values for the supplementation exposure (applied_previous_month) under alternative correlation structures corresponding to Table A3.
Table A4.
Sensitivity analyses for delta models: p-values for the supplementation exposure (applied_previous_month) under alternative correlation structures corresponding to Table A3.
| Outcome | MixedLM (RI) | MixedLM (RI+RS time) | GEE (Exch.) | GEE (AR1) |
|---|---|---|---|---|
| FoB | 0.0037 | 0.0058 | 0.0246 | 0.0139 |
| FoBr | 0.00116 | 0.00105 | ||
| FoH | 0.134 | 0.0085 | 0.279 | 0.157 |
| Varroa | 0.0447 | 0.0688 | 0.0427 | 0.0495 |
| stings | 0.050 | 0.163 | 0.103 | 0.172 |
| brood pattern | 0.600 | 0.801 | 0.653 | 0.833 |
Appendix E. Mixed Model on Deltas Results
Appendix E.1. Change in Frames of Bees
Table A5.
Mixed Linear Model Regression Results
| Model: | MixedLM | Dependent Variable: | delta_fob |
| No. Observations: | 2820 | Method: | REML |
| No. Groups: | 307 | Scale: | 0.6731 |
| Min. group size: | 2 | Log-Likelihood: | -3477.6761 |
| Max. group size: | 33 | Converged: | Yes |
| Mean group size: | 9.2 |
| Coef. | Std.Err. | z | Pz| | [0.025 | 0.975] | |
| Intercept | 0.176 | 0.022 | 8.114 | 0.000 | 0.133 | 0.218 |
| applied_previous_month | 0.095 | 0.033 | 2.902 | 0.004 | 0.031 | 0.159 |
| hid Var | 0.016 | 0.009 |
Appendix E.2. Change in Frames of Brood
Table A6.
Mixed Linear Model Regression Results
| Model: | MixedLM | Dependent Variable: | delta_fobr |
| No. Observations: | 2820 | Method: | REML |
| No. Groups: | 307 | Scale: | 0.5199 |
| Min. group size: | 2 | Log-Likelihood: | -3111.0948 |
| Max. group size: | 33 | Converged: | Yes |
| Mean group size: | 9.2 |
| Coef. | Std.Err. | z | Pz| | [0.025 | 0.975] | |
| Intercept | 0.076 | 0.019 | 4.026 | 0.000 | 0.039 | 0.113 |
| applied_previous_month | 0.114 | 0.029 | 3.977 | 0.000 | 0.058 | 0.170 |
| hid Var | 0.011 | 0.008 |
Appendix E.3. Change in Frames of Honey Stored
Table A7.
Mixed Linear Model Regression Results
| Model: | MixedLM | Dependent Variable: | delta_foh |
| No. Observations: | 2820 | Method: | REML |
| No. Groups: | 307 | Scale: | 0.9512 |
| Min. group size: | 2 | Log-Likelihood: | -3972.7851 |
| Max. group size: | 33 | Converged: | Yes |
| Mean group size: | 9.2 |
| Coef. | Std.Err. | z | Pz| | [0.025 | 0.975] | |
| Intercept | 0.248 | 0.026 | 9.386 | 0.000 | 0.196 | 0.300 |
| applied_previous_month | 0.058 | 0.039 | 1.497 | 0.134 | -0.018 | 0.135 |
| hid Var | 0.030 | 0.011 |
Appendix E.4. Change in Stings
Table A8.
Mixed Linear Model Regression Results
| Model: | MixedLM | Dependent Variable: | delta_stings |
| No. Observations: | 2820 | Method: | REML |
| No. Groups: | 307 | Scale: | 0.2967 |
| Min. group size: | 2 | Log-Likelihood: | -2325.3141 |
| Max. group size: | 33 | Converged: | Yes |
| Mean group size: | 9.2 |
| Coef. | Std.Err. | z | Pz| | [0.025 | 0.975] | |
| Intercept | -0.026 | 0.014 | -1.788 | 0.074 | -0.054 | 0.002 |
| applied_previous_month | -0.042 | 0.022 | -1.956 | 0.050 | -0.085 | 0.000 |
| hid Var | 0.008 | 0.005 |
Appendix E.5. Change in Varroa Drop Rate
Table A9.
Mixed Linear Model Regression Results
| Model: | MixedLM | Dependent Variable: | delta_varroa |
| No. Observations: | 2820 | Method: | REML |
| No. Groups: | 307 | Scale: | 5.0818 |
| Min. group size: | 2 | Log-Likelihood: | -6350.6103 |
| Max. group size: | 33 | Converged: | No |
| Mean group size: | 9.2 |
| Coef. | Std.Err. | z | Pz| | [0.025 | 0.975] | |
| Intercept | 0.267 | 0.064 | 4.196 | 0.000 | 0.142 | 0.392 |
| applied_previous_month | -0.184 | 0.092 | -2.008 | 0.045 | -0.363 | -0.004 |
| hid Var | 0.248 | 0.035 |
Appendix E.6. Change in Quality of Brood
Table A10.
Mixed Linear Model Regression Results
| Model: | MixedLM | Dependent Variable: | delta_brood_pattern |
| No. Observations: | 2820 | Method: | REML |
| No. Groups: | 307 | Scale: | 0.0717 |
| Min. group size: | 2 | Log-Likelihood: | -343.2406 |
| Max. group size: | 33 | Converged: | Yes |
| Mean group size: | 9.2 |
| Coef. | Std.Err. | z | Pz| | [0.025 | 0.975] | |
| Intercept | 0.014 | 0.007 | 1.909 | 0.056 | -0.000 | 0.029 |
| applied_previous_month | -0.006 | 0.011 | -0.525 | 0.600 | -0.027 | 0.016 |
| hid Var | 0.003 | 0.004 |
Appendix F. Kaplan Meier Results on Colonies and Queens
Supplemented queens and colonies have a statistically significant higher survival and longevity (p-value < 0.01). The survival curves don’t overlap suggesting no time dependence in both cases.
Figure A5.
Colony Kaplan Meier survival curve
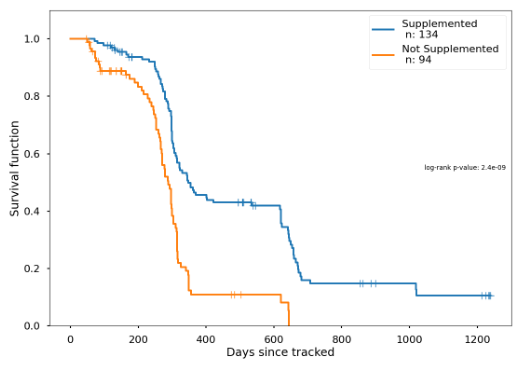
Figure A6.
Queen Kaplan Meier survival curve
References
- Potts, S.G.; Roberts, S.P.M.; Dean, R.; Marris, G.; Brown, M.A.; Jones, R.; Neumann, P.; Settele, J. Declines of managed honey bees and beekeepers in Europe. J. Apic. Res. 2010, 49, 15–22. [CrossRef]
- Mashilingi, S.K.; Zhang, H.; Garibaldi, L.A.; An, J. Honeybees are far too insufficient to supply optimum pollination services in agricultural systems worldwide. Agric. Ecosyst. Environ. 2022, 335, 108003. [CrossRef]
- Aurell, D.; Bruckner, S.; Wilson, M.; Steinhauer, N.; Williams, G.R. A national survey of managed honey bee colony losses in the USA: Results from the Bee Informed Partnership for 2020–21 and 2021–22. J. Apic. Res. 2024, 63, 1–14. [CrossRef]
- Le Conte, Y.; Ellis, M.; Ritter, W. Varroa mites and honey bee health: can Varroa explain part of the colony losses? Apidologie 2010, 41, 353–363.
- Smith, K.M.; Loh, E.H.; Rostal, M.K.; Zambrana-Torrelio, C.M.; Mendiola, L.; Daszak, P. Pathogens, pests, and economics: drivers of honey bee colony declines and losses. EcoHealth 2013, 10, 434–445. [CrossRef]
- Gray, A.; Brodschneider, R.; Adjlane, N.; Ballis, A.; Brusbardis, V.; Charrière, J.D.; Chlebo, R.; F. Coffey, M.; Cornelissen, B.; Amaro da Costa, C.; et al. Loss rates of honey bee colonies during winter 2017/18 in 36 countries participating in the COLOSS survey, including effects of forage sources. Journal of Apicultural Research 2019, 58, 479–485. [CrossRef]
- Le Conte, Y.; Navajas, M.; et al. Climate change: impact on honey bee populations and diseases. Revue Scientifique et Technique-Office International des Epizooties 2008, 27, 499–510.
- Zhang, G.; Kersten, M.; Owen, A.; Skidmore, A. Honey bee foraging and pesticide exposure in a desert urban agroecosystem. Ecotoxicol. Environ. Saf. 2023, 249, 114472. [CrossRef]
- Coallier, N.; Perez, L.; Franco, M.F.; Cuellar, Y.; Vadnais, J. Poor air quality raises mortality in honey bees, a concern for all pollinators. Commun. Earth Environ. 2025, 6, 126. [CrossRef]
- Vanengelsdorp, D.; Evans, J.D.; Saegerman, C.; Mullin, C.; Haubruge, E.; Nguyen, B.K.; Frazier, M.; Frazier, J.; Cox-Foster, D.; Chen, Y.; et al. Colony collapse disorder: a descriptive study. PLoS One 2009, 4, e6481. [CrossRef]
- Johnson, R.M.; Dahlgren, L.; Siegfried, B.D.; Ellis, M.D. Acaricide, fungicide and drug interactions in honey bees (Apis mellifera). PloS one 2013, 8, e54092. [CrossRef]
- MIAO, C.; Yang, J.; HUANG, X.; XUN, L.; HU, Z. Time-dose-mortality of formic acid and amitraz on western honeybee, Apis mellifera ligustica. Chinese Journal of Pesticide Science 2021, 23, 131–138.
- Branchiccela, B.; Castelli, L.; Corona, M.; Díaz-Cetti, S.; Invernizzi, C.; Martínez De La Escalera, G.; Mendoza, Y.; Santos, E.; Silva, C.; Zunino, P.; et al. Impact of nutritional stress on the honeybee colony health. Scientific reports 2019, 9, 10156. [CrossRef]
- Alaux, C.; Ducloz, F.; Crauser, D.; Le Conte, Y. Diet effects on honeybee immunocompetence. Biology letters 2010, 6, 562–565. [CrossRef]
- DeGrandi-Hoffman, G.; Chen, Y.; Huang, E.; Huang, M.H. The effect of diet on protein concentration, hypopharyngeal gland development and virus load in worker honey bees (Apis mellifera L.). Journal of insect physiology 2010, 56, 1184–1191. [CrossRef]
- Borges, D.; Guzman-Novoa, E.; Goodwin, P.H. Effects of prebiotics and probiotics on honey bees (Apis mellifera) infected with the microsporidian parasite Nosema ceranae. Microorganisms 2021, 9, 481. [CrossRef]
- Almeida, E.L.; Ribiere, C.; Frei, W.; Kenny, D.; Coffey, M.F.; O’Toole, P.W. Geographical and seasonal analysis of the honeybee microbiome. Microbial Ecology 2023, 85, 765–778. [CrossRef]
- Hamdi, C.; Balloi, A.; Essanaa, J.; Crotti, E.; Gonella, E.; Raddadi, N.; Ricci, I.; Boudabous, A.; Borin, S.; Manino, A.; et al. Gut microbiome dysbiosis and honeybee health. Journal of applied entomology 2011, 135, 524–533. [CrossRef]
- Zheng, M.; Pi, X.; Li, H.; Cheng, S.; Su, Y.; Zhang, Y.; Man, C.; Jiang, Y. Ganoderma spp. polysaccharides are potential prebiotics: a review. Critical reviews in food science and nutrition 2024, 64, 909–927. [CrossRef]
- Delzenne, N.M.; Bindels, L.B. Ganoderma lucidum, a new prebiotic agent to treat obesity? Nature reviews Gastroenterology & hepatology 2015, 12, 553–554. [CrossRef]
- Yang, K.; Zhang, Y.; Cai, M.; Guan, R.; Neng, J.; Pi, X.; Sun, P. In vitro prebiotic activities of oligosaccharides from the by-products in Ganoderma lucidum spore polysaccharide extraction. RSC advances 2020, 10, 14794–14802. [CrossRef]
- Huang, R.; Yin, Y.; Wu, G.; Zhang, Y.; Li, T.; Li, L.; Li, M.; Tang, Z.; Zhang, J.; Wang, B.; et al. Effect of dietary oligochitosan supplementation on ileal digestibility of nutrients and performance in broilers. Poultry science 2005, 84, 1383–1388. [CrossRef]
- Glavinic, U.; Rajkovic, M.; Vunduk, J.; Vejnovic, B.; Stevanovic, J.; Milenkovic, I.; Stanimirovic, Z. Effects of Agaricus bisporus mushroom extract on honey bees infected with Nosema ceranae. Insects 2021, 12, 915. [CrossRef]
- Martin, C. The Effects of Polypore Mushroom Mycelia and Sawdust Extract Treatments on Deformed Wing Virus Levels in Apis mellifera; Clark University, 2023.
- GÜNEŞDOĞDU, M.; GEDİK, G.; Abaci, S.H. Biocontrol effect of Fomes fomentarius mushroom against Varroa destructor. Med. Weter 2025, 81, 357–363. [CrossRef]
- Stamets, P.E.; Naeger, N.L.; Evans, J.D.; Han, J.O.; Hopkins, B.K.; Lopez, D.; Moershel, H.M.; Nally, R.; Sumerlin, D.; Taylor, A.W.; et al. Extracts of polypore mushroom mycelia reduce viruses in honey bees. Sci. Rep. 2018, 8, 13936. [CrossRef]
- Vadnais, J.; Perez, L.; Coallier, N. Assessing foraging landscape quality in Quebec’s commercial beekeeping through remote sensing, machine learning, and survival analysis. Journal of Environmental Management 2025, 374, 124157. [CrossRef]
- Mahdizadeh Gharakhanlou, N.; Vadnais, J.; Perez, L.; Coallier, N. Urban buzz or urban bust? Beekeeping challenges, suitability, and survival insights in Montreal, Canada. Ecological Informatics 2025, 90, 103296. [CrossRef]
- Cox, D.R. Regression models and life-tables. Journal of the Royal Statistical Society: Series B (Methodological) 1972, 34, 187–202. [CrossRef]
- Rueppell, O.; Aumer, D.; Moritz, R.F. Ties between ageing plasticity and reproductive physiology in honey bees (Apis mellifera) reveal a positive relation between fecundity and longevity as consequence of advanced social evolution. Current opinion in insect science 2016, 16, 64–68. [CrossRef]
- Donzé, G.; Fluri, P.; Imdorf, A. A look under the cap: The reproductive behavior of Varroa in the capped brood of the honey bee. American bee journal 1998, 138, 528.
- Özkırım, A.; Küçüközmen, B. Chitosan-based gel application on model bees (Apis mellifera L.) for healing bite wounds caused by Varroa destructor. Journal of Apicultural Research 2022, 61, 45–51. [CrossRef]
- Zhang, H.; Jiang, H.; Zhang, X.; Yan, J. Amino acids from Ganoderma lucidum: Extraction optimization, composition analysis, hypoglycemic and antioxidant activities. Current Pharmaceutical Analysis 2018, 14, 562–570. [CrossRef]
- Ma, L.; Wang, Y.; Zhang, W.; Wang, H.; Liu, Z.; Xu, B. Alterations in protein and amino acid metabolism in honeybees (Apis mellifera) fed different L-leucine diets during the larval stage. Journal of Asia-Pacific Entomology 2016, 19, 769–774. [CrossRef]
- Hrassnigg, N.; Leonhard, B.; Crailsheim, K. Free amino acids in the haemolymph of honey bee queens (Apis mellifera L.). Amino Acids 2003, 24, 205–212. [CrossRef]
- Gąbka, J. Correlations between the strength, amount of brood and honey production of the honey bee colony. Medycyna Weterynaryjna 2014, 70, 754–756.
- Ito, M.; Kohno, H.; Seike, H.; Suzuki, T.K.; Nagata, S. Different sterol compositions of honey bee Apis mellifera L. indicate role-dependent sterol metabolism. Bioscience, Biotechnology, and Biochemistry 2026, 90, 587–596, [https://academic.oup.com/bbb/article-pdf/90/5/587/66852608/zbag017.pdf]. [CrossRef]
- Chakrabarti, P.; Lucas, H.M.; Sagili, R.R. Evaluating Effects of a Critical Micronutrient (24-Methylenecholesterol) on Honey Bee Physiology. Annals of the Entomological Society of America 2020, 113, 176–182, [https://academic.oup.com/aesa/article-pdf/113/3/176/33201437/saz067.pdf]. [CrossRef]
- Herbert, E.; Svoboda, J.; Thompson, M.; Shimanuki, H. Sterol utilization in honey bees fed a synthetic diet: Effects on brood rearing. Journal of Insect Physiology 1980, 26, 287–289. [CrossRef]
- Zu, P.; Koch, H.; Schwery, O.; Pironon, S.; Phillips, C.; Ondo, I.; Farrell, I.W.; Nes, W.D.; Moore, E.; Wright, G.A.; et al. Pollen sterols are associated with phylogeny and environment but not with pollinator guilds. New Phytologist 2021, 230, 1169–1184, [https://nph.onlinelibrary.wiley.com/doi/pdf/10.1111/nph.17227]. [CrossRef]
Figure 3.
Bayesian network structure used in this study.
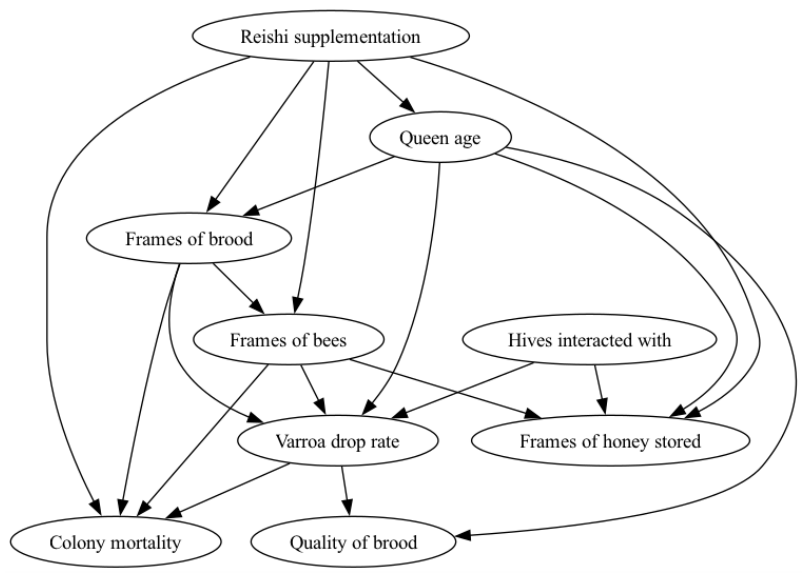
Figure 4.
Bayesian Cox proportional hazards model for colony longevity. Survival is shown as a unitless probability; the hazard is shown on its model scale (per unit time).
Figure 4.
Bayesian Cox proportional hazards model for colony longevity. Survival is shown as a unitless probability; the hazard is shown on its model scale (per unit time).
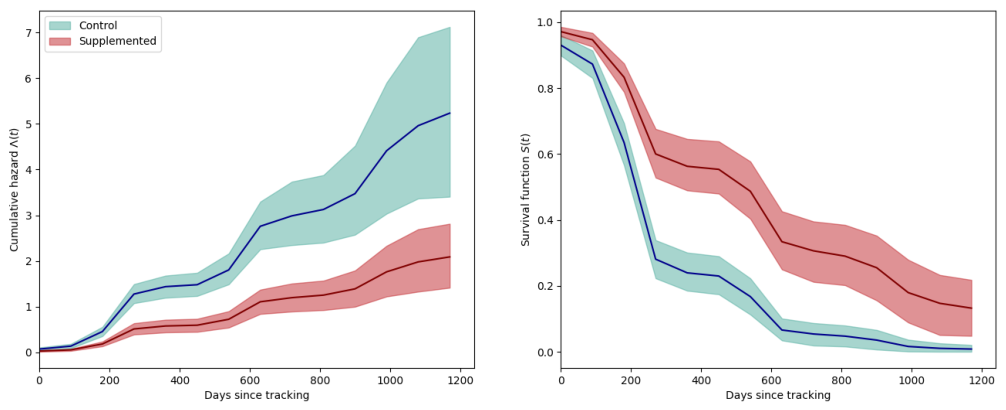
Figure 5.
Bayesian Cox proportional hazards model for queen longevity. Survival is shown as a unitless probability; the hazard is shown on its model scale (per unit time).
Figure 5.
Bayesian Cox proportional hazards model for queen longevity. Survival is shown as a unitless probability; the hazard is shown on its model scale (per unit time).
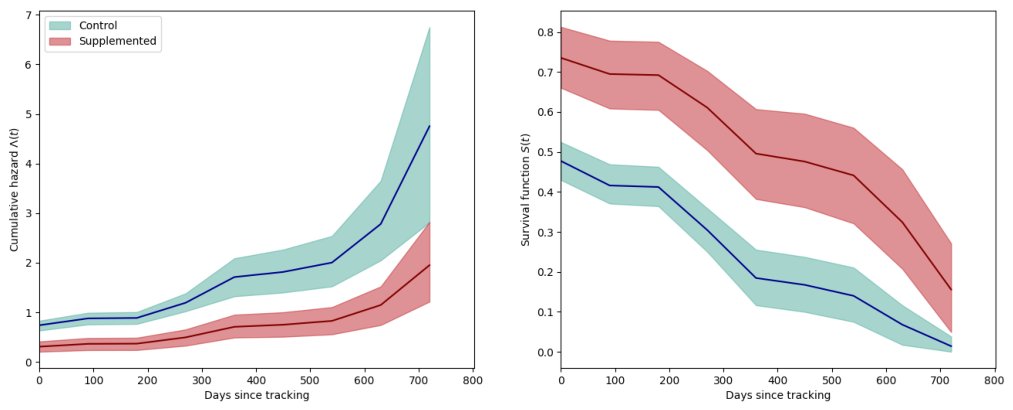
Table 1.
Model-based conditional mortality probabilities (%) computed from the Bayesian network. Cell shading indicates direction of difference within a scenario (green: lower mortality in supplemented vs. control; red: higher mortality in supplemented vs. control).
Table 1.
Model-based conditional mortality probabilities (%) computed from the Bayesian network. Cell shading indicates direction of difference within a scenario (green: lower mortality in supplemented vs. control; red: higher mortality in supplemented vs. control).
| Frames of bees | Varroa drop rate | Group | Mortality (%) |
|---|---|---|---|
| Decreased | Increased | Supplemented | 17 |
| Control | 23 | ||
| Decreased | Supplemented | 2 | |
| Control | 17 | ||
| Stable | Increased | Supplemented | 2 |
| Control | 25 | ||
| Decreased | Supplemented | 16 | |
| Control | 21 | ||
| Increased | Increased | Supplemented | 3 |
| Control | 11 | ||
| Decreased | Supplemented | 16 | |
| Control | 4 |
Disclaimer/Publisher’s Note: The statements, opinions and data contained in all publications are solely those of the individual author(s) and contributor(s) and not of MDPI and/or the editor(s). MDPI and/or the editor(s) disclaim responsibility for any injury to people or property resulting from any ideas, methods, instructions or products referred to in the content. |
© 2026 by the authors. Licensee MDPI, Basel, Switzerland. This article is an open access article distributed under the terms and conditions of the Creative Commons Attribution (CC BY) license (http://creativecommons.org/licenses/by/4.0/).
Copyright: This open access article is published under a Creative Commons CC BY 4.0 license, which permit the free download, distribution, and reuse, provided that the author and preprint are cited in any reuse.