Preprint
Article

This version is not peer-reviewed.

Study on the Competition Between Phaseolus vulgaris (Common Bean), Amaranthus palmeri (Palmer Amaranth), and Ipomoea purpurea (Tall Morningglory) Using a Replacement Series Approach

Submitted:

05 September 2026

Posted:

08 September 2026

You are already at the latest version

Abstract

This study examines the competitive interactions between common bean (Phaseolus vulgaris L.) and two problematic weed species, Amaranthus palmeri S. Watson (Palmer amaranth) and Ipomoea purpurea L. (common morningglory), using a replacement series design. The analysis evaluates important competition indices namely relative yield (RY), total relative yield (TRY), and key growth parameters, height and biomass produced by the crop and weeds, along with common bean yield components (i.e., pods per plant, seeds per pod, and pod weight) across the varying proportions of crop-to-weed ratios (100:0, 75:25, 50:50, 25:75, and 0:100). Results demonstrate that I. purpurea exerts significantly greater competitive pressure than A. palmeri, with significant suppression of common bean yield at high weed densities. Total relative yield analysis reveals overyielding at the 50:50 proportion, suggesting niche differentiation or competitive equivalence between species. Yield component analysis indicates that weed competition primarily reduces pod number per plant, with secondary effects on seed set and pod biomass. These findings have provided insights into common bean-weed competition while exerting important implications for integrated weed management strategies in bean production systems.

Keywords: 
;  ;  ;  ;  ;  

1. Introduction

Common bean (Phaseolus vulgaris L.) is an important legume crop worldwide; it serves as a source of calories, protein, dietary fiber, minerals, and vitamins. Weed-crop competition is a major biotic constraint in agricultural systems such as common bean, which is highly susceptible to weed interference due to its slow initial growth and relatively open canopy [1]. Weed competition in snap bean alone can cause yield losses of up to 80% [2], highlighting the economic importance of effective weed management strategies. Some of the most competitive weeds that infest common bean fields include Amaranthus palmeri S. Watson (Palmer amaranth) and Ipomoea purpurea (L.) Roth (common morningglory). If these weeds are left uncontrolled, they can cause crop yield losses of up to 80% [3,4,5], resulting in approximately a $662 million economic loss [6]. A. palmeri, a tall, erect, summer annual dioecious broadleaf weed native to the southwestern United States and northwestern Mexico of the Amaranthaceae family, is a competitive species that has become one of the most economically damaging and difficult-to-control weeds [7]. It is characterized by an early and extended germination window, rapid growth rate, prolific seed production, high plasticity, and remarkable water-use efficiency. These biological and physiological characteristics enhance the invasive potential and competitive ability of this weed [8,9,10,11,12].
Members of the Convolvulaceae family, such as I. purpurea, native to Central America, are annual climbing vines with high invasive potential and competitive ability [13,14], especially in bean crops [15]. I. purpurea produces a relatively large number of seeds with a high germination rate. The seedlings of the species exhibit rapid early growth, contributing to its competitive dominance over species with delayed seed germination and emergence [16].
Many competition studies have documented the crop yield loss expected due to weeds [17]. However, although these studies are insightful for implementing weed control tactics, they do not address the level of weed competition needed to achieve biologically and economically optimal crop production [18,19]. The methods most widely implemented to study weed competition are usually grouped as replacement and additive series. Replacement series trials have been widely used to quantify interspecific competition between crops and weeds [20]. A typical replacement series trial consists of a set of pure and mixed populations in which the combined density of the components (population proportion of the species studied) remains constant. The results are often presented graphically as replacement series plots in which the absolute or relative performance of each of the two species is plotted against its proportion in the mixture, and provide information about interactions between the species, which can be categorized as negative, positive, or neutral [21]. It also allows understanding how crop yield components respond to increasing weed pressure. In the present study, the morpho-physiological competitive interactions between common bean, A. palmeri, and I. purpurea, two important weed species in bean crops with distinct ecological characteristics, were investigated using equivalent population densities.

2. Materials and Methods

2.1. Plant Material and Experimental Site

A greenhouse experiment to investigate the competitive effects of A. palmeri and I. purpurea on common bean using a replacement series design was conducted from June 2025 to October 2025 at the Department of Agriculture, University of Ioannina, on the Arta town campus, Greece. Quartz (dwarf French bean), a prostrate, determinate cultivar that is grown for fresh green pods, was used as a model crop for the replacement series, the proportions of which were sown in 16 × 1.5 m isolated compartments (garden beds) at ground level and then subdivided into the replacement series treatments described below. The soil at the site was loamy sand, with a pH of 6.3 and an organic matter content of 1.2 %. Weed seeds were collected from populations grown in an open plastic greenhouse at the University farm.

2.2. Experimental Design

A replacement series experiment (Table 1, Figure 1) was conducted under greenhouse conditions with five crop-weed proportions, namely 100:0 (pure bean stand), 75:25, 50:50, 25:75, and 0:100 (pure weed stand), with A. palmeri or I. purpurea as competing weeds. Total plant density (i.e., crop and A. palmeri or I. purpurea) was held constant at 35 plants m-2, representing a population of 350,000 plants ha-1 [22,23] across all replacement series population proportions to isolate competitive effects from density-dependent responses. Each crop: weed proportion was replicated three times and arranged in a complete randomized block design (CRBD). The plants were irrigated every two days, whereas no fertilization was applied.

2.3. Data Collection and Calculations

Crop establishment was determined for each experimental treatment upon emergence and at harvesting. The establishment of the crop and weed population proportions in the replacement series ranged between 93 and 100%.
Before physiological maturity (R6 growth stage), 16 weeks after sowing (WAS), plant height (cm) and dry biomass (g m⁻²) of both common bean and weeds were measured. For height and dry biomass determination, 10 randomly selected plants per experimental treatment were cut at ground level and oven-dried at 48 °C for 4 days. We also determined the number of pods per plant, the number of immature seeds per pod (R3-R6 growth stage), pod weight, and the number of seeds per plant immediately after harvest. In addition, we recorded the timing of entry into the reproductive stage for bean plants for each replacement series proportion (R1 to R6 growth stages) according to CIAT (1986) [24]. The total chlorophyll content was measured at 28, 43, and 80 days after emergence (DAE) for both bean and weeds from the fourth uppermost fully expanded leaf of five randomly selected plants, using a portable chlorophyll content meter (CL-01 Chlorophyll Meter, Hansatech Instruments Ltd, Norfolk, UK). The following equation (Eq. 1) was used to estimate total chlorophyll content as described by Kalaitzidis et al. [25].
y = 2.3636 x + 4.2828
where y = total chlorophyll content; x = CL-01 chlorophyll meter value.
Soil moisture content was measured using an HH2 moisture meter fitted with a ThetaProbe sensor type ML2 (Delta-T Devices Ltd, Cambridge, UK) at 5 randomly selected points within each replacement series population proportion, and their average was calculated.
Finally, various competition indices to quantify the competitive effects in replacement series were also estimated, including relative yield (RY) and total relative yield (TRY) (Table 2) [17,26,27,28].

2.4. Statistical Analysis

Analysis of variance (ANOVA) was performed to detect statistically significant differences among population proportions in replacement series treatments, with weed mixture ratio as the fixed factor and block as the random factor, using JMP Pro 19 for Windows (SAS Institute Inc., Cary, NC, USA). Mean comparisons were performed using Fisher’s least significant difference (LSD) test at α = 0.05. Before ANOVA, assumptions of normality and homogeneity of variance were tested using the same statistical package mentioned above. The significance of RY and TRY deviations from 1.0 was tested using one-sample t-tests.

3. Results

3.1. Crop and Weed Growth Parameters as Affected by Replacement Series Population Proportions

The decline of bean dry weight in the presence of A. palmeri is approximately proportional to weed population, i.e., 25%, 50%, or 75% weed cover reduced bean dry weight by 28.5%, 44.8%, and 66.7%, respectively, compared to the control (Table 3). The 75:25 mixture, although noticeably lower, was not significantly different from the dry weight in bean monoculture. On the contrary, in I. purpurea, a sharper and higher decrease in bean biomass than that in A. palmeri was recorded; i.e., at the lower weed proportion (i.e., 75: 25), the weed reduced bean biomass by 65.5%, rising to an 87.5% reduction at the 25:75 replacement series proportion compared to that in bean monoculture (Table 3).
On the contrary, the weeds were almost unaffected by the presence of bean at any proportion, indicating a strong density compensation. The dry weight of I. purpurea, for example, remained unchanged across all proportions in the replacement series (Table 4). The weed at the 75:25 proportion still produced approximately 76% of the biomass when grown without the presence of the crop, demonstrating full compensation for its reduced density. Similarly, A. palmeri compensated at high weed proportions compared to the biomass produced in the absence of the bean crop. The bean crop exhibited an inferior competitive ability towards the weeds compared to that of the weed species used in this work (Table 4).
Height was a poor indicator of competition between the crop and weeds tested since no differences, especially in I. purpurea, were recorded among replacement series proportions. Bean height remained relatively constant (i.e., between 41–59 cm) even where its biomass was reduced by >80% (Table 4). I. purpurea reached ~2 m height, compared to the bean (~0.4–0.6 m), overtopping and twining in the canopy, causing disturbances in light interception in addition to mechanical lodging on the bean. Consistent with its severe, density-independent effect, A. palmeri (~0.8–1.1 m) exhibited twice the bean height (Table 3 and Table 4).
Table 5 describes how the proportion of bean plants reaching the reproductive stage changes, particularly from flowering induction to pod formation (R1 to R4-R5), throughout the experimental period under different crop: weed proportions. Reproductive induction increased with time in all treatments, from 33 to 47 days after emergence (DAE). The bean monoculture (100:0) consistently exhibited the highest number of reproductive plants at every sampling occasion. As the weed proportion increased, fewer bean plants entered the reproductive stage. At the 25:75 (bean: weed) treatment, the lowest reproductive induction among the mixed stands was recorded, indicating strong suppression by weeds.

3.2. Effects of Replacement Series Proportions on Total Chlorophyll Content in Bean and Weeds

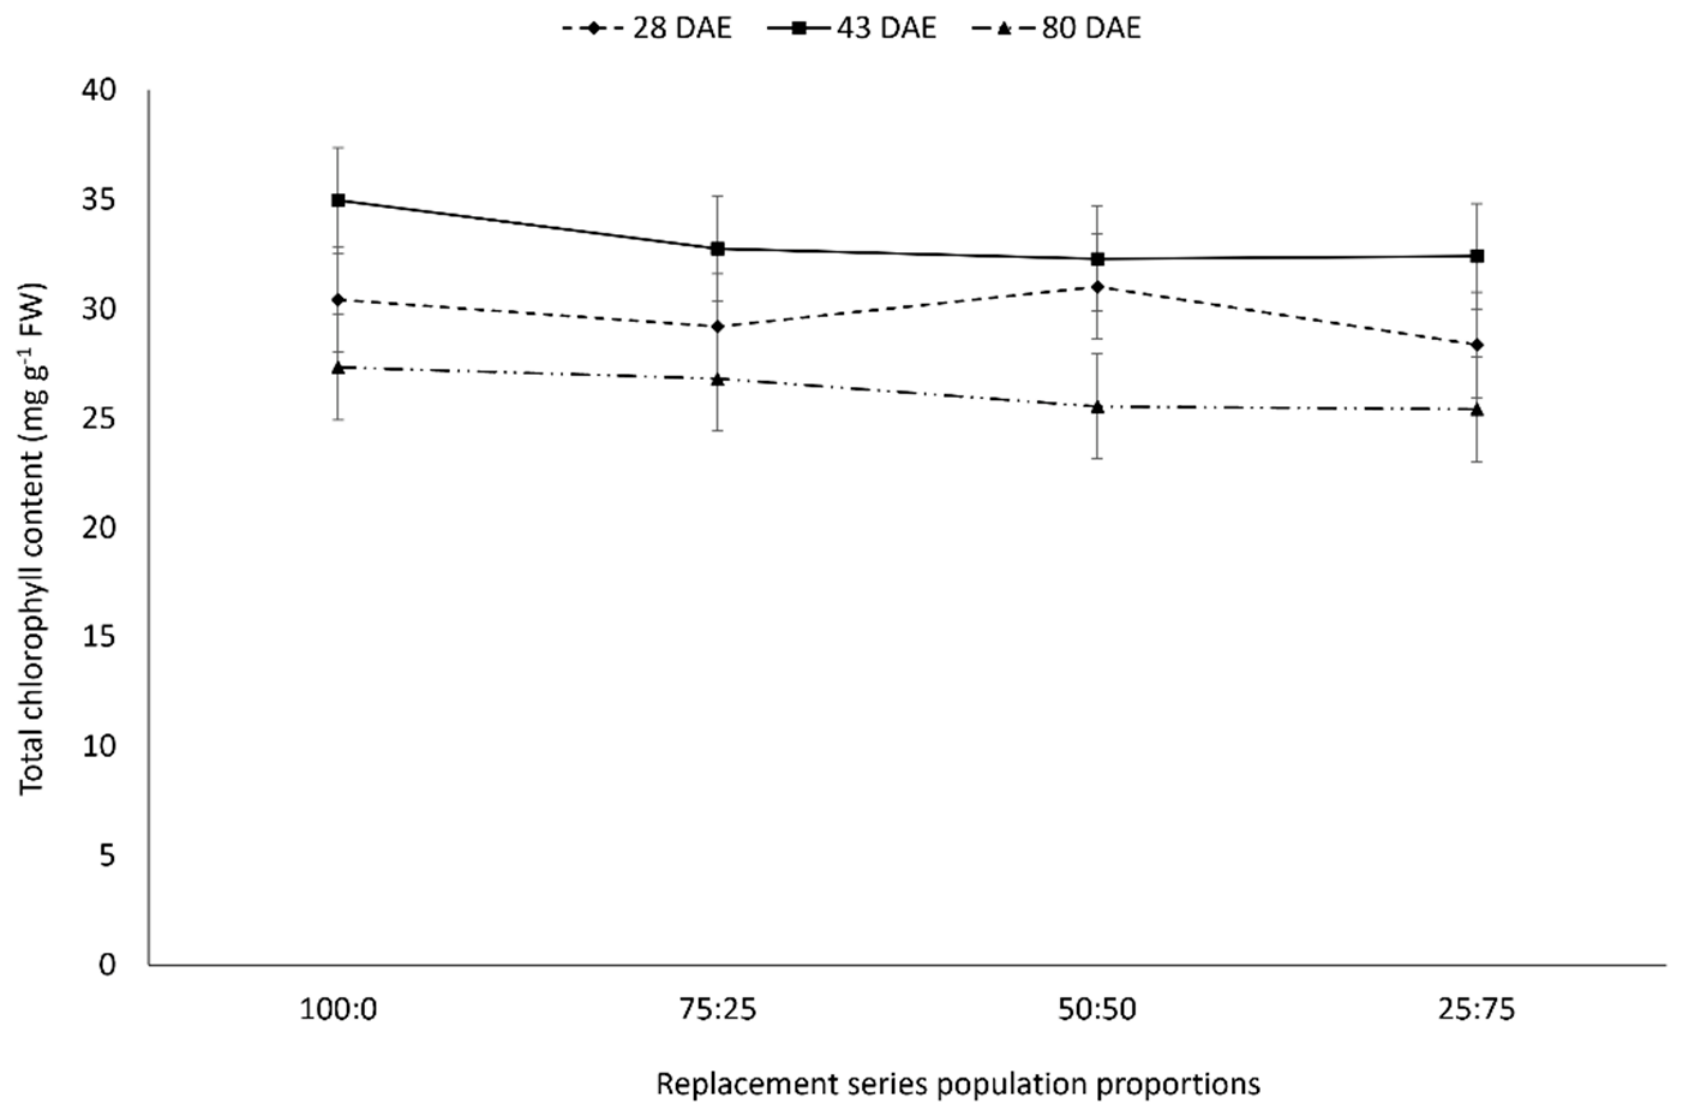
Chlorophyll content serves as a sensitive physiological indicator of plant health and competitive stress. Regardless of weed species, differences in the crop’s total chlorophyll content were observed across replacement series proportions × sampling occasion (DAE), particularly between 43 and 80 DAE, at a=0.05 (Figure 2).
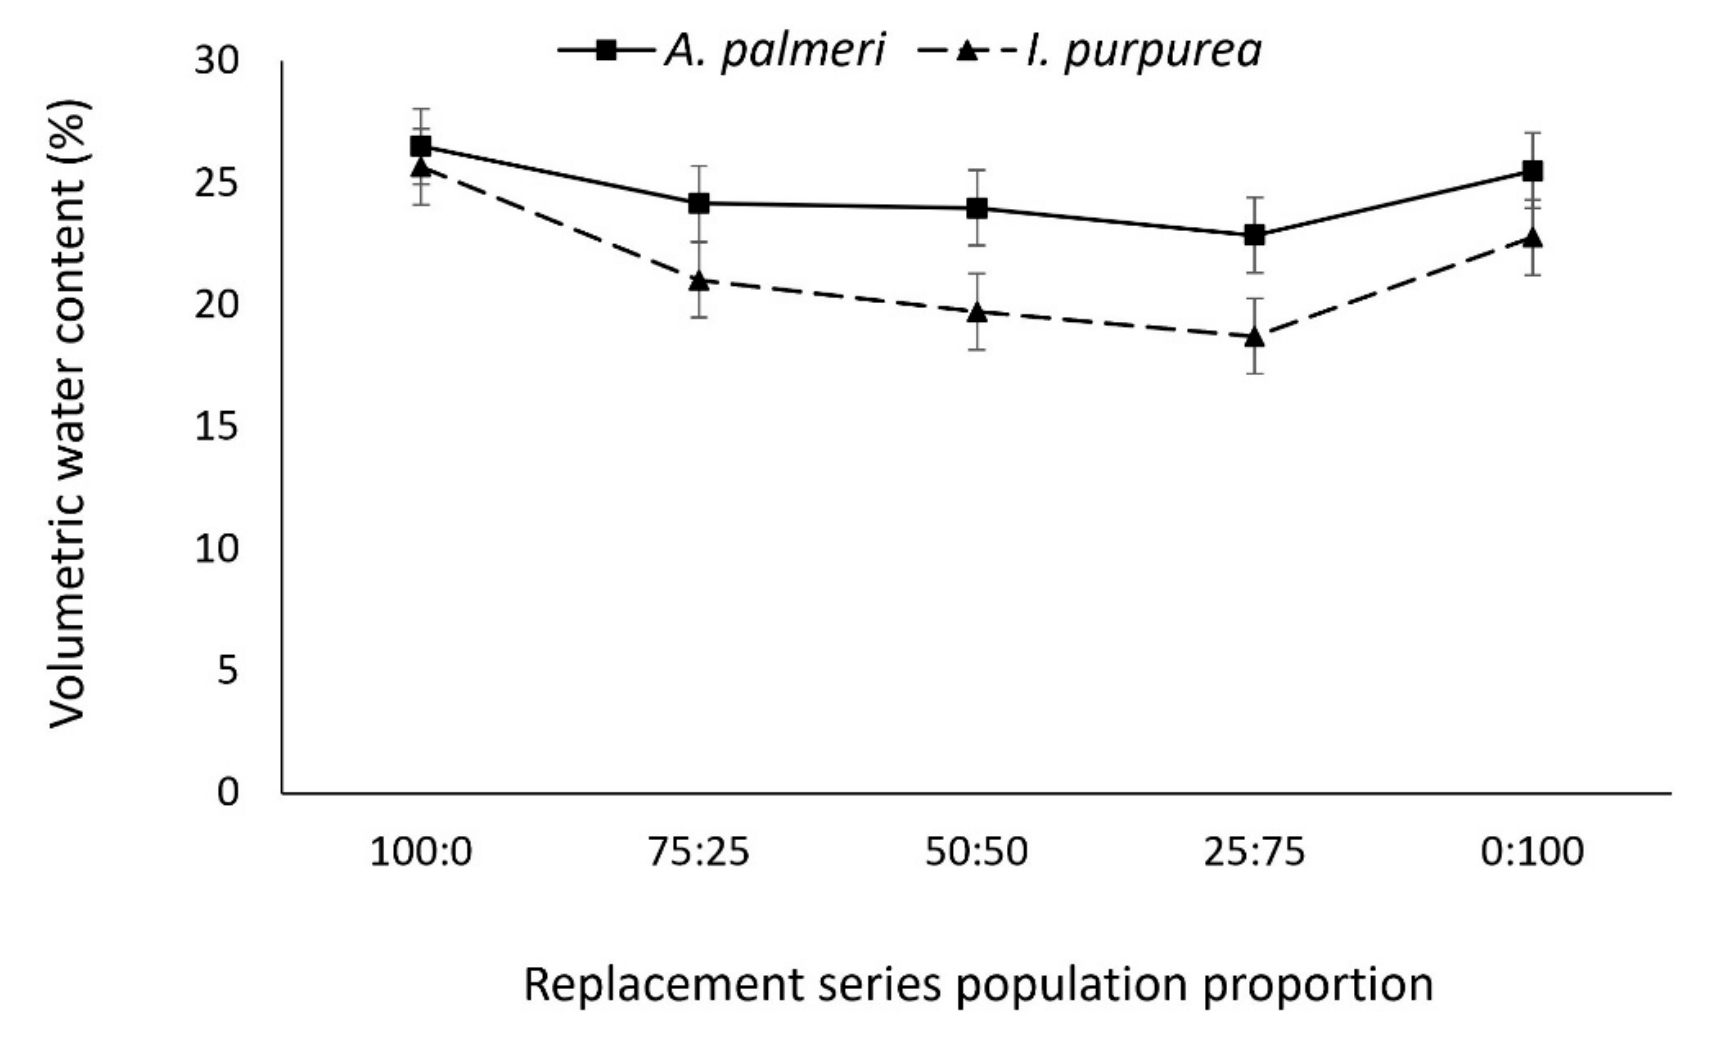
There is a stage-dependent response to weed competition, since at the early stage of the crop (28 DAE), beans are relatively tolerant to the presence of the weeds, as chlorophyll content (27- 30 mg g-1 FW) is not different from that recorded at 43 DAE (32-35 mg g-1 FW). However, at peak growth (43 DAE), competition causes a slight but not significant reduction in chlorophyll content. In contrast, as the crop reaches senescence (80 DAE), competition causes a linear decline in chlorophyll (23-27 mg g-1 FW). The strong temporal effect on bean chlorophyll content (Figure 2) aligns with the crop's growth stage (Table 5). Chlorophyll accumulated during active growth (28 DAE), increased at 43 DAE as the crop produced the highest number of reproductive organs, and declined as the crop entered maturity (80 DAE). The reduction in chlorophyll under competition involves multiple interacting stressors, such as water availability. The volumetric water content (Figure 3), for example. decreases (a=0.05), especially in the presence of I. purpurea, when evaluated at 75:25, 50:50, and 25:75 population proportions of the replacement series compared to either crop or weed monocultures.
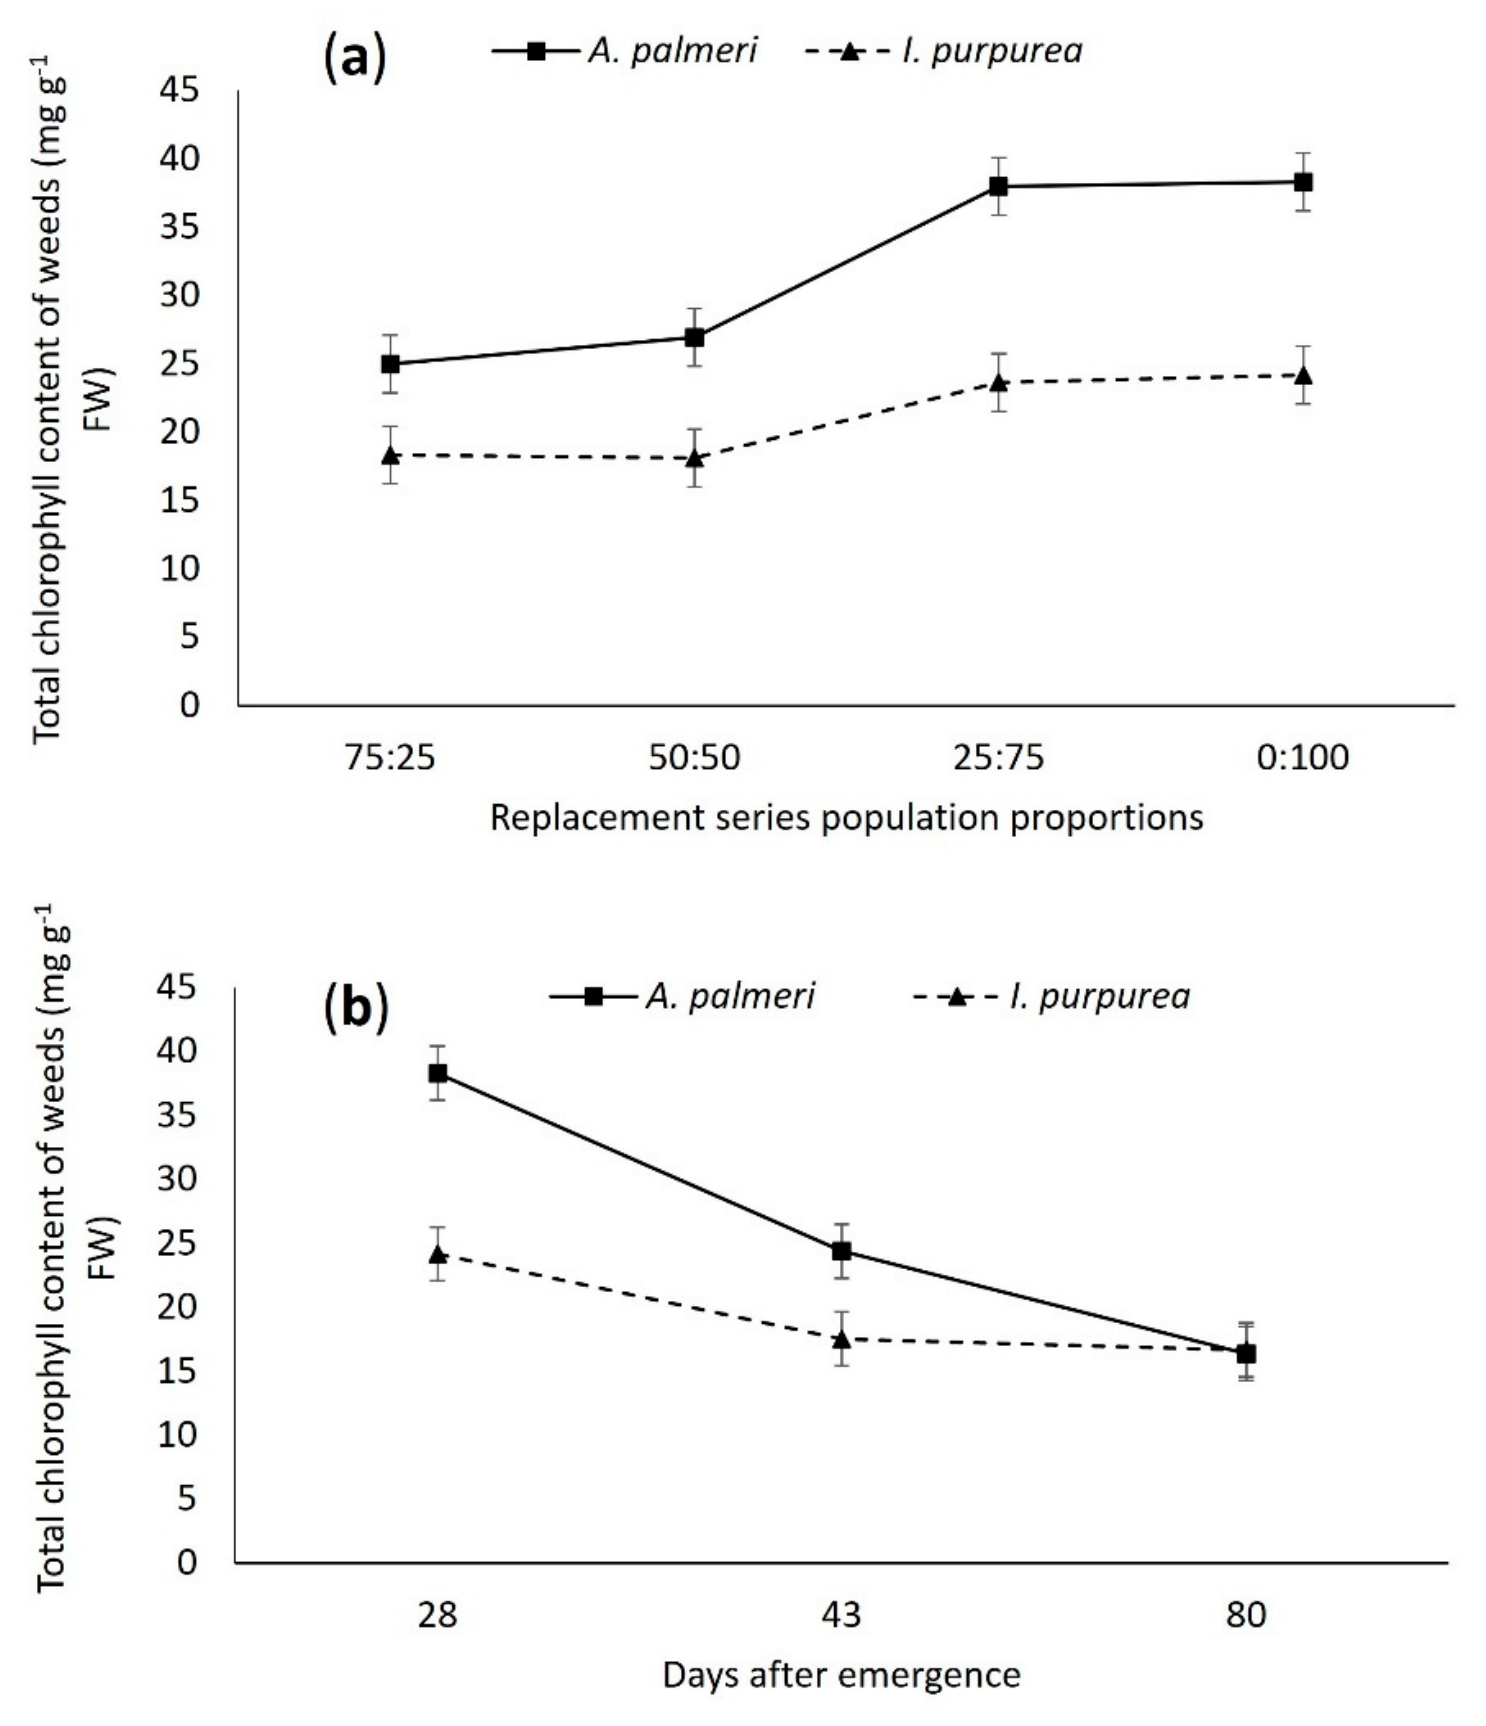
This could be a reason for the reduced chlorophyll content in I. purpurea compared with A. palmeri (Figure 4a). A. palmeri exhibited substantially higher total chlorophyll content than I. purpurea across all replacement series population proportions. At the 75:25 bean: weed ratio, chlorophyll content was recorded at 25 and 18 mg g⁻¹ FW for A. palmeri and I. purpurea, respectively. As the proportion of bean decreased (i.e., weed competition from the crop was reduced), chlorophyll content in A. palmeri increased progressively, reaching 27 and 38 mg g⁻¹ FW at 50:50 and 25:75, respectively, where it plateaued at the 0:100 replacement series treatment. This represents an overall increase of about 52% from the highest to the lowest crop competition level for A. palmeri. On the contrary, Ipomoea purpurea, exhibited a modest response to reduced bean competition since chlorophyll content remained relatively stable at approximately 18 mg g⁻¹ FW under the 50:50 and 75:25 proportions, then increased to about 23.5 mg g⁻¹ FW at 25:75 and 24 mg g⁻¹ FW at 0:100. The magnitude of chlorophyll increase for I. purpurea was 33% from the most competitive to the non-competitive treatment. Notably, even in the absence of bean competition (0:100 in the replacement series), I. purpurea chlorophyll was recorded well below that of A. palmeri under the same proportion (Figure 4a).
Temporal dynamics revealed a clear ontogenetic decline in chlorophyll for both species. At 28 DAE, A. palmeri displayed the highest chlorophyll content of the entire study at approximately 38 mg g⁻¹ FW, while for I. purpurea chlorophyll content was measured at approximately 24 mg g⁻¹ FW. By 43 DAE, A. palmeri chlorophyll had decreased to 24.5 mg g⁻¹ FW (a 36% reduction), while chlorophyll for I. purpurea declined to 17.5 mg g⁻¹ FW (a 27% reduction). By 80 DAE, both species converged to similar values, at 16.5 16-17 mg g⁻¹ FW for A. palmeri and I. purpurea, respectively. The decline from 28 to 80 DAE was approximately 57% for A. palmeri and 30% for I. purpurea (Figure 4b).

3.3. Effects of Competition on Bean Yield and Yield Components at Various Replacement Series Proportions

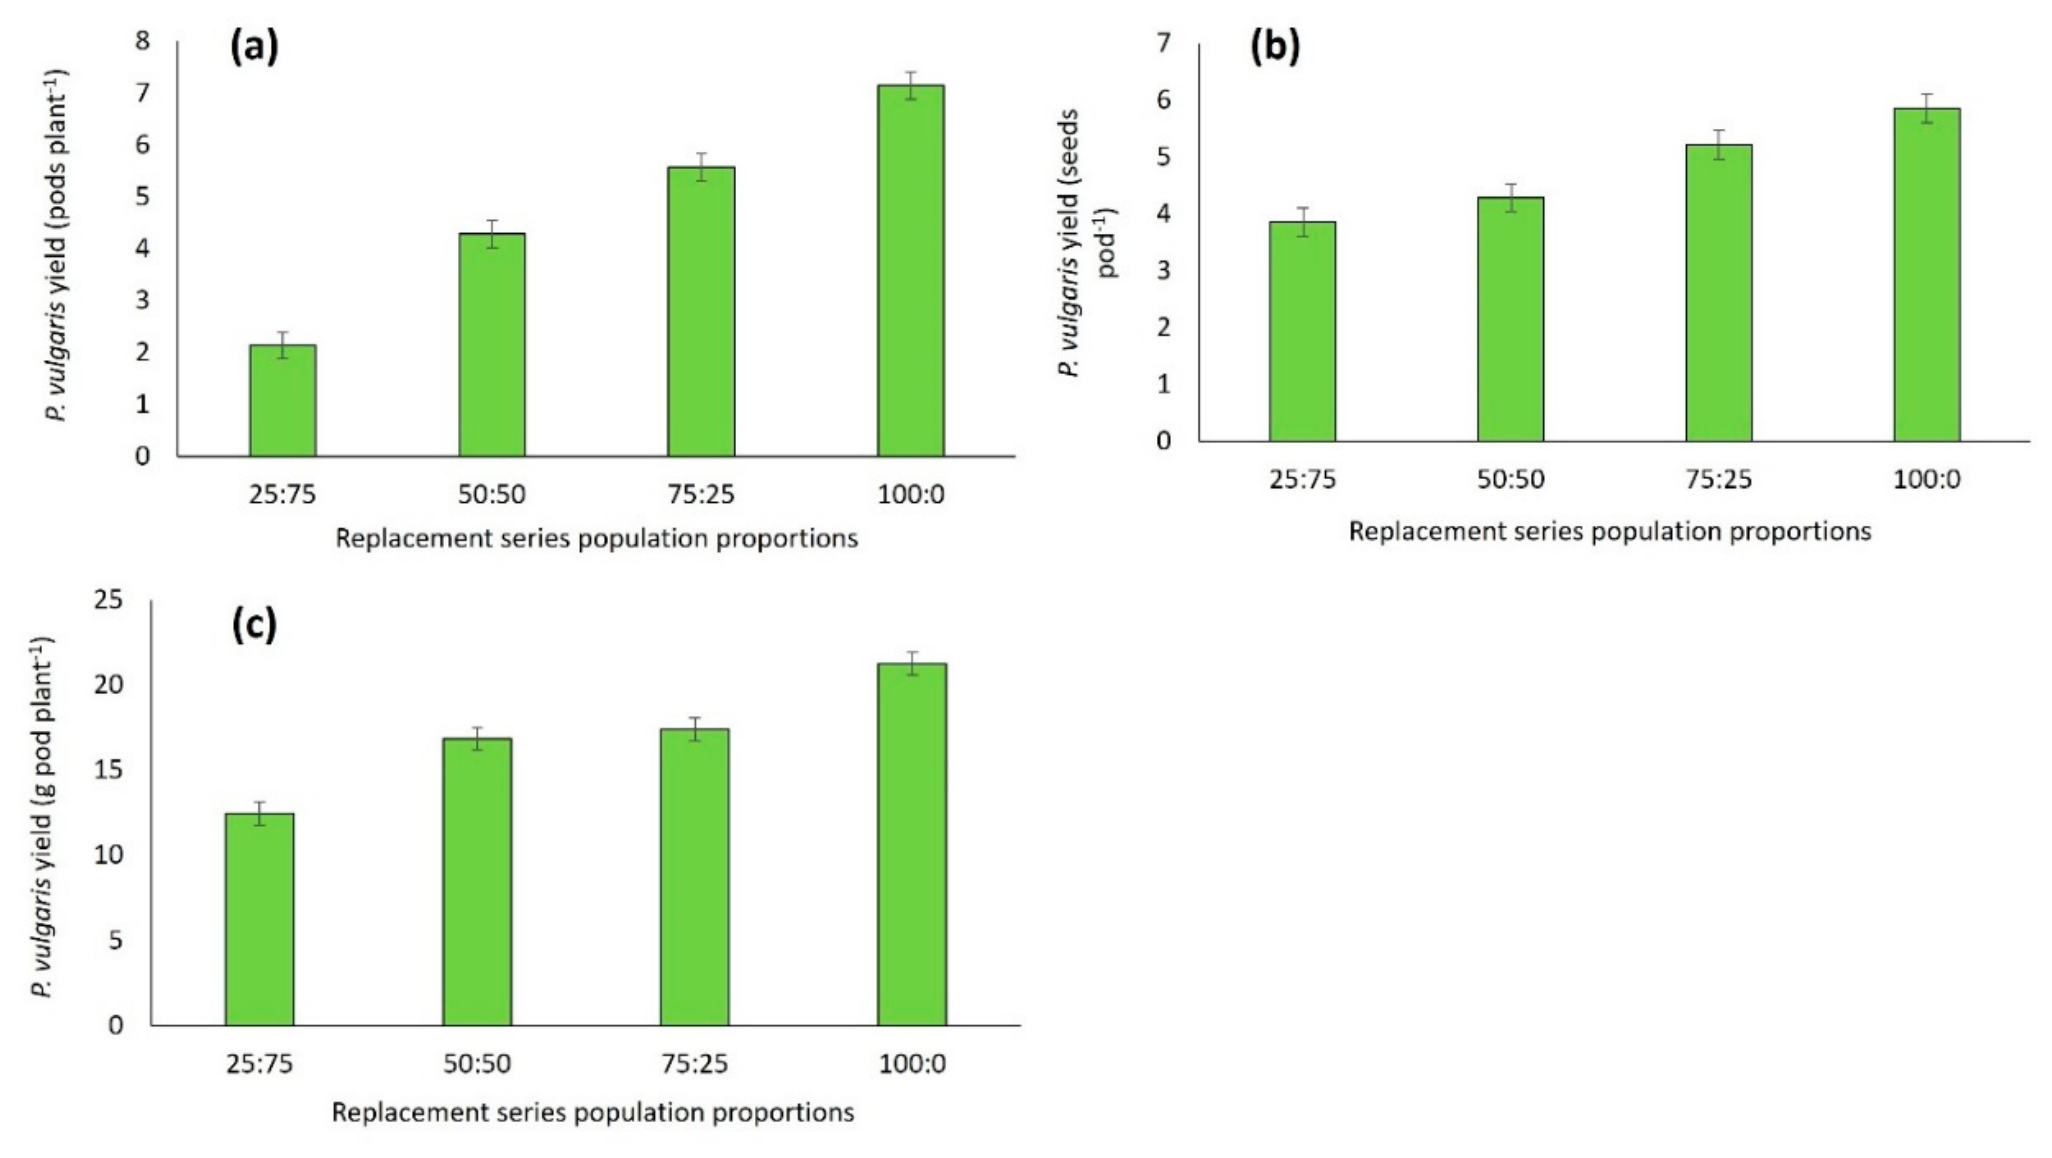
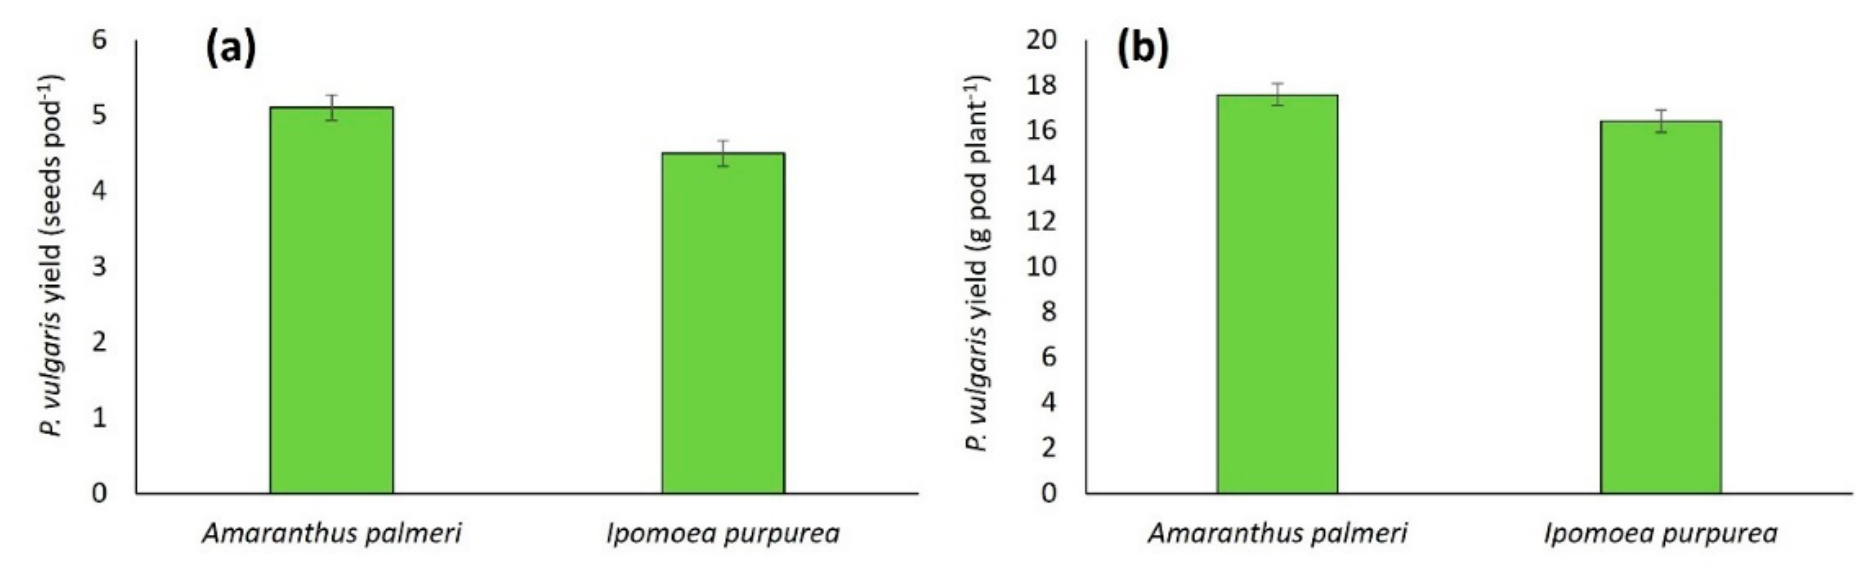
The effects of competition on common bean yield components to varying replacement series bean: weed population proportions (i.e., 25:75, 50:50, 75:25) compared to crop monoculture (100:0) are presented in Figure 5 and Figure 6. More particularly, the number of pods per plant exhibited a positive response to increasing bean proportion in the replacement series mixtures (Figure 5a). At the 25:75 ratio, bean plants produced 2.1 pods per plant, but pods per plant increased progressively to 4.3 pods at 50:50, 5.5 pods at 75:25, and reached a maximum of 7.1 pods per plant in the pure bean stand (100:0) (Figure 5a).
A similar trend to the pods per plant was recorded for seeds per pod with increasing bean proportion in the replacement series (Figure 5b). At the 25:75 ratio, bean plants produced 3.9 seeds per pod, which increased to 4.3 seeds at 50:50, 5.2 seeds at 75:25, reaching 5.8 seeds per pod in the pure bean stand. Pod yield, expressed as g pod plant-1, was affected by the changing population proportions (Figure 5c). At the 25:75 ratio, individual pod yield was recorded at 12.5 g pod⁻¹, increasing to approximately 17.0 g at 50:50, 17.5 g at 75:25, and reaching 21.2 g pod plant⁻¹ in the pure bean stand, an overall increase of 70% from the lowest to the highest bean proportion. The noticeable increase between 25:75 and 50:50, followed by a more gradual increase thereafter, suggests a threshold effect whereby bean plants require a minimum proportion of the total population (50%) to achieve reasonable pod filling. The effects of the weed species on bean yield components averaged across replacement series population proportions are shown in Figure 6.
When beans were grown in competition with A. palmeri, the number of seeds pod-1 was 5.1, compared to 4.5 seeds pod-1 when competing with I. purpurea. This represents a difference of 13% between the two weed species. Pod yield followed a similar pattern, with beans competing against A. palmeri producing 17.5 g pod plant⁻¹ compared to approximately 16.4 g pod plant⁻¹ in the presence of I. purpurea, a difference of 6.7%. While both weed species significantly reduced pod yield relative to weed-free conditions, the magnitude of reduction was consistently greater with I. purpurea.

3.4. Relative Yield and Total Relative Yield

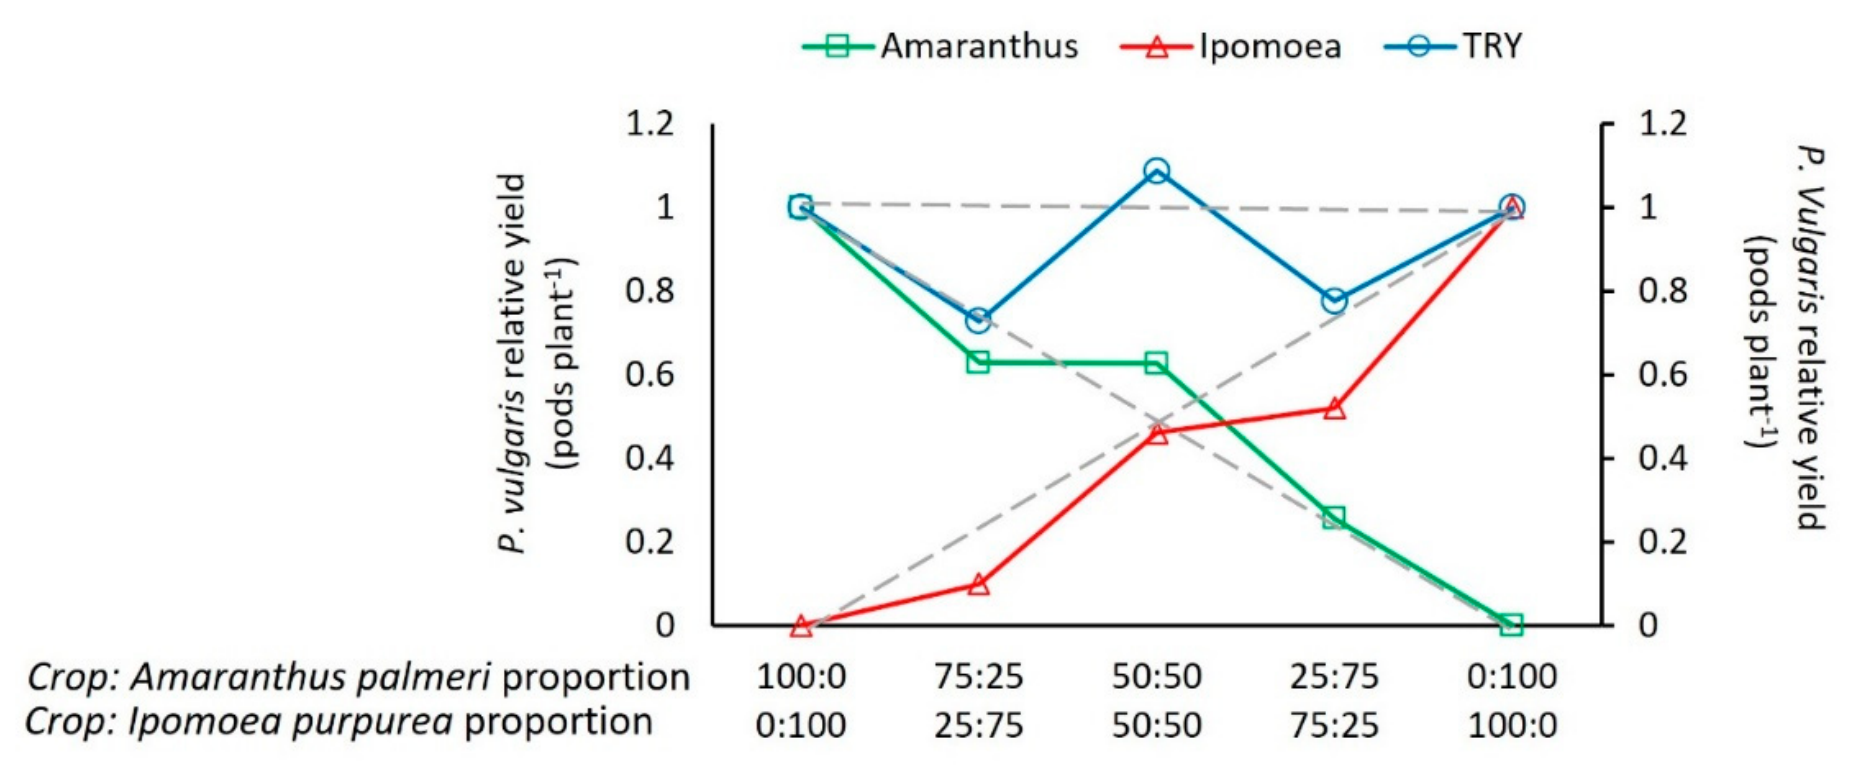
Based on the bean yield performance under various replacement series population proportions, various competition indices were calculated. The relative yield and total relative yield in Figure 7 depict the competitive interactions between A. palmeri and I. purpurea grown with the bean crop at various replacement series population proportions.
The relative yield (RY) curves for P. vulgaris competing with A. palmeri and I. purpurea exhibited different trajectories, revealing species-specific competitive mechanisms. When competing with A. palmeri (green line with squares), bean RY declined from 1.0 at 100:0 to 0.63 at both 75:25 and 50:50 proportions, exhibiting a plateau before declining to 0.25 at 25:75 and 0.0 at 0:100. This plateau pattern suggests that A. palmeri exerts maximum competitive impact at relatively low proportions (~25%), with additional weed biomass failing to proportionally suppress bean yield until very high infestation levels are reached. This threshold-like response may reflect the upright growth habit of A. palmeri, which primarily competes for light through vertical extension but may become self-shading at higher densities, reducing per-plant competitive effectiveness. In contrast, the RY curve for P. vulgaris competing with I. purpurea (red line with triangles) showed a continuous decline from 1.0 to 0.52 to 0.46 to 0.10and finally 0.0 across the replacement series population proportion gradient.
The total relative yield (TRY) curve (blue line with circles) exhibited a distinctive shaped pattern with a peak at the 50:50 proportion (TRY ≈ 1.09), falling below 1.0 at both 75:25 (0.73) and 25:75 (0.78). The TRY > 1.0 at 50:50 indicates overyielding, where total community productivity exceeds that expected under complete competition.

4. Discussion

The present replacement-series study demonstrated that common bean (Phaseolus vulgaris L.) is highly vulnerable to interference from both Amaranthus palmeri and Ipomoea purpurea, although the magnitude and mechanism of competition differed substantially between the two weed species. The results indicate that bean biomass, reproductive development, and yield components were progressively reduced as weed proportion increased, confirming that interspecific competition was more detrimental than intraspecific competition. In particular, I. purpurea exerted a disproportionately large suppressive effect even at relatively low population proportions, whereas the effects of A. palmeri were more closely associated with weed abundance. These findings provide important insights into species-specific competitive mechanisms and have direct implications for weed management in grain legumes.

4.1. Crop and Weed Growth Parameters as Affected by Replacement Series Population Proportions

The biomass reductions presented in Table 3 indicate that bean was competitively inferior to both weed species. This finding is consistent with the generally weak competitive ability of grain legumes due to their relatively slow early growth, limited canopy expansion, and lower ability to capture resources compared with aggressive broadleaf weeds [29]. Recent ecological frameworks further suggest that crop-weed competition is governed not only by resource depletion but also by functional traits, growth plasticity, and early signaling interactions among neighboring plants, which can alter crop development before measurable resource limitation occurs [30,31,32,33,34].
The proportional reduction in bean biomass caused by A. palmeri contrasts with the density-independent suppression observed with I. purpurea. These differences indicate that weed species and competitive ability might be more important than weed density alone, with regard to crop performance [35]. One of the interesting findings of the study is that I. purpurea caused greater reductions in bean biomass and reproductive development (Table 5) than A. palmeri, despite the latter being regarded globally as one of the most aggressive agricultural weeds [7,11], most probably due to the growth habit of the species. Morningglory species have a climbing growth habit that allows individual vines to use crop stems as structural support. This strategy permits persistent occupation of upper canopy layers and efficient interception of photosynthetically active radiation. Unlike weeds with an erectophile growth habit, climbing species can remain competitive regardless of neighboring weed density because of their ability to exploit vertical space. The suppressive ability of the weeds used in this study is further enhanced by the fact that common bean is a poor-N fixer species with a slow growth rate [36,37], whereas both A. palmeri and I. purpurea are effective competitors, especially against the bean crop [1,2].
Height, in general, explains the competitive ability between the weeds and the crop [7] at various population proportions, either in monoculture or mixes, although no differences were recorded in the replacement series proportions, especially in the case of I. purpurea (Table 3). In addition, bean height remained relatively constant even where its biomass was reduced by >80%, therefore, biomass is a sensitive indicator of competition response (Table 4). Consequently, the severe suppression caused by I. purpurea suggests a particularly low economic threshold, whereby relatively small infestations may already result in economically significant yield losses. This interpretation is consistent with the reduction in bean biomass exceeding 65% at the 75:25 crop ratio.

4.2. Effects of Replacement Series Proportions on Total Chlorophyll Content

Chlorophyll content serves as a sensitive physiological indicator of plant health and competitive stress. Under weed-crop competition, chlorophyll concentrations often decline due to reduced light interception, nutrient deficit, and water stress, which collectively impair photosynthetic capacity [38,39]. Understanding how chlorophyll dynamics respond to varying levels of crop competition and plant ontogeny is critical for predicting weed-suppressive potential and optimizing weed management strategies.
At 43 DAE, competition causes a slight but not significant reduction in bean chlorophyll content, whereas as the crop reaches senescence, competition causes a linear decline in chlorophyll content (Figure 2). This suggests that the competitive impact, averaged over both weed species, on photosynthetic pigment status increases as the season progresses and resource competition intensifies. The strong temporal effect on bean chlorophyll content (Figure 2) aligns with the crop's growth stage (Table 5). Chlorophyll accumulated during active growth, increased as the crop produced the highest number of reproductive organs, and declined as the crop entered maturity. The decline in chlorophyll content towards maturity indicates that chlorophyll degradation is driven by source-sink remobilization [40]. It has been stated that shading induces two divergent chlorophyll responses in species grown together. More particularly, an adaptive increase in chlorophyll b to improve light-harvesting antenna efficiency under low light [41,42] or a destructive decrease in total chlorophyll leading to premature senescence [43,44]. The reduction in chlorophyll under competition involves multiple interacting stressors. Competition for water can induce stomatal closure, reduce mesophyll conductance, and limit CO₂ fixation, leading to feedback inhibition of chlorophyll synthesis and increased photodamage [39].
This is evident in weed species' chlorophyll content. For example, volumetric water content (Figure 3) decreases, especially in the presence of I. purpurea at 75:25, 50:50, and 25:75 population proportions of the replacement series, compared with either crop or weed monocultures. This could be a reason for the reduced chlorophyll content in I. purpurea in relation to A. palmeri (Figure 4a), a C4 species that utilizes available light efficiently [11]. A. palmeri exhibited substantially higher total chlorophyll content than I. purpurea across all replacement series population proportions. The results demonstrate that chlorophyll content in both weed species is affected by the intensity of interspecific competition. As bean density decreased, both weeds experienced competitive release, enabling greater light interception, water and nutrient acquisition, and hence higher chlorophyll synthesis. This pattern aligns with recent replacement series studies in common bean, where increasing weed proportions negatively affected crop physiological traits, including chlorophyll index and gas exchange parameters [1]. The noticeable chlorophyll response in A. palmeri compared to I. purpurea suggests that the former is more plastic in its photosynthetic apparatus. The C₄ photosynthetic pathway and rapid growth strategy allow A. palmeri to capitalize on available resources more aggressively than I. purpurea, a C₃ vine [5,9].
Therefore, A. palmeri chlorophyll content compared with I. purpurea across all replacement series population proportions and sampling occasions might reflect differences in their photosynthetic biology and growth habits. However, the convergence of chlorophyll values at 80 DAE is noteworthy. By this late developmental stage, both species appear to enter a similar senescence trajectory, reallocating nitrogen from chlorophyll-rich photosynthetic tissues to reproductive structures. The obvious decline in A. palmeri may reflect its determinate growth pattern and rapid life cycle, whereas I. purpurea maintains a more gradual physiological decline, consistent with its indeterminate vining habit.
Temporal dynamics between 28 and 80 DAE revealed a clear ontogenetic decline in chlorophyll for both species (Figure 4b). Similar temporal patterns have been documented in crop-weed competition studies, where photosynthetic efficiency and chlorophyll fluorescence parameters decline as plants transition from vegetative to reproductive stages [38], as it was previously discussed for the bean crop. The observation that A. palmeri begins with higher chlorophyll but declines more rapidly than I. purpurea has practical implications for weed management timing. Early-season control of A. palmeri is critical because its competitive impact is front-loaded; it achieves high photosynthetic rates early and can rapidly outcompete the crop for light and nutrients [5]. Delayed control allows the weed to establish a photosynthetic advantage against the crop.

4.3. Effects of Competition on Bean Yield and Yield Components at Various Replacement Series Proportions

The number of pods per plant exhibited a positive response to increasing bean proportion in the replacement series mixtures (Figure 5). This indicates that intraspecific competition among bean plants is less disadvantageous compared to interspecific competition, especially with aggressive weeds [45]. The substantial reduction in pod number at low bean proportions (i.e., 25:75) reflects resource limitation, as weed species with greater height growth and canopy expansion, such as A. palmeri, suppress the shorter bean plants. At the 100:0 ratio, the absence of interspecific competition allowed bean plants to fully express their genetic potential for pod production, despite the effects of intraspecific competition.
The smaller relative increase in seeds per pod compared to pods per plant suggests that this yield component is less plastic in response to the competition regime and more genetically constrained. However, the increase from the lowest to the highest bean proportion reveals that weed competition significantly impairs seed set and development. Resource competition during the reproductive phase restricts sugar and nitrogen allocation to reproductive sinks, alters hormone levels, and frequently triggers reduced ovule fertilization and seed abortion [46].
Below the 50:50 threshold severe competition from weeds limits photosynthate allocation to developing pods, resulting in smaller, less filled pods (Figure 5c). This threshold could be considered as a minimum compensatory proportion of the total bean population. The C₄ photosynthetic efficiency of A. palmeri, or the climbing habit of I. purpurea, generates a highly competitive environment that reduces bean plants the light energy necessary for carbohydrate accumulation in pods [47,48]. The results presented here align with findings from competitive studies where bean yield components are differentially sensitive to weed interference, with yield (pods per plant) being among the most severely affected parameters [49].
The higher pod seed production in the presence of A. palmeri suggests that, despite its aggressivity, this species may exert its competitive effects through mechanisms that are less disruptive to bean reproductive development during the critical seed-filling period. On the contrary, the vining growth habit of I. purpurea may cause more direct physical interference with bean flowers and developing pods, or its climbing behavior may create denser shade over the bean canopy during the reproductive stage, thereby reducing photosynthate translocation to seeds. Morningglory species are known to climb crop plants and form dense canopies that severely restrict light penetration [13,50], which could explain the greater negative impact on seed development.
This outcome is noteworthy because A. palmeri is generally considered the more aggressive competitor due to its C₄ photosynthetic advantage and rapid biomass accumulation [11]. However, the results suggest that the competitive mechanism plays an important role. A. palmeri possibly competes primarily for below-ground resources (water and nutrients) and intercepts light through vertical growth, whereas I. purpurea’s vining habit creates a physical smothering effect that directly constrains bean pod development and filling. The climbing stems of morningglory can wrap around bean plants, physically restricting expansion and creating microenvironments with reduced light quality (e.g., altered red:far-red ratios) that trigger shade avoidance responses, diverting resources from reproduction to stem elongation [51] The findings presented her for A. palmeri, are supported by the bean-specific study of Miranda et al. [4], which found that season-long A. palmeri interference reduced dry edible bean yield by 77% at 2 plants m⁻¹ of row, with yield reduction primarily associated with fewer pods per bean plant.
The absence of a plateau, in relation to that shown in A. palmeri, between 50:50 and 75:50 crop: weed proportions (Figure 7), indicates that I. purpurea maintains a consistent per-plant competitive effectiveness across all proportions. This is consistent with the climbing growth habit of the weed, which allows individual vines to exploit vertical space and intercept light regardless of neighboring plant density. The climbing habit enables I. purpurea to overtop bean canopies and create a parasitic shading effect that intensifies proportionally with vine biomass.
Jolliffe [52] stated that RYT values >1 indicate niche differentiation, whereas values <1 reflect strong competition. This suggests niche differentiation or competitive equivalence between beans and weeds at equal proportions, where neither species fully dominates, and both exploit resources more fully than in either monoculture. The TRY pattern is ecologically significant because it deviates from the monotonic decline typically observed in crop-weed systems, implying that competitive interactions are more complex than simple resource preemption models predict. In summary, the differential competitive ability of the two weed species has direct management implications. The continuous decline in bean RY with I. purpurea indicates that the control of this species should be prioritized, as even low-density infestations cause substantial and proportional yield loss. From a physiological perspective, the yield component analysis explains why total yield loss is so severe at high weed proportions. At 25:75, the combined effect of 70% fewer pods, 33% fewer seeds per pod, and 41% lower pod weight results in a multiplicative reduction in total yield that far exceeds the simple sum of the individual component losses. This compounding effect underlines the importance of early-season weed control to protect the critical window of pod initiation, as compensatory increases in later-formed components cannot fully offset early losses. However, Jolliffe [52] and Leon et al. [53] argued that RY and TRY should be interpreted with caution because plant density, plant size, emergence timing, and resource availability can influence competitive outcomes in replacement series experiments. Therefore, TRY> 1 should not by itself be taken as proof of facilitation, particularly given known limitations of replacement-series designs.

5. Conclusions

This study demonstrates that weed competition in common bean is a complex, species-specific phenomenon that cannot be adequately characterized by simple yield loss percentages alone. I. purpurea is a more aggressive competitor than A. palmeri across all proportions, causing continuous and severe yield decline, whereas A. palmeri exhibits a threshold competitive response, with maximum impact achieved at relatively low proportions. Total relative yield that overyields at 50:50 indicates niche differentiation or competitive equivalence and allows further mechanistic investigation. Finally, pods per plant is the most sensitive yield component, followed by pod weight and seeds per pod, and yield component losses are multiplicative, creating disproportionate total yield reductions at high weed densities. For agricultural practice, these results support integrated weed management strategies that prioritize I. purpurea control due to its superior competitive ability while implementing early-season intervention to protect the critical pod initiation phase. Although management of A. palmeri can be optimized by targeting threshold densities rather than pursuing complete eradication is not recommended due to biological and physiological traits that characterize this weed. Future research should investigate the mechanistic basis of TRY overyielding and explore whether crop cultivars with improved light interception efficiency can reduce competitive asymmetry in mixed crop-weed stands.

Author Contributions

conceptualization, N.E.K..; methodology, N.E.K.; validation, N.E.K, C.K. and TKG; formal analysis, N.E.K.; investigation, A.K., C.K. and N.E.K; resources, N.E.K; data curation, N.E.K and C.K.; N.E.K.; writing—review and editing, N.E.K., A.K., C.K., T.K.G; visualization, N.E.K., T.K.G., C.K.; supervision, N.E.K; project administration, N.E.K. All authors have read and agreed to the published version of the manuscript.

Funding

This research received no external funding.

Data Availability Statement

The original data presented in this study are included in the article. Further inquiries can be directed to the corresponding author.

Conflicts of Interest

The authors declare no conflicts of interest.

Abbreviations

The following abbreviations are used in this manuscript:
RY Relative Yield
TRY Total Relative Yield
CRBD Complete Randomized Block Design

References

  1. Galon, L.; Balla, C.D.; Henz Neto, O.D.; Tedesco, L.; Concenço, G.; Franco, A.M.P.; Ribeiro Dos Anjos, A.D.; Dassoler, O.A.; Trezzi, M.M.; Perin, G.F. Morphophysiological and nutritional responses of bean cultivars in competition with Digitaria insularis. Plants 2025, 14, 2684. [Google Scholar] [CrossRef] [PubMed]
  2. Wallace, J.M.; Knezevic, S.Z.; VanGessel, M.J. Associations among weed communities, management practices, and environmental factors in U.S. snap bean (Phaseolus vulgaris) production. Agronomy 2025, 12, 2392. [Google Scholar]
  3. Pavlovic, P.; Colquhoun, J.B.; Korres, N.E.; Landau, C.A.; Liu, R.; Lowry, C.J.; Martin, N.F.; Peachey, E.D.; Scott, B.; Sosnoskie, L.M.; VanGessel, M.J.; Williams, M.M., Jr. Associations among weed communities, management practices, and environmental factors in US snap bean (Phaseolus vulgaris) production. PLoS ONE 2025, 20, e0332925. [Google Scholar] [CrossRef] [PubMed]
  4. Miranda, J.W.A.; Jhale, A.J.; Bradshaw, J.; Lawrence, N.C. Palmer amaranth (Amaranthus palmeri) interference and seed production in dry edible bean. Weed Tech. 2021, 35, 995–1006. [Google Scholar] [CrossRef]
  5. Mahoney, D.J.; Jordan, D.L.; Hare, A.T.; Leon, R.G.; Burgos, R.N.; Vann, M.C.; Jennings, K.M.; Everman, W.J.; Cahoon, C.W. Palmer amaranth (Amaranthus palmeri) growth and seed production when in competition with peanut and other crops in North Carolina. Agronomy 2021, 11, 1734. [Google Scholar] [CrossRef]
  6. Soltani, N.; Dille, J.A.; Gulden, R.H.; Sprague, C.; Zollinger, R.K.; Morishita, D.W.; Lawrence, N.C.; Sbatella, G.M.; Kniss, A.R.; Jha, P.; Sikkema, P.H. Potential yield loss in dry bean crops due to weeds in the United States and Canada. Weed Tech. 2018, 32, 342–346. [Google Scholar] [CrossRef]
  7. Korres, N.E.; Norsworthy, J.K.; Mauromoustakos, A. Effects of Palmer amaranth (Amaranthus palmeri) establishment time and distance from the crop row on biological and phenological characteristics of the weed: Implications on soybean yield. Weed Sci. 2019, 67, 126–135. [Google Scholar] [CrossRef]
  8. Korres, N.E.; Norsworthy, J.K.; FitzSimons, T.; Roberts, T.L.; Oosterhuis, D.M.; Govindjee, C. Evaluation of secondary sexual dimorphism of the dioecious Amaranthus palmeri under abiotic stress. Sci. Rep. 2023, 13, 13156. [Google Scholar] [CrossRef] [PubMed]
  9. Ram, B.G.; Zhang, Y.; Costa, C.; Ahmed, M.R.; Peters, T.; Jhala, A.; Howatt, K.; Sun, X. Palmer amaranth identification using hyperspectral imaging and machine learning technologies in soybean field. Comp. Electron Agri 2023, 215, 108444. [Google Scholar] [CrossRef]
  10. Matzrafi, M.; Scarabel, L.; Milani, A.; Iamonico, I.; Torra, J.; Recasens, J.; Montull, J.M.; Llenes, J.M.; Gazoulis, I.; Tataridas, A.; Rubin, B.; Pardo, G.; Cirujeba, A.; Mari, A.I.; Mennan, H.; Kanatas, P.; Dogan, M.N. Amaranthus palmeri S. Watson: A new threat to agriculture in Europe and the Mediterranean. Weed Res. 2023, 63, 423–438. [Google Scholar] [CrossRef]
  11. Ward, S.M.; Webster, T.M.; Steckel, L.E. Palmer amaranth (Amaranthus palmeri): A review. Weed Tech. 2013, 27, 12–27. [Google Scholar] [CrossRef]
  12. Horak, M.J.; Loughin, T.M. Growth analysis of four Amaranthus species. Weed Sci. 2000, 48, 347–355. [Google Scholar]
  13. Pagnoncelli, F.D.B.; Trezzi, M.M.; Brum, B.; Vidal, R.A.; Portes, A.F.; Scalcon, E.L.; Machado, A. Interference of morning glory species on soybean yield. Planta Daninha 2018, 36, e018150988. [Google Scholar] [CrossRef]
  14. Korres, N.E.; Norsworthy, J.K.; Brye, K.R.; Vaughn, S.J., Jr.; Mauromoustakos, A. Relationships between soil properties and the occurrence of the most agronomically important weed species in the field margins of eastern Arkansas: implications for weed management in field margins. Weed Res. 2017, 57, 159–171. [Google Scholar] [CrossRef]
  15. Sankula, S.; Everts, K.L.; Whalen, J.M.; VanGessel, M.J. Influence of weed species and density on lime bean yield and other pests. Front Agron. 2024, 6, 1364232. [Google Scholar] [CrossRef]
  16. Mircea, D.M.; Li, R.; Blasco Gimenez, L.; Vicente, O.; Sestras, A.F.; Sestras, R.E.; Boscaiu, M.; Mir, R. Salt and water stress tolerance in Ipomoea purpurea and Ipomoea tricolor, two ornamentals with invasive potential. Agronomy 2023, 13, 2198. [Google Scholar] [CrossRef]
  17. Radosevich, S.R. Methods to study interactions among crops and weeds. Weed Tech. 1987, 1, 190–198. [Google Scholar] [CrossRef]
  18. Norsworthy, J.K.; Korres, N.E.; Bagavathiannan, M.V. Weed seedbank management: Revisiting how herbicides are evaluated. Weed Sci. 2018, 66, 415–417. [Google Scholar] [CrossRef]
  19. Korres, N.E.; Norsworthy, J.K.; Mauromoustakos, A.; Williams, M.M. Soybean density and Palmer amaranth (Amaranthus palmeri) establishment time. Effects on weed biology, crop yield and economic returns. Weed Sci. 2020, 68, 467–475. [Google Scholar] [CrossRef]
  20. Cousens, R.; O'Neill, M. Density dependence of replacement series experiments. Oikos 1993, 66, 347–352. [Google Scholar] [CrossRef]
  21. Swanton, C.J.; Nkoa, R.; Blackshaw, R.E. Experimental methods for crop-weed competition studies. Weed Sci. 2015, 63, 2–11. [Google Scholar] [CrossRef]
  22. Rogers, I.S. The effect of plant density on the yield of three varieties of French beans (Phaseolus vulgaris L.). J. Hort. Sci. 1976, 51, 481–488. [Google Scholar] [CrossRef]
  23. Nkumbula, S. The effect of plant population, spatial arrangement and weed competition on growth and yield of dwarf beans (Phaseolus vulgaris L.). MSc Thesis, University of Canterbury, Lincoln College, UK, 1982. [Google Scholar]
  24. Centro Internacional de Agricultura Tropical (CIAT). Stages of Development of the Common Bean Plant. CIAT, Cali, Colombia, 1986.
  25. Kalaitzidis, A.; Zotou, A.; Loka, D.; Mpeza, P.; Archimandriti, P.; Korres, N.E. Effects of water stress on the morpho-physiological characteristics of Gossypium hirsutum (cotton) and Abutilon theophrasti (velvetleaf). Phyton. J. Exp. Bot. 2026, 95, 9. [Google Scholar] [CrossRef]
  26. Hock, S.M.; Knezevic, S.Z.; Martin, A.R. Soybean row spacing and weed emergence time influence weed competitiveness and competitive indices. Weed Sci. 2006, 54, 38–46. [Google Scholar] [CrossRef]
  27. Willey, R.W.; Rao, M.R. A competitive ratio for quantifying competition between intercrops. Exp. Agr. 1980, 16, 117–125. [Google Scholar] [CrossRef]
  28. Doubi, B.T.S.; Kouassi, K.I.; Kouakou, K.L.; Koffi, K.K.; Baudoin, J.P.; Zoro, B.I.A. Existing competitive indices in the intercropping system of Manihot esculenta Crantz and Lagenaria siceraria (Molina) Standley. J. Plant Inter 2016, 11, 178–185. [Google Scholar] [CrossRef]
  29. Corre-Hellou, G.; Dibet, A.; Hauggaard-Nielsen, H.; Crozat, Y.; Gooding, M.; Ambus, P.; Dahlmann, C.; von Fragstein, P.; Pristeri, A.; Monti, M.; Jensen, E.S. The competitive ability of pea-barley intercrops against weeds and the interactions with crop productivity and soil N availability. Field Crops Res. 2011, 122, 264–272. [Google Scholar] [CrossRef]
  30. Swanton, C.J.; Afifi, M.; Soltani, N.; Robinson, D.E. Weed-induced crop yield loss: a new paradigm and new challenges. Trends Plant Sci. 2023, 28, 312–322. [Google Scholar] [CrossRef] [PubMed]
  31. Zambelli, A.; Nocito, F.F.; Araniti, F. Exploring the Role of Root Exudates in Plant Interactions and Agricultural Practices. Agrosus Res. 2025, 47. [Google Scholar]
  32. Kong, C.H.; Zhang, S.X.; Li, Y.H.; Xia, Z.C.; Xuan, T.D.; Tan, F. Root exudate signals in plant–plant interactions. Plant Cell Environ. 2020, 43, 2831–2846. [Google Scholar] [CrossRef] [PubMed]
  33. Scavo, A.; Restuccia, A.; Fontanazza, S.; Abbott, L.K.; Mauromicale, G. A Framework for Understanding Crop-Weed Competition in Agroecosystems. Agronomy 2025, 15, 2366. [Google Scholar] [CrossRef]
  34. Gaba, S.; Fried, G.; Cazelles, B.; Delos, M.; Reboud, X. Functional trait-mediated limiting similarity shapes weed communities under competitive filtering. J. Appl. Ecol. 2024, 61, 892–903. [Google Scholar] [PubMed Central]
  35. Savic, A.; Popovic, A.; Đurovic, S.; Pisinov, B.; Ugrinovic, M.; Todorovic, M.J. A Framework for Understanding Crop–Weed Competition in Agroecosystems. Agronomy 2025, 15, 2366. [Google Scholar] [CrossRef]
  36. Hardarson, G.; Zapata, F. Effect of plant genotype and nitrogen fertilizer on symbiotic nitrogen fixation by soybean cultivars. Plant Soil 1984, 82, 397–405. [Google Scholar] [CrossRef]
  37. Lindemann, W.; Glover, C. Nitrogen fixation by legumes. New Mexico State University. Cooperative Extension Services. 2003. Available online: http://www.soilcropandmore.info/crops/alfalfa/Nitrogen-Fixation-by-Legumes-a-129.pdf.
  38. McKenzie-Gopsill, A.G.; Amirsadeghi, S.; Fillmore, S.; Swanton, C.J. Duration of weed presence influences the recovery of photosynthetic efficiency and yield in common bean (Phaseolus vulgaris L.). Front. Agron. 2020, 2, 593570. [Google Scholar] [CrossRef]
  39. Ronay, I.; Ephrath, J.E.; Eizenberg, H.; Blumberg, D.G.; Maman, S. Hyperspectral Reflectance and Indices for Characterizing the Dynamics of Crop–Weed Competition for Water. Remote Sens. 2021, 13, 513. [Google Scholar] [CrossRef]
  40. Shi, S.; Mia, H.; Du, X.; Gu, J.; Xia, K. GmSGR1, a stay-green gene in soybean (Glycine Max L.) plays an important role in regulating early leaf-yellowing phenotype and plant productivity under nitrogen deprivation. Acta Physiol. Planta 2016, 38, 97. [Google Scholar] [CrossRef]
  41. Gong, X.; Liu, C.; Ferdinand, U.; Dang, K.; Zhao, G.; Yang, P.; Feng, B. L. Effect of intercropping on leaf senescence related to physiological metabolism in proso millet (Panicum miliaceum L.). Photosynthetica 2019, 57, 993–1006. [Google Scholar] [CrossRef]
  42. Yin, W.; Chai, Q.; Fan, Z.; Hu, F.; Zhao, L.; Fan, H.; He, W.; Zhao, C.; Yu, A.; Sun, Y.; Wang, F. Review on physiological and ecological characteristics and agronomic regulatory pathways of intercropping to delay root and canopy senescence of crops. J. Integr. Agri 2025, 24, 1–22. [Google Scholar]
  43. Ariel, C.E.; Eduardo, O.A.; Benito, G.E.; Lidia, G. Effects of two plant arrangements in corn (Zea mays L.) and soybean (Glycine max L. Merrill) intercropping on soil nitrogen and phosphorus status and growth of component crops at an Argentinean Argiudoll. Am. J. Agri For. 2013, 1, 22–31. [Google Scholar] [CrossRef]
  44. Hu, F.L.; Gao, Q.Y.; Jiao, J.G.; Huang, Q.R.; Zhou, J.; Hu, F. Comparison of photosynthesis efficiency in different intercropping patterns of cassava with peanut. Agri Food Sci. 2012, 44, 332–337. [Google Scholar]
  45. Carvalho, S.J.P.; Christoffoleti, P.J. Competitividade de cultivares de feijoeiro com plantas de Amaranthus sp. em diferentes densidades de plantas. Planta Daninha 2008, 26, 87–97. [Google Scholar]
  46. Severino, L.S.; Auld, D.L. A framework for the study of the growth and development of castor plant. Ind. Crops Prod. 2013, 46, 25–38. [Google Scholar] [CrossRef]
  47. Wang, Z.Y.; Klessig, D.F.; Berry, J.O. Regulation of C4 gene expression in Amaranthus palmeri. Plant Physiol. 1992, 99, 863–871. [Google Scholar]
  48. Ehleringer, J.R.; Forseth, I.N. Solar tracking by plants. Science 1980, 210, 1094–1098. [Google Scholar] [CrossRef] [PubMed]
  49. Green-Tracewicz, E.; Page, E.R.; Swanton, C.J. Seed density affects the relative competitiveness of glyphosate-resistant and glyphosate-susceptible common waterhemp (Amaranthus rudis) biotypes. Weed Sci. 2011, 59, 503–510. [Google Scholar]
  50. Webster, T.M.; Coble, H.D. Changes in the weed species composition of the southern United States: 1974-1995. Weed Tech. 1997, 11, 308–317. [Google Scholar] [CrossRef]
  51. Procopio, S.D.O.; Soares, A.M.; Ferreira, L.R.; Bastos, E.A. Crescimento e acúmulo de nutrientes em cultivares de feijoeiro de porte ereto e de porte semi-prostrado. Rev. Caatinga 2004, 17, 35–42. [Google Scholar]
  52. Jolliffe, P.A. The replacement series. J. Ecol. 2000, 88, 371–385. [Google Scholar] [CrossRef]
  53. Leon, R.G.; Oreja, F.H.; Mirsky, S.B.; Reberg-Horton, C.S. Addressing biases in replacement series: The importance of reference density selection for interpretation of competition outcomes. Weed Sci. 2023, 71, 606–614. [Google Scholar] [CrossRef]
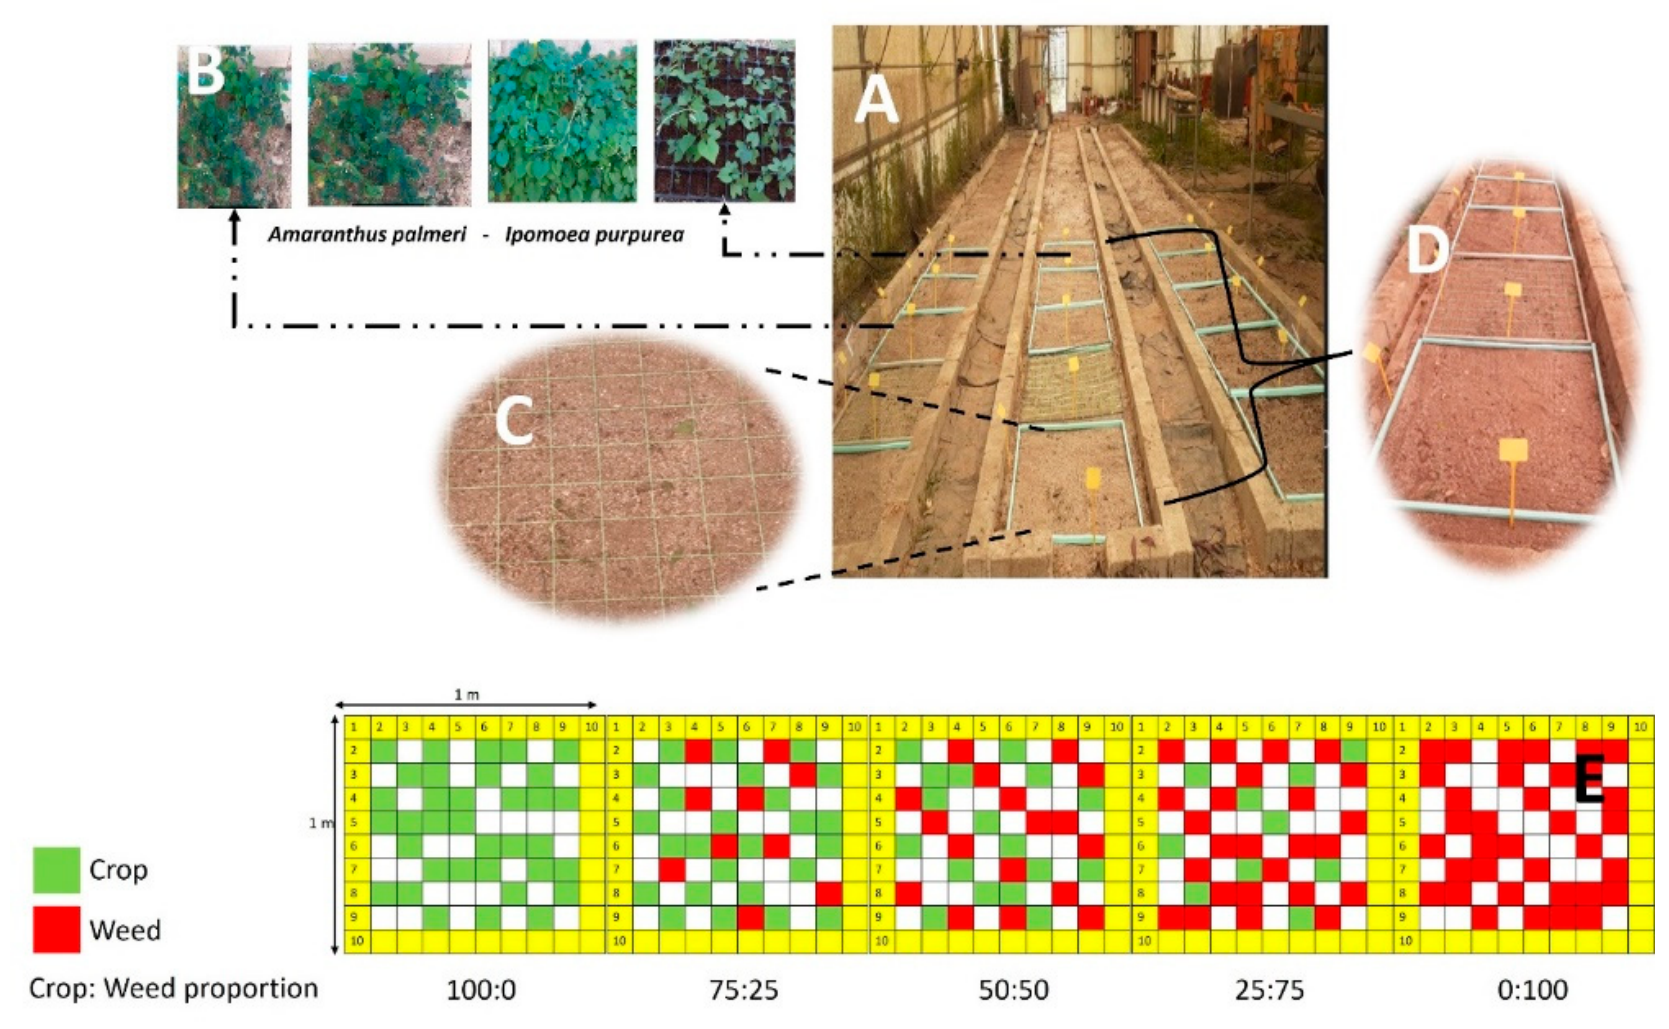
Figure 1. Overall layout of the replacement series design. The layout shows multiple experimental units arranged as a CRBD (A). Details of different crop: weed proportions involving bean and two weed species, A. palmeri and I. purpurea, at different proportions with the crop, are shown in (B), whereas details of the experimental treatments’ compartmentalization are shown in (C) and (D), illustrating how the treatments were physically separated along 15-meter-long garden beds. This compartmentalization ensures each proportion treatment is maintained within defined boundaries, preventing cross-contamination between treatments while allowing systematic replacement of crop with weed individuals according to the designed proportions. The lower part (E) of the figure shows a grid-based visualization of five crop-to-weed proportions from left to right: 100:0, 75:25, 50:50, 25:75, and 0:100. Green and red squares represent the presence of crop and/or weeds, respectively, while white squares represent unplanted spaces. The figure includes a scale bar indicating 1 m, which applies to both the schematic layout and the grid-based proportion diagram, allowing for accurate spatial interpretation of the experimental design. In addition, a 10 cm border was excluded from all sides (yellow pixels in E) of each plot to minimize edge effects.
Preprints 231849 g001
Figure 2. Effects of replacement series population proportions on bean’s total chlorophyll content, averaged across weed species at different sampling occasions. Vertical bars represent LSD values at a=0.05.
Preprints 231849 g002
Figure 3. Volumetric water content across replacement series population proportions in the presence of weed species. Vertical bars indicate the LSD values at a=0.05.
Preprints 231849 g003
Figure 4. Effects of replacement series population proportions on total weed chlorophyll content (a) and at three sampling occasions averaged across replacement series population proportions (b). Vertical bars represent LSD values at α = 0.05.
Preprints 231849 g004
Figure 5. Effect of replacement series population proportions on P. vulgaris yield components. Vertical bars represent LSD values at a=0.05.
Preprints 231849 g005
Figure 6. Effects of weed species on P. vulgaris yield components averaged across replacement series population proportions. Vertical bars represent LSD values at a=0.05.
Preprints 231849 g006
Figure 7. Diagrammatic representation of relative yield (RY) and total relative yield (TRY) estimated in the replacement series between P. vulgaris and A. palmeri or I. purpurea for each replacement series population proportion between bean and weed species, along with “neutral interaction” (theoretical relationship between P. vulgaris yield in the presence of each weed species) depicted as dashed (reference) lines.
Preprints 231849 g007
Table 1. Summary of the experimental design parameters.
Parameter Description
Crop species Phaseolus vulgaris L. (cv. Quartz, common name French bean))
Weed species Amaranthus palmeri S. Watson; Ipomoea purpurea (L.) Roth
Experimental design Replacement series (de Wit, 1960)
Crop: weeds (A. palmeri/I. purpurea) mixture ratios 100:0, 75:25, 50:50, 25:75, 0:100
Total density Constant at 35 plants m⁻²
Plot size 1 m × 1 m
Replications n = 4 (CRBD)
Growing season June-October, 2025
Table 2. Relative yield and total relative yield based on pod number per plant formulae.
Index Formula Interpretation
Relative Yield (RY) Ymixture / Ymonoculture Crop yield in mixture with weeds relative to monoculture; RY = 1.0 indicates no competition effect.
Total Relative Yield (TRY) RYweed absent + RYweed present >1.0: overyielding (niche differentiation/facilitation); <1.0: under yielding (weed competition)
Table 3. Bean dry weight and height in a replacement series with the two weed species.
Bean: weed ratio A. palmeri I. purpurea A. palmeri I. purpurea
Bean dry weight (g m-2) Bean height (cm)
100:0 95.1a 88.5a 49.9a 47.8a
75:25 68.0ab 29.9c 55.0a 44.1a
50:50 52.5b 19.2cd 51.7a 59.4a
25:75 31.7b 11.8d 59.4a 41.3a
0:100 No bean No bean No bean No bean
Note: Numbers marked with the same letter are not statistically different at α = 0.05.
Table 4. Weed dry weight and height in the replacement series with bean.
Bean: weed ratio A. palmeri I. purpurea A. palmeri I. purpurea
Dry weight (g m-2) Height (cm)
100:0 No weed No weed No weed No weed
75:25 115.0cd 205.0a 108.0b 192.0a
50:50 111.0d 207.0a 79.1c 193.3a
25:75 151.9bc 239.0a 98.0b 208.5a
0:100 162.1b 268.9a 103.6b 205.1a
Note: Numbers marked with the same letter are not statistically different at a=0.05.
Table 5. Number of bean plants in the reproductive stage (flowering to pod filling) at different crop: weed replacement series proportions and sampling occasions.
Crop: weed ratio 33 DAE 38 DAE 47 DAE
100:0 4.78b 8.40a 11.80a
75:25 3.00c 5.80b 8.50a
50:50 2.50c 4.70bc 6.50ab
25:75 1.50cd 2.90c 2.90c
0:100 No bean plants No bean plants No bean plants
Note: numbers marked with the same letter are not statistically different at a=0.05.
Disclaimer/Publisher’s Note: The statements, opinions and data contained in all publications are solely those of the individual author(s) and contributor(s) and not of MDPI and/or the editor(s). MDPI and/or the editor(s) disclaim responsibility for any injury to people or property resulting from any ideas, methods, instructions or products referred to in the content.
Copyright: This open access article is published under a Creative Commons CC BY 4.0 license, which permit the free download, distribution, and reuse, provided that the author and preprint are cited in any reuse.