

Submitted:
05 September 2026
Posted:
08 September 2026
You are already at the latest version
Abstract
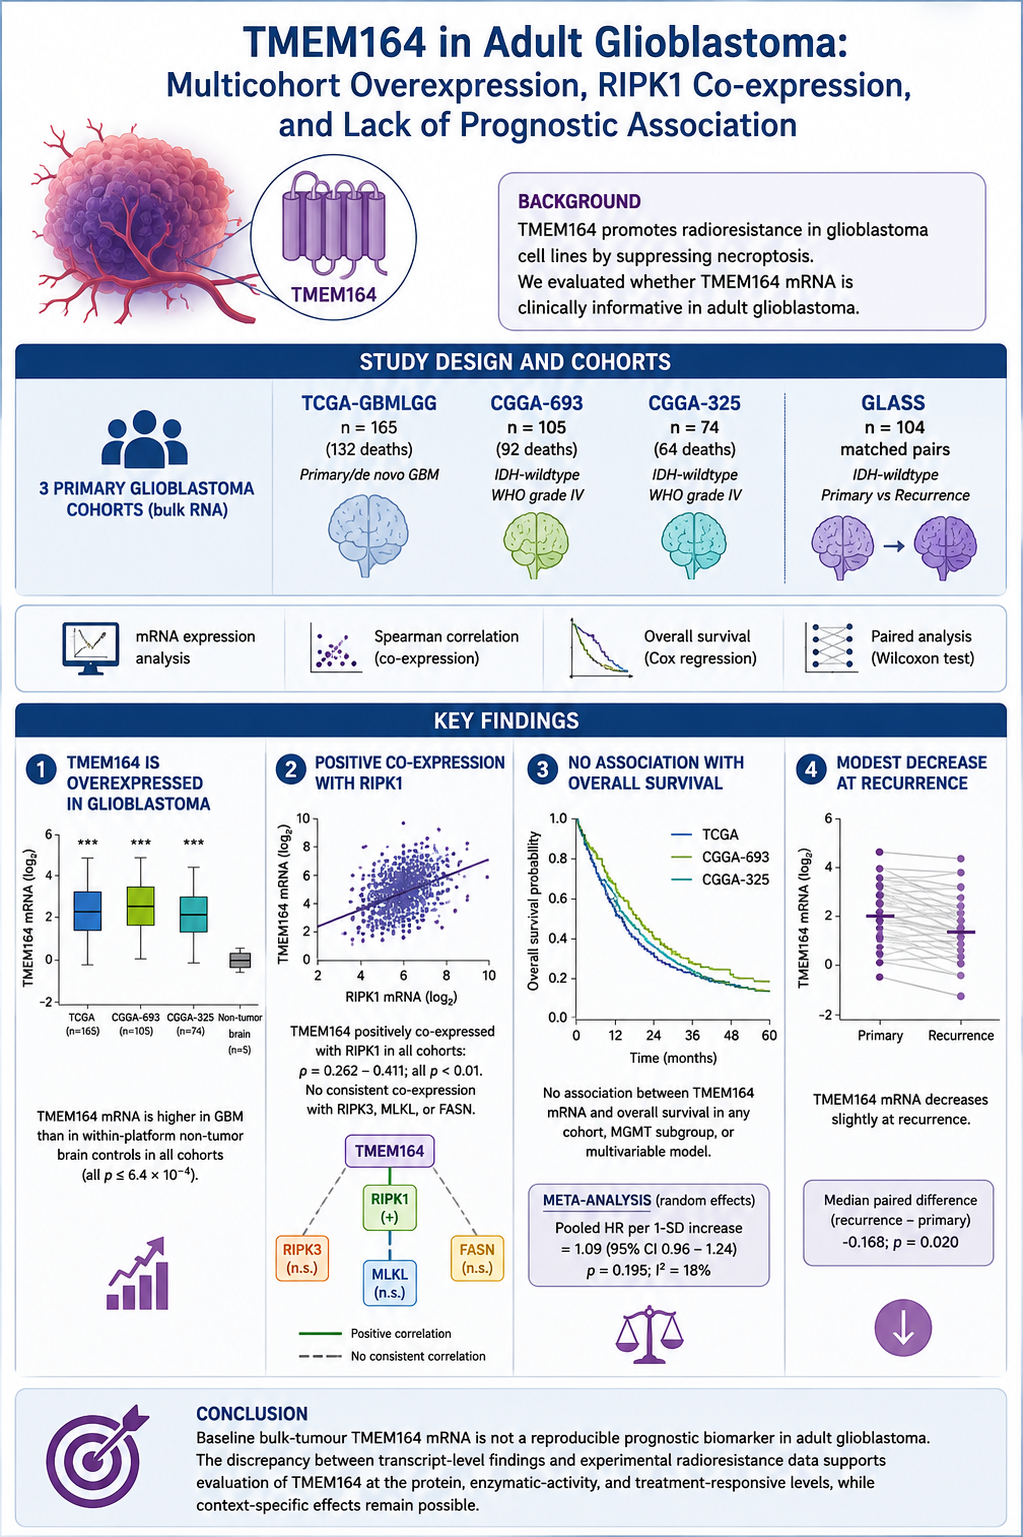
Background/Objectives: Experimental work has implicated TMEM164 in glioblastoma radioresistance through post-translational inhibition of FASN and suppression of radiation-induced necroptosis, supported clinically by a dichotomised single-database survival analysis. We tested whether bulk-tumour TMEM164 mRNA carries the clinical signal that model predicts. Methods: Secondary analysis of four public resources: TCGA (n = 153), CGGA-693 (n = 104), CGGA-325 (n = 73), and 104 matched primary-recurrence pairs from GLASS. Overall survival was modelled by continuous Cox regression, pooled by Hartung-Knapp random-effects meta-analysis. Results: TMEM164 occupied a higher within-sample percentile in tumour than in non-tumour brain in all three cohorts (Cliff’s δ 0.68–0.85; all p ≤ 1.3 × 10⁻³) and was co-expressed with RIPK1 (ρ 0.25–0.44; all q < 0.05), ranking 43rd of 19,985 genes and unchanged by adjustment for tumour composition. No association with overall survival replicated across cohorts, in the pooled analysis (HR 1.11, 95% CI 0.77–1.61; I² = 49.9%), among irradiated patients, or in confirmed IDH-wildtype cases; isolated nominally significant positive estimates arose in exploratory strata and were not reproduced elsewhere. With 277 events the pooled interval excludes hazard ratios above approximately 1.6 per standard deviation, while smaller effects remain compatible. An optimal cutpoint generated HR 1.83 (p = 0.004) that did not survive correction for selection. TMEM164 protein was quantified in 0 of 99 CPTAC glioblastomas. Conclusions: Baseline bulk-tumour TMEM164 mRNA carries no reproducible prognostic information in adult glioblastoma. The proposed mechanism is post-translational and must be tested at the protein and activity level, on treatment-related tissue sampling.
Keywords:
glioblastoma
; TMEM164
; RIPK1
; necroptosis
; radioresistance
; prognostic biomarker
; meta-analysis
; secondary analysis
1. Introduction
Glioblastoma, IDH-wildtype, is the most aggressive primary malignant brain tumour in adults and remains associated with poor survival despite maximal safe resection followed by radiotherapy and temozolomide [1,2,3]. Radioresistance is sustained by efficient DNA-damage responses, stem-like cellular states, and microenvironmental adaptation, and almost all tumours ultimately recur [3,4]. Identifying mechanisms that are biologically actionable and measurable in patients is therefore a major translational priority.
Transmembrane protein 164 (TMEM164) has emerged as a regulator of lipid remodelling and regulated cell death [5]. In cancer models, TMEM164 promotes autophagy-dependent ferroptosis by selectively mediating ATG5-dependent autophagosome formation, and high TMEM164 expression is associated with improved survival in pancreatic cancer [6]. Structural studies subsequently identified TMEM164 as a seven-transmembrane acyltransferase that remodels polyunsaturated ether phospholipids, characterised it as anti-ferroptotic, and identified an experimental S-enantiomer of montelukast as a candidate inhibitor [7]. The direction of effect attributed to TMEM164 therefore differs between these two reports, pro-ferroptotic in the first and anti-ferroptotic in the second, as well as between tumour types. Both nonetheless provide a defined enzymatic framework for therapeutic investigation.
In glioblastoma cell lines, Jiang et al. reported that fractionated irradiation induced TMEM164 and that TMEM164 enhanced radioresistance by suppressing radiation-induced necroptosis [8]. Every step of the proposed mechanism operates downstream of transcription. TMEM164 was reported to interact with FASN and to inhibit its enzymatic activity, producing NADPH accumulation, neutralisation of radiation-induced reactive oxygen species, and reduced phosphorylation of the necroptosis effectors RIPK1, RIPK3 and MLKL, which were measured as phosphoproteins rather than as transcripts [8]. The supporting clinical evidence, by contrast, rested on a dichotomised single-database Kaplan-Meier comparison with an unspecified threshold, a design known to generate cutpoint-dependent associations [9]. Necroptosis itself is context-dependent in cancer and can support either tumour-cell death or inflammation-mediated progression [10,11].
This asymmetry, between a post-translational mechanism and a transcript-level clinical claim, defines the question addressed here. We conducted a secondary analysis of four independent public transcriptomic resources to determine whether bulk-tumour TMEM164 mRNA is elevated relative to non-tumour brain, co-expressed with RIPK1, RIPK3, MLKL or FASN, associated with overall survival under continuous cutpoint-free models, altered between matched primary and recurrent tumours, or associated with survival specifically among irradiated patients. We further asked whether an optimal-cutpoint analysis can reproduce a positive association in these same data, and whether the protein level at which the mechanism operates is accessible in existing public proteomic resources. The aim is not to test the experimental mechanism, which transcriptomic data cannot address, but to establish what baseline bulk-tumour transcription can and cannot contribute to the evaluation of TMEM164 in patients.
2. Materials and Methods
2.1. Study Design and Data Sources
This was a secondary analysis of four publicly available transcriptomic resources; no new patient data were generated. TCGA-GBM RNA-sequencing and curated clinical data were retrieved through the UCSC Xena platform [12], which hosts data generated by The Cancer Genome Atlas [13]. The Chinese Glioma Genome Atlas (CGGA) mRNAseq_693 and mRNAseq_325 datasets, together with the dedicated non-glioma control dataset, were downloaded from the CGGA portal [14]. The Glioma Longitudinal Analysis Consortium (GLASS) dataset [15] was accessed through cBioPortal [16,17]. Somatic mutation data and CPTAC proteomic data were likewise obtained through cBioPortal.
2.2. Cohort Definition and Data Curation
TCGA cases were restricted to primary, treatment-naive histologic glioblastoma with available TMEM164 expression and overall-survival data. The cohort was audited at sample level. Thirteen samples annotated as recurrent tumour were identified; six of these belonged to patients who were also represented by their primary sample and carried identical survival time and vital status, so that including them would have entered those patients into the survival model twice with identical follow-up. All recurrent samples were excluded, yielding a final cohort of 153 patients with 121 deaths. Five non-tumour brain samples from the same expression matrix (TCGA-06-0675-11, TCGA-06-0678-11, TCGA-06-0680-11, TCGA-06-0681-11, TCGA-06-AABW-11) served as a within-platform reference.
Molecular IDH status was determined for the TCGA cohort from PanCancer Atlas somatic mutation data accessed through cBioPortal, using Entrez Gene identifiers 3417 (IDH1) and 3418 (IDH2). Any non-synonymous variant in either gene was counted as IDH-mutant, without restriction to canonical codons; this conservative definition avoids dependence on hotspot annotation. Mutation data were available for 151 of 153 cases (98.7%), identifying 8 IDH-mutant and 143 confirmed IDH-wildtype tumours, with 2 cases not profiled and retained as a separate category. The resulting classification is consistent with the curated molecular characterisation of TCGA diffuse glioma [18].
CGGA cohorts were restricted to primary, molecularly IDH-wildtype, WHO grade IV tumours in patients aged 18 years or older. The adult age filter excluded one paediatric case from each cohort, yielding 104 patients with 92 deaths in CGGA-693 and 73 patients with 64 deaths in CGGA-325. Twenty non-glioma brain samples from the dedicated CGGA control dataset (Illumina HiSeq, STAR + RSEM pipeline) served as the reference for both CGGA cohorts.
For the longitudinal analysis, GLASS cases were restricted to molecularly IDH-wildtype tumours with RNA sequencing at initial diagnosis and first recurrence, yielding 104 matched pairs with complete tumour-purity annotation.
Cohort independence was verified directly. CGGA-693 and CGGA-325 shared no patient identifiers. GLASS contained 27 TCGA-format identifiers among 314 samples; 9 of the 104 pairs (8.7%) included at least one TCGA sample, and 6 of these patients were also present in the cross-sectional TCGA cohort. GLASS contained no CGGA identifiers. Because the same 20 CGGA controls served both CGGA tumour cohorts, the tumour-versus-non-tumour analysis comprises two independent comparisons (TCGA and CGGA), not three. Cohort composition and covariate availability are given in Supplementary Table S1.
2.3. Expression Processing
TMEM164 expression was transformed within each dataset as log₂(RSEM + 1) for TCGA, log₂(FPKM + 1) for CGGA, and log₂(TPM + 1) for GLASS. Because these units are not interchangeable, absolute expression values were never pooled across platforms; cross-cohort models used standardised (z-scored) expression, and tumour-versus-control comparisons were performed only within the same processing pipeline.
The CGGA control matrix was annotated over 55,523 genes, against 23,987 (CGGA-693) and 24,326 (CGGA-325) in the tumour matrices, with the tumour gene sets entirely contained within the control set. The additional genes contributed a negligible share of total signal (median fraction of library retained within the common gene space, 0.999). For absolute-scale comparisons, counts per million were therefore recomputed separately for each cohort over the corresponding common gene space and log₂(x + 1)-transformed; control values were therefore derived separately for each comparison, although the resulting numerical difference between them is negligible (Supplementary Table S3).
2.4. Tumour Versus Non-Tumour Comparison
The concern with absolute-scale comparison is that library-size normalisation does not remove a global compositional shift between tumour and normal brain. Three constitutively expressed genes (ACTB, GAPDH, TBP) were therefore analysed alongside TMEM164 as negative controls. The primary metric was the within-sample percentile rank of TMEM164 among all genes measured in the same sample. This quantity is invariant to any monotone global rescaling and is therefore unaffected by platform-level or library-level shifts. Absolute-scale comparisons are reported as a secondary analysis. Group differences were tested with the two-sided Wilcoxon rank-sum test, evaluated from the normal approximation to the rank-sum distribution rather than from the exact permutation distribution; with only five TCGA control samples this is the conservative choice, the exact test returning smaller p values than those reported. Effect sizes were quantified with Cliff’s δ and its 95% confidence interval [19].
2.5. Co-Expression Analyses
Spearman rank correlations quantified the association of TMEM164 with RIPK1, RIPK3, MLKL and FASN in each cohort. Because of tied expression values, p values were computed from the asymptotic approximation; 95% confidence intervals were obtained by percentile bootstrap with 2000 resamples (seed 20260831). The resulting 12 tests (3 cohorts × 4 genes) were corrected using the Benjamini-Hochberg procedure [20]. No multiplicity correction was applied to any other analysis in this study; replication across independent cohorts was used instead, and this is stated explicitly wherever a nominal p value is reported.
Two analyses addressed whether TMEM164-RIPK1 co-expression reflects cellular composition rather than a specific relationship. First, a transcriptome-wide null distribution was constructed in TCGA by computing the Spearman correlation of TMEM164 with each of 19,985 analysable genes, and locating ρ(TMEM164, RIPK1) within it. This was performed in TCGA because that cohort yields the strongest observed correlation and therefore provides the condition least favourable to the null hypothesis. Second, partial Spearman correlations were computed adjusting for an immune/myeloid score (mean z-score of PTPRC, AIF1, CD68, CSF1R, ITGAM, TYROBP, C1QA, C1QB, CD14, FCGR3A), a stromal/endothelial score (PECAM1, VWF, COL1A1, COL1A2, DCN, ACTA2), and both jointly.
2.6. Survival Analysis and Model Diagnostics
Overall survival was modelled by Cox proportional-hazards regression with TMEM164 entered as a continuous z-scored variable, so that hazard ratios express the effect of a 1-standard-deviation increase in expression. TMEM164 was modelled as a continuous variable throughout and no data-driven dichotomisation was applied at any stage of the primary analysis; no written analysis plan was registered in advance of the study.
Three diagnostics were applied to every cohort-level model. The proportional-hazards assumption was tested using scaled Schoenfeld residuals, per term and globally. Departure from linearity was tested by refitting the model with a restricted cubic spline in TMEM164 and comparing it with the linear model. Discrimination was quantified by Harrell’s concordance index, corrected for optimism by bootstrap with 2000 resamples (seed 20260831) [21]; both apparent and optimism-corrected values are reported, together with the 95% interval of the optimism estimate (Supplementary Table S4). The index is reported as a magnitude of discrimination rather than as a directional quantity, so that 0.5 denotes no discrimination in either direction. This matters in TCGA, where the point estimate for TMEM164 lies below unity, and the concordance value should be read as the strength of separation and not as evidence that higher expression predicts shorter survival.
For TCGA, the primary multivariable model included TMEM164, age at diagnosis, and molecular IDH status (wildtype / mutant / not profiled), all available for the full cohort of 153 patients with 121 events. A secondary model substituted Karnofsky Performance Status for IDH status and was restricted to the 115 patients with complete KPS (89 events). Covariate completeness in every cohort is tabulated in Supplementary Table S1, and models were built from the covariates that were both available and substantially complete. As a design-stage reference, the minimum hazard ratio per standard deviation detectable with 80% power at a two-sided α of 0.05 was computed for each cohort and for the combined event count from the observed number of events. This quantity describes the sensitivity conferred by the sample sizes and is not used as the exclusion boundary for the observed synthesis, which is read from the confidence interval of the pooled estimate.
2.7. Meta-Analysis
Cohort-specific log hazard ratios, all expressed per standardised unit and therefore on a common scale, were combined by random-effects meta-analysis with restricted maximum-likelihood estimation of τ² [22]. Because REML estimation of between-study variance is unstable with a small number of studies, the Hartung-Knapp-Sidik-Jonkman adjustment was used for primary inference [23], with the unadjusted REML model and a fixed-effect model reported as sensitivity analyses. Heterogeneity was summarised by Cochran’s Q and I² [24], and leave-one-out analysis was performed to assess the influence of each cohort (Supplementary Table S5).
2.8. Cutpoint Analysis
To test whether a positive prognostic association can be produced in these same data by the analytic strategy used in the source study, an optimal cutpoint was identified in each cohort using maximally selected rank statistics. For each cohort the optimal cutpoint, the corresponding hazard ratio, the uncorrected minimum p value, and the p value corrected for cutpoint selection are reported, using the approximation of Lausen and Schumacher [25] as recommended for prognostic-factor studies by Altman et al. [9], implemented in the maxstat package (version 0.7-26). The uncorrected p value is the log-rank test at the selected cutpoint, that is, the quantity an analysis reporting a data-driven dichotomisation would present.
2.9. Subgroup and Sensitivity Analyses
The analyses in this section were not planned in advance and were not corrected for multiplicity. They are exploratory, are reported in full including nominally significant results, and are interpreted accordingly.
Irradiated patients. Radiotherapy exposure was taken from the radiation_therapy field in the TCGA clinical matrix (124 treated, 21 untreated, 8 missing; 2 cases discordant with CDE_radiation_any were retained on the primary variable) and from the Radio_status field in both CGGA cohorts. Cohort-specific models and a meta-analysis were repeated in irradiated patients only. A TMEM164 × radiotherapy interaction was tested by likelihood-ratio test in each cohort. As a sensitivity analysis, the time origin was reset to 90 and to 60 days after diagnosis in the CGGA cohorts (Supplementary Table S6).
Molecular IDH status. The TCGA analysis was repeated in the 143 confirmed IDH-wildtype cases. MGMT promoter methylation. Separate models were fitted in methylated and unmethylated subgroups of both CGGA cohorts (Supplementary Table S10).
Extended CGGA-693 cohort. A cohort of primary, IDH-wildtype, adult cases with non-missing survival and WHO grade was assembled irrespective of grade (n = 164, 130 events). Models were fitted with and without adjustment for grade and age, within each grade stratum, and with a TMEM164 × grade (WHO IV versus II-III) interaction tested by likelihood-ratio test. The correlation between TMEM164 and grade was assessed by Spearman correlation and by Kruskal-Wallis test. The clinical annotation of CGGA-693 comprises histology, grade, age, sex, radiotherapy and chemotherapy status, IDH mutation, 1p/19q codeletion and MGMT promoter methylation; none of the three molecular criteria that define IDH-wildtype glioblastoma under the 2021 WHO classification (TERT promoter mutation, EGFR amplification, combined +7/−10) is available [2]. This cohort is therefore designated mixed-grade IDH-wildtype diffuse glioma, not glioblastoma, and is reported as a power-oriented sensitivity analysis rather than as an extension of the primary cohort (Supplementary Table S7).
2.10. Paired Primary-Recurrence Analysis
Within-patient change from initial diagnosis to first recurrence was tested with the two-sided Wilcoxon signed-rank test, and the effect size was estimated by the Hodges-Lehmann median of pairwise differences with its 95% confidence interval; the proportion of patients with increased expression is also reported. To test whether the observed change is attributable to a shift in specimen composition, tumour purity was compared between paired timepoints, the correlation between change in purity and change in TMEM164 was computed, and linear models of the within-patient difference were fitted with an intercept alone, with change in purity, and with change in purity together with an ESTIMATE-derived score [26]. Tumour purity, ESTIMATE score, immune score and stromal score were taken as annotated in the GLASS clinical data distributed through cBioPortal; no scores were recomputed.
2.11. Protein-Level Assessment
To determine whether the transcript-level findings could be extended to protein, the CPTAC glioblastoma discovery cohort of 99 treatment-naive tumours [27] was interrogated through cBioPortal for TMEM164 (Entrez Gene 84187), using GAPDH, RIPK1, EGFR and SLC7A11 as positive controls, in both the protein-quantification and the z-scored matrices. The same query was extended to all seven CPTAC proteomic studies available through cBioPortal (Supplementary Table S9). Absence of a gene from a quantification matrix is reported as non-detection on that platform and is not interpreted as absence of the protein from tissue.
2.12. Statistical Software and Reproducibility
All analyses were performed in R 4.6.1 using UCSCXenaTools, survival, rms, Hmisc, metafor, metadat, maxstat, data.table, dplyr, reshape2, jsonlite, curl and httr; figures were produced with Python 3.10 and matplotlib 3.10. All tests were two-sided and p < 0.05 was considered nominally significant. A single seed (20260831) was used for every stochastic procedure. Analysis code, all derived analysis tables underlying the figures and tables, and the complete session information are deposited at Zenodo (doi: 10.5281/zenodo.22233721); the full session record is also provided as a supplementary file. This study is reported against the REMARK recommendations for prognostic biomarker studies [28], with the completed checklist supplied as a supplementary file. An analysis of transcriptional cell-state signatures that was present in the originally submitted version has been removed: it contributed to none of the conclusions reported here, was not corrected for multiplicity, and was incompletely reported; it forms no part of the analyses described above.
3. Results
3.1. TMEM164 mRNA Is Higher in Glioblastoma than in Non-Tumour Brain
On the absolute expression scale, TMEM164 was higher in tumour than in non-tumour brain in every comparison, but so were the constitutively expressed control transcripts. In CGGA-325, TMEM164 rose by 1.287 log₂ units (Cliff’s δ +0.767) while ACTB rose by 1.591 (δ +0.934) and GAPDH by 1.019 (δ +0.867); in CGGA-693 the TMEM164 difference did not reach significance (δ +0.216, p = 0.127) while ACTB, GAPDH and TBP all did. In TCGA the pattern was less uniform, with TBP stable (p = 0.197) alongside significant shifts in ACTB, GAPDH and TMEM164. A global shift therefore affects these comparisons that library-size normalisation does not remove, and on the absolute scale a tumour-versus-normal difference cannot be attributed to biological overexpression rather than to technical or compositional difference (Supplementary Table S2).
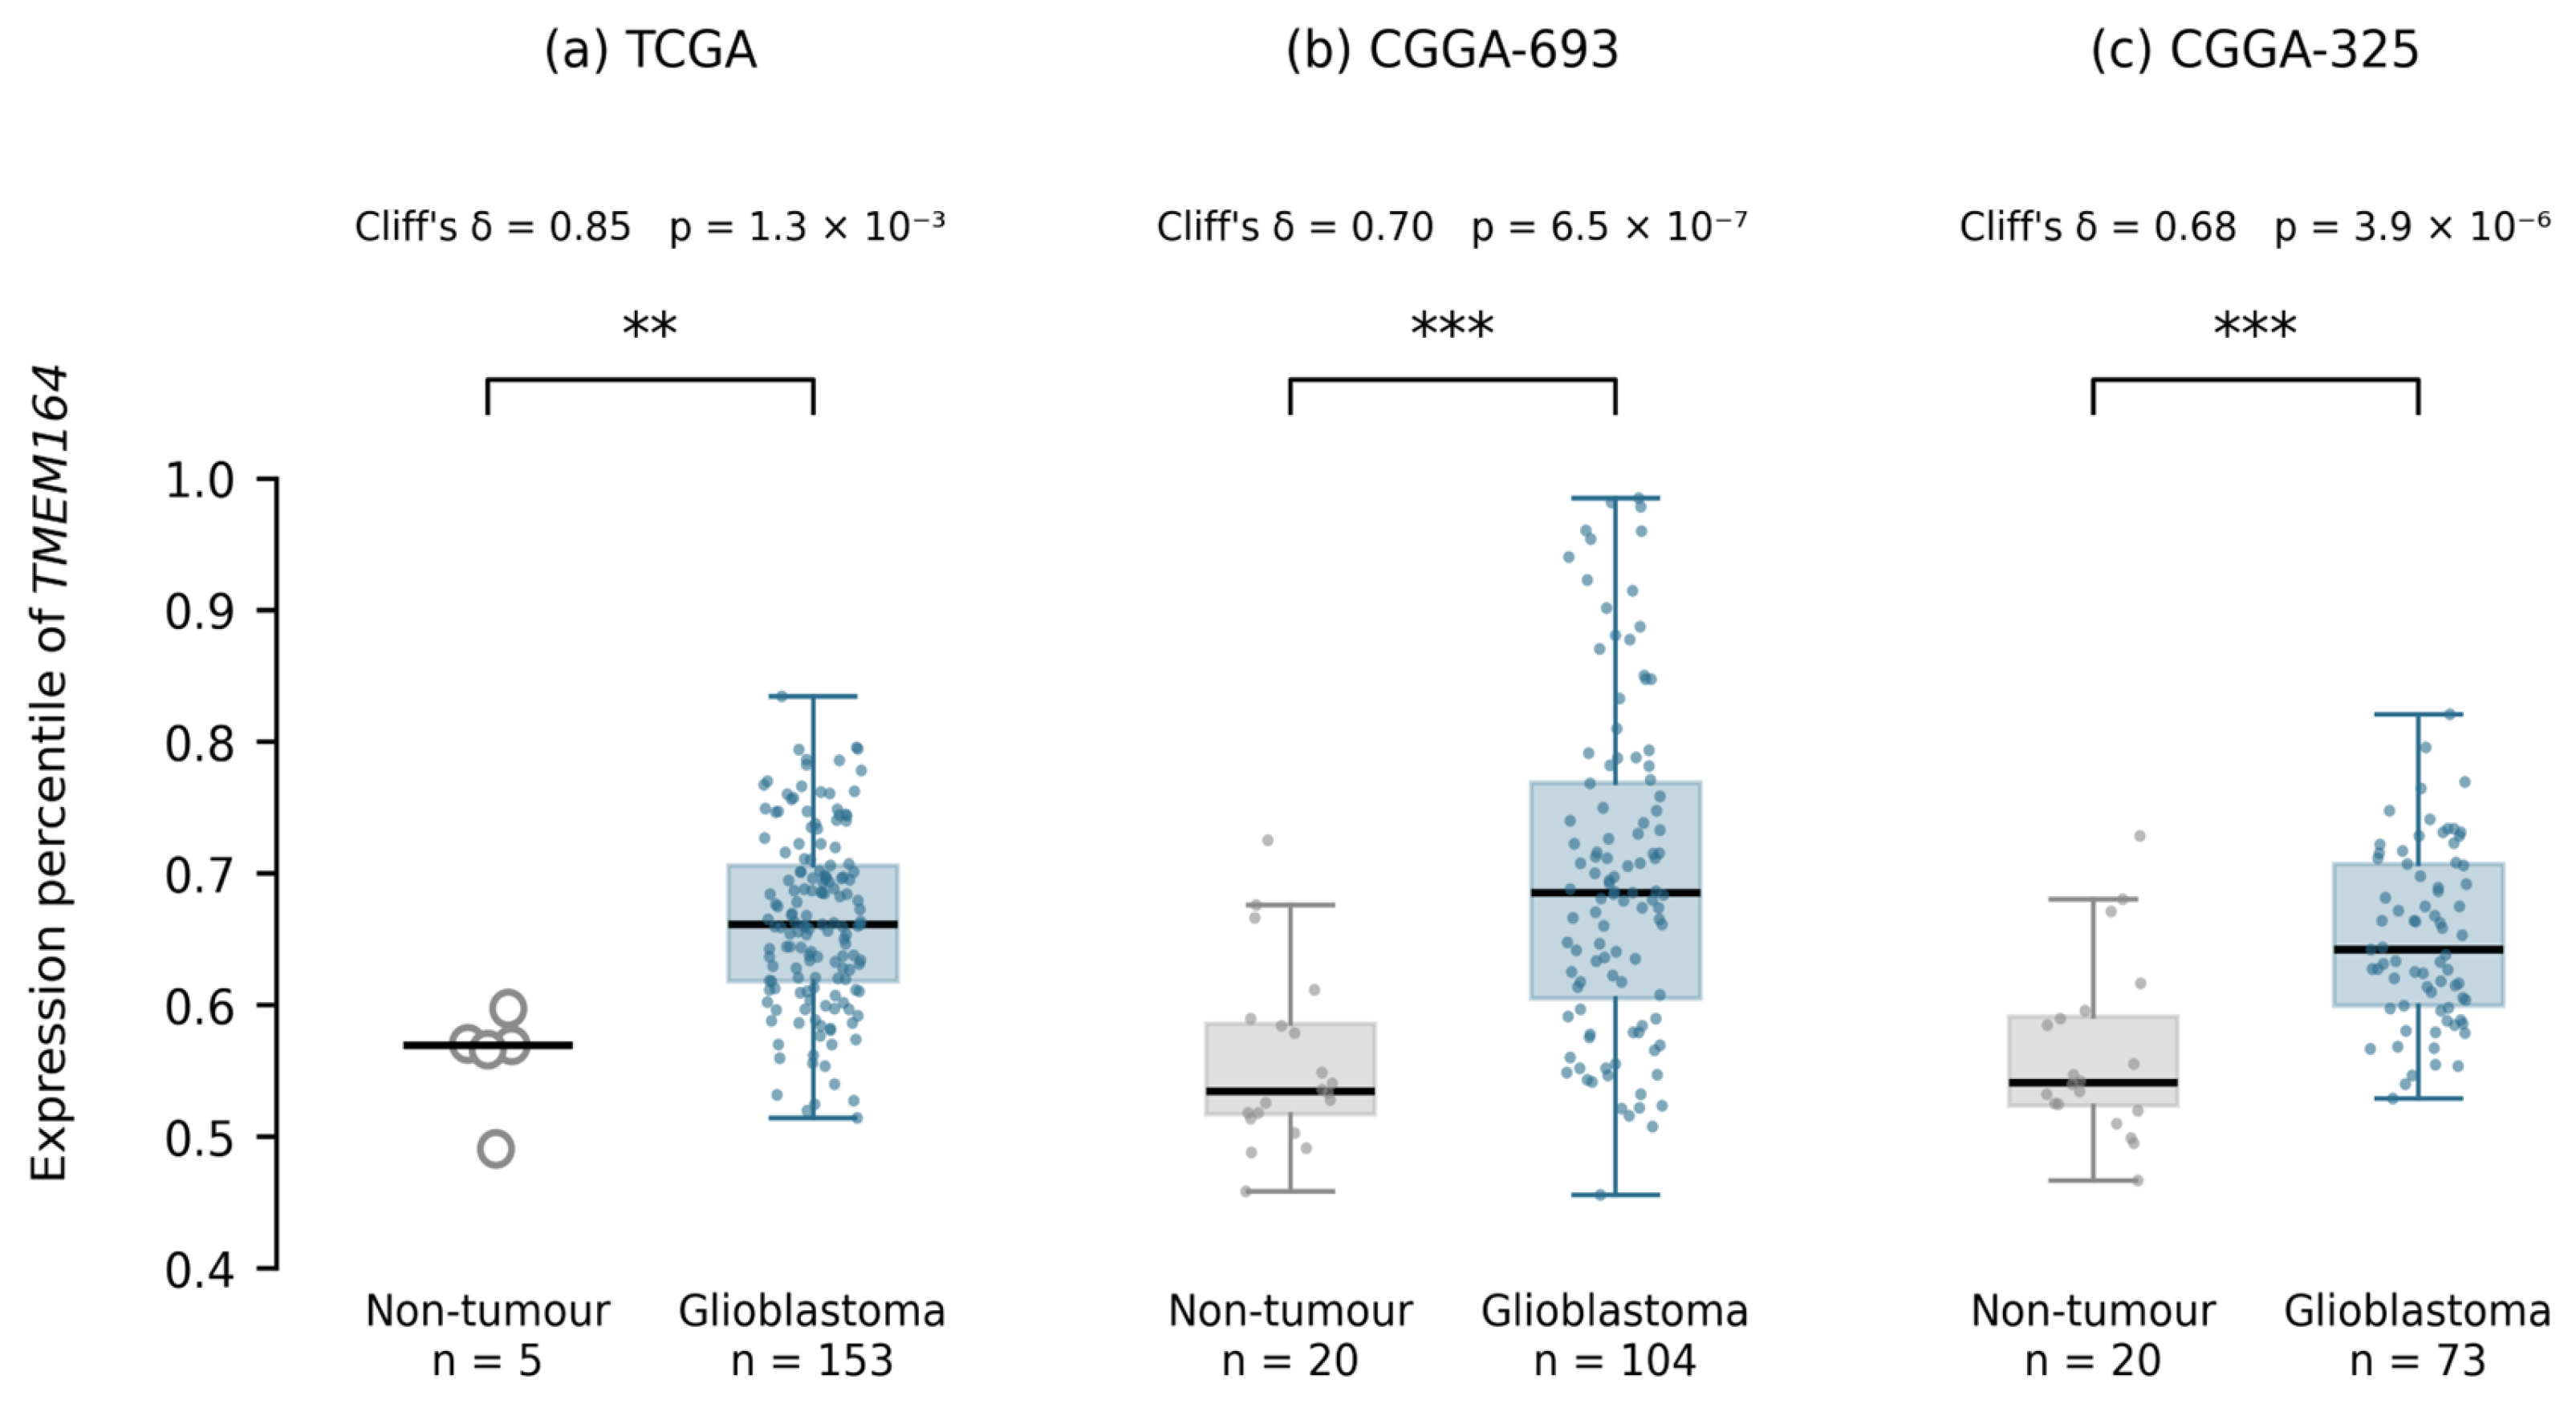
The within-sample percentile rank, which is invariant to global rescaling, resolves this. TMEM164 occupied a higher rank among all transcripts in tumour than in non-tumour brain in all three cohorts: TCGA, median percentile 0.661 versus 0.570 (Cliff’s δ +0.848, 95% CI 0.723–0.948; p = 1.3 × 10⁻³); CGGA-693, 0.685 versus 0.535 (δ +0.705, 95% CI 0.515–0.862; p = 6.5 × 10⁻⁷); CGGA-325, 0.642 versus 0.541 (δ +0.677, 95% CI 0.437–0.881; p = 3.9 × 10⁻⁶) (Figure 1). In CGGA-693, where the absolute-scale comparison had collapsed, the percentile comparison was the strongest of the three, confirming that the limiting factor was scaling rather than signal. The percentile of the control samples was closely concordant between resources sequenced on different continents with different pipelines (0.535–0.570), which supports the stability of the measure itself.
Two qualifications apply. Because the same 20 CGGA controls serve both CGGA cohorts, these are two independent tumour-versus-non-tumour comparisons, not three. And a higher within-sample rank in bulk tissue does not establish upregulation within any single cell type: tumour and normal cortex differ profoundly in cellular composition, and a shift in composition alone could produce this result. The five TCGA control values are plotted individually in Figure 1 rather than summarised, given their number.
Figure 1.
TMEM164 expression relative to non-tumour brain, expressed as within-sample percentile rank among all measured transcripts. (a) TCGA; (b) CGGA-693; (c) CGGA-325. Boxes show median and interquartile range with individual samples overlaid; the five TCGA non-tumour samples are plotted individually with their median indicated. Groups were compared with the two-sided Wilcoxon rank-sum test and effect sizes are given as Cliff’s δ. ** p < 0.01, *** p < 0.001. The same 20 CGGA control samples serve panels (b) and (c), which are therefore not independent replications.
Figure 1.
TMEM164 expression relative to non-tumour brain, expressed as within-sample percentile rank among all measured transcripts. (a) TCGA; (b) CGGA-693; (c) CGGA-325. Boxes show median and interquartile range with individual samples overlaid; the five TCGA non-tumour samples are plotted individually with their median indicated. Groups were compared with the two-sided Wilcoxon rank-sum test and effect sizes are given as Cliff’s δ. ** p < 0.01, *** p < 0.001. The same 20 CGGA control samples serve panels (b) and (c), which are therefore not independent replications.
3.2. TMEM164 Is Co-Expressed with RIPK1 Independently of Tumour Composition
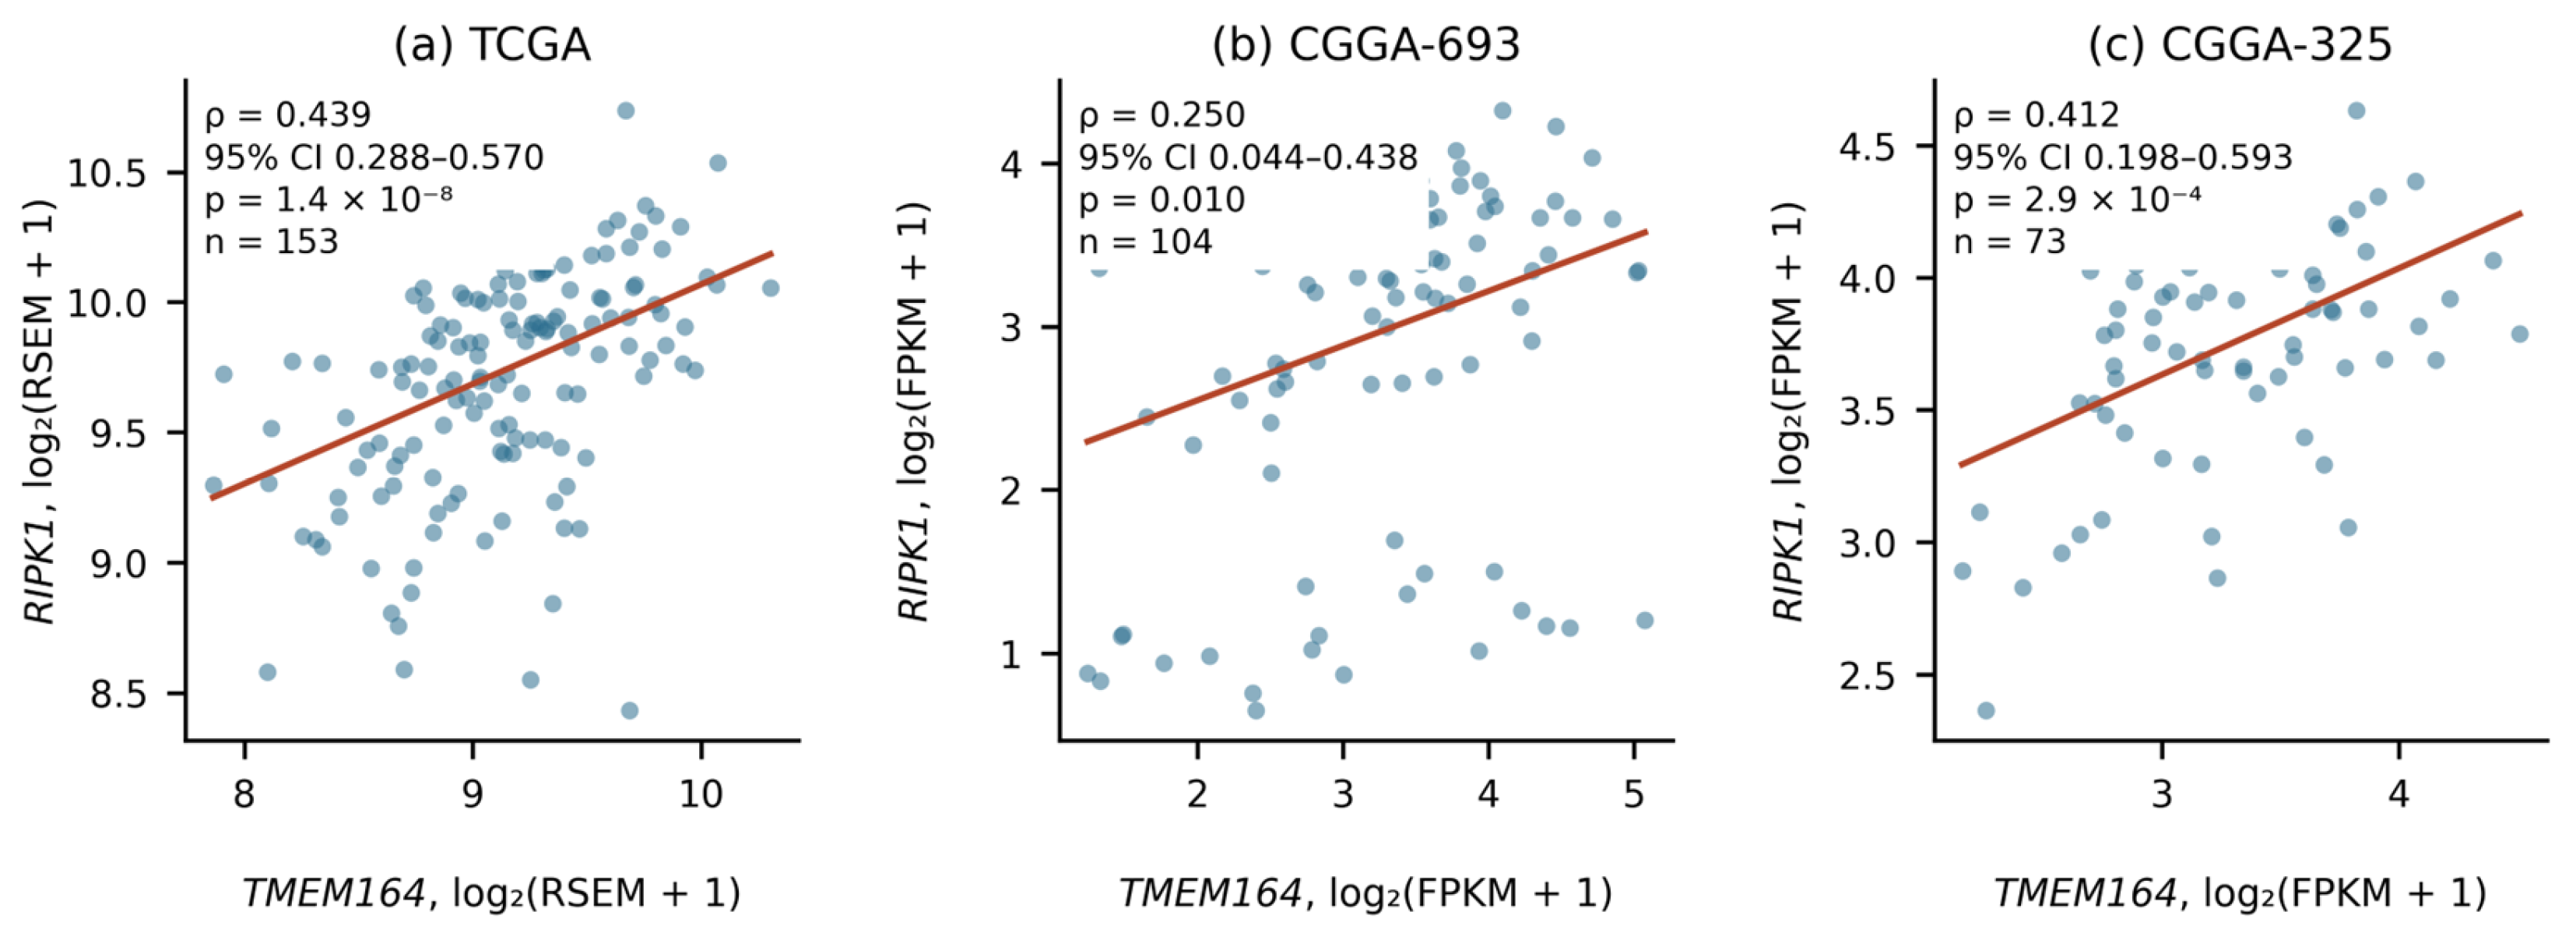
TMEM164 correlated positively with RIPK1 in all three cohorts, and this was the only association among the four necroptosis- and lipid-related genes tested that survived correction for multiple comparisons in every cohort (Table 1, Figure 2). RIPK3 and MLKL showed no consistent association. TMEM164-FASN correlation was nominally significant only in TCGA (ρ = 0.171, p = 0.035) and did not survive correction (q = 0.104), with no replication in either CGGA cohort. This analysis is descriptive: the mechanism proposed in the source study operates through direct protein interaction and enzymatic inhibition rather than transcription [8], and therefore predicts no particular transcript-level relationship in either direction.

Table 1.
Co-expression of TMEM164 with necroptosis effectors and FASN. Spearman ρ with percentile bootstrap 95% confidence interval (2000 resamples); q values from Benjamini-Hochberg correction across all 12 tests.
Table 1.
Co-expression of TMEM164 with necroptosis effectors and FASN. Spearman ρ with percentile bootstrap 95% confidence interval (2000 resamples); q values from Benjamini-Hochberg correction across all 12 tests.
| Cohort | Gene | n | ρ | 95% CI | p | q |
|---|---|---|---|---|---|---|
| TCGA | RIPK1 | 153 | 0.439 | 0.288 to 0.570 | 1.4 × 10⁻⁸ | 1.7 × 10⁻⁷ |
| TCGA | RIPK3 | 153 | −0.031 | −0.183 to 0.132 | 0.705 | 0.729 |
| TCGA | MLKL | 153 | 0.141 | −0.013 to 0.287 | 0.081 | 0.195 |
| TCGA | FASN | 153 | 0.171 | 0.001 to 0.324 | 0.035 | 0.104 |
| CGGA-693 | RIPK1 | 104 | 0.250 | 0.044 to 0.438 | 0.010 | 0.041 |
| CGGA-693 | RIPK3 | 104 | 0.090 | −0.124 to 0.286 | 0.361 | 0.592 |
| CGGA-693 | MLKL | 104 | 0.078 | −0.134 to 0.285 | 0.432 | 0.592 |
| CGGA-693 | FASN | 104 | 0.063 | −0.149 to 0.266 | 0.528 | 0.634 |
| CGGA-325 | RIPK1 | 73 | 0.412 | 0.198 to 0.593 | 2.9 × 10⁻⁴ | 1.8 × 10⁻³ |
| CGGA-325 | RIPK3 | 73 | −0.041 | −0.280 to 0.189 | 0.729 | 0.729 |
| CGGA-325 | MLKL | 73 | −0.091 | −0.320 to 0.157 | 0.444 | 0.592 |
| CGGA-325 | FASN | 73 | −0.123 | −0.339 to 0.097 | 0.300 | 0.592 |
Figure 2.
Co-expression of TMEM164 and RIPK1 in (a) TCGA, (b) CGGA-693 and (c) CGGA-325. Each panel reports the Spearman correlation with its percentile bootstrap 95% confidence interval (2000 resamples), the p value and the sample size. The regression line is shown for visualisation only; the reported statistic is the rank correlation.
Figure 2.
Co-expression of TMEM164 and RIPK1 in (a) TCGA, (b) CGGA-693 and (c) CGGA-325. Each panel reports the Spearman correlation with its percentile bootstrap 95% confidence interval (2000 resamples), the p value and the sample size. The regression line is shown for visualisation only; the reported statistic is the rank correlation.
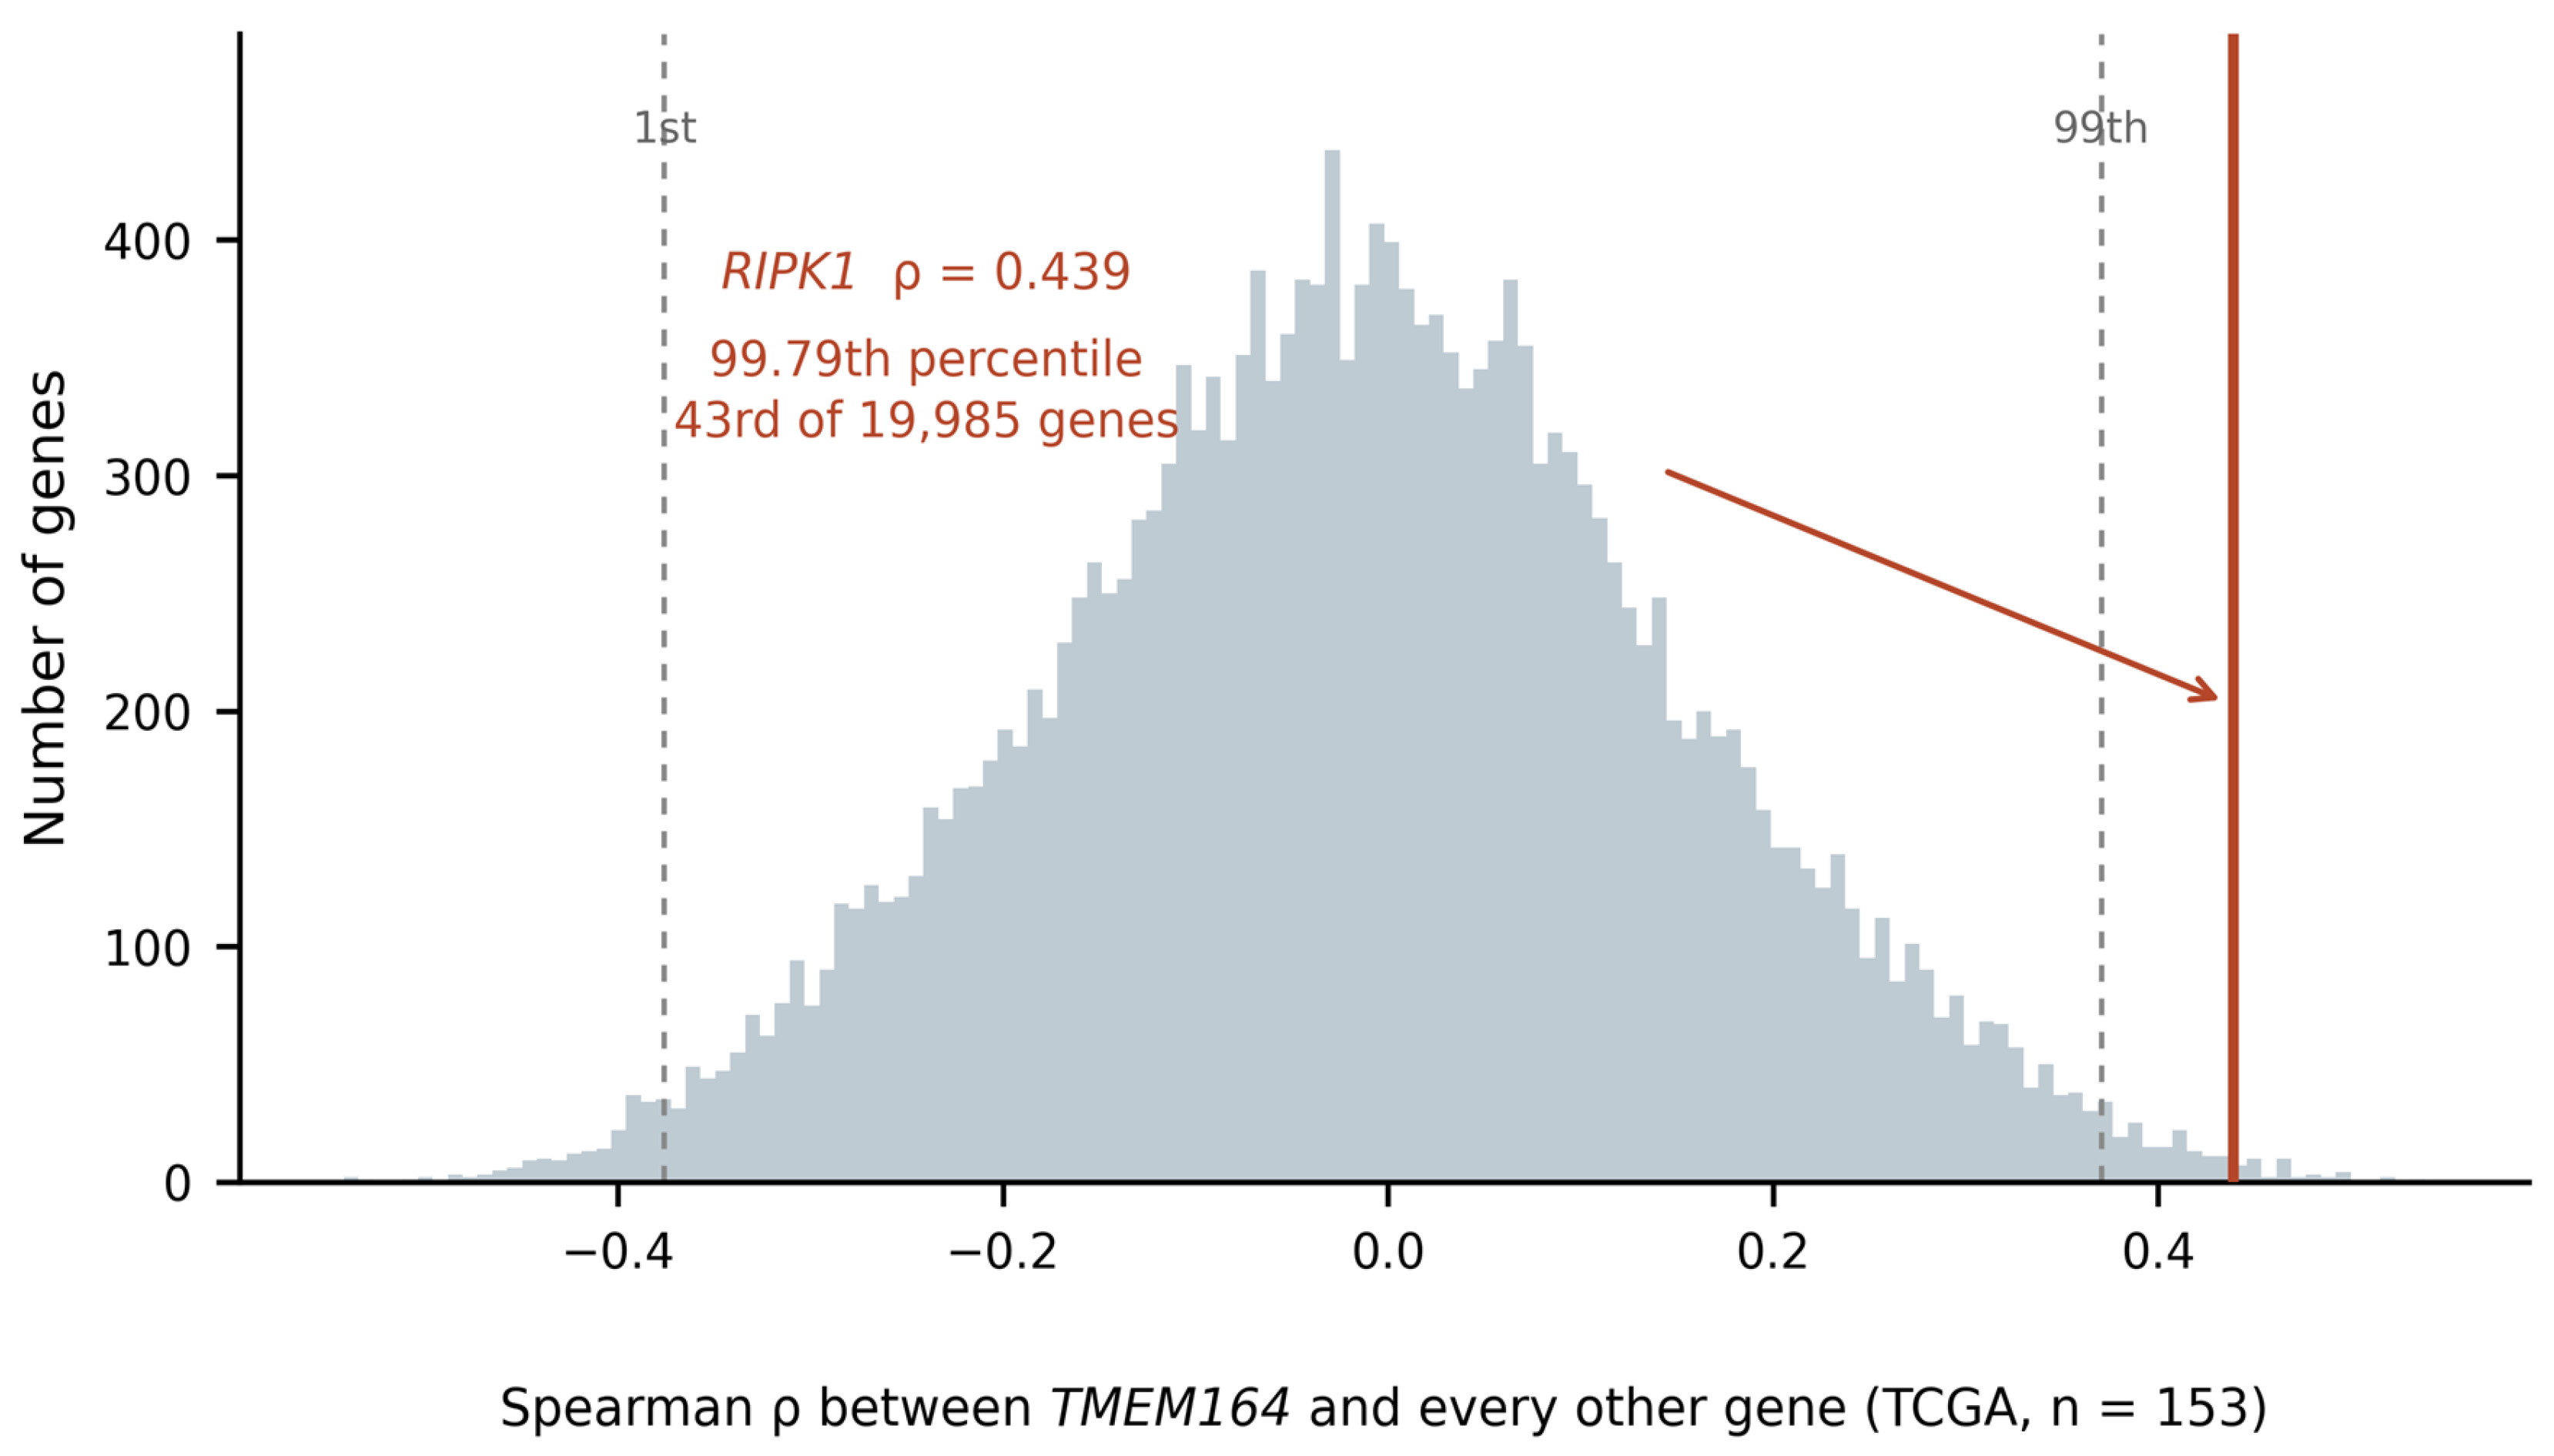
Two analyses tested whether the RIPK1 association reflects shared cellularity. Against a transcriptome-wide null of 19,985 genes in TCGA, ρ(TMEM164, RIPK1) = 0.439 fell at the 99.79th percentile: 42 genes correlated more strongly, placing RIPK1 43rd overall, against a null median of −0.011, a 1st-to-99th percentile range of −0.376 to 0.370, and a maximum of 0.539 (Figure 3). This was computed in TCGA, the cohort with the strongest observed correlation and therefore the condition least favourable to the null hypothesis. The three remaining genes tested fell within the body of the same null distribution, at the 86th (FASN), 82nd (MLKL) and 45th (RIPK3) percentiles (Supplementary Table S8), so the specificity of the RIPK1 association is not shared by other necroptosis effectors, as a purely compositional explanation would predict. Among the 42 genes ranked above RIPK1 were several innate-immune signalling transcripts (TICAM1, NFKB1, STAT3); this is reported descriptively, as no enrichment testing against an expression-matched background was performed; the transcriptome-wide correlation distribution is provided in the deposited analysis tables.
Partial Spearman correlation left the association essentially unchanged: 0.439 unadjusted, 0.437 adjusting for an immune/myeloid score, 0.440 for a stromal/endothelial score, and 0.437 for both. TMEM164 itself correlated only weakly with the immune/myeloid score (ρ = 0.063), against 0.154 for RIPK1, indicating that TMEM164 does not behave as a predominantly myeloid transcript in bulk glioblastoma. The co-expression is therefore not attributable to variation in immune, stromal or vascular content. It nonetheless remains a bulk-tissue observation and does not establish that the two transcripts are expressed in the same cells.
Figure 3.
Transcriptome-wide null distribution of the Spearman correlation between TMEM164 and each of 19,985 genes in TCGA. The red line marks the observed correlation with RIPK1 (ρ = 0.439), which falls at the 99.79th percentile, with 42 genes correlating more strongly. Dashed lines mark the 1st and 99th percentiles of the null distribution.
Figure 3.
Transcriptome-wide null distribution of the Spearman correlation between TMEM164 and each of 19,985 genes in TCGA. The red line marks the observed correlation with RIPK1 (ρ = 0.439), which falls at the 99.79th percentile, with 42 genes correlating more strongly. Dashed lines mark the 1st and 99th percentiles of the null distribution.
3.3. TMEM164 mRNA Is Not Associated with Overall Survival
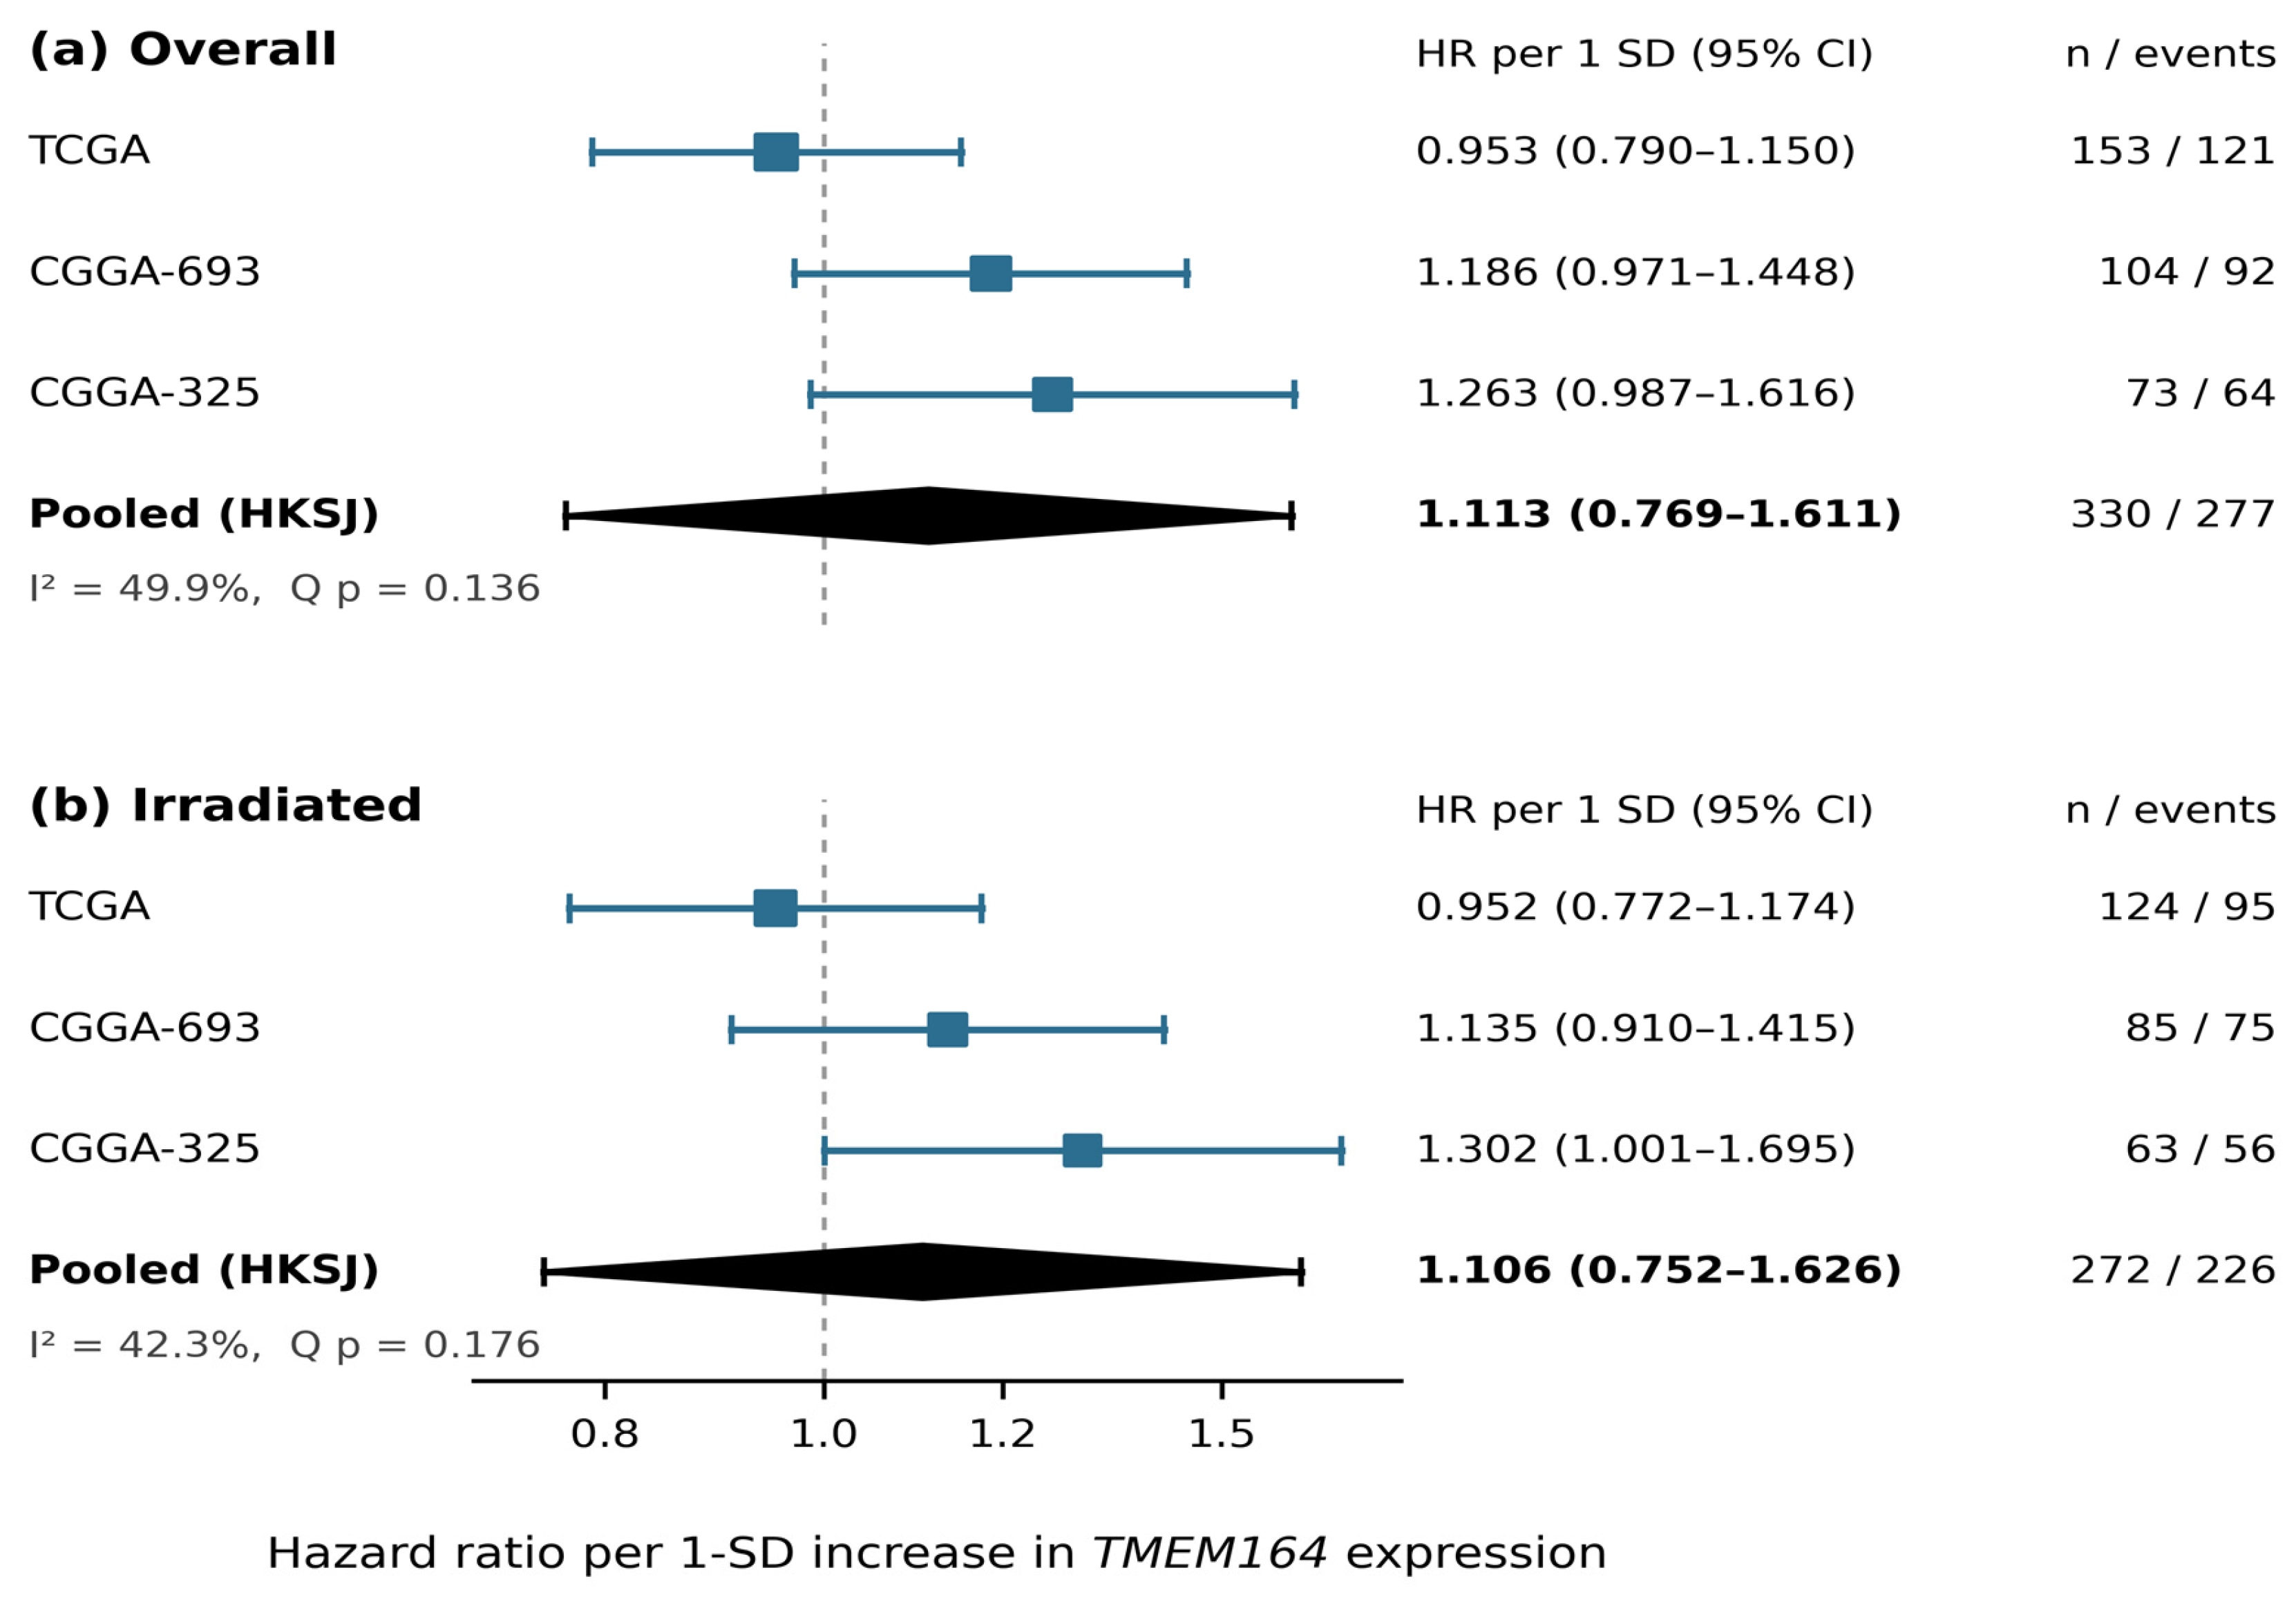
Continuous TMEM164 expression was not significantly associated with overall survival in any cohort, and the point estimates pointed in opposite directions between resources: HR 0.953 per standard deviation in TCGA, 1.186 in CGGA-693 and 1.263 in CGGA-325 (Table 2, Figure 4). Under the Hartung-Knapp-Sidik-Jonkman adjustment used for primary inference, the pooled estimate was HR 1.113 (95% CI 0.769–1.611; p = 0.340), with τ² = 0.0114, I² = 49.9% and Cochran’s Q p = 0.136. Unadjusted REML gave the same point estimate with a narrower interval (1.113, 95% CI 0.938–1.320; p = 0.221) and a fixed-effect model gave 1.101 (95% CI 0.977–1.241; p = 0.115).
Two features of this synthesis deserve emphasis rather than reassurance. First, with only three cohorts, I² is estimated imprecisely and Cochran’s Q has very little power, so a non-significant Q does not establish homogeneity; an I² of approximately 50% is not low heterogeneity. Second, leave-one-out analysis showed that removing any single cohort destabilised the pooled interval severely: 1.216 (0.822–1.798) without TCGA, 1.084 (0.183–6.429) without CGGA-693, and 1.060 (0.265–4.238) without CGGA-325. The pooled estimate is therefore not a precise summary of a common effect, and the substantive finding is the failure of the cohort-level estimates to replicate one another in direction.
Table 2.
Association of TMEM164 expression with overall survival by continuous Cox regression and random-effects meta-analysis.
Table 2.
Association of TMEM164 expression with overall survival by continuous Cox regression and random-effects meta-analysis.
| Cohort | n | Events | HR per 1 SD | 95% CI | p | C-index |
|---|---|---|---|---|---|---|
| TCGA | 153 | 121 | 0.953 | 0.790 to 1.150 | 0.616 | 0.529 |
| CGGA-693 | 104 | 92 | 1.186 | 0.971 to 1.448 | 0.096 | 0.544 |
| CGGA-325 | 73 | 64 | 1.263 | 0.987 to 1.616 | 0.064 | 0.536 |
| Pooled, HKSJ (primary) | 330 | 277 | 1.113 | 0.769 to 1.611 | 0.340 | - |
| Pooled, REML | 330 | 277 | 1.113 | 0.938 to 1.320 | 0.221 | - |
| Pooled, fixed effect | 330 | 277 | 1.101 | 0.977 to 1.241 | 0.115 | - |
τ² = 0.0114; I² = 49.9%; Cochran’s Q p = 0.136. C-index is the bootstrap optimism-corrected value. HKSJ, Hartung-Knapp-Sidik-Jonkman; REML, restricted maximum likelihood; SD, standard deviation.
Figure 4.
Association between continuous TMEM164 expression and overall survival. (a) All patients; (b) patients with documented radiotherapy exposure. Squares indicate cohort-specific hazard ratios per 1-standard-deviation increase, scaled by cohort size, with horizontal lines showing 95% confidence intervals; diamonds indicate the random-effects pooled estimate under the Hartung-Knapp-Sidik-Jonkman adjustment. The x-axis is logarithmic.
Figure 4.
Association between continuous TMEM164 expression and overall survival. (a) All patients; (b) patients with documented radiotherapy exposure. Squares indicate cohort-specific hazard ratios per 1-standard-deviation increase, scaled by cohort size, with horizontal lines showing 95% confidence intervals; diamonds indicate the random-effects pooled estimate under the Hartung-Knapp-Sidik-Jonkman adjustment. The x-axis is logarithmic.
Model diagnostics supported the specification. The proportional-hazards assumption held in every cohort (global scaled Schoenfeld residual test p = 0.11, 0.43 and 0.24 for TCGA, CGGA-693 and CGGA-325). Refitting with a restricted cubic spline showed no departure from linearity (p = 0.33, 0.497, 0.608), so a threshold effect of the kind a dichotomised analysis would claim to capture is not present. Discrimination was close to chance: apparent C-index 0.547, 0.552 and 0.543, and after bootstrap correction for optimism 0.529, 0.544 and 0.536. In every cohort the 95% interval of the optimism estimate crossed zero, meaning the optimism was itself indistinguishable from zero, as expected for a predictor that does not discriminate.
In the TCGA primary multivariable model, adjusted for age and molecular IDH status and fitted on the full cohort of 153 patients with 121 events, TMEM164 remained non-significant (HR 0.982, 95% CI 0.813–1.186; p = 0.849), while age was prognostic (HR 1.021 per year, 95% CI 1.005–1.039; p = 0.013). The secondary model substituting Karnofsky Performance Status was restricted to the 115 patients with complete KPS (89 events) and gave HR 0.963 (95% CI 0.768–1.206; p = 0.740).
These null results define a bounded exclusion rather than an absence of effect, and the boundary is set by the observed interval rather than by a power calculation. Under the Hartung-Knapp-Sidik-Jonkman model used for primary inference the pooled interval extends to 1.61 per standard deviation, so hazard ratios above approximately 1.6 are not compatible with these data while smaller effects remain so; the unadjusted REML and fixed-effect models give the tighter upper bounds of 1.32 and 1.24. As a separate, design-stage quantity, the minimum hazard ratio per standard deviation that each cohort had 80% power to detect at a two-sided α of 0.05 was 1.29 in TCGA, 1.34 in CGGA-693 and 1.42 in CGGA-325, and 1.18 for the combined 277 events (Supplementary Table S4). These values describe the sensitivity of the design and are not themselves exclusion boundaries for the estimate obtained.
3.4. A Significant Prognostic Association Can Be Manufactured by Cutpoint Selection
Applying maximally selected rank statistics to the same expression values produced a nominally significant dichotomised association in two of three cohorts, and neither survived correction for the selection of the cutpoint (Table 3). In CGGA-693, the optimal threshold split the cohort into 54 high- and 50 low-expressing tumours and yielded HR 1.828 with a log-rank p of 0.0041, which rose to 0.094 after correction. In CGGA-325, a threshold placing 24 patients in the high group gave HR 1.792 with p 0.0295 uncorrected and 0.498 corrected. In TCGA the optimal split ran in the opposite direction, with high expression apparently protective (HR 0.706), p 0.0825 uncorrected and 0.700 corrected.
This is a direct demonstration of how a positive dichotomised result arises in these data. The same values that show no association under continuous modelling produce a hazard ratio of 1.8 and a log-rank p below 0.005 once the threshold is chosen to maximise group separation, and the effect disappears once that selection is accounted for. That the procedure favours opposite directions in different cohorts, and that the optimal thresholds fall at different positions of the expression distribution (the 25th percentile in TCGA against roughly the median in CGGA-693 and the 67th in CGGA-325), further indicates that cutpoint-derived estimates here are not tracking a stable underlying quantity.
Table 3.
Optimal cutpoint analysis by maximally selected rank statistics.
| Cohort | Cutpoint | Group sizes (high / low) | HR (high vs low) | p, log-rank at cutpoint | p, corrected for selection |
|---|---|---|---|---|---|
| TCGA | 8.7945 | 114 / 39 | 0.706 | 0.0825 | 0.700 |
| CGGA-693 | 3.2824 | 54 / 50 | 1.828 | 0.0041 | 0.094 |
| CGGA-325 | 3.5534 | 24 / 49 | 1.792 | 0.0295 | 0.498 |
Cutpoints are on the native scale of each cohort, log₂(RSEM + 1) for TCGA and log₂(FPKM + 1) for CGGA. Correction for cutpoint selection follows Lausen and Schumacher [25].
3.5. TMEM164 Is Not Associated with Survival Among Irradiated Patients
Because the mechanism under investigation concerns radioresistance, the survival analysis was repeated in patients with documented radiotherapy exposure. Radiotherapy status was available for 145 of 153 TCGA patients (95%) and for 96% of both CGGA cohorts, yielding an irradiated subgroup of 272 patients with 226 deaths.
No association replicated across cohorts. The cohort-level estimates were HR 0.952 (95% CI 0.772–1.174; p = 0.645) in TCGA, 1.135 (0.910–1.415; p = 0.261) in CGGA-693 and 1.302 (1.001–1.695; p = 0.0496) in CGGA-325, pooling to HR 1.106 under the Hartung-Knapp-Sidik-Jonkman model used for primary inference (95% CI 0.752–1.626; p = 0.379) and to 1.106 under unadjusted REML (0.928–1.317; p = 0.260), with I² = 42.3% and Q p = 0.176 (Figure 4b). The CGGA-325 estimate is nominally significant at p = 0.0496; it is one of three cohort-level tests, is reproduced in neither of the other two, and is not treated here as evidence of an effect. Restricted to the two Chinese cohorts, which are the two whose point estimates already lie above unity, the same synthesis gives HR 1.201 (95% CI 1.014–1.423; p = 0.034) under a fixed-effect model, τ² being estimated as zero, and HR 1.201 (0.509–2.835; p = 0.225) under the Hartung-Knapp adjustment; this is a two-cohort synthesis selected after inspection of the cohort estimates, and the corresponding estimate with TCGA removed from the full cohorts is HR 1.216 (95% CI 0.822–1.798; Supplementary Table S5). The divergence in direction between the North American and the Chinese resources seen in the full cohorts persists in the irradiated subgroup.
A TMEM164 × radiotherapy interaction was tested in each cohort and did not replicate: p = 0.172 in TCGA, p = 0.0052 in CGGA-693 and p = 0.078 in CGGA-325. The CGGA-693 interaction was driven by 15 non-irradiated patients (HR 2.077 in that stratum), whereas the 21 non-irradiated TCGA patients showed no such pattern (HR 0.850, 95% CI 0.513–1.407; p = 0.528, 20 events). Patients who do not receive radiotherapy in a glioblastoma cohort differ systematically in performance status, extent of resection, age and comorbidity, so an interaction estimated within a non-irradiated stratum of this size is not interpretable as a treatment-modifying effect. Landmark analyses resetting the time origin at 60 and at 90 days in the CGGA cohorts did not materially alter the cohort-level estimates (Supplementary Table S6); this test has limited sensitivity here, because selection for fitness to receive radiotherapy operates before the landmark rather than within the landmark period.
Progression-free survival was not analysed. A progression-free interval is distributed for TCGA, but no comparably defined progression endpoint is annotated in either CGGA resource, and a single-cohort progression analysis would reintroduce precisely the single-database inference that this study sets out to test. The available progression endpoint is therefore reported as unanalysable rather than presented for one resource alone.
3.6. Sensitivity and Subgroup Analyses
None of the analyses in this section was planned in advance, none was corrected for multiplicity, and all are reported in full, including the results that do not support the study’s conclusion.
Molecularly confirmed IDH-wildtype TCGA cases. Restricting the analysis to the 143 patients with confirmed IDH-wildtype status (116 events) gave HR 0.970 per standard deviation (95% CI 0.803–1.172; p = 0.754) with adjustment for age, essentially identical to the full-cohort estimate. TMEM164 expression did not differ between IDH-mutant and IDH-wildtype tumours (median 9.282 versus 9.126; p = 0.385). That the original histological selection had already excluded most IDH-mutant cases is evident from the fact that 25 IDH1-mutant tumours are present in the parent TCGA study against 8 in this cohort.
MGMT promoter methylation. Four subgroup models were fitted. In CGGA-693, HR 1.031 (95% CI 0.772–1.378; p = 0.835) in methylated (n = 52, 46 events) and 1.089 (0.766–1.548; p = 0.635) in unmethylated tumours (n = 39, 36 events). In CGGA-325, HR 1.036 (0.761–1.411; p = 0.823) in unmethylated tumours (n = 48, 42 events), but HR 1.851 (95% CI 1.145–2.992; p = 0.012) in the 23 methylated tumours (20 events). This last result should not be accepted at face value. It rests on 23 patients, it was not planned in advance, it is one of four subgroup tests without multiplicity correction, and it is contradicted by the corresponding CGGA-693 subgroup, where the same stratum yields 1.031. It is precisely the class of finding that this study argues should not be treated as evidence, and reporting it under those qualifications is consistent with that argument rather than in tension with it.
Extended CGGA-693 cohort and tumour grade. CGGA-693 contains further primary, IDH-wildtype adult cases outside WHO grade IV, and analysing them addresses whether the null result in the grade IV cohort reflects limited power. Assembled irrespective of grade, this cohort comprises 164 patients with 130 events (26 WHO II, 34 WHO III, 104 WHO IV) and shows HR 1.228 (95% CI 1.043–1.446; p = 0.014), 1.194 (1.008–1.413; p = 0.040) after adjustment for grade, and 1.197 (1.013–1.415; p = 0.035) after adjustment for grade and age (Supplementary Table S7).
This association is not confounding by grade. The hazard ratio was almost identical within every stratum, at 1.186 (WHO II), 1.181 (WHO III) and 1.186 (WHO IV), the interaction between TMEM164 and grade was null (likelihood-ratio p = 0.589), and grade itself remained strongly prognostic (WHO IV versus II, HR 3.459, 95% CI 1.878–6.372; p = 6.8 × 10⁻⁵). TMEM164 was not monotonically related to grade: Spearman ρ 0.097 (p = 0.218), Kruskal-Wallis p = 0.037, with medians of 2.769, 3.400 and 3.304 across grades II, III and IV, so expression is lower only in WHO II and does not distinguish grade III from grade IV.
The correct interpretation is therefore not that TMEM164 is prognostic in lower-grade tumours, but that CGGA-693 estimates the same weak positive effect of approximately 1.19 to 1.23 in every configuration, with 130 events instead of 92. This is a demonstration of the power argument within a single cohort. It does not reconcile with TCGA, which estimates 0.953 with 121 events. The discrepancy is between resources, not between grades, and it is what the pooled I² of 49.9% measures. The exclusion of this cohort from the primary analysis is nonetheless justified on definitional rather than statistical grounds, because it cannot be classified under the 2021 WHO criteria with the annotation available in CGGA.
Cohort independence. CGGA-693 and CGGA-325 share no patients. GLASS contains 27 TCGA-format identifiers, of which 9 of the 104 pairs (8.7%) include at least one TCGA sample and 6 patients also appear in the cross-sectional TCGA cohort; GLASS contains no CGGA cases. The three survival cohorts entering the meta-analysis are therefore mutually disjoint, whereas the longitudinal cohort partially overlaps TCGA.
3.7. TMEM164 Expression Decreases Slightly at First Recurrence
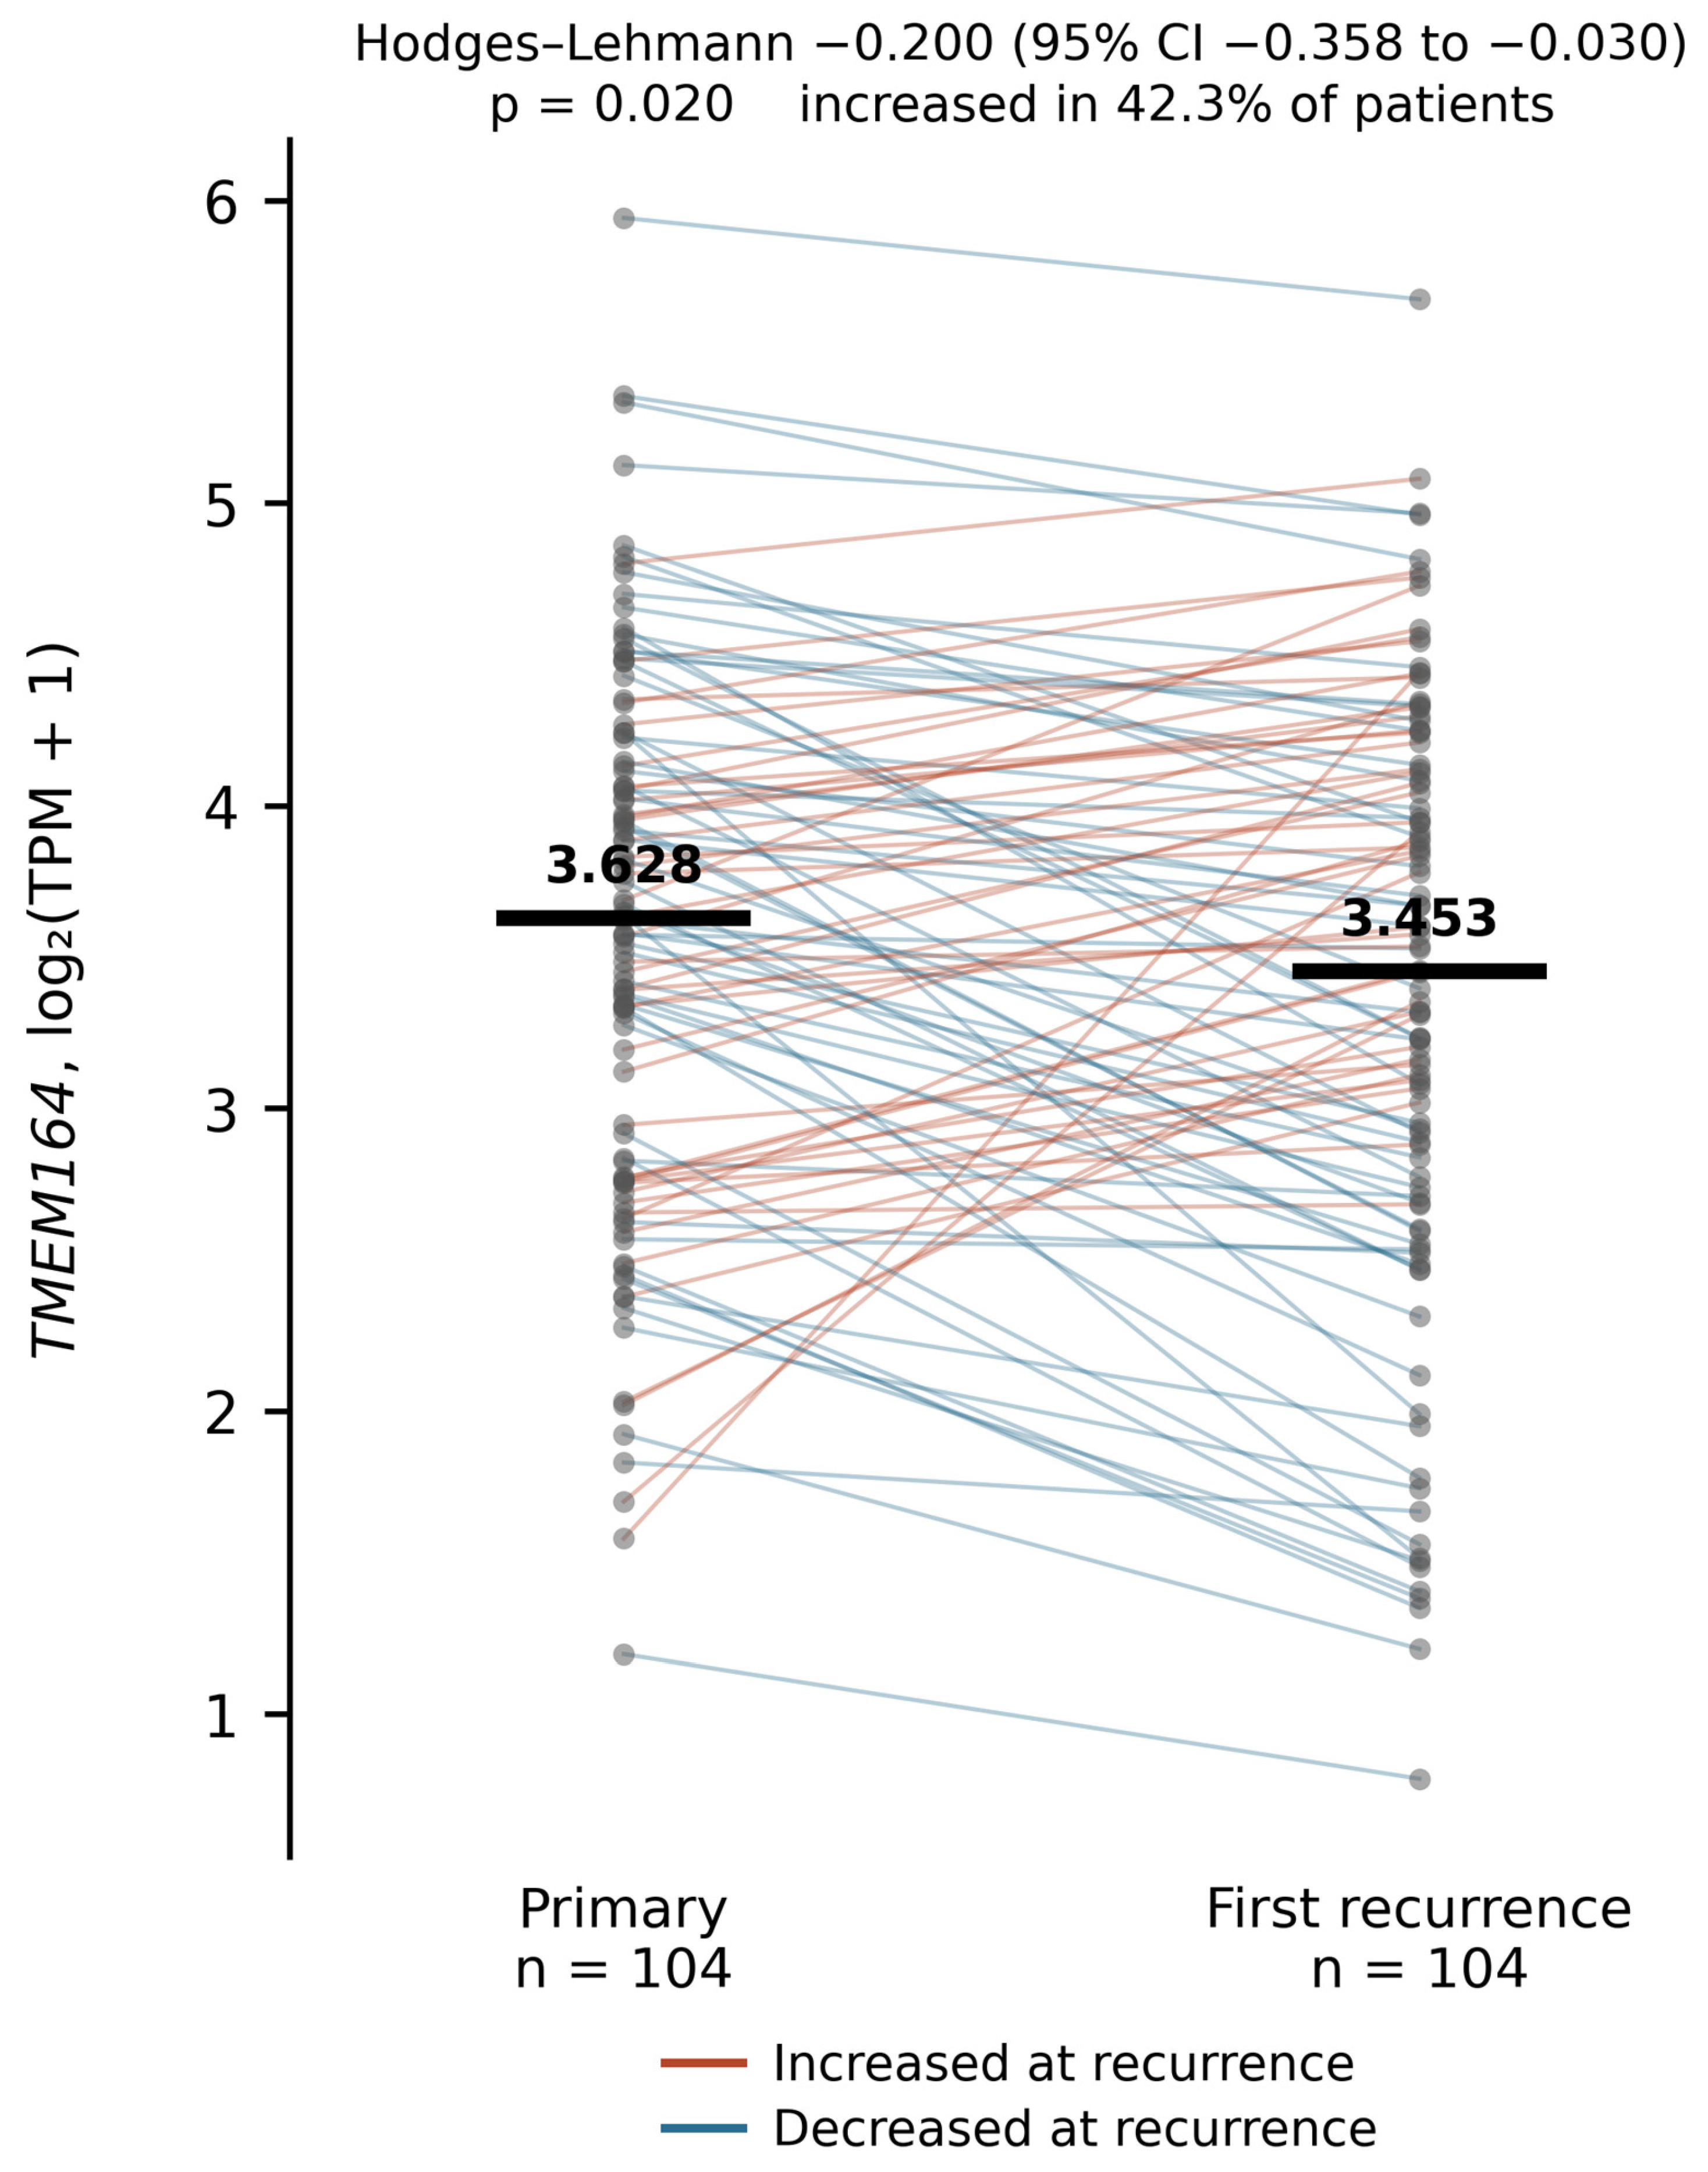
Among the 104 matched GLASS pairs, median TMEM164 expression fell from 3.628 to 3.453 log₂(TPM + 1). The Hodges-Lehmann estimate of the paired difference was −0.200 log₂ units (95% CI −0.358 to −0.030; p = 0.020), and expression increased in 42.3% of patients (Figure 5). On the ratio scale this is a median decrease of 13% (95% CI 2% to 22%), so the interval is compatible with a change of negligible biological consequence at its upper bound and with no more than a modest one at its lower bound, and the direction is opposite to the induction reported during fractionated irradiation in vitro [8].
The decrease is not explained by a shift in specimen composition. Tumour purity did not differ between paired timepoints (0.794 versus 0.792; p = 0.489) and change in purity was not correlated with change in TMEM164 (ρ = 0.160; p = 0.104). Modelling the within-patient difference gave an intercept of −0.188 (95% CI −0.350 to −0.026; p = 0.023) unadjusted, −0.175 (−0.336 to −0.014; p = 0.033) adjusting for change in purity, and −0.196 (−0.362 to −0.030; p = 0.021) adjusting for change in purity together with the ESTIMATE score.
3.8. TMEM164 Protein Is Not Quantified in Public Glioblastoma Proteomes
Extension of these findings to the protein level was attempted using the CPTAC glioblastoma discovery cohort of 99 treatment-naive tumours [27]. TMEM164 protein was quantified in 0 of 99 samples, whereas GAPDH, RIPK1, EGFR and SLC7A11 were each quantified in 99 of 99, and TMEM164 mRNA was quantified in 99 of 99 within the same study. The result was identical in the z-scored matrix, excluding an error of gene identifier, sample list or query construction.
This non-detection is systematic rather than specific to glioblastoma. Across the seven CPTAC proteomic studies available through cBioPortal, TMEM164 was detected in one (lung squamous carcinoma, 54 of 80 samples) while RIPK1 was detected in six; in the lung adenocarcinoma proteome neither gene was detected (Supplementary Table S9). The pattern is consistent with the known under-representation of polytopic membrane proteins in tandem-mass-tag workflows and depends on the platform rather than on the tumour type.
Figure 5.
TMEM164 expression in 104 matched primary and first-recurrence specimens from GLASS. Grey lines connect paired samples and are coloured by direction of change; black bars indicate group medians. The paired difference was tested with the two-sided Wilcoxon signed-rank test and quantified by the Hodges-Lehmann estimator.
Figure 5.
TMEM164 expression in 104 matched primary and first-recurrence specimens from GLASS. Grey lines connect paired samples and are coloured by direction of change; black bars indicate group medians. The paired difference was tested with the two-sided Wilcoxon signed-rank test and quantified by the Hodges-Lehmann estimator.
An analysis of TMEM164 protein against overall survival, or against RIPK1 phosphosites, is therefore not feasible with the currently accessible public proteomic resources. Absence from a quantification matrix constitutes non-detection on that platform and is not evidence that the protein is absent from tissue. Whether more recent proteomic or phosphoproteomic glioblastoma resources distributed outside cBioPortal would detect TMEM164 could not be determined within the scope of this analysis.
4. Discussion
This multicohort reanalysis describes a consistent transcriptomic phenotype for TMEM164 in adult glioblastoma and, at the same time, sets a boundary on what bulk transcript abundance can tell us about it. TMEM164 mRNA occupied a higher within-sample rank in tumour than in non-tumour brain in all three cohorts, and was co-expressed with RIPK1 in a manner that is highly specific against a transcriptome-wide background and unaffected by adjustment for immune, myeloid, stromal and endothelial content. Neither observation translated into reproducible prognostic information: no association with overall survival replicated across cohorts, in the pooled analysis, among irradiated patients, or among molecularly confirmed IDH-wildtype cases, and it decreased marginally rather than increased at first recurrence.
The tumour-versus-normal comparison required a change of method that is itself informative. On the absolute expression scale, constitutively expressed transcripts shifted between tumour and control as much as or more than TMEM164 in the CGGA cohorts, so library-size normalisation alone was insufficient and no biological interpretation could be sustained. The within-sample percentile rank, which is invariant to global rescaling, recovered the difference consistently across resources sequenced on different continents with different pipelines. This qualifies but does not eliminate the interpretive limit: tumour tissue and normal cortex differ profoundly in cellular composition, and a higher rank in bulk tissue is compatible with a change in the mixture of cell types rather than upregulation within any one of them.
The reproducible co-expression with RIPK1 is the study’s principal positive finding, and it is more specific than a bulk correlation would ordinarily be. Against 19,985 genes, RIPK1 ranked 43rd in its correlation with TMEM164, partial correlation showed the association to be unmoved by composition, and the other three necroptosis- and lipid-related genes tested fell within the body of the same null distribution. It should nonetheless not be read as evidence of necroptotic activation. In the experimental model, the relevant endpoints are the phosphorylation of RIPK1, RIPK3 and MLKL, not their transcript abundance [8]; RIPK1 additionally has kinase-independent scaffolding functions supporting pro-survival NF-κB signalling [10,11]; and bulk co-expression cannot establish that two transcripts are present in the same cells.
The mechanism proposed in the source study is post-translational at both steps. TMEM164 was reported to interact with FASN and to inhibit its enzymatic activity, producing NADPH accumulation, neutralisation of radiation-induced reactive oxygen species, and suppression of necroptosis [8]. Such a model makes no prediction about the correlation between the two transcripts in either direction. Our TMEM164-FASN analysis is therefore descriptive and does not test that mechanism; the absence of a reproducible correlation is consistent with the mechanism rather than evidence against it. This distinction matters more broadly, because structural work indicates that TMEM164 acyltransferase output depends on dimerisation and conformation and can vary non-linearly with protein abundance [7]. Redox balance and the choice between cell-death programmes are established as modifiable determinants of treatment response in glioblastoma, including through adjunct modalities that sensitise tumours to temozolomide by ROS-dependent mechanisms in vitro and in vivo [29], which is the level at which a TMEM164-directed intervention would have to be evaluated. The group that reported the TMEM164 mechanism has separately attributed radioresistance, in a glioblastoma model derived by repeated irradiation, to IFI16-driven and HMOX1-dependent suppression of ferroptosis [30], so the cell-death programme engaged after fractionated irradiation in these systems is itself context-dependent and is defined by protein activity rather than by steady-state transcription.
The absence of a prognostic association should be stated as a bounded exclusion rather than as an absence of effect, and the bound should be read from the observed interval rather than from a power calculation. Under the estimator used for primary inference the pooled interval extends to 1.61 per standard deviation, so effects above approximately 1.6 are not compatible with these data while smaller ones are; the cohorts were separately powered to detect 1.29, 1.34 and 1.42, which describes what the design could have seen rather than what it observed. Beyond power, the more instructive result is the failure of the cohort estimates to replicate: TCGA gives 0.953 with 121 events while both Chinese cohorts give estimates above unity, I² is approximately 50%, and leave-one-out analysis destabilises the pooled interval so severely that the synthesis cannot be read as a precise summary of a common effect. That this divergence persists in the irradiated subgroup, and that the TMEM164 × radiotherapy interaction did not replicate across cohorts, narrows the space in which a radiation-specific prognostic effect of baseline transcript abundance could still exist. Within CGGA-693 the same weak positive estimate of approximately 1.19 to 1.23 is obtained in every configuration, including a mixed-grade cohort with 130 events in which the effect is uniform across grades and does not interact with grade; the discrepancy is therefore between resources rather than between selection criteria.
The cutpoint analysis supplies the mechanism of the discrepancy with the source report. A hazard ratio of 1.8 with a log-rank p below 0.005 can be produced in these same data by choosing the threshold that maximises separation, and it does not survive correction for that choice, in either cohort where it occurs. This does not adjudicate the experimental findings of the source study, which concern protein activity in cell lines; it addresses only the supporting clinical analysis, and indicates that a dichotomised single-database Kaplan-Meier comparison with an unspecified threshold is not adequate evidence of prognostic relevance [9].
The small decrease at recurrence is unlikely to carry biological meaning. The upper confidence bound of the Hodges-Lehmann estimate corresponds to a decrease of approximately 2%, expression rose in 42.3% of patients, and the change was not attributable to a shift in tumour purity. GLASS specimens are separated by heterogeneous intervals and intervening therapies, whereas the reported induction of TMEM164 occurs during fractionated irradiation. Recurrence-stage sampling therefore cannot exclude transient treatment-concurrent induction, and paired pre-treatment and on-treatment tissue would be required to test it.
Finally, the protein level, which is where the proposed mechanism resides, is currently inaccessible in public data. TMEM164 protein was quantified in none of the 99 CPTAC glioblastomas in which its mRNA was quantified in all 99, and it was detected in only one of seven CPTAC proteomes, a pattern consistent with the known under-representation of polytopic membrane proteins in tandem-mass-tag workflows. The implication is methodological rather than negative: testing this biology in patients will require targeted assays, immunohistochemistry with a validated antibody, targeted mass spectrometry, or phospho-specific measurement of necroptosis effectors, applied to tissue sampled in relation to treatment. Whether the montelukast S-enantiomer identified as a candidate TMEM164 inhibitor [7] can serve as a pharmacological tool in this setting will depend on central nervous system penetration and on selectivity data that are not yet available. Single-cell resolution of the expressing compartment is a required next step and is not a neutral one, because TMEM164 has been reported to be expressed in astrocytes in the mammalian brain, where astrocyte-specific overexpression alters lipid handling and disease phenotypes [31]; a bulk signal in glioblastoma tissue may therefore originate in more than one compartment.
4.1. Limitations
Several limitations bound these conclusions. The comparison with non-tumour brain rests on 5 TCGA and 20 CGGA control samples, and because the same 20 CGGA controls serve both CGGA cohorts, it comprises two independent comparisons rather than three; bulk tissue cannot distinguish upregulation within a cell type from a change in cellular composition. The meta-analysis combines only three cohorts, so τ² and I² are estimated imprecisely and the pooled interval is unstable to the removal of any single cohort; the HKSJ adjustment was adopted for this reason but does not remove the underlying limitation. All subgroup, sensitivity and interaction analyses were exploratory, were not planned in advance, and were not corrected for multiplicity; the nominally significant hazard ratio in 23 MGMT-methylated CGGA-325 patients is reported for completeness and is contradicted by the corresponding CGGA-693 subgroup, as is the nominally significant estimate in the irradiated CGGA-325 subgroup, which is reproduced in neither of the other two cohorts. Molecular classification is not uniform across resources: IDH status was determined molecularly in all three survival cohorts, but the markers required to classify grade II and III IDH-wildtype astrocytic tumours as glioblastoma under the 2021 WHO classification are unavailable in CGGA. Six patients contribute to both the TCGA cohort and the GLASS pairs, so those two analyses are not fully independent, although the three cohorts entering the meta-analysis are mutually disjoint. Multivariable adjustment was limited by the covariates available in each resource. Above all, this is an analysis of steady-state transcript abundance, which cannot resolve cell-specific expression, protein abundance, subcellular localisation, enzymatic activity, post-translational modification, or causal function.
5. Conclusions
Across independent adult glioblastoma cohorts, TMEM164 mRNA occupies a consistently higher within-sample rank among all measured transcripts than in non-tumour brain and is co-expressed with RIPK1 in a manner not explained by tumour composition, but it carries no reproducible prognostic information. The pooled interval excludes hazard ratios above approximately 1.6 per standard deviation, and the cohort-level estimates do not replicate one another in direction; a nominally significant association can be produced in the same data by selecting an optimal cutpoint and does not survive correction for that selection. Because TMEM164 protein is not quantified in the available public glioblastoma proteomes, the level at which the proposed radioresistance mechanism operates cannot currently be interrogated in patient material. Evaluation of TMEM164 as a therapeutic target in glioblastoma should therefore proceed through protein- and activity-level assays on treatment-related tissue sampling, rather than through baseline bulk-tumour transcript abundance.
Supplementary Materials
The following supporting information can be downloaded at: Preprints.org. Table S1: cohort composition and covariate availability; Table S2: absolute-scale tumour versus non-tumour comparison with housekeeping controls; Table S3: comparability of the CGGA control dataset; Table S4: Cox model diagnostics, discrimination and power; Table S5: meta-analytic sensitivity and leave-one-out analysis; Table S6: radiotherapy subgroup, interaction tests and landmark analyses; Table S7: extended CGGA-693 mixed-grade cohort; Table S8: position of co-expression partners within the transcriptome-wide null distribution; Table S9: CPTAC protein detection; Table S10: MGMT and IDH subgroup analyses; File S1: completed REMARK checklist; File S2: R session information.
Author Contributions
Conceptualization, F.D. and P.T.; methodology, F.D.; software, F.D.; formal analysis, F.D.; data curation, F.D.; visualization, F.D.; validation, C.B., S.A.T. and L.M.; supervision, P.T.; project administration, P.T.; writing—original draft preparation, F.D.; writing—review and editing, F.D., C.B., S.A.T., L.M. and P.T. All authors have read and agreed to the published version of the manuscript.
Funding
This research received no external funding.
Institutional Review Board Statement
Not applicable. This study is a secondary analysis of publicly available, de-identified data and did not involve new human participants.
Informed Consent Statement
Not applicable.
Data Availability Statement
All primary data analysed in this study are publicly available: TCGA-GBM via the UCSC Xena platform (https://xenabrowser.net), CGGA mRNAseq_693, mRNAseq_325 and the non-glioma control dataset via http://www.cgga.org.cn, and GLASS and CPTAC via cBioPortal (https://www.cbioportal.org). The analysis code, all derived analysis tables underlying every figure and table, and the complete R session information are openly deposited at Zenodo (doi: 10.5281/zenodo.22233721).
Acknowledgments
The authors thank the TCGA Research Network, the Chinese Glioma Genome Atlas, the GLASS Consortium and the Clinical Proteomic Tumor Analysis Consortium, and the patients who contributed samples to these resources.
Conflicts of Interest
The authors declare no conflicts of interest.
References
- Stupp, R.; Mason, W.P.; van den Bent, M.J.; Weller, M.; Fisher, B.; Taphoorn, M.J.B.; Belanger, K.; Brandes, A.A.; Marosi, C.; Bogdahn, U.; et al. Radiotherapy plus concomitant and adjuvant temozolomide for glioblastoma. N. Engl. J. Med. 2005, 352, 987–996. [CrossRef]
- Louis, D.N.; Perry, A.; Wesseling, P.; Brat, D.J.; Cree, I.A.; Figarella-Branger, D.; Hawkins, C.; Ng, H.K.; Pfister, S.M.; Reifenberger, G.; et al. The 2021 WHO Classification of Tumors of the Central Nervous System: a summary. Neuro Oncol. 2021, 23, 1231–1251. [CrossRef]
- Weller, M.; van den Bent, M.; Preusser, M.; Le Rhun, E.; Tonn, J.C.; Minniti, G.; Bendszus, M.; Balana, C.; Chinot, O.; Dirven, L.; et al. EANO guidelines on the diagnosis and treatment of diffuse gliomas of adulthood. Nat. Rev. Clin. Oncol. 2021, 18, 170–186. [CrossRef]
- Gomez-Roman, N.; Chong, M.Y.; Chahal, S.K.; Caragher, S.P.; Jackson, M.R.; Stevenson, K.H.; Dongre, S.A.; Chalmers, A.J. Radiation responses of 2D and 3D glioblastoma cells: a novel, 3D-specific radioprotective role of VEGF/Akt signaling through functional activation of NHEJ. Mol. Cancer Ther. 2020, 19, 575–589. [CrossRef]
- Schmit, K.; Michiels, C. TMEM proteins in cancer: a review. Front. Pharmacol. 2018, 9, 1345. [CrossRef]
- Liu, J.; Liu, Y.; Wang, Y.; Li, C.; Xie, Y.; Klionsky, D.J.; Kang, R.; Tang, D. TMEM164 is a new determinant of autophagy-dependent ferroptosis. Autophagy 2023, 19, 945–956. [CrossRef]
- Ke, M.; Shan, Y.; Zhai, Z.; Yao, G.; Guo, X.; Li, X.; Wu, Z.; Chen, H.; Zhang, M.; Chen, M.; et al. Cryo-EM structure of TMEM164 reveals distinct phospholipid remodeling mechanisms with anti-ferroptotic potential. Nat. Commun. 2025, 17, 924. [CrossRef]
- Jiang, Z.; Jin, X.; Xue, H.; Zhang, J.; Zeng, L.; Zhou, Y.; Pan, Y.; Zhang, J.; Shao, C. TMEM164 enhances radioresistance of GBM cells by inhibiting the FASN-NADPH-ROS axis. J. Neurooncol. 2025, 175, 1011–1026. [CrossRef]
- Altman, D.G.; Lausen, B.; Sauerbrei, W.; Schumacher, M. Dangers of using “optimal” cutpoints in the evaluation of prognostic factors. J. Natl. Cancer Inst. 1994, 86, 829–835. [CrossRef]
- Yan, J.; Wan, P.; Choksi, S.; Liu, Z.G. Necroptosis and tumor progression. Trends Cancer 2022, 8, 21–27. [CrossRef]
- Ye, K.; Chen, Z.; Xu, Y. The double-edged functions of necroptosis. Cell Death Dis. 2023, 14, 163. [CrossRef]
- Goldman, M.J.; Craft, B.; Hastie, M.; Repečka, K.; McDade, F.; Kamath, A.; Banerjee, A.; Luo, Y.; Rogers, D.; Brooks, A.N.; et al. Visualizing and interpreting cancer genomics data via the Xena platform. Nat. Biotechnol. 2020, 38, 675–678. [CrossRef]
- Brennan, C.W.; Verhaak, R.G.W.; McKenna, A.; Campos, B.; Noushmehr, H.; Salama, S.R.; Zheng, S.; Chakravarty, D.; Sanborn, J.Z.; Berman, S.H.; et al. The somatic genomic landscape of glioblastoma. Cell 2013, 155, 462–477. [CrossRef]
- Zhao, Z.; Zhang, K.N.; Wang, Q.; Li, G.; Zeng, F.; Zhang, Y.; Wu, F.; Chai, R.; Wang, Z.; Zhang, C.; et al. Chinese Glioma Genome Atlas (CGGA): a comprehensive resource with functional genomic data from Chinese glioma patients. Genomics Proteomics Bioinformatics 2021, 19, 1–12. [CrossRef]
- Barthel, F.P.; Johnson, K.C.; Varn, F.S.; Moskalik, A.D.; Tanner, G.; Kocakavuk, E.; Anderson, K.J.; Abiola, O.; Aldape, K.; Alfaro, K.D.; et al. Longitudinal molecular trajectories of diffuse glioma in adults. Nature 2019, 576, 112–120. [CrossRef]
- Cerami, E.; Gao, J.; Dogrusoz, U.; Gross, B.E.; Sumer, S.O.; Aksoy, B.A.; Jacobsen, A.; Byrne, C.J.; Heuer, M.L.; Larsson, E.; et al. The cBio cancer genomics portal: an open platform for exploring multidimensional cancer genomics data. Cancer Discov. 2012, 2, 401–404. [CrossRef]
- Gao, J.; Aksoy, B.A.; Dogrusoz, U.; Dresdner, G.; Gross, B.; Sumer, S.O.; Sun, Y.; Jacobsen, A.; Sinha, R.; Larsson, E.; et al. Integrative analysis of complex cancer genomics and clinical profiles using the cBioPortal. Sci. Signal. 2013, 6, pl1. [CrossRef]
- Ceccarelli, M.; Barthel, F.P.; Malta, T.M.; Sabedot, T.S.; Salama, S.R.; Murray, B.A.; Morozova, O.; Newton, Y.; Radenbaugh, A.; Pagnotta, S.M.; et al. Molecular profiling reveals biologically discrete subsets and pathways of progression in diffuse glioma. Cell 2016, 164, 550–563. [CrossRef]
- Cliff, N. Dominance statistics: ordinal analyses to answer ordinal questions. Psychol. Bull. 1993, 114, 494–509. [CrossRef]
- Benjamini, Y.; Hochberg, Y. Controlling the false discovery rate: a practical and powerful approach to multiple testing. J. R. Stat. Soc. Ser. B 1995, 57, 289–300. [CrossRef]
- Harrell, F.E., Jr.; Lee, K.L.; Mark, D.B. Multivariable prognostic models: issues in developing models, evaluating assumptions and adequacy, and measuring and reducing errors. Stat. Med. 1996, 15, 361–387. [CrossRef]
- Viechtbauer, W. Conducting meta-analyses in R with the metafor package. J. Stat. Softw. 2010, 36, 1–48. [CrossRef]
- IntHout, J.; Ioannidis, J.P.A.; Borm, G.F. The Hartung-Knapp-Sidik-Jonkman method for random effects meta-analysis is straightforward and considerably outperforms the standard DerSimonian-Laird method. BMC Med. Res. Methodol. 2014, 14, 25. [CrossRef]
- Higgins, J.P.T.; Thompson, S.G. Quantifying heterogeneity in a meta-analysis. Stat. Med. 2002, 21, 1539–1558. [CrossRef]
- Lausen, B.; Schumacher, M. Maximally selected rank statistics. Biometrics 1992, 48, 73–85. [CrossRef]
- Yoshihara, K.; Shahmoradgoli, M.; Martínez, E.; Vegesna, R.; Kim, H.; Torres-Garcia, W.; Treviño, V.; Shen, H.; Laird, P.W.; Levine, D.A.; et al. Inferring tumour purity and stromal and immune cell admixture from expression data. Nat. Commun. 2013, 4, 2612. [CrossRef]
- Wang, L.B.; Karpova, A.; Gritsenko, M.A.; Kyle, J.E.; Cao, S.; Li, Y.; Rykunov, D.; Colaprico, A.; Rothstein, J.H.; Hong, R.; et al. Proteogenomic and metabolomic characterization of human glioblastoma. Cancer Cell 2021, 39, 509–528.e20. [CrossRef]
- McShane, L.M.; Altman, D.G.; Sauerbrei, W.; Taube, S.E.; Gion, M.; Clark, G.M. Reporting recommendations for tumor marker prognostic studies (REMARK). J. Natl. Cancer Inst. 2005, 97, 1180–1184. [CrossRef]
- Soni, V.; Adhikari, M.; Simonyan, H.; Lin, L.; Sherman, J.H.; Young, C.N.; Keidar, M. In vitro and in vivo enhancement of temozolomide effect in human glioblastoma by non-invasive application of cold atmospheric plasma. Cancers 2021, 13, 4485. [CrossRef]
- Zhou, Y.; Zeng, L.; Cai, L.; Zheng, W.; Liu, X.; Xiao, Y.; Jin, X.; Bai, Y.; Lai, M.; Li, H.; et al. Cellular senescence-associated gene IFI16 promotes HMOX1-dependent evasion of ferroptosis and radioresistance in glioblastoma. Nat. Commun. 2025, 16, 1212. [CrossRef]
- Zhang, L.; Jia, Z.; Wu, Q.; Bai, T.; Wang, B.; Hu, X.; Li, T.; Liu, X.; Fu, J.; Chen, Y.; et al. Alleviating symptoms of neurodegenerative disorders by astrocyte-specific overexpression of TMEM164 in mice. Nat. Metab. 2023, 5, 1787–1802. [CrossRef]
Disclaimer/Publisher’s Note: The statements, opinions and data contained in all publications are solely those of the individual author(s) and contributor(s) and not of MDPI and/or the editor(s). MDPI and/or the editor(s) disclaim responsibility for any injury to people or property resulting from any ideas, methods, instructions or products referred to in the content. |
© 2026 by the authors. Licensee MDPI, Basel, Switzerland. This article is an open access article distributed under the terms and conditions of the Creative Commons Attribution (CC BY) license (http://creativecommons.org/licenses/by/4.0/).
Copyright: This open access article is published under a Creative Commons CC BY 4.0 license, which permit the free download, distribution, and reuse, provided that the author and preprint are cited in any reuse.