

Submitted:
04 September 2026
Posted:
07 September 2026
You are already at the latest version
Abstract
Regional economies with high extractive dependence have high exposure to external shocks, but their monitoring faces restrictions due to the low frequency of regional statistics. The objective of this study is to analyze the trajectory of Meta’s business cycle and its response to shocks by constructing the Coincident Economic Activity Indicator for Meta, by its Spanish acronym, ICAEM, by their acronyms in Spanish. To do this, monthly information was consolidated (2010–2025), estimating a Dynamic Factor Model, complemented with the extraction of the cyclical component and Local Projections. The results show that the ICAEM consistently reproduces the turning points of the activity and presents high synchronization with the national cycle, although with larger amplitude fluctuations. Overall, Meta's sensitivity to external and macroeconomic shocks does not depend exclusively on its oil specialization, but on the interaction between its productive structure, costs, financial conditions, and territorial logistical restrictions. Local Projections show asymmetric transmission patterns in the face of international price shocks and failures in the national road infrastructure. The ICAEM constitutes a monthly monitoring tool that allows timely identification of changes in the cycle and provides empirical evidence to guide economic decisions and public policies in natural resource-intensive regions.
Keywords:
regional business cycles
; coincident economic indicator
; dynamic factor model
; local projections
; macroeconomic shocks
; natural resource-dependent regions
1. Introduction
Economies with a high dependence on natural resources tend to experience greater volatility in their productive activity, due to their exposure to fluctuations in international markets and other external shocks [1].
In the Latin American context, this structural dependence has limited regional economic diversification, 1increasing the exposure of territories to recurring cycles of boom and slowdown [2]. In the Colombian case, regions such as Meta, Casanare, Arauca, Santander and Putumayo exhibit marked disparities in their productive structures, fundamentally explained by the asymmetric behavior of extractive and mining-energy activities [3]. In these areas, cyclical shocks interact directly with sectoral composition, fiscal dependence on royalties, public investment decisions, and local factor conditions, justifying a rigorous analysis of their productive trajectories.
Given these limitations, this study seeks to analyze the trajectory of the productive cycle of the department of Meta in the face of the main macroeconomic shocks that have conditioned its economic dynamics. Although the National Administrative Department of Statistics (DANE) publishes the departmental Gross Domestic Product (GDP), this information is only available annually and has a lag of close to a year and a half, which restricts its usefulness to timely identify the turning points of the economic cycle and the effects of short-term disturbances. In response to this limitation, a coincident indicator of economic activity was designed and built that allows us to approximate the monthly evolution of regional productive activity.
The construction of this coincident indicator adopts as a conceptual foundation the theory of business cycles, which provides an analytical framework to understand the dynamics of economic activity and its response to external, national and regional disturbances. Among the pioneering contributions are those of [2], who defined the economic cycle as a recurring, simultaneous, and non-periodic phenomenon of aggregate activity [3]. From this perspective, the cycle is characterized by the synchronized movements of multiple economic activities, reflected in the phase of expansion, contraction, recession, and recovery [2]. This approach constitutes the basis for identifying and analyzing the turning points of the production cycle of the department of Meta.
At the regional level, the analysis of the economic cycle through aggregate indicators makes it possible to identify long-term trends and follow the evolution of economic activity in the face of exogenous shocks, reducing the effect of high volatility and measurement errors that sectoral variables usually present in isolation [3]. Under this approach, the evidence for Colombia has advanced in the construction of a monthly chronology of economic cycles, allowing to characterize the expansion and recession phases and to identify the behavior of aggregate and sectoral variables around the turning points of the national economy [4].
Despite these advances, the analysis of economic cycles at a regional scale continues to face important limitations derived from the low frequency and availability of departmental statistics. In Colombia, empirical evidence has focused mainly on annual estimates of economic growth and regional convergence studies, while the characterization of short-term economic cycles at the departmental level has received less attention [5]. This situation justifies the analysis of the department of Meta as a regional case, by allowing us to examine how the turning points of the regional economic cycle respond to macroeconomic disturbances in an economy with high specialization in natural resources.
As a complement, the literature distinguishes disturbances in external and internal shocks. Regarding external shocks, variations in international raw material prices explain more than a third of the variance of output in exporting economies [6], generating differentiated impacts that depend on the exchange rate regime and the degree of local financial development [7,8,9], and that trigger asymmetric cycles of boom and bust on a regional scale [10].
Although the exploitation of these resources represents a crucial opportunity to expand regional incomes and raise social well-being [11], evidence shows that this relationship is not linear; Mining-energy abundance usually generates asymmetries that decouple regional economic dynamics from the trajectory of the national cycle. The discussion transmission in shocks and dependence on natural resources is relevant, some arguments could be synthesized to strengthen the clarity of the contribution, recognizing that the same external, monetary or fiscal disturbance does not affect all territories in the same way due to disparities in their sectoral structure [12,13,14].
Within this trend, research on heterogeneous regional responses to macroeconomic shocks such as those developed by [15,16,17,18,19] support this discussion. It is crucial to highlight the methodological approach of [20], who evaluate the transmission of aggregate shocks through a Monthly Indicator of Economic Activity -IMAE-, evidencing how local sensitivity to external disturbances is closely linked to industrial diversification and internal productive chains. However, these traditional approaches tend to omit the particularities of those regional economies with high structural dependence on non-renewable natural resources, where external shocks are transmitted asymmetrically through specialized fiscal channels (such as royalties), as well as through distortions in factor markets and specific institutional misalignments.
For the department, these analytical approaches allow unraveling the complex interactions between external disturbances, national policy decisions, and local productive conditions within a territory dependent on extractive resources [21,22]. In territories with this mining-energy profile, changes in international crude oil prices affect not only extractive sector production that generate broader transmission effects through royalty revenues, public investment, employment and regional aggregate demand [23].
Although studies of great national relevance such as those in [21,24] have made substantial progress in the analysis of external shocks, remittances, public investment and natural resource dynamics, a critical gap persists in the literature regarding the modeling of the simultaneous and high-frequency interaction between global shocks, national macroeconomic decisions and the internal responses of the region. In the department of Meta, external and national shocks tend to be combined with productive and fiscal features specific to the territory.
Now, the dividing line is not always clearly delimited between external and internal shocks. Thus, a drop in international oil prices has an effect not only on the extractive production process itself, but also on key variables, such as royalties to the State and public investment, contracting, employment, and the demand for land. Concurrently, changes in monetary policy, credit conditions, consumption, and private investment also occur through a productive structure with high sensitivity to the cycle of the extractive, agro-industrial, and construction sectors. Therefore, analyzing the departmental cycle requires identifying the interaction between external signals, national responses, and local territorial responses.
Studies on hydrocarbon producing areas concluded that the consequences of oil shocks do not depend only on the magnitude of the change in international prices, but also on the institutional capacity to absorb extraordinary income, guide public investment and mitigate the vulnerability of the productive structure [21,25].
Unlike previous studies, this work combines regional monthly information, a coincident indicator built specifically for the Meta and a local projections model that allows identifying the transmission of macroeconomic shocks in a regional economy intensive in natural resources.
The article is organized into four sections. The first describes the methodological strategy to build the ICAEM and estimate the response to macroeconomic shocks. The second presents the results of the coincident indicator and the impulse-response analysis. Finally, the third discusses the main findings and their implications for the regional economy, followed by the conclusions.
1.1. Economic Context and Production Structure of the Department of Meta: A Focus on Natural Resource Dependence
The economic structure of the department of Meta presents differential features compared to other territories with a high dependence on natural resources. In the period 2010-2024, the total departmental GDP of Meta registers an average growth of 4.67%, higher than the national GDP, located at 3.36%, and higher than that observed in Arauca, Casanare, Cesar, and La Guajira [26]. This performance is explained largely by the behavior of the extraction of mines and quarries, which grew 5.97%, the highest variation between the departments compared. Unlike Arauca and La Guajira, where this activity presents negative variations, Meta maintains a positive extractive dynamic, mainly associated with oil exploitation. Table 1 presents the average GDP growth rates between 2010 and 2024 for Meta and other departments that depend heavily on natural resources.
This behavior has antecedents in the consolidation of Meta as an oil territory. Regional reports show that, since the mid-2000s, fields such as Castilla, Chichimene, Rubiales and those located in Puerto Gaitán strengthened the department’s participation in national production [27,28,29]. In that period, Meta’s production increased while Arauca and Casanare showed signs of decline, until they became one of the main oil producers in the country. This trajectory helps explain that, between 2010 and 2024, extractive activity continues to be one of the main drivers of departmental growth.
However, Meta cannot be seen only as an oil economy. The GDP of agriculture, livestock, hunting, forestry, and fishing has an average growth of 5.90%. This growth is higher than that of Arauca, Cesar, and La Guajira, and is close to that of Casanare. This result shows an important agricultural base, which includes rice, oil palm, livestock, soybeans, corn, bananas, cocoa, rubber, and biofuels. For its part, trade grows 3.24%, a figure close to the national average. This is due to the role of Villavicencio as a regional center of services, supply and connection between Bogotá and Orinoquia (own calculations based on [4,26]).
Other indicators show a less balanced structure. Construction presents a negative average variation of -0.18%. This indicates that the growth of the department does not translate into a sustained expansion of the construction sector. The external openness coefficient also has a negative variation of -0.93%. This is different from Arauca and Casanare, where there is a significant increase. This suggests that the economic dynamics of Meta have not been accompanied by greater external insertion or a diversified export basket. In this context, the department moves away from regional economies with greater external industrial or commercial diversification (own calculations based on data from [26,30].
Meta’s credit portfolio grew by 11.87%, reflecting the expansion of financing, consumption, and economic activity. Royalties increased by 8.89%, providing additional resources for public investment while also increasing the department’s vulnerability to the oil cycle, international prices, and changes in distribution rules. Remittances grew by 18.22%, although Meta does not stand out as one of the country’s main recipient departments. Overall, the region remains dependent on natural resources, despite having a significant agricultural base and a relevant regional commercial sector. The main challenge is to transform oil revenues and royalties into more stable productive capacities, particularly in agribusiness, infrastructure, logistics, rural innovation, and specialized services.
2. Materials and Methods
2.1. Data, Selection of Variables and Statistical Treatment of Series
A technical inventory of 45 high-frequency economic series (monthly and quarterly) of national and regional scope was consolidated, corresponding to the period between January 2010 and December 2025 (192 monthly observations). The series was obtained from official sources, including DANE, Banco de la República, National Hydrocarbons Agency (ANH). The series were candidates to estimate the -ICAEM- and were classified into: series of economic activities, external references and series of macroeconomic relevance.
The consolidation of the series in a matrix called technical inventory following methodological criteria: i) monthly periodicity, ii) with a higher degree of correlation with the Economic Monitoring Indicator (ISE) and iii) absence of significant lags. Described by [31,32,33], Table A1 details the specifications of the series regarding periodicities, units of measurement, and the corresponding official sources.
Subsequently, statistical purification, logarithmic functional transformation according to the nature of each series and deseasonalization were carried out using the STL (Seasonal-Trend decomposition using LOESS) method, in accordance with the guidelines for the treatment of time series [5,34].
The series was temporally aligned and subjected to inspection for outliers and missing observations before applying the corresponding statistical transformations. With this base specification, 36 regional series were retained; When evaluating the sensitivity incorporating the Producer Price Index (PPI), 37 series were reached; while the version without seasonal adjustment returned to a set of 36 series. In Table 2, you can see the summary of the treatment carried out in the series.
2.2. Dynamic Factor Model for the Construction of the ICAEM
With the purpose of having a high-frequency monthly indicator that represents the timely evolution of the economic activity of the department of Meta, a Coincident Economic Activity Indicator (ICAEM) was built using a Dynamic Factor Model (DFM) following [35]. This methodology allows synthesizing the information contained in the economic series into a single common observable factor, whose estimation is carried out through a state-space representation and the Kalman Filter set out in equation (1).
In equation (1), represents the vector of transformed and standardized series; corresponds to the factor loading matrix; denotes the latent common factor and collects the idiosyncratic components associated with each series. The dynamic structure of the model is represented in equation 2 and 3 below:
2
3
where A(L) and B(L) are lagged polynomials that describe the temporal dynamics of the common factor and the idiosyncratic components, respectively, L is the operator. Both and are multivariate white noise processes.
2.3. ICAEM Estimation, Extraction of the Regional Economic Cycle and Identification of Observable Shocks
In the estimation of the DFM, alternative specifications with different numbers of common factors were evaluated using likelihood-based information criteria (Table A2). Based on this model-selection exercise, the specification used to construct the coincident indicator was selected. The common factor estimated through the state-space representation and Kalman filter constitutes the latent signal underlying the ICAEM; unlike a principal component, its selection is not based on a percentage of total variance explained. Subsequently, the monthly indicator is decomposed into trend and cycle using a state-space model, obtaining the cyclical component used in the subsequent econometric analysis. To isolate regional economic fluctuations, a structural time-series modeling approach is adopted [36], whereby the coincident indicator is decomposed into a trend and a stochastic cycle using a state-space smoothing algorithm.
This stochastic cycle constitutes the reference series for econometric estimation. Additionally, to provide a descriptive contrast of the chronology and assess the sensitivity of the indicator trajectory, the Hodrick–Prescott (HP) and Christiano–Fitzgerald filters are used [37,38]. For the monthly HP filter, a smoothing parameter of λ = 14,400 was adopted, and its results were contrasted with those obtained from the Christiano–Fitzgerald filter to mitigate the risk of overinterpreting a single filtering method. The HP-filter results are interpreted cautiously because of their sensitivity to endpoint problems and as emphasized by Hamilton [39], their potential to generate artificial cyclical patterns when mechanically interpreted as measures of the output gap. Therefore, the HP filter is used only as a robust and descriptive device and not as the sole basis for causal inference.
The macroeconomic and institutional shocks are defined according to an explicit, exogenous, and reproducible procedure. Specifically: (i) the producer price shock is approximated by the standardized monthly variation in the PPI; (ii) the oil shock by the standardized monthly growth rate of the international crude oil price; (iii) the monetary shock by standardized changes in the monetary policy interest rate; (iv) the exchange-rate shock by standardized variations in the Representative Market Rate (TRM); and (v) disturbances in the local real sector are summarized through a supplementary infrastructure channel constructed from the first principal component (PC1) of gray cement production and ELIC (approved area–number of licenses). This infrastructure-specific PCA is estimated independently from the DFM used to construct the ICAEM and from the auxiliary PCA applied to the 36-series regional block for descriptive purposes in Section 3.1. In the infrastructure block, PC1 explains 54.6% of the total variance (Table A3). Thus, this PCA is used exclusively to construct the supplementary infrastructure factor and does not enter the construction of the ICAEM. The use of PCA as a dimension-reduction technique is based on the developments in [37,38,39,40].
Accordingly, the dimension-reduction procedures used in the study serve distinct and non-overlapping purposes. The DFM estimated in state-space form through the Kalman filter is the procedure used to construct the ICAEM; the infrastructure-specific PCA described above constructs only a supplementary regressor for the shock analysis; and the separate PCA reported in Section 3.1. is purely descriptive and is used to characterize the contribution of the 36 regional series to their common variation. These procedures should therefore not be interpreted as alternative estimates of the same component.
To assess the statistical feasibility of jointly including the shock variables in parsimonious linear specifications, a collinearity diagnosis was conducted for the regressors. The Variance Inflation Factor (VIF) results reported in Table 3 are all below the conventional threshold of 5.0, indicating no evidence of severe multicollinearity.
2.4. Local Projections, Statistical Inference and Robustness Tests
The dynamic connection between the identified shocks and the economic activity of the department of Meta is evaluated using the Local Projections (LP) methodology proposed by [41]. This approach does not impose dynamic structures typical of VAR models, offers reliability against possible specification errors, and facilitates the incorporation of multiple types of shocks. Estimate the response of the indicator step by step for each horizon (where h = 012…12 months) is expressed in the following linear specification.
4
where the components of the equation are defined as follows:
Expression represents the response variable (Coincident Economic Activity Indicator for Meta in its cycle or growth component) evaluated in the future horizon , where months onwards; is the constant (intercept) estimated independently for each time horizon. : It is the parameter of analytical interest. It represents the coefficient of the empirical Impulse-Response Function (IRF), that is, the estimated marginal impact of the shock on regional activity after periods. : It is the structural shock or contemporary innovation observed in the period (for example, oil, exchange rate or interest rate shock).
: is the vector of control variables that includes lags of both the dependent variable and the shocks and other exogenous covariates (such as the PPI), to clean up the contemporaneous effect.
: are the coefficients associated with the lags of the control variables for each horizon; : is the error term or random disturbance of the regression on the horizon. Since construction of this error exhibits serial autocorrelation at horizons, its variance is estimated using the robust Newey-West HAC covariance matrix.
Since the estimation of multiple time horizons ( to 12) increases the risk of detecting false positives through repeated evaluations, the statistical inference was subjected to a False Discovery Rate (FDR) correction using the procedure of [42]. This correction simultaneously adjusts all 13 -values associated with each shock and specification.
Under this statistical requirement, the estimates are strictly interpreted as conditional dynamic responses and empirical regularities, avoiding pure causal statements. Consequently, the analysis of results rigorously categorizes the findings into three levels: robust statistical evidence (significant after FDR), marginal evidence (at 10% conventional significance) and directional patterns (visual trends without sufficient statistical support).
Finally, the stochastic properties of the series used were revalidated through unit root and stationarity tests. The evidence confirms strict stationarity for the cycle component (extracted via HP filter) and for the adjusted coincident indicator. In contrast, the monthly version of GDP shows only partial stationarity; This finding is explicitly incorporated into the discussion to ensure a prudent and methodologically transparent reading of the results.
2.5. Validation of the Economic Cycle and Shocks in the Meta Economic Monthly Indicator
Before the impact of transmission analysis, the stochastic properties of the resulting series were verified to avoid spurious relationships; two complementary tests were applied. The Augmented Dickey-Fuller (ADF) unit root test, whose null hypothesis evaluates the presence of a unit root, and the Kwiatkowski–Phillips–Schmidt–Shin test (KPSS) [43], which postulates the stationarity of the series as the null hypothesis. The results show that both the seasonally adjusted monthly growth rate and the cyclical component extracted using the Hodrick-Prescott (HP) filter parameterized with a smoothing factor of l=14400 for monthly frequency induce stationarity in the strict sense, achieving an integration order I (0). On the contrary, the series expressed in levels or transformed only into logarithms maintained high persistence and indications of non-stationarity. That is, the dynamic modeling of shock transmission is based on the dimensions of the cycle and monthly growth.
3. Results
3.1. Characteristics of the Economic Time Series Used to Construct the ICAEM
The Coincident Economic Activity Indicator for Meta (ICAEM) is not based on a single economic time series but on a diversified set of 36 regional economic series. This diversification reduces the risk that the indicator reflects the dynamics of an isolated sector and reinforces its interpretation as a conjunctural synthesis of economic activity in the department.
After data cleaning and standardization, an auxiliary Principal Component Analysis (PCA) was applied to the same standardized panel of 36 regional series to characterize its variance structure and identify the variables with the largest contributions to the dominant common component. This PCA is purely descriptive and is estimated independently from the Dynamic Factor Model (DFM) used to construct the ICAEM; therefore, the PCA loadings reported in this section should not be interpreted as the DFM loading matrix or as the procedure used to construct the coincident indicator. The first principal component (PC1) accounts for 24.3% of the total variance in the 36 series regional block, while the second principal component (PC2) accounts for 13.3% (Table 4). Thus, PC1 explains approximately 1.83 times as much variance as PC2, and the cumulative explained variance reaches 37.5% after the first two components. The marginal contribution subsequently declines, with PC3 and PC4 explaining 7.0% and 6.0%, respectively.
As an additional empirical check of the descriptive relevance of this auxiliary PCA, the independently estimated PC1 exhibits a correlation of 0.9625 with the common factor estimated by the DFM over the 175-month comparable sample. This high correlation indicates that, although the two quantities are obtained through distinct statistical procedures and serve different purposes in the study, they capture a closely related common signal in the regional information set.
This structure confirms that no additional component dominates enough to justify, on its own, a multifactorial representation of the indicator.
Nevertheless, it is acknowledged that the information criteria applied to the factor structure namely, the Akaike Information Criterion (AIC), the Bayesian Information Criterion (BIC), and the Hannan–Quinn Information Criterion (HQIC) favor a two-factor representation over a univariate factor specification. This decision is supported by factor-dimension selection procedures based on information criteria [44], and in the case of dynamic factor structures, by the criteria proposed by [45]. In the data analyzed, these criteria identify (K=2) as the appropriate specification for the model.
Table 5 shows the variables with the highest loading in the first component and represents the economy of the department together with economic activity:
The variables with the highest factor loading reflect that the ICAEM mainly synthesizes the behavior of activities closely linked to internal demand and services. Hotel occupancy and commerce capture the evolution of regional consumption and tourism; Housing financing represents the dynamics of the construction and credit sector; while job occupation summarizes the conditions of the labor market. Together, these variables show high synchrony with the indicator, which confirms that the ICAEM integrates information from different sectors of the economy and does not depend on the behavior of a single productive activity.
Figure 1 shows the monthly trajectory of the four series with the highest load, in standardized interannual variation, compared to the ICAEM:
3.2. Construction and Calibration of the Coincident Indicator of the Economic Activity for Meta (ICAEM)
The trajectory of the Coincident Economic Activity Indicator for Meta (ICAEM) shows a regional productive cycle characterized by marked volatility and high sensitivity to external macroeconomic conditions. The structure for Meta operates as an amplification mechanism of the Colombian cycle: although it shares the turning points with the national Economic Monitoring Indicator (ISE), the oscillations of the ICAEM exhibit a significantly greater amplitude (Figure 2).
The main validation is based on a common window between January 2011 and December 2025, with 180 observations. In this sample, the correlation between the ICAEM and the national ISE in interannual growth rate reaches 0.825. This result confirms the consistent path of the monthly indicator, managing to align with the dynamics of the ISE without incorporating the excessive volatility of a monthly GDP.
This dynamic responds to a heterogeneous economic structure. Although the extraction of hydrocarbons occupies a central place in the generation of added value and income, the departmental dynamics also depend on commerce, construction, transportation, hospitality, financial services, employment and public activity [26]. The regional economic activity is strongly articulated with the agricultural sector in livestock, rice, oil palm and the urban dynamics of the capital Villavicencio, which concentrates commerce, services and construction. In addition to events of cultural and tourist impact such as the Joropo International Tournament and Expomalocas [46], and helps explain why exogenous shocks are transmitted simultaneously through financial, social, and real channels [47].
3.3. Chronology and Trends in Expansions and Contractions
In congruence with this behavior, the lower part of Figure 3 associates the shock of greater and lesser magnitude. This visual identification anchors each acceleration or deceleration of the indicator to a specific concurrent signal, avoiding over-interpreting the causality of a single factor and serving as a preamble for impulse-response functions. From this decomposition, the ICAEM chronology exhibits the following macroeconomic facts: The ICAEM chronology is consistent with relevant macroeconomic events that occurred in the study period.
3.3.1. Initial Expansion and Deceleration (2011-2013)
Between 2011 and the beginning of 2012, the indicator remained above its trend, in a context of dynamism of oil production and expansion of agricultural, commercial and urban development activity. The growth of the extractive sector had additional effects on royalties, hiring, employment, and regional demand. This phase, followed by a slowdown in 2013, is especially linked to the National Agrarian Strike, due to the prices of inputs that lasted approximately 24 days, affecting traffic in the department. Additionally, another strike by the indigenous Minga occurred in Puerto Gaitán, affecting the pace of oil production [48].
3.3.2. Oil Adjustment and Social Shock (2014-2016)
It should be noted that at the end of 2015 and 2016, coinciding with the drop in the international price of oil that began in 2014. Now, in the department, two relevant oil fields, Ocelote and Guarrojo, paralyzed operations after the Meta Regional Ombudsman’s Office filed a guardianship on behalf of the Awalibá community, alleging lack of prior consultation and environmental and cultural impacts [49,50]. The decrease in income from economic activity affected the hiring of suppliers, the labor market, royalties and public investment, with repercussions on commerce, construction and consumption, although the intensity and duration of these effects vary between economic sectors [15].
3.3.3. Moderate Recovery (2017-2019)
The indicator subsequently records a recovery between 2017 and 2019, although with a more modest growth rate and dependent on urban demand in Villavicencio [51].
3.3.4. The Pandemic Shock (2020)
COVID-19 represented the deepest valley of the indicator. Mobility restrictions collapsed services, transportation and hotel occupancy [23], while hydrocarbon activity suffered a double impact: the national operational closure and the temporary drop in WTI to negative levels. fell below 2 dollars per barrel, affecting employability in the region.
3.3.5. The Post-Pandemic Stabilization Shock (2021-2025)
In 2021, the ICAEM recorded a historical peak of interannual growth of more than 15%. This maximum is due to the comparison base effect, the reactivation of dammed consumption, and the rebound in crude oil prices. During 2022, growth gradually moderated due to inflationary pressures, tightening monetary policy, and lower borrowing capacity [52]. The process revives slightly in 2024 to remain stable throughout the rest of the time.
In summary, the trajectory shows that the greatest phases of expansion in Meta coincide with the joint action of the oil boom and the dynamism of credit and construction. In contrast, the valley phases expose the vulnerability of the productive matrix to the simultaneous interaction of supply, demand, and relative price shocks.
3.4. Responses of the Regional Production Cycle to External Shocks
Before discussing the impulse response functions in the indicator, the monthly trajectory of the standardized innovations of each shock and the macroeconomic events or facts associated with higher peaks are documented. According to the approach of [41], this preliminary reading characterizes the observable innovations of the system, offering the narrative anchor necessary to economically interpret the empirical results.
The producer price shock (PPI) registers its highest concentration of positive innovations between January and March 2022 (Figure 4). This behavior responds to the global increase in the cost of inputs, fertilizers and food, triggered by disruptions in post-pandemic supply chains and the scale of geopolitical tensions derived from the conflict between Russia and Ukraine [53]. In contrast, the most difficult negative innovation is in April 2020, when the confinement measures implemented to contain COVID-19 caused a sharp contraction in aggregate demand and a significant reduction in productive activity.
The oil shock, approximated by the international price of Brent crude oil (Figure 5), presents the largest negative innovations in April 2020, when restrictions derived from the COVID-19 pandemic caused an unprecedented collapse in global oil demand and high volatility in energy markets. In contrast, the greatest positive innovations are recorded in March 2018 and July 2021. The first episode coincides with an international context of strengthening crude oil prices, favored by supply restrictions and geopolitical tensions, while the second reflects the recovery of global energy demand following the post-pandemic economic recovery. For its part, March 2016 represents one of the most critical points of the downward cycle observed between 2014 and 2016, characterized by excess supply and a slowdown in international demand.
These events did not modify the behavior of the international oil price, but they could amplify or attenuate the transmission of the oil shock to the departmental economy, given the high dependence of Meta on hydrocarbon activity and road connectivity with the center of the country.
The high breadth of innovations during 2018 reflects a period of high volatility in the international oil market, associated with simultaneous changes in expectations about global supply, geopolitical tensions and the evolution of global demand.
The exchange rate shock, approximated by the Representative Market Rate (TRM) (Figure 6), recorded its greatest positive innovation in March 2020, when the Colombian peso experienced a strong depreciation as a consequence of the uncertainty generated by the start of the COVID-19 pandemic, the fall in international oil prices and the migration of capital towards assets considered safe. Followed by a high depreciation in July 2022, associated with the tightening of international monetary policy, the global strengthening of the dollar and the uncertainty derived from the government transition process in Colombia. For its part, the innovations registered between December 2014, and August 2015 reflect the depreciation of the peso during the cycle of falling international oil prices, given the high dependence of the Colombian economy on hydrocarbon exports.
The interest rate shock, approximated by the monetary policy rate of the Bank of the Republic (Figure 7), registers the greatest positive innovations between April and August 2022, reaching its maximum in July of that year. This behavior corresponds to the monetary tightening cycle implemented by the Bank of the Republic to contain inflationary pressures. As a result, the intervention rate went from levels close to 3% at the beginning of 2022 to double-digit levels towards the end of the same year. In contrast, the greatest negative innovations are observed in June 2020 and during 2024, reflecting, respectively, the extraordinary reductions in the interest rate to mitigate the economic effects of the pandemic and the subsequent start of the monetary flexibility cycle, once inflation began to moderate.
3.5. Transmission of External Shocks and ICAEM Responses
3.5.1. Regional Transmission Channels of Meta
The economic activity of Meta has shown a productive structure closely linked to the extraction of mines and quarries, especially the extraction of hydrocarbons, followed by agricultural activity, construction, and commerce. This economic activity has experienced various impacts of shocks in the context of high logistical, climatic, and productive vulnerability.
During 2018, the collapse of the Chirajara bridge and the restrictions on the Bogotá-Villavicencio corridor altered regional logistics, directly impacting commerce, merchandise transportation, and tourism. Later, in 2020, health restrictions due to COVID-19 and the effects on the road network caused a deep contraction in production and services.
In 2022, the economic activation coincided with new road blockages due to flooding and mobility interruptions, raising operating costs for local companies.
In this context, exogenous impulses operate through well-defined pathways: the increase in the price of oil, which increases the income associated with the hydrocarbon sector; exchange depreciation raised the cost of imported inputs used in agriculture and construction; the increase in the PPI puts pressure on production costs; and the restrictive monetary policy stance moderates the expansion of credit, investment and consumption.
3.5.2. Conditional Dynamic Responses (Local Projections)
The official specification of local projections evaluates the dynamic response of the ICAEM in the four monthlyized and standardized innovations: PPI, oil, intervention interest rate, and TRM [41]. When estimating independent equations under an identical set of controls, the coefficients should be interpreted as conditional dynamic responses and not as a structural causal decomposition of the moment. Figure 8 shows the impulse response of the ICAEM to shocks.
- −
- Producer Price Shocks (PPI): constitutes the most solid and statistically significant result. It accumulates an impact of +7.131 percentage points between h=0 and h=12, reaching a peak of +0.747 at h=3 and (p=0.037) retaining significance in 11 horizons after correction for multiple comparisons with q ≤0.10. Economically, this is consistent with the January-March 2022 episode, where the PPI acted as an early signal of cost pressures and concurrent demand dynamism.
- −
- Exchange Shock (TRM): presents the clearest contractionary pattern h =0 and h = 12 with an absolute valley at h=5. Although individual points do not retain significance after FDR adjustment, the trajectory reflects the vulnerability of a regional economy exposed to dollar-denominated input and financing costs.
- −
- Oil Shock (Brent) shows a marginal positive response around h=9, with coefficient (+0.363, p=0.059), but does not retain significant post-FDR horizons. It is reported as a directional pattern compatible with the extractive structure of Meta and the recovery events of 2018 and 2021, suggesting delays in the transmission of oil income to real activity.
- −
- Monetary Shock (Interest Rate): the most ambiguous signal, with slight positive short-term effects and a non-significant negative maximum around h=12. This combination is compatible and consistent with a simultaneity scenario, in which the 2022 rate hike cycle temporarily coincided with the inflationary surge in costs (PPI) itself, and the post-pandemic rebound.
Complementarily, the incorporation of an infrastructure factor extracted via PCA from cement consumption, licenses and construction, exhibited an early positive signal on the indicator. While this confirms the internal channel of construction, it does not replace the base specification focused on PPI, oil, interest rate, and TRM.
3.6. ICAEM Robustness Analysis
To verify that the trajectory of the indicator does not depend significantly on filtering decisions or the inclusion of specific variables, the stability of the ICAEM was evaluated against alternative specifications (Figure 9). The base version was compared against two alternatives: i) an estimate without prior deseasonalization (No STL) and ii) a sensitivity that directly incorporates the PPI in the factor block of principal components.
It is observed that none of the alternative specifications alter the turning points or the economic chronology of the indicator. Robustness is confirmed by examining the absolute monthly gap against the base model (Figure 10). Even during the periods of greatest specific discrepancy associated with the volatilities of 2012, 2020 and 2022, the magnitude of the difference is minimal and does not distort the acceleration, contraction, or subsequent normalization phases of the cycle.
4. Discussion
The most relevant findings dialogue directly with the view of [20] on macroeconomic contagion and the propagation of monetary and external shocks. Contrary to the traditional idea that national disturbances are transmitted uniformly, it reminds us that regional responses are deeply heterogeneous and depend on the local productive structure and its levels of integration [20]. The ICAEM confirms this premise: although the Meta economy usually accompanies the changes in the national cycle, the magnitude of its falls shows patterns of spatial contagion that are neither symmetrical nor linear.
To capture this dynamic without pigeonholing the analysis in the rigidity of a traditional vector model, we opted for the Local Projections (LP) methodology. It should be noted that the use of LP is fundamental, as it remains an underexploited approach in Colombian regional econometrics. Unlike the Impulse-Response Functions (IRF) of conventional VAR models that impose a rigid mathematical structure on all system variables, Local Projections estimate the response step by step through independent regressions for each time horizon. This gives us a much more flexible and robust model in the face of misspecification problems, allowing us to accurately track the speed and persistence with which external shocks (oil, TRM, PPI) spread to departmental activity month by month during the year after the disturbance.
On the other hand, when comparing the dynamics of the ICAEM with the pioneering study of [54], we found coincidences in the determinants but marked differences due to the frequency of the data. With a SVAR of annual data (1990-2015) and long-term restrictions, it concludes that supply shocks move regional GDP, while demand shocks only affect prices [54]. The ICAEM agrees on the weight of the offer, with the PPI being the firmest and most persistent response, but it provides the advantage of high temporal frequency. While the annual approach tells us what moves the Meta economy in the long term without specifying the month in which it occurs, the ICAEM monitors the sensitivity, speed of adjustment and volatility of the region month by month in the face of current events. One shows us the structure; the other, the flexibility and responsiveness of the departmental economy.
In relevance, compared to the effort of [4], to characterize the cycle, the ICAEM validates those multiple local variables (commerce, employment, transportation, housing) are needed to capture the phases of the territory, demystifying the idea of an absolute dependence on oil. However, their purposes complement each other: while [4] focus on dating the turning points and cycle agreement, the ICAEM uses Local Projections to understand the trajectory of the shock over time. This combination allows us to clearly differentiate crises: the decline between 2014 and 2016 linked to the oil shock and its impact on income and investment; Instead, the 2020 shock mixed supply, demand, employment and logistics shocks at the same time. The high frequency combined with Local Projections not only tells us when the department enters a phase of the cycle, but also how and at what rate it is affected and responds to uncertainty.
5. Conclusions
The research demonstrates that the construction of the Coincident Economic Activity Indicator for Meta (ICAEM) constitutes a methodologically sound and empirically viable quantitative tool for high-frequency monitoring in regional economies intensive in natural resources. The ICAEM does not seek to mechanically replicate the trajectory of the monthly departmental GDP, but rather to offer a coincident signal of the regional economic dynamics capable of identifying turning points, evaluating the amplitude of the cycle and determining the degree of synchronization with the national economy. From the econometric perspective, the application of Local Projections provides key evidence on the transmission of exogenous shocks at the regional level [41]:
- −
- Predominance of the producer price shock (PPI): The PPI emerges as the most statistically solid and persistent signal in the system, retaining significance in 11 horizons after correction for multiple comparisons (False Discovery Rate, = q≤0.10). Economically, the PPI does not operate as a pure structural shock, but rather as a leading indicator that contemporaneously captures cost pressures on agricultural and industrial inputs and accelerations in aggregate demand.
- −
- Exchange vulnerability: The TRM registers the most pronounced accumulated contractionary impact of the system, confirming the sensitivity of the regional productive apparatus to the depreciation of the peso, which increases the cost structure in key activities such as agriculture, commerce, transportation and construction.
- −
- Conditional effects of crude oil and monetary policy: Although the international price of oil (Brent) and the intervention interest rate show directional responses consistent with the extractive matrix and the 2022 monetary tightening cycle, the loss of significance under the FDR correction requires interpreting their trajectories as conditional dynamic responses and not as definitive causal relationships.
- −
- Clarity in the statistical analysis: The selection of a single main factor for the ICAEM meets a criterion of parsimony and operability. In contrast, the extraction of a synthetic component for the internal infrastructure channel has the specification of obtaining information that supports the estimates.
5.1. Territorial and Public Policy Implications
The empirical findings confirm that macroeconomic shocks do not impact the Meta economy in a neutral environment. Logistical vulnerability and constant interruptions in the Bogotá-Villavicencio Road corridor operate as amplifying mechanisms that prolong the negative effects of exogenous disturbances. For regional decision-making, the ICAEM offers key technical input for the design of territorial public policies:
- −
- Early cost alert: Accompany for the monthly monitoring of the ICAEM with the behavior of the PPI to anticipate tensions in the margins of agricultural producers before losses are consolidated in real activity.
- −
- Infrastructure as a countercyclical policy: Structurally address the vulnerability of regional land connectivity to mitigate supply shocks that make transportation more expensive and limit the department’s competitiveness.
- −
- Diversification of the productive matrix: Strengthen agro-industrial and non-extractive service value chains to reduce the exposure of regional income to commodity volatility and exchange rate uncertainty.
5.2. Limitations and Future Lines
We take into account that the current specification parsimoniously resolves the fundamental macroeconomic block; for future research, progress must be made in the integration of administrative records of high-frequency formal employment and in the exploration of non-linear models that allow evaluating possible asymmetries in the response of the regional cycle to expansionary versus contractionary shocks.
| 1 | Throughout this article, the term region is used to designate the department as a unit of study. This use responds to a conception of the region as a space of analysis delimited according to the objectives of the research and not necessarily as a political-administrative category, in accordance with what was proposed by [55]. |
Supplementary Materials
The following supporting information can be downloaded at the website of this paper posted on Preprints.org, Table S1: Database of Economic Variables for the Department of Meta, 2000–2025.
Author Contributions
Conceptualization, S.G.; methodology, S.G.; software, S.G.; validation, S.G.; formal analysis, S.G.; investigation, A.L.; resources, S.G. and B.O; data curation, B.O.; writing original draft preparation, S.G., A.L. and B.O.; writing review and editing, S.G., A.L. and B.O.; visualization, S.G.; supervision, S.G.; project administration, S.G. All authors have read and agreed to the published version of the manuscript.
Funding
This research was funded by Universidad de los Llanos, grant number C01-05-2025-008. The APC was funded by the same grant.
Institutional Review Board Statement
Not applicable.
Informed Consent Statement
Not applicable.
Data Availability Statement
The data presented in this study were compiled from publicly available sources, including DANE, Banco de la República, DIAN, the Government of Meta, DNP, the Financial Superintendence of Colombia, the Chamber of Commerce, the Ministry of Commerce, Industry and Tourism, and ANH, among others. The consolidated dataset supporting the reported results is openly available in the Supplementary Materials associated with this article (Table S1).
Acknowledgments
During the preparation of this manuscript, the authors used Claude Sonnet 5 (Anthropic) to improve the structure and style of the text. The authors reviewed and edited the generated output and took full responsibility for the content of this publication.
Conflicts of Interest
The authors declare no conflicts of interest. The funders had no role in the design of the study; the collection, analysis, or interpretation of the data; the writing of the manuscript; or the decision to publish the results.
Abbreviations
The following abbreviations are used in this manuscript:
| GDP | Gross Domestic Product |
| TRM | Representative Market Rate |
| ICAEM | Coincident Indicator of Economic Activity in Meta ( by its Spanish acronym) |
| DANE | National Administrative Department of Statistics |
| IMAE | Monthly Economic Activity Indicator |
| ANH | National Hydrocarbon Agency |
| STL | Seasonal-Trend decomposition using LOESS |
| PPI | Producer Price Index |
| DFM | Dynamic Factor Model |
| HP | Hodrick Prescott |
| PC1 | Principal Component First |
| ELIC | Building Statistics Construction Licenses |
| PCA | Principal Component Analysis |
| VIF | Variance Inflation Factor |
| LP | Local Projections |
| IRF | Impulse-Response Function |
| HAC | Robust Covariance Matrix |
| FDR | False Discovery Rate |
| ADF | Augmented Dickey-Fuller Unit Root |
| KPSS | Statistical test by Kwiatkowski, Phillips, Schmidt and Shin |
| AIC | Akaike Information Criterion |
| BIC | Bayesian Information Criterion |
| HQIC | Hannan-Quinn Information Criterion |
| ISE | Economy Monitoring Indicator |
| WTI | West Texas Intermediate |
| VAR | Vector Autoregressive Statistical Model |
| SVAR | Structural Autoregressive Vector Statistical Model |
Appendix A
Appendix A.1

Table A1.
Inventory of macroeconomic and regional variables.
| Statistics | Variable | Available period | Unit of measurement | Source |
| National | Economy Monitoring Index (ISE) | Monthly | Index | DANE |
| Producer Price Index (PPI) | Monthly | Index | DANE | |
| Representative Market Rate (TRM) | Monthly | Colombian pesos per US dollar | Banco de la República | |
| Monetary Policy Rate (MPR) | Monthly | Percentage (%) | Banco de la República | |
| Regional (Meta) |
Villavicencio CPI | Monthly | Index | DANE |
| FOB Exports | Monthly | Billions | DANE | |
| CIF Imports | Monthly | Billions | DANE | |
| Gas production | Monthly | Millions of cubic feet (MDPC) | ANH | |
| Oil production by municipalities | Monthly | Daily average barrels | ANH | |
| Gray cement production | Monthly | Tons | DANE | |
| Electric Energy Demand | Monthly | Gigawatt-hours (GWH) | UPME/XM | |
| Employed persons | Monthly | Units | DANE | |
| Capital-city employment rate | Monthly | Index | DANE | |
| African oil palm production | Monthly | Tons | Fedepalma | |
| Palm fruit production | Monthly | Tons | Fedepalma | |
| Rice Price | Monthly | $/ton | Fedearroz | |
| Rice production | Monthly | Tons | Fedearroz | |
| Cattle slaughter | Monthly | Units | DANE | |
| Milk production | Monthly | Liters | Governor’s Office | |
| Bovine Inventory | Monthly | Number | Ministry of Agriculture | |
| Bovine meat production | Monthly | Tons | FAO | |
| Pig inventory (head) | Monthly | Number | FAO | |
| Pork production | Monthly | Tons | FAO | |
| Vehicle registration | Monthly | Units | RUNT | |
| Guests (EMA) | Monthly | Thousands of pesos | DANE | |
| Hotel occupancy | Monthly | Percentage | DANE | |
| Royalties transferred to Meta | Monthly | Billions | CIFFIT | |
| Air passengers | Monthly | Unit | Aerocivil | |
| ELIC Meta | Monthly | Approved area | DANE | |
| ELIC Meta | Monthly | Units | DANE | |
| Housing Financing (credits) | Monthly | Units | DANE | |
| Mining certification | Monthly | Units | ANH | |
| Public Sale Prices of Nationally Produced Foods (PVPAPN—Villavicencio) | Monthly | Index | DANE | |
| GDP: Public administration and defense; mandatory social security plans; Education; Human health care and social services activities | Monthly | Billions | ||
| GDP: Agriculture, livestock, hunting, forestry and fishing | Monthly | Billions | DANE | |
| GDP: Wholesale and retail trade; repair of motor vehicles and motorcycles; Transportation and storage; Accommodation and food services | Monthly | Billions | DANE | |
| GDP: Construction* | Monthly | Billions | DANE | |
| GDP: Mining of mines and quarries | Monthly | Billions | DANE | |
| GDP: Manufacturing industries | Monthly | Billions | DANE | |
| Business and Trade Tax | Annual | Millions of pesos | CIFFIT | |
| Current revenue | Annual | Millions of pesos | CIFFIT | |
| Total revenue | Annual | Millions of pesos | CIFFIT | |
| Tax revenue | Annual | Millions of pesos | CIFFIT | |
| Property tax | Annual | Millions of pesos | CIFFIT | |
| Homes sold | Monthly | Units | Property Gallery |
Note: The inventory includes 45 macroeconomic and regional variables, including GDP figures for each economic activity.
Appendix A.2
Table A2.
Infrastructure Channel PCA Diagnosis DFMlarges.
| Variable / diagnosis | Value |
| Monthly departmental GDP | 0.630 |
| Gray cement | 0.422 |
| Construction licenses (m2) | 0.652 |
| Explained variance PC1 | 0.546 |
| Explained variance PC2 | 0.245 |
| KMO | 0.627 |
| Bartlett chi2 | 46.533 |
Appendix B
Figure A1.
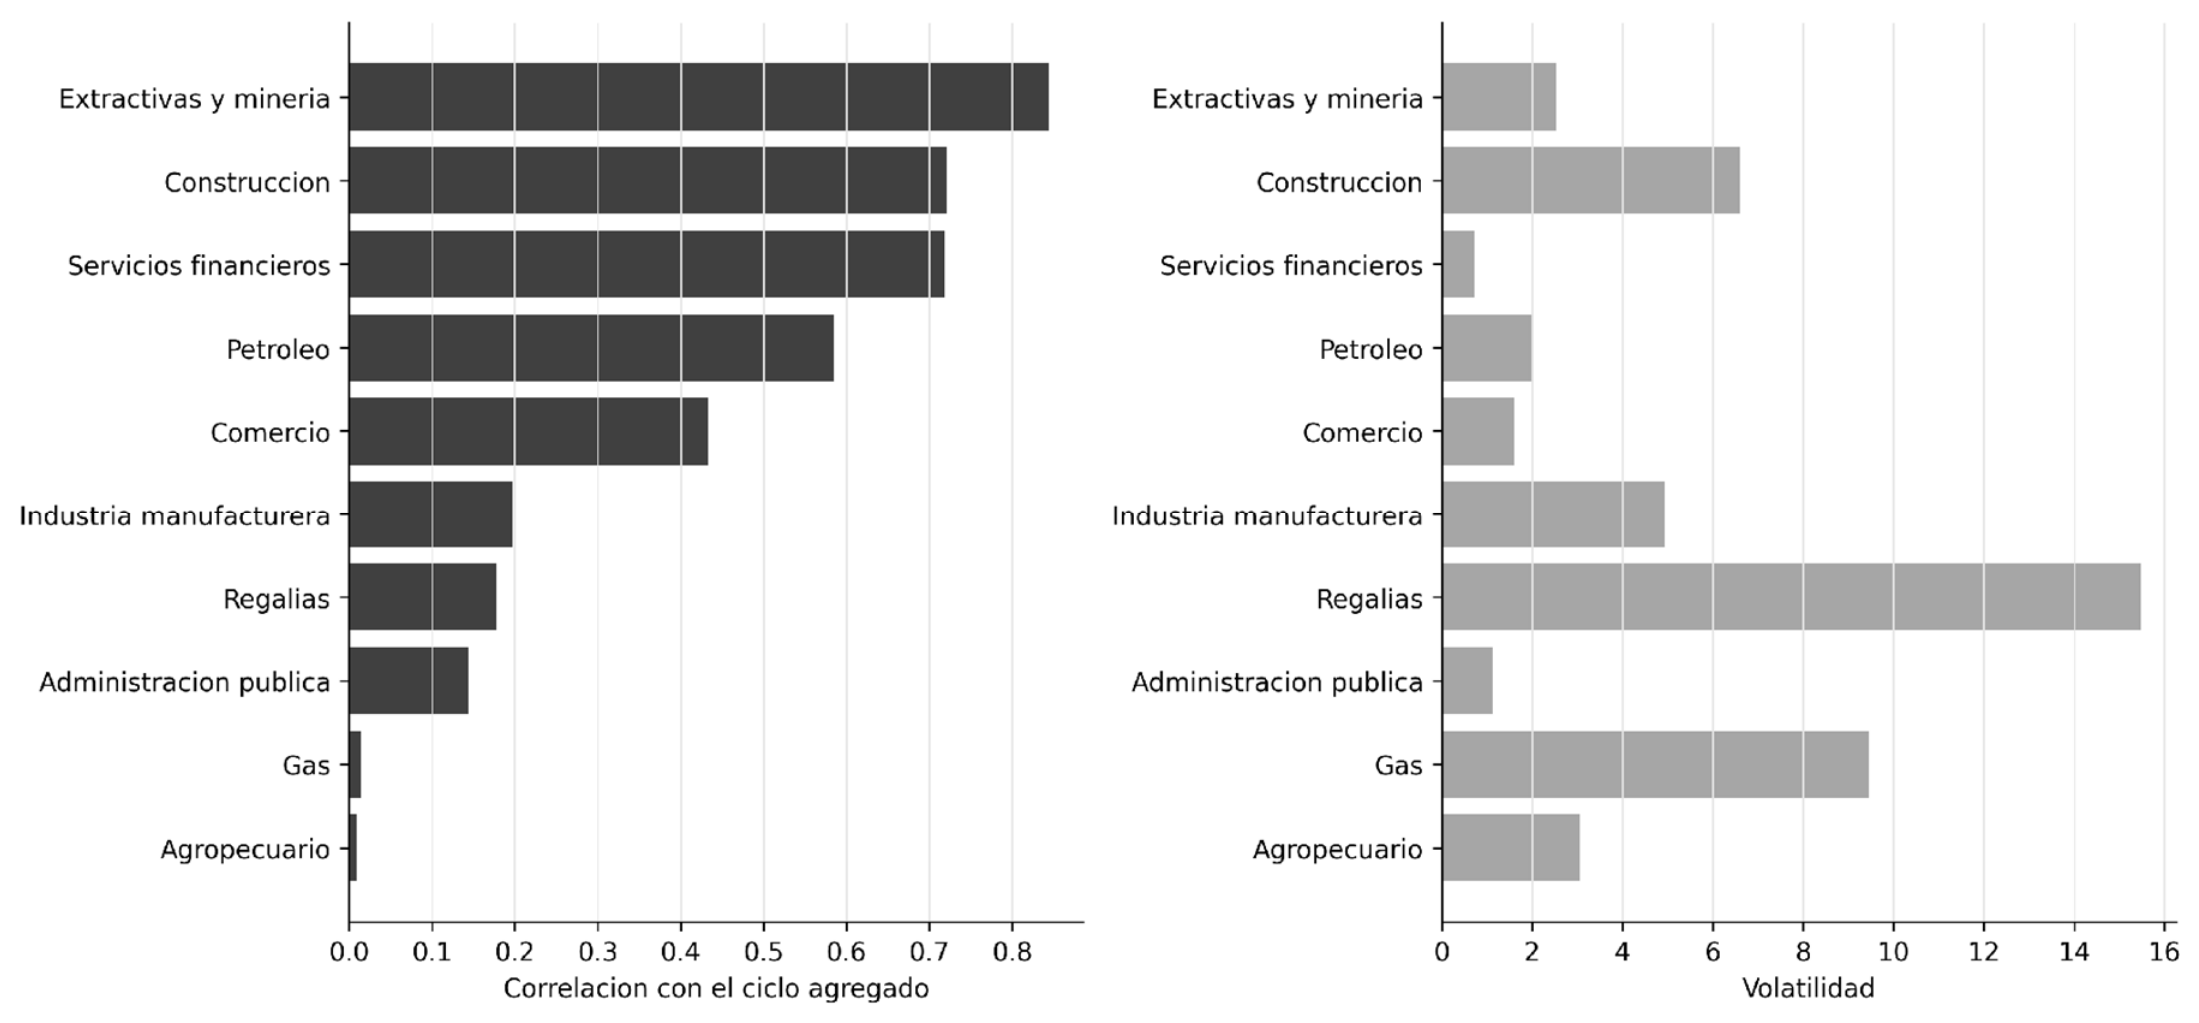
ICAEM sector coverage.
References
- Guan, L.; Zhang, W.W.; Ahmad, F.; Naqvi, B. The volatility of natural resource prices and its impact on economic growth in natural resource-dependent economies: A comparison of oil- and gold-dependent economies. Resour. Policy 2021, 72, 102125. [Google Scholar] [CrossRef]
- Burns, A.F.; Mitchell, W.C. Working plans. In Measuring Business Cycles; Burns, A.F., Mitchell, W.C., Eds.; National Bureau of Economic Research: New York, NY, USA, 1946; pp. 3–22. ISBN 0-870-14085-X. [Google Scholar]
- Melo, L.; Nieto, F.; Ramos, M. A Leading Index for the Colombian Economic Activity; Borradores de Economía No. 243. Banco de la República: Bogotá, Colombia, 2001. Available online: https://www.banrep.gov.co/docum/ftp/borra243.pdf (accessed on 31 July 2026).
- Banco de la República de Colombia. Características cuantitativas de los ciclos económicos en Colombia. Ensayos Sobre Política Económica 2025, 10, 110. Available online: https://www.banrep.gov.co/es/publicaciones-investigaciones/espe/caracteristicas-cuantitativas-ciclos-economicos-colombia. (accessed on 31 July 2026).
- Alonso, J.C. Proyectando el producto departamental bruto caucano con un modelo de análisis factorial dinámico. Apuntes CENES. 2006, No. 8. Available online: https://revistas.uptc.edu.co/index.php/cenes/article/download/5132/5407 (accessed on 31 July 2026).
- Fernández, A.; González, A.; Rodríguez, D. Sharing a ride on the commodities roller coaster: Common factors in business cycles of emerging economies. J. Int. Econ. 2018, 111, 99–121. [Google Scholar] [CrossRef]
- Al-Sadiq, A.; Bejar, P.; Ötker, İ. Commodity Shocks and Exchange Rate Regimes: Implications for the Caribbean Commodity Exporters; International Monetary Fund: Washington, DC, USA, 2021; Available online: https://www.imf.org/-/media/Files/Publications/WP/2021/English/wpiea2021104-print-pdf.ashx (accessed on 31 July 2026).
- Bodart, V.; Candelon, B.; Carpantier, J.-F. Real Exchange Rates, Commodity Prices and Structural Factors in Developing Countries; Université Catholique de Louvain: Louvain-la-Neuve, Belgium, 2011; Available online: https://sites.uclouvain.be/econ/DP/IRES/2011045.pdf (accessed on 31 July 2026).
- Céspedes, L.F.; Velasco, A. Macroeconomic Performance during Commodity Price Booms; National Bureau of Economic Research: Cambridge, MA, USA, 2012; Available online: https://www.nber.org/system/files/working_papers/w18569/w18569.pdf (accessed on 31 July 2026).
- Allcott, H.; Keniston, D. Dutch Disease or Agglomeration? The Local Economic Effects of Natural Resource Booms in Modern America . Am. Econ. Rev. 2018, 108, 695–731. [Google Scholar] [CrossRef]
- Lotfalipour, M.R.; Sargolzaie, A.; Salehnia, N. Natural resources: A curse on welfare? Resour. Policy 2022, 79, 103056. [Google Scholar] [CrossRef]
- Yi, M.; Mueller, S.; Stegmaier, J. Industry mix, local labor markets, and the incidence of trade shocks. J. Labor Econ. 2024, 42, 837–875. [Google Scholar] [CrossRef]
- Adão, R.; Arkolakis, C.; Esposito, F. General Equilibrium Effects in Space: Theory and Measurement; National Bureau of Economic Research: Cambridge, MA, USA, 2020; Available online: https://www.nber.org/system/files/working_papers/w25544/w25544.pdf (accessed on 31 July 2026).
- Chung, M.S.; Lim, H. Transmission of external shocks and regional heterogeneity: Evidence from Korean province-level data. J. Asian Econ. 2024, 94, 101790. [Google Scholar] [CrossRef]
- Quintero Otero, J.D. Impactos regionales y sectoriales de la política monetaria en Colombia. Cuad. Econ. 2019, 38, 259–288. [Google Scholar]
- Blanco, E.; Elosegui, P.; Izaguirre, A.; Montes-Rojas, G. Regional and state heterogeneity of monetary shocks in Argentina. J. Econ. Asymmetries 2019, 20, e00129. [Google Scholar] [CrossRef]
- Triwibowo, S.; Oktaviani, D. Asymmetric impacts of monetary policy shock on output gap: Evidence from regions in Indonesia. Bul. Ekon. Monet. Perbank. 2022, 25, 371–398. [Google Scholar] [CrossRef]
- Aginta, H.; Someya, M. Regional economic structure and heterogeneous effects of monetary policy: Evidence from Indonesian provinces. J. Econ. Struct. 2022, 11, 1. [Google Scholar] [CrossRef]
- Duran, H.E.; Karahasan, B.C. Heterogenous responses to monetary policy regimes: A regional analysis for Turkey, 2009–2019. Reg. Stat. 2022, 12, 56–91. [Google Scholar] [CrossRef]
- Vidal, P.; Ramírez, G.; Sierra, L.P. Un análisis regional de los choques monetarios y externos: El caso del Valle del Cauca en Colombia. Cuad. Econ. 2021, 40, 57–81. [Google Scholar] [CrossRef]
- Bonet-Morón, J.; Pérez-Valbuena, G.J.; Marín-Llanes, L. Oil shocks and subnational public investment: The role of institutions in regional resource curse. Energy Econ. 2020, 92, 105002. [Google Scholar] [CrossRef]
- García-Estevez, J.; Vargas-Prieto, A.; Ariza, J. Mining-energy boom and local institutional capacities: The case of Colombia. Extr. Ind. Soc. 2024, 17, 101387. [Google Scholar] [CrossRef]
- Haddad, E.A.; Bonet-Morón, J.; Pérez-Valbuena, G.J. Impacto Regional de las Regalías en Colombia; Documentos de Trabajo sobre Economía Regional y Urbana No. 309; Banco de la República: Cartagena, Colombia, 2022. [Google Scholar] [CrossRef]
- Bonilla-Mejía, L. Choques externos y remesas internacionales en las regiones de Colombia. Ens. Sobre Política Económica 2017, 35, 189–202. [Google Scholar] [CrossRef]
- Ricciulli-Marín, D.; Bonet-Morón, J.; Pérez-Valbuena, G.; Haddad, E.; Araújo, I.; Perobelli, F. Diferencias Regionales en el Impacto Económico del Aislamiento Preventivo por el COVID-19: Estudio de Caso para Colombia; Banco de la República: Bogotá, Colombia, 2020; Available online: https://www.banrep.gov.co/es/node/53077/printable/print (accessed on 31 July 2026).
- Departamento Administrativo Nacional de Estadística (DANE). Producto Interno Bruto por Departamento; DANE: Bogotá, Colombia, 2025; Available online: https://www.dane.gov.co/index.php/estadisticas-por-tema/cuentas-nacionales/cuentas-nacionales-departamentales (accessed on 31 July 2026).
- Banco de la República; Departamento Administrativo Nacional de Estadística (DANE). Informe de Coyuntura Económica Regional: Departamento del Meta . Banco de la República/DANE: Bogotá, Colombia, 2010. Available online: https://www.cervantesvirtual.com/obra/informe-de-coyuntura-economica-regional--meta-2010-1078014/ (accessed on 31 July 2026).
- Subgerencia de Estudios Económicos, Centro Regional Villavicencio. Boletín Económico Regional: Región Llanos Orientales; Banco de la República: Villavicencio, Colombia, 2006. Available online: https://repositorio.banrep.gov.co/items/b8e30600-00b9-4867-9302-0a60a19a4612 (accessed on 31 July 2026).
- Subgerencia de Estudios Económicos, Centro Regional Villavicencio. Boletín Económico Regional: Región Suroriente; Banco de la República: Villavicencio, Colombia, 2008. Available online: https://www.banrep.gov.co/es/serie-publicaciones/ber (accessed on 31 July 2026).
- Subdirección de Estudios Económicos; Dirección de Impuestos y Aduanas Nacionales (DIAN). Ficha Técnica: Bases Estadísticas de Comercio Exterior; DIAN: Bogotá, Colombia, 2025; Available online: https://www.dian.gov.co/dian/cifras/Paginas/Bases-Estadisticas-de-Comercio-Exterior-Imports-y-Exportaciones.aspx (accessed on 31 July 2026).
- Vidal, P.; Sierra, L.P.; Sanabria, J.; Collazos, J. Indicador Mensual de Actividad Económica (IMAE) para el Valle del Cauca; Banco de la República: Bogotá, Colombia, 2015; Available online: https://www.banrep.gov.co/es/borrador-900 (accessed on 31 July 2026).
- Garay-Rodríguez, S.; Alejandro, P.V.; Cerón-Ordóñez, J. Monitoring the construction sector in Valle del Cauca. Apunt. CENES 2023, 42, 237–271. [Google Scholar] [CrossRef]
- Vidal, P.; Sierra, L.P.; Sanabria, J.; Collazos, J.A. A monthly regional indicator of economic activity: An application for Latin America. Lat. Am. Res. Rev. 2017, 52, 589–605. [Google Scholar] [CrossRef]
- Cleveland, R.B.; Cleveland, W.S.; McRae, J.E.; Terpenning, I. STL: A seasonal-trend decomposition procedure based on loess. J. Off. Stat. 1990, 6, 3–73. [Google Scholar]
- Stock, J.H.; Watson, M.W. A Probability Model of the Coincident Economic Indicator; NBER Working Paper No. 2772; National Bureau of Economic Research: Cambridge, MA, USA, 1988. [Google Scholar] [CrossRef]
- Harvey, A.C. Forecasting, Structural Time Series Models and the Kalman Filter; Cambridge University Press: Cambridge, UK, 1989; ISBN 0-521-32196-4. [Google Scholar]
- Jolliffe, I.T. Principal Component Analysis, 2nd ed.; Springer: New York, NY, USA, 2002; Volume 1. [Google Scholar] [CrossRef]
- Christiano, L.J.; Fitzgerald, T.J. The band pass filter. Int. Econ. Rev. 2003, 44, 435–465. [Google Scholar] [CrossRef]
- Hamilton, J.D. Why you should never use the Hodrick-Prescott filter. Rev. Econ. Stat. 2018, 100, 831–843. [Google Scholar] [CrossRef]
- Pearson, K. L.I.I.I. On lines and planes of closest fit to systems of points in space. Lond. Edinb. Dublin Philos. Mag. J. Sci. 1901, 2, 559–572. [Google Scholar] [CrossRef]
- Jordá, Ò. Estimation and inference of impulse responses by local projections. Am. Econ. Rev. 2005, 95, 161–182. [Google Scholar] [CrossRef]
- Benjamini, Y.; Hochberg, Y. Controlling the false discovery rate: A practical and powerful approach to multiple testing. J. R. Stat. Soc. Ser. B 1995, 57, 289–300. [Google Scholar] [CrossRef]
- Kwiatkowski, D.; Phillips, P.C.B.; Schmidt, P.; Shin, Y. Testing the null hypothesis of stationarity against the alternative of a unit root: How sure are we that economic time series have a unit root? J. Econom. 1992, 54, 159–178. [Google Scholar] [CrossRef]
- Bai, J.; Ng, S. Determining the number of factors in approximate factor models. Econometrica 2002, 70, 191–221. [Google Scholar] [CrossRef]
- Hallin, M.; Liška, R. Determining the number of factors in the general dynamic factor model. J. Am. Stat. Assoc. 2007, 102, 603–617. [Google Scholar] [CrossRef]
- Instituto de Turismo del Meta. Informe de Gestión Turística . Instituto de Turismo del Meta: Villavicencio, Colombia, 2023. Available online: https://www.turismometa.gov.co/transparencia-y-acceso-a-la-informacion/doc_details/1365-informe-de-gestion-ano-2023.html (accessed on 31 July 2026).
- Perobelli Salgueiro, G.; Salgueiro Perobelli, F. Systemic economic impacts of variation in international oil prices: The case of Colombia. Reg. Sci. Policy Pract. 2025, 17, 100178. [Google Scholar] [CrossRef]
- Centro de Investigación y Educación Popular (CINEP). Programa por la Paz. Informe Especial: Luchas Sociales en Colombia 2013. CINEP: Bogotá, Colombia, 2014. Available online: https://s750f5d7ec8274d58.jimcontent.com/download/version/1454468901/module/6193828111/name/CINEP%20informe%20especial%20luchas%20sociales%20en%20colombia%202013.pdf (accessed on 31 July 2026).
- Corte Constitucional de Colombia. Sentencia T-298/17 . Corte Constitucional de Colombia.: Bogotá, Colombia, 2017. Available online: https://www.corteconstitucional.gov.co/relatoria/2017/t-298-17.htm (accessed on 31 July 2026).
- Agencia Nacional de Hidrocarburos (ANH). Estadísticas de Producción de Petróleo; ANH: Bogotá, Colombia, 2025; Available online: https://www.anh.gov.co/es/operaciones-y-regal%C3%ADas/sistemas-integrados-operaciones/estad%C3%ADsticas-de-producci%C3%B3n/ (accessed on 31 July 2026).
- Banco de la República de Colombia. Boletín Económico Regional: Suroriente, IV Trimestre de 2022; Banco de la República: Villavicencio, Colombia, 2023. Available online: https://www.banrep.gov.co/es/publicaciones-investigaciones/boletin-economico-regional/suroriente-4-trimestre-2022 (accessed on 31 July 2026).
- Banco de la República de Colombia. Boletín Económico Regional: Suroriente, IV Trimestre de 2021 . Banco de la República: Bogotá, Colombia, 2022. Available online: https://repositorio.banrep.gov.co/handle/20.500.12134/10279 (accessed on 31 July 2026).
- Alexander, P.; Arneth, A.; Henry, R.; Maire, J.; Rabin, S.; Rounsevell, M.D.A. High Energy and Fertilizer Prices Are More Damaging than Food Export Curtailment from Ukraine and Russia for Food Prices, Health and the Environment. Nat. Food 2023, 4, 84–95. [Google Scholar] [CrossRef]
- León Camargo, A. Choques transitorios y de largo plazo en el producto interno bruto y precios en el departamento del Meta. Econ. CUC 2018, 39, 87–104. [Google Scholar] [CrossRef]
- Carmona Londoño, L.S.; Álvarez Muñoz, D.C. Region as a geographical expression of the Colombian metropolis. Doss. Cent. 2011, 2, 99–110. [Google Scholar]
Figure 1.
Monthly series with the highest load in the ICAEM.
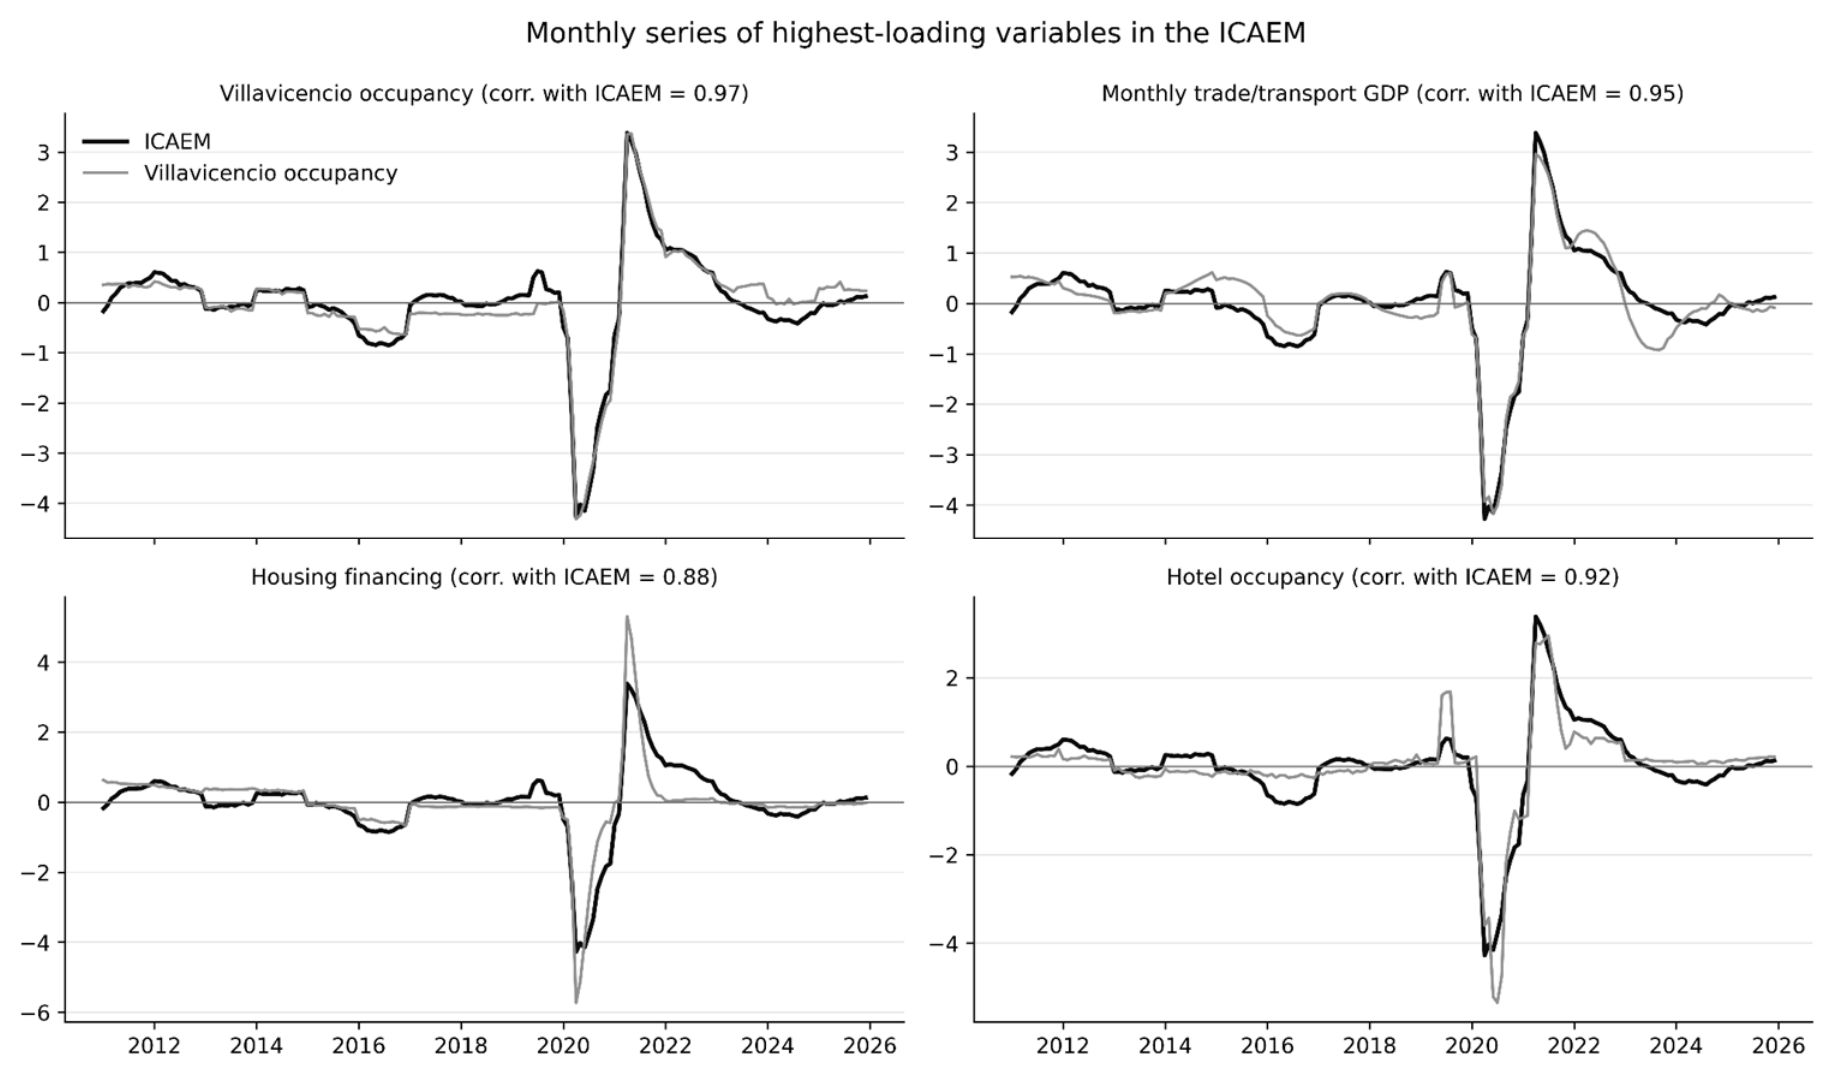
Figure 2.
ICAEM and national ISE in year-on-year growth, unsmoothed monthly series.
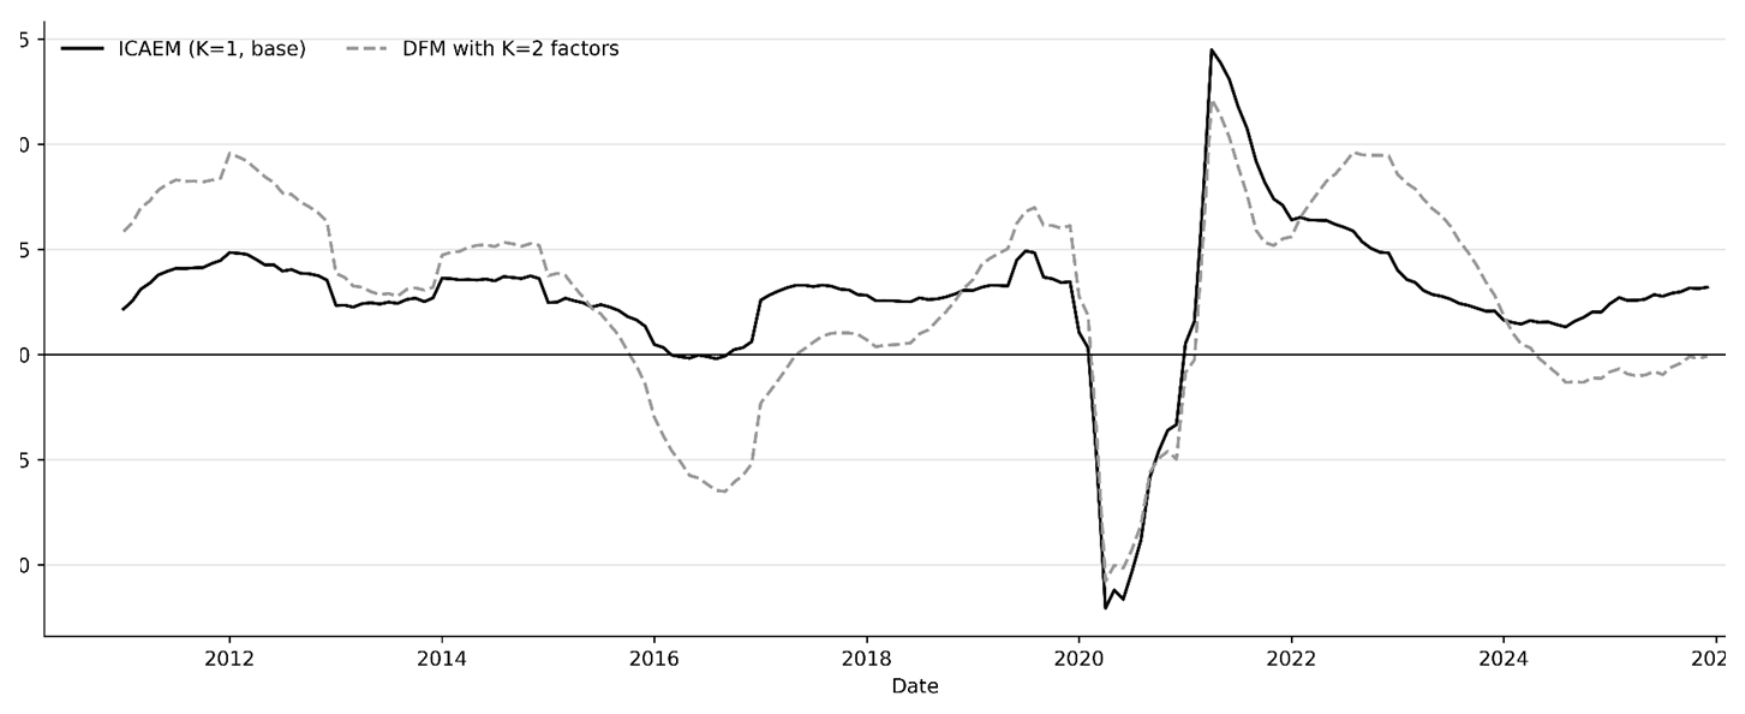
Figure 3.
Monthly phases of the ICAEM production cycle: duration and frequency.
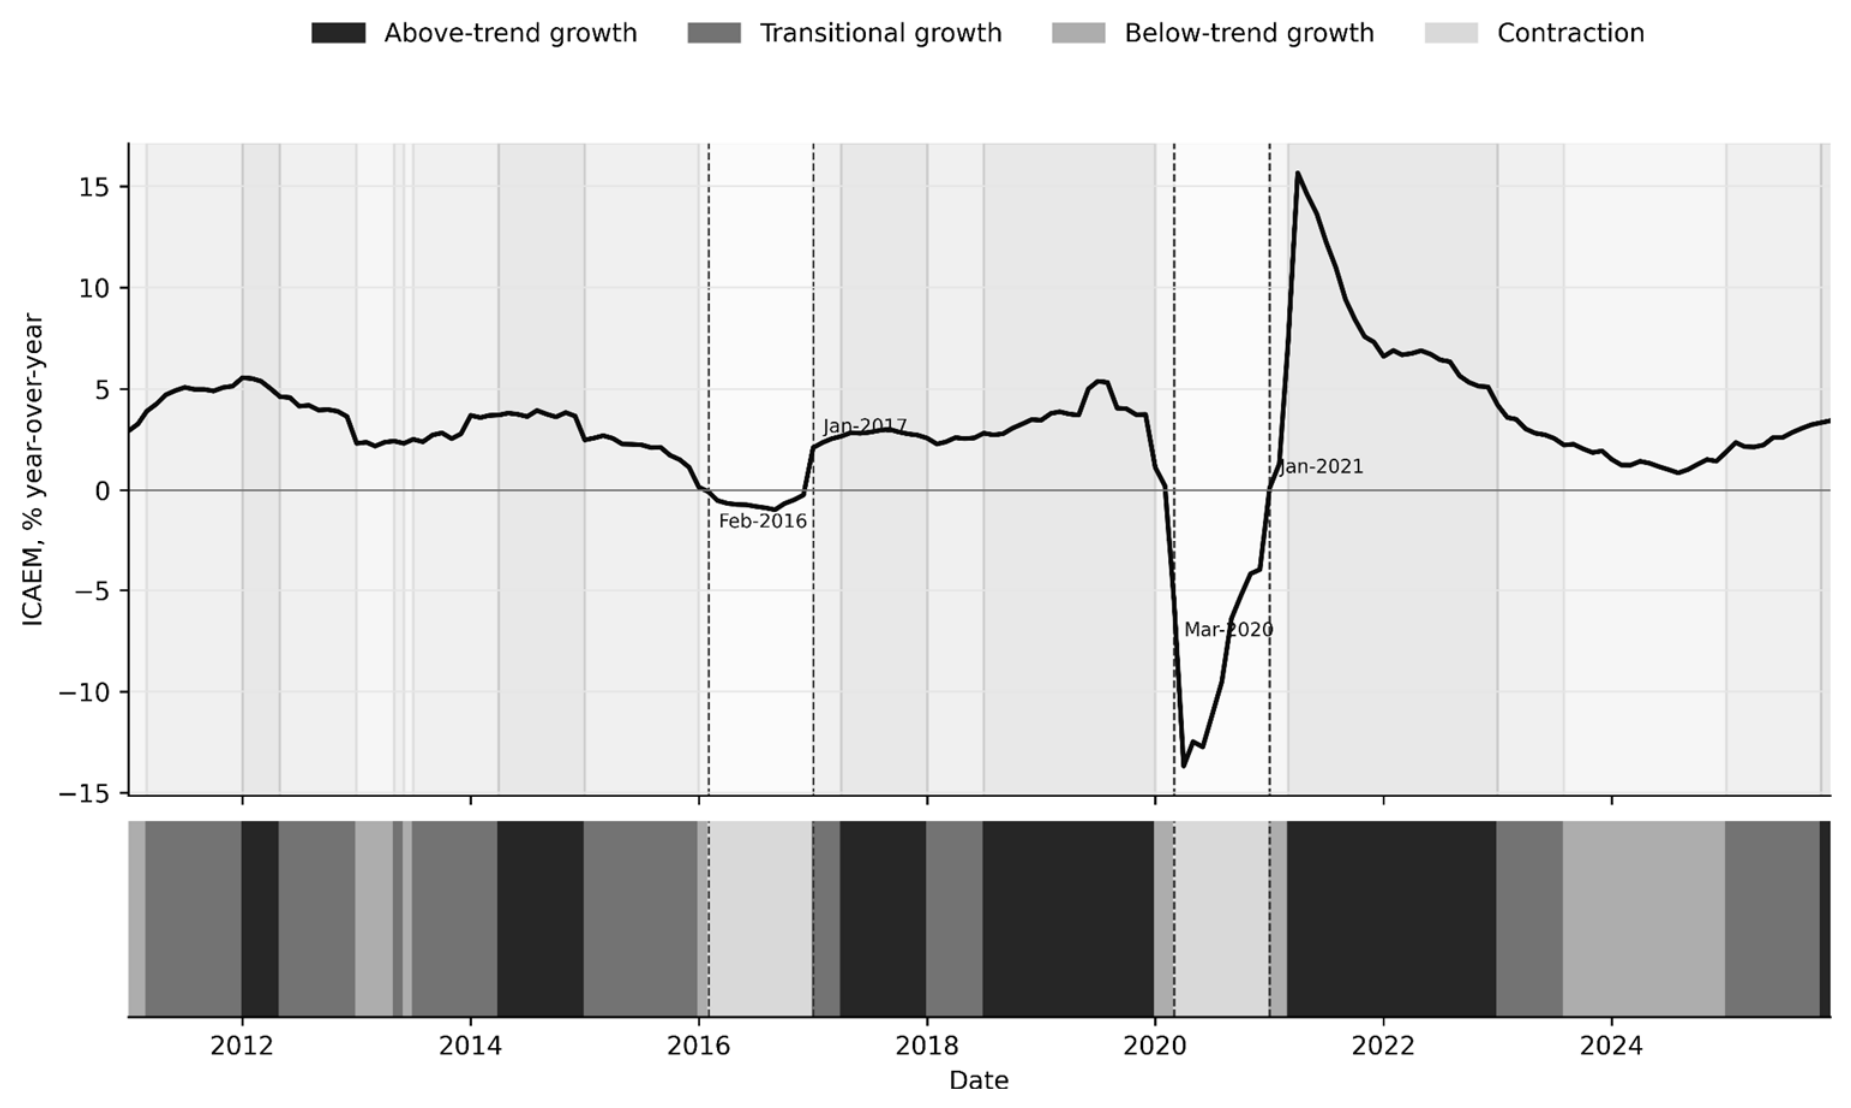
Figure 4.
Monthly trajectory of the producer price shock (PPI), standardized innovation (σ).
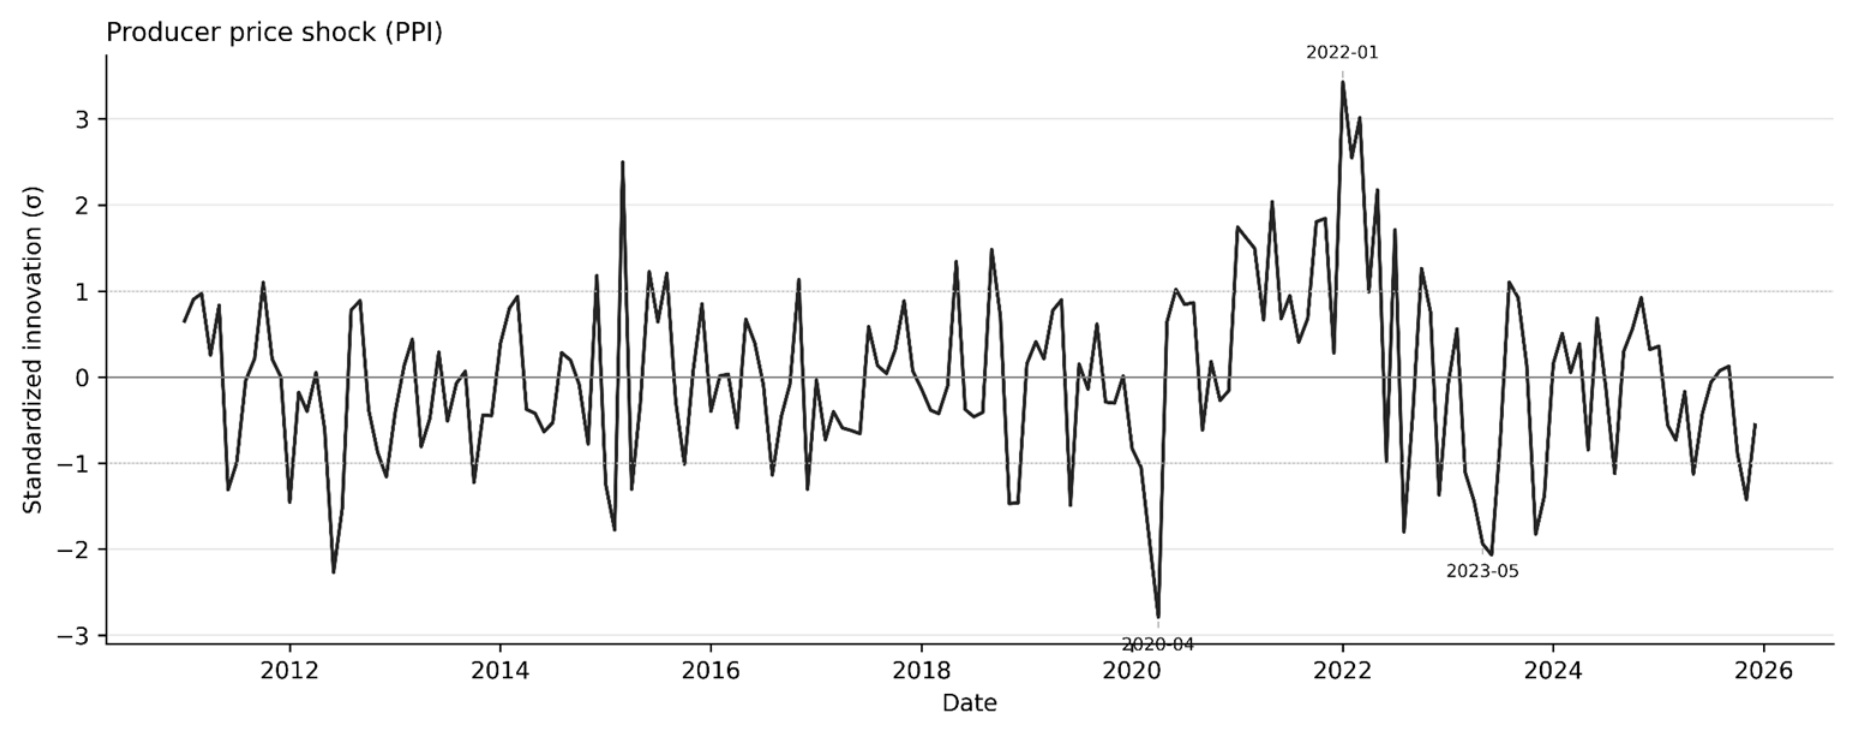
Figure 5.
Monthly trajectory of the oil shock (brent), standardized innovation (σ).
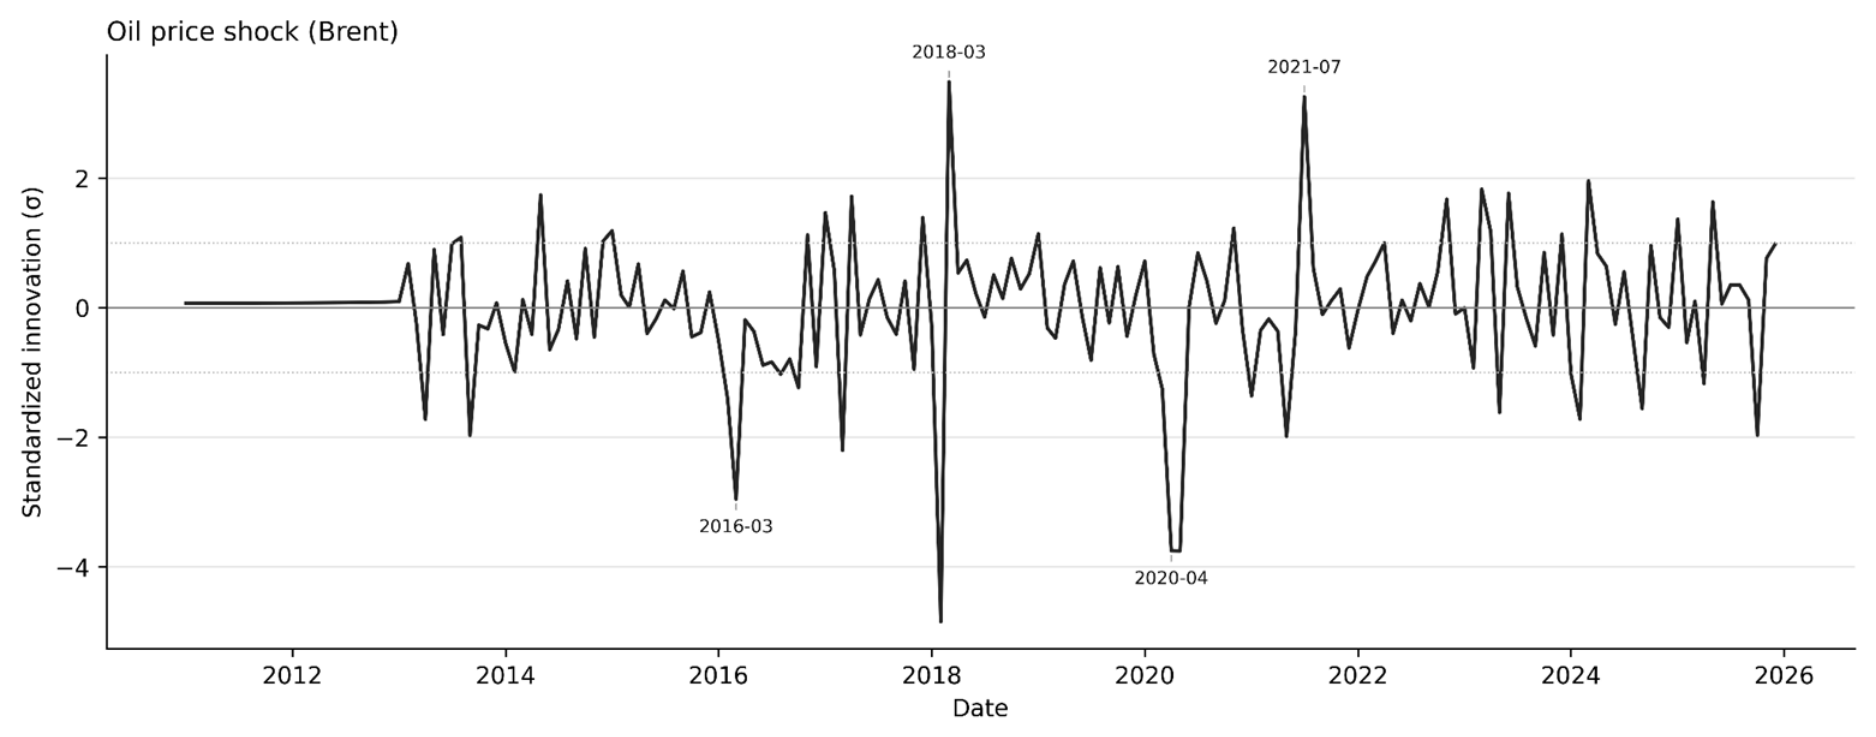
Figure 6.
Monthly trajectory of the exchange rate shock (TRM), standardized innovation (σ).
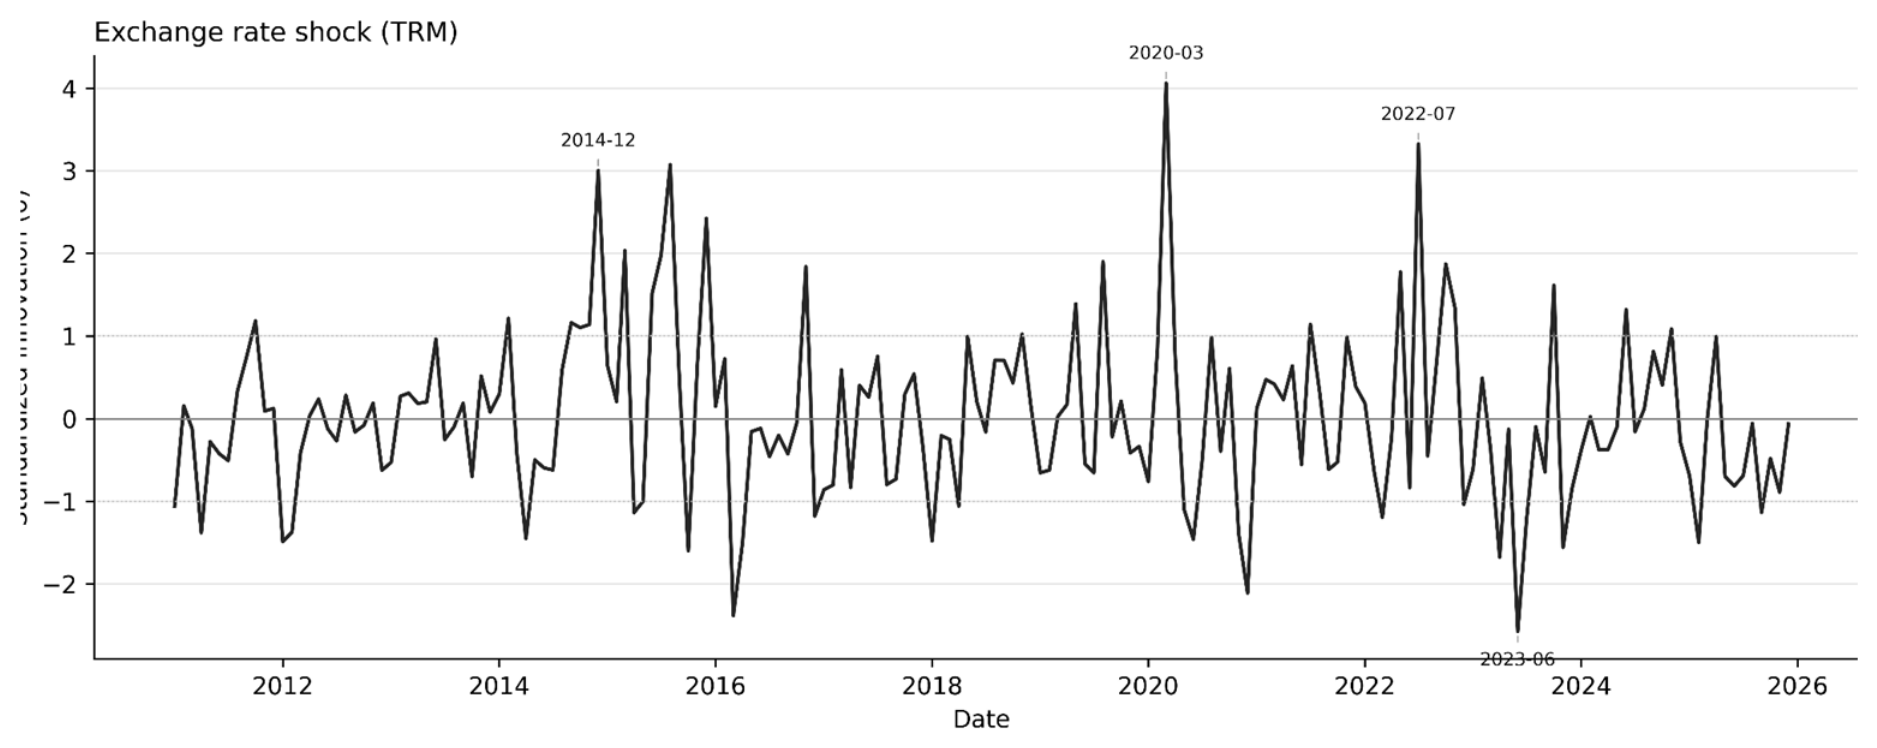
Figure 7.
Monthly trajectory of the interest rate shock, standardized innovation (σ).
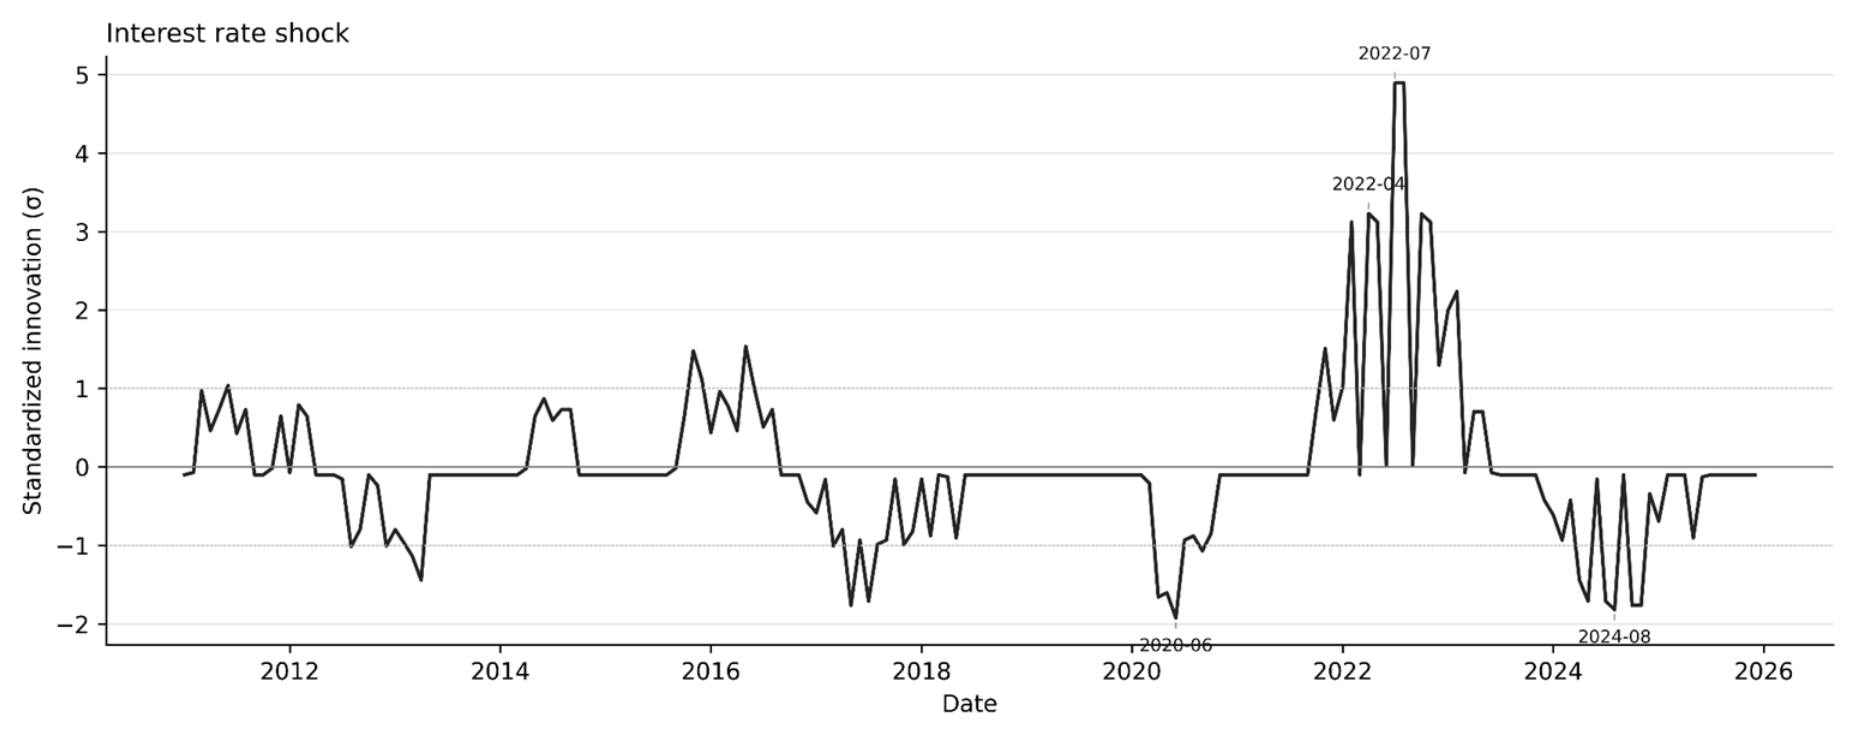
Figure 8.
ICAEM Impulse Response Function in Response to a Shock Equivalent to One Standard Deviation in the PPI (h = 0 to 12 months).
Figure 8.
ICAEM Impulse Response Function in Response to a Shock Equivalent to One Standard Deviation in the PPI (h = 0 to 12 months).
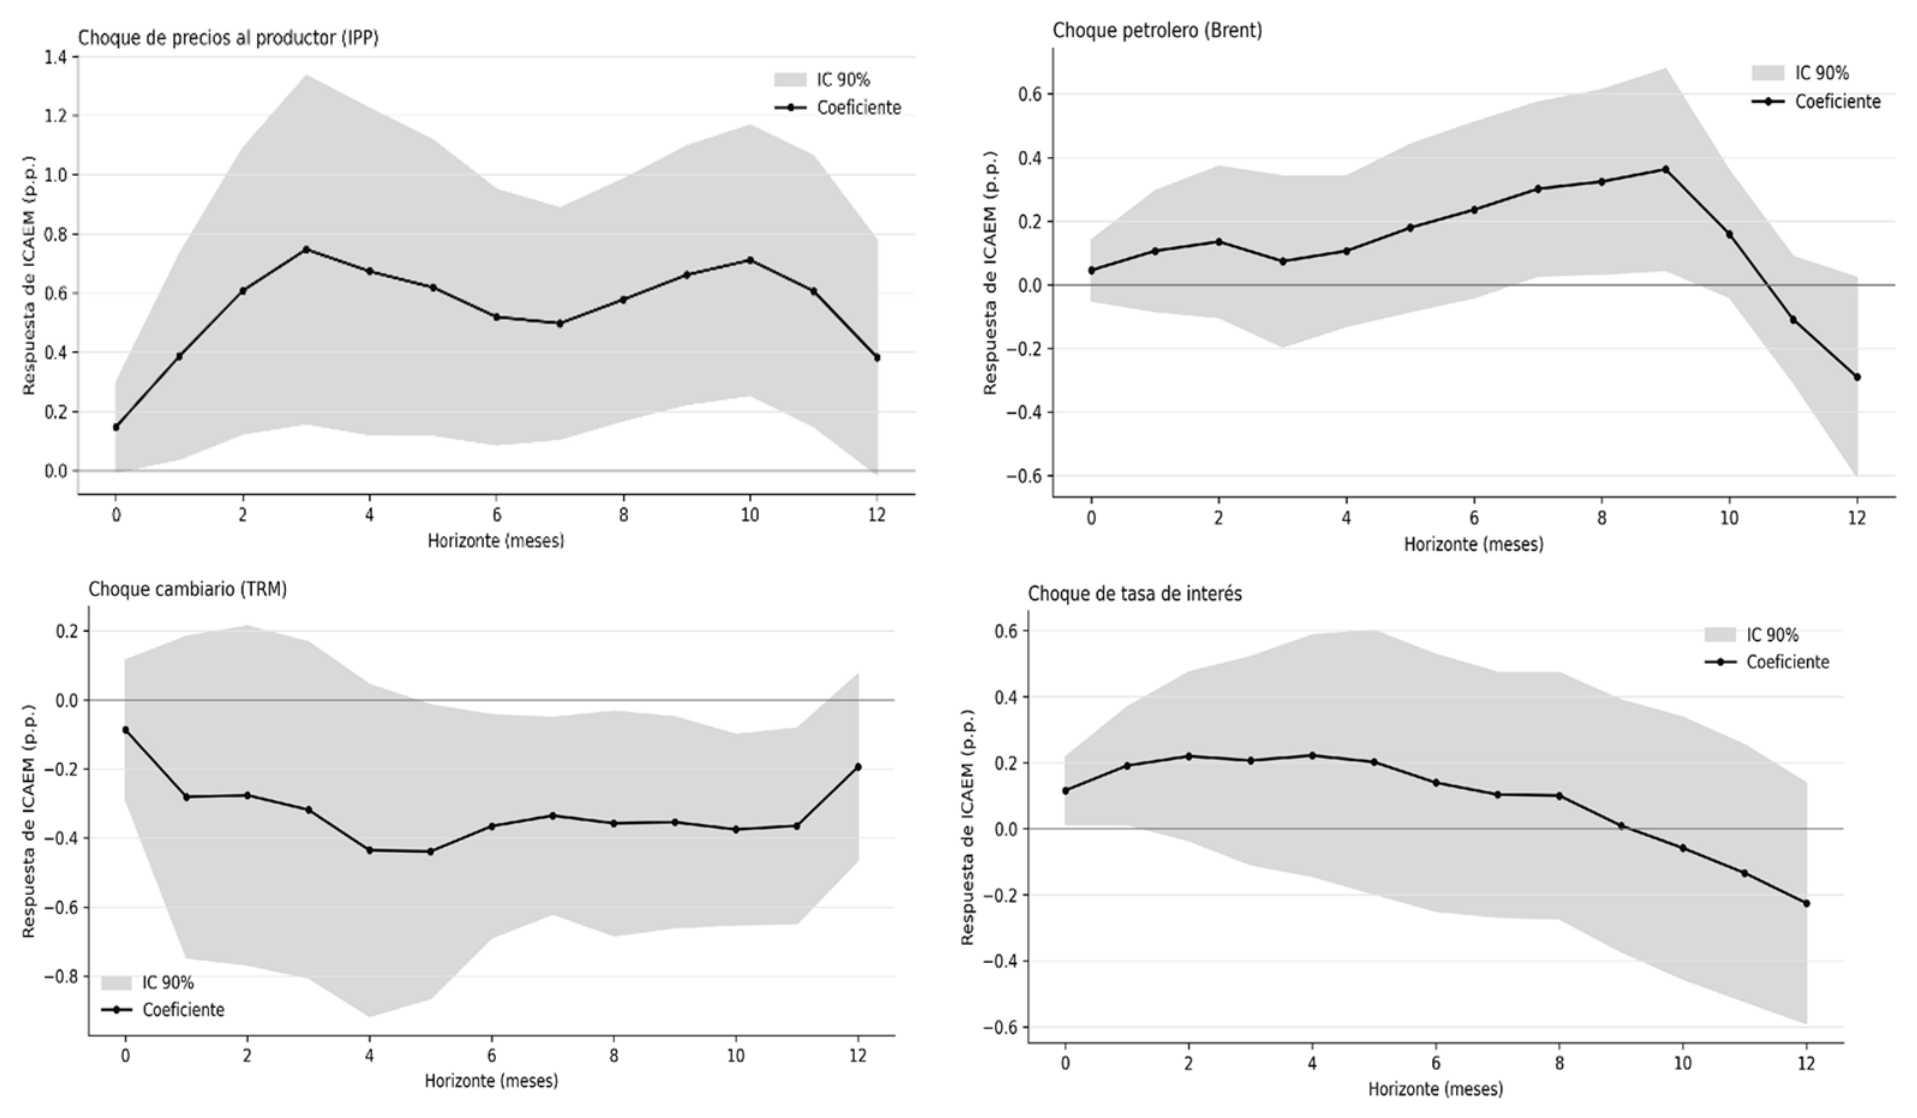
Figure 9.
ICAEM monthly trajectory: base version versus alternative specifications.
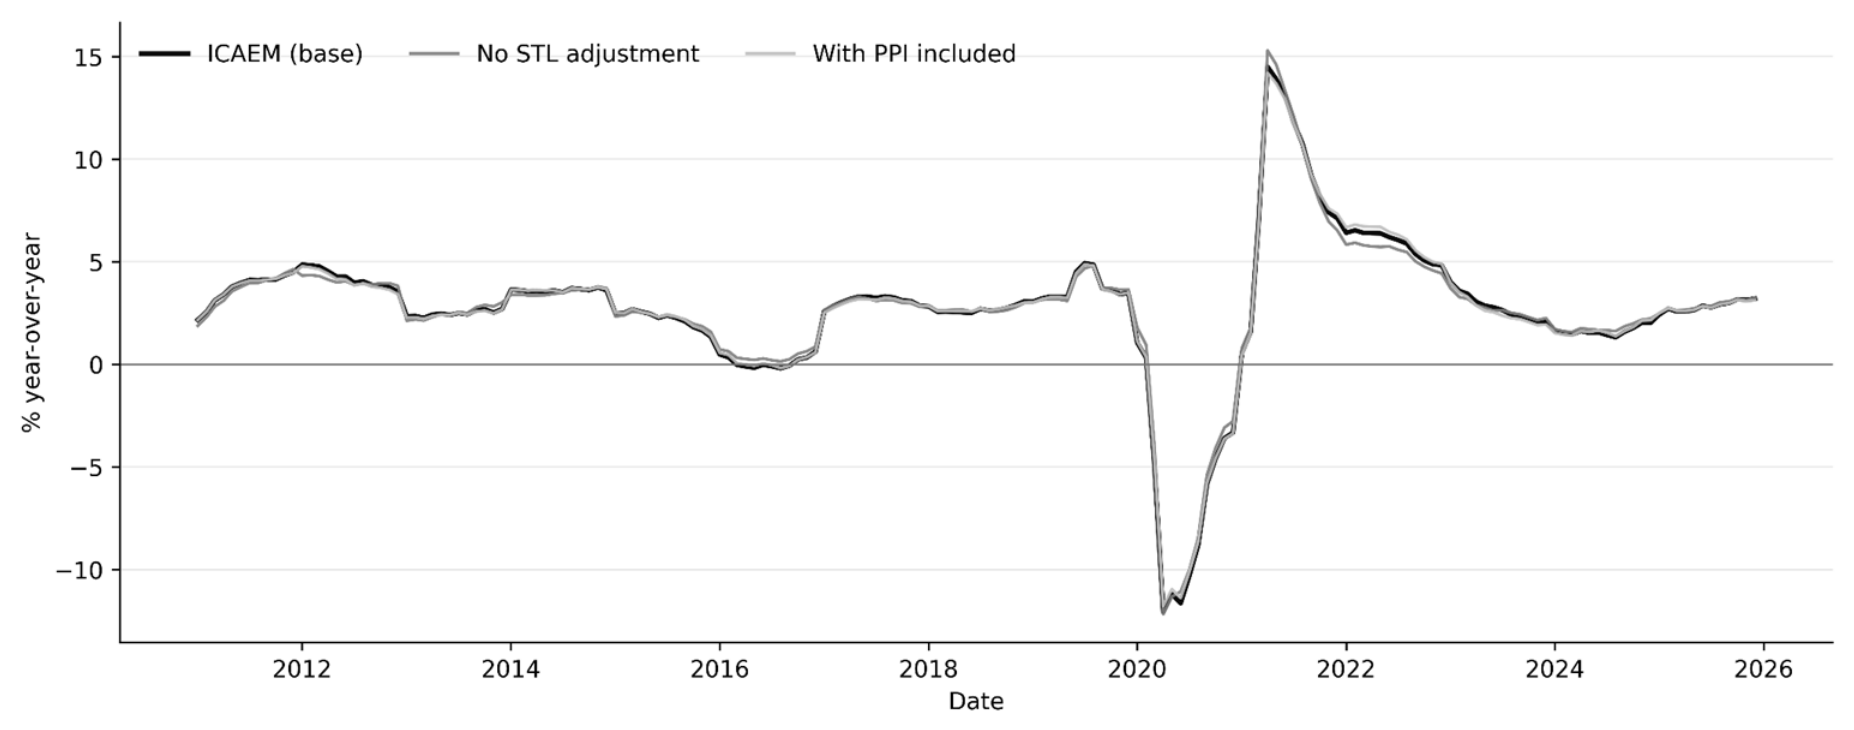
Figure 10.
Absolute monthly gap of the ICAEM compared to the base version, by specification.
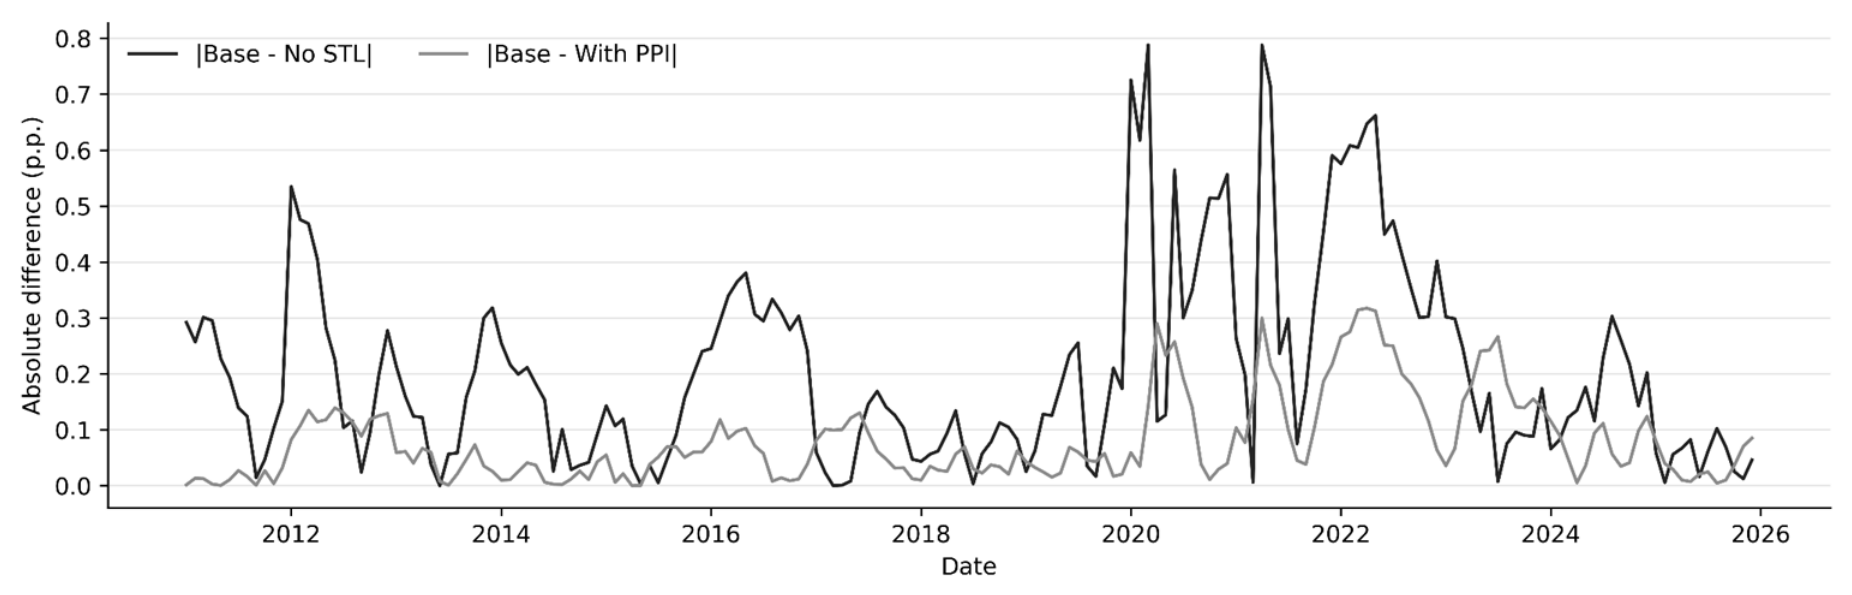
Table 1.
Productive characteristics and sources of income in departments dependent on natural resources, 2010-2024.
Table 1.
Productive characteristics and sources of income in departments dependent on natural resources, 2010-2024.
| Meta | Arauca | Casanare | Cesar | La Guajira | |
|---|---|---|---|---|---|
| GDP: Mining and quarrying | 5.97% | -4.23% | 0.61% | 1.02% | -0.32% |
| GDP: Agriculture, livestock, hunting, forestry and fishing | 5.90% | 3.81% | 6.91% | 1.30% | 1.11% |
| GDP: Trade | 3.24% | 2.48% | 3.05% | 3.43% | 4.09% |
| GDP: Construction | -0.18% | -1.04% | -0.75% | 1.83% | 4.15% |
| GDP: Electricity, water, and gas supply | 3.37% | 1.71% | 4.73% | 2.45% | 2.99% |
| National GDP | 3.36% | 3.36% | 3.36% | 3.36% | 3.36% |
| Total departmental GDP | 4.67% | -0.89% | 2.49% | 2.26% | 1.14% |
| Credit portfolio | 11.87% | 10.74% | 11.51% | 13.21% | 11.66% |
| External openness coefficient | -0.93% | 52.53% | 17.04% | -0,34% | 5.84% |
| Royalties | 8.89% | 9.65% | 8.60% | 8.74% | 10.72% |
| Remittances | 18.22% | 98.47% | 50.58% | 3.00% | 168.22% |
Source: Own elaboration based on DANE (2025), Banco de la República, Financial Superintendency of Colombia and General Royalties System.
Table 2.
Summary table of the series treatment.
| Stage | Procedure |
|---|---|
| Initial selection | 45 |
| Frequency | Monthly and quarterly |
| Transformations | Logarithms, growth rates and indices |
| Seasonal adjustment | STL (Seasonal-Trend decomposition using LOESS) |
| Final selection | 36 series |
| Sensitivity analysis | Inclusion of PPI (37 series) and specification without seasonal adjustment (36 series) |
Table 3.
Diagnosis of collinearity between shocks of the Synthetic Indicator.
| Variable | VIF |
|---|---|
| Producer price shock | 1.164 |
| Oil price shock | 1.010 |
| Interest rate shock | 1.041 |
| Currency shock (TRM) | 1.132 |
| Shock/infrastructure factor | 1.032 |
Table 4.
Variables with the highest loadings on PC1. The complete list of variables included in the base specification, including those with the lowest loadings, is reported in Table A1 of the Appendix.
Table 4.
Variables with the highest loadings on PC1. The complete list of variables included in the base specification, including those with the lowest loadings, is reported in Table A1 of the Appendix.
| Variable Code | Name | PC1 loading |
|---|---|---|
| OCUP_VLL | Occupation of Villavicencio | 0.311 |
| COM | Monthly GDP: trade/transport | 0.298 |
| FIVI | Housing financing | 0.297 |
| OCUP_HOTEL | Hotel occupancy | 0.288 |
| IMPO | Imports | 0.274 |
| MAT_VEH | Vehicle license plates | 0.268 |
| SAC_GAN | Cattle slaughter | 0.262 |
| PAS_AER | Air passengers | 0.239 |
| DEM_EE | Electric energy demand | 0.232 |
| ING_TRIB | Tax revenue | 0.201 |
| ADMP | Monthly GDP: public administration | 0.199 |
| ING_CORR | Current revenue | 0.187 |
| IM | Monthly manufacturing GDP | 0.160 |
| ELIC | Área and number Licensed | 0.150 |
| FIN | Monthly financial services GDP | 0.138 |
Table 5.
Summary table of the series that made up the study indicator.
| Variable | Economic activity |
|---|---|
| Occupation of Villavicencio | Labour market |
| Commerce | Domestic demand and consumption |
| Housing financing | Construction and credit |
| Hotel occupancy | Tourism and services |
| Imports | External openness |
| Vehicle license plates | Consumption and investment |
| Cattle slaughter | Agriculture/livestock |
| Electric energy demand | General activity of the economy |
Disclaimer/Publisher’s Note: The statements, opinions and data contained in all publications are solely those of the individual author(s) and contributor(s) and not of MDPI and/or the editor(s). MDPI and/or the editor(s) disclaim responsibility for any injury to people or property resulting from any ideas, methods, instructions or products referred to in the content. |
© 2026 by the authors. Licensee MDPI, Basel, Switzerland. This article is an open access article distributed under the terms and conditions of the Creative Commons Attribution (CC BY) license (http://creativecommons.org/licenses/by/4.0/).
Copyright: This open access article is published under a Creative Commons CC BY 4.0 license, which permit the free download, distribution, and reuse, provided that the author and preprint are cited in any reuse.