
Submitted:
04 September 2026
Posted:
04 September 2026
You are already at the latest version
Abstract
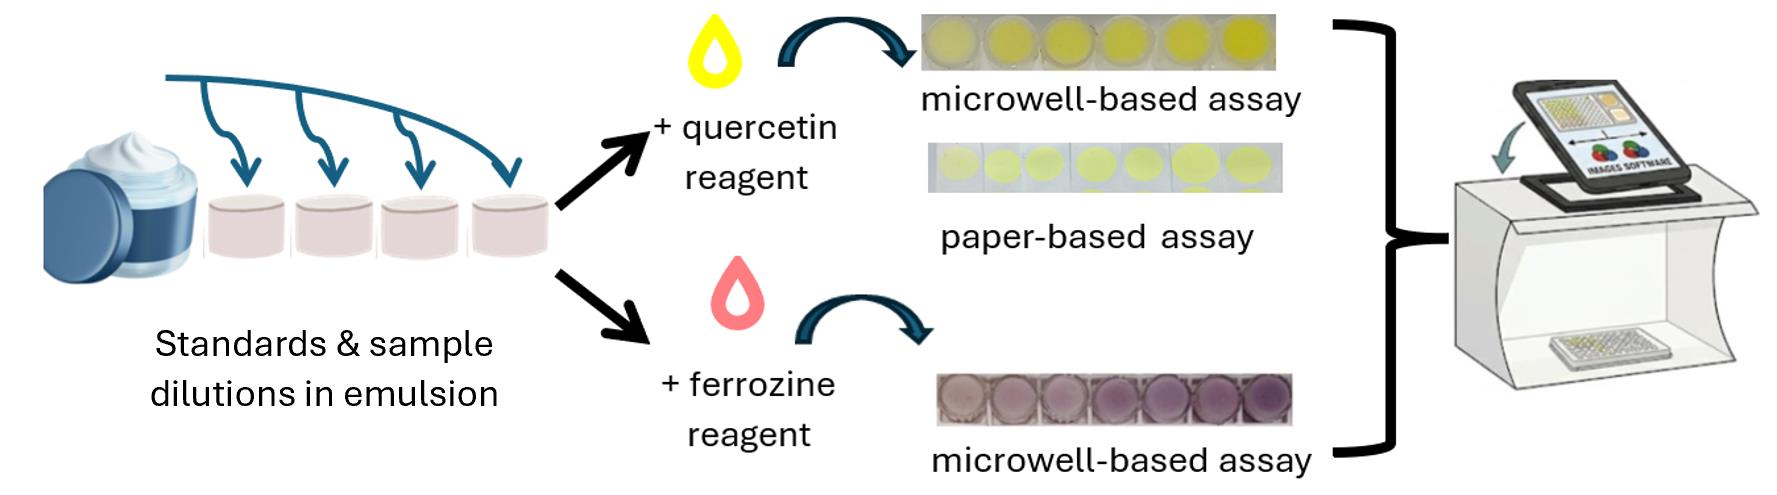
This quantification methodology eliminates the need for complex and time-consuming pretreatments, like digestion or extraction, by leveraging digital-image colorimetry. It relies on a chromogenic complexation reaction within the emulsion, between the target metal and a suitable reagent: quercetin for aluminum and ferrozine for iron. For aluminum, the method demonstrated linearity with R² ≥ 0.971, acceptable accuracy (relative bias ≤ ±8.5 %) and intermediate precision (CV ≤ 9.4 %) upon Quality Controls (above the LLOQ) analysis and was successfully applied to commercial antiperspirants with satisfactory accuracy (relative bias ≤ ± 15.2 %). The assay was also adapted to a paper-based format. For iron, the method showed a linear correlation (R² ≥ 0.981) acceptable accuracy (relative bias ≤ ± 13.7 %) and intermediate precision (CV ≤ 12.6 %) upon Quality Controls analysis; it was further validated against X-ray fluorescence, revealing a consistent small positive bias of 14%. Investigations showed that both assays are susceptible to interference from common chelators and certain metals. We have demonstrated that the effect of such common interferences in commercially relevant concentration was, however, minimal (relative bias of ≤ ± 15.2 for Al and ≤ ± 4.5 for Fe), when the matrix of samples and standards was matched (e.g. upon sample dilution). For routine industrial quality control of emulsions, the proposed method is a cost-effective and greener alternative that, although mostly inferior in terms of technical characteristics when compared to instrumental analysis methods, is sufficiently accurate, precise and selective under the defined conditions.
Keywords:
digital image colorimetry
; cosmetics analysis
; antiperspirants
; X-Ray fluorescence
; extraction-free emulsion analysis
; quercetin
; ferrozine
1. Introduction
In previous works, the use of digital-image colorimetry to quantify various organic analytes or antioxidant capacity directly in emulsions, using both microwell and paper-based formats was described [1,2,3]. We herein describe the application of this same setup for metal analysis, specifically illustrated by aluminum and iron.
Aluminum salts are widely utilized in the cosmetic industry, serving primarily as active ingredients in antiperspirant formulations [4,5] but also as abrasives or agents against gum bleeding in toothpastes. Despite their long-standing, widespread use, concerns regarding potential toxicity persist. They are suspected of acting as genotoxic agents, increasing the risk of developing breast cancer and interfering with the normal functioning of estrogen receptors in breast cancer cells, potentially influencing cancer growth [6,7,8,9]. A link to Alzheimer’s disease due to the cumulative systemic accumulation has also been proposed [10]. However, these toxicological claims remain a subject of debate [7,11]. Regulatory agencies such as the German Federal Institute for Risk Assessment (BfR) state that current studies have not established a conclusive causal link between antiperspirant use and disease development [12].
Aluminum salts, like aluminum chlorohydrate (ACH), exert their antiperspirant effect by forming insoluble, high-molecular-weight polymeric complexes that mechanically obstruct the eccrine sweat glands’ excretory pathways [4,5]. Due to their size, these complexes have limited ability to penetrate the stratum corneum, resulting in minimal systemic absorption via the dermal route. [13,14] According to the 2023 SCCS opinion, systemic exposure to aluminum from daily cosmetic use is not significant [15]. Nevertheless, the SCCS recommends maximum concentrations of 6.25% elemental aluminum in non-spray deodorants and 10.60% elemental aluminum in sprays [15].
Due to its potential toxicity and regulated limits, the analysis of aluminum content in cosmetics is important for ensuring product safety and regulatory compliance. With few notable exceptions relying on electrochemical methods or on paper-based colorimetry [16,17,18] several analytical methods for quantifying aluminum, primarily chromatographic (HPLC) and spectroscopic (AAS and ICP-OES) techniques, necessitate substantial sample pretreatment, which may introduce errors and challenges in achieving consistent analyte recovery [19,20,21,22,23]. Although the latter methods offer high sensitivity and selectivity, they also require expensive equipment and trained personnel.
Iron oxides are widely employed in cosmetics as pigments and photoprotective ingredients [24,25,26]. These are considered safe for cosmetic use when they meet specific purity requirements [27]. Soluble or weakly bound, redox-active iron in emulsions may act as pro-oxidant, however, contributing to product instability, the development of rancid off-odors and the generation of potentially harmful secondary oxidation products [28,29]. To ensure emulsion oxidative stability, monitoring this labile iron form is far more critical than measuring total iron. Total iron is commonly determined using AAS, ICP-OES or XRF [30,31,32,33,34,35,36,37]. AAS and ICP-OES provide sensitive total-element measurements following digestion, whereas XRF requires comparatively little chemical preparation and is non-destructive. Nevertheless, these techniques involve specialized instrumentation; XRF may also exhibit matrix effects and comparatively high quantification limits in low-iron samples. Ferrozine colorimetry is a sensitive and inexpensive alternative for soluble or reducible iron although its response can be affected by chelating agents [38,39].
We propose and validate herein adapted analytical methodologies based on digital-image colorimetry performed directly in oil-in-water emulsions, for the direct quantification of aluminum and labile (ascorbate-reducible, ferrozine reactive) iron. This approach is advantageous in that it eliminates complex pretreatment, expensive instrumentation and the need for specialized expertise, by relying on metal complexation with suitable chromogenic reagents directly within the emulsion. The limitations of the approach include lower analytical performance than established instrumental techniques, sensitivity to matrix composition, and the need for substantial dilution or matrix-matched calibration.
2. Materials and Methods
2.1. Materials and Stock Solutions
Aluminum chlorohydrate (ACH) was supplied as a 50% w/w aqueous solution (Chlorohydrol) by Elementis Specialties. According to the specifications of the manufacturer, it contained 12.2 to 12.7 % w/w aluminum. In this manuscript, all ACH percentages are expressed on a dry-active ACH basis - the aluminum conversion factor used was 24.8 % w/w Al in dry ACH. An O/W base cream, referred to as emulsion "BC" throughout the article, was used as the matrix for all standards and dilutions. Its composition was as follows: Aqua 81.7 % w/w, Paraffinum Liquidum 10 % w/w, Cetearyl Alcohol 4.0 % w/w, Glyceryl Stearate (and) PEG-100 Stearate 3.0 % w/w, Phenoxyethanol 1.0 % w/w, Xanthan Gum 0.2 % w/w, Ethylhexylglycerin 0.1 % w/w. For all BC preparations, the viscosity was measured to be in the range of 270,000-400,000 mPa·s, while the pH was in the range 4.8 to 5.7 and density was 1.0 g/mL.Commercial products analysed were commercial formulations manufactured in-house under contract, to ensure accurate nominal metal concentration. Quercetin 95% (UV)/98% (HPLC), was a Sophora Japonica Extract from Kingherbs Limited. A quercetin stock of 3.33 mg/mL in ethanol was used in all tests performed inside the detachable wells of a microtiter plate, while a stock of 6.66 mg/mL in ethanol was used in the tests on filter paper. An iron/ferrozine kit from Biosis (Athens, Greece) was utilized for iron quantification; this kit included Reagent R1 (an ascorbic acid solution at pH 5) and Reagent R2 (a ferrozine solution). The reagent reduces accessible Fe(III) and detects Fe(II) that becomes available under the assay conditions. ACS grade iron(III) chloride hexahydrate from Merck was used for the preparation of iron standards in emulsions, by suitable dilutions of a mother aqueous solution of 247 mg/mL iron(III) chloride hexahydrate.
The organic interferents tested were the following: Potassium sorbate >99% was from Nantong Acetic Acid Chemical Co. Ltd., while sodium gluconate >99% was from Jungbunzlauer. Sodium benzoate >99% was from Lanxess Chemical B.V., citric acid monohydrate >99.5% was from Laiwu Taihe Biochemistry Co., Ltd. Ethylenediaminetetraacetic acid disodium salt dihydrate (sodium EDTA dihydrate) ≥ 99.0 % was from Shijiazhuang Jackchem Co., Ltd., while PURAC® lactic acid 80 % was from Corbion, and acetic acid ≥ 99.8 % was from VWR. Stocks of the above potential interferents were prepared in water (at 12.5, 8.3, 8.7, 13.5, 8.6, 3.3. and 3.3 % w/v, respectively). A mixture of fatty acids with the commercial name Palmera B1802 (51.0% hexadecenoic acid, 47.6% octadecanoic acid, 0.8% eicosanoic acid, 0.2% dodecanoic acid and 0.4% tetradecanoic acid) was obtained from KLK OLEO and was dissolved in ethanol (at 6.55 % w/v). Moreover in the Fe assay the following interferents were additionally tested: Magnesium sulfate heptahydrate (Honeywell,≥99.5%), potassium chloride (Carlo Erba, Ph.Eur.) sodium chloride (Kalamarakis-Kalas S.A., >99,4%), sodium sulfate (Lenzing AG, 99.8 %), zinc sulfate heptahydrate (Merck, ≥99%), calcium chloride dihydrate (Solvay Chemicals, ≥99%), magnesium carbonate (J. T. Baker, Ph Eur) zinc chloride (Merck, >98%). ACS grade cobalt(II) nitrate hexahydrate from Merck and ACS grade copper(II) sulfate pentahydrate from Sigma. Their stocks were prepared in water at the following concentrations, respectively: 12.0, 5.9, 4.7, 5.6, 13.7, 10.9, 0.15, 4.5, 0.1, 0.5 % w/v.
2.2. Instrumentation and Equipment
Sample images during the aluminum quantification experiments were captured using an iPhone 6s camera. In the iron quantification experiment, a Samsung Galaxy S21 FE was used. Photographs were taken inside a white photographic box (cube of an edge of 23 cm from Shenzhen PULUZ Technology Limited, China) equipped with an opening at the top and two LED light strips positioned along opposite edges. Emulsions were prepared using a Silverson L5M-A homogenizer. When diluting creams with BC, mixing was performed either manually or with a conventional small-scale mixer. pH measurements were conducted using an Inolab pH Level 1 precision meter equipped with a WTW SenTix 41 electrode, calibrated with standard pH solutions (Weilheim, Germany). A Brookfield DV-E viscometer with an S94 Helipath T-bar spindle was employed to determine emulsion viscosity at 20 ◦C and 0.6 rpm shear rate.
2.3. Assay in Microwells
2.3.1. Determination of Aluminum Upon Complexation with Quercetin
Standards or Quality Controls (QCs) with varying concentrations of ACH were prepared by diluting a 4.4% w/w stock in BC, using BC as diluent. Deionized water was added (achieving a 1.35-fold dilution of the emulsion) to ensure homogeneous ACH incorporation; the use of a mixer significantly improved homogenization and overall assay performance. Unknown samples were prepared by appropriately diluting commercial products using BC as diluent. Subsequently, 1 g of each standard, QC or diluted unknown sample was weighed into vials, to which 240 μL of a 3.33 mg/mL quercetin solution in ethanol and 100 μL of deionized water were added to facilitate mixing. After thorough blending, the samples were transferred into the detachable wells of a microtiter plate. Any excess sample protruding from the wells was removed with a plastic spatula to ensure a level surface.
2.3.2. Determination of Iron Upon Complexation with Ferrozine
To establish the linear correlation between color intensity and ferrozine-reactive iron concentration, a series of twelve standards were prepared in BC with concentrations ranging from 0 to 8 μg Fe/g emulsion (Fe representing the sum of ferrozine-reactive ferrous and ferric iron). QCs, prepared in BC, were appropriately diluted, if required, using BC as diluent. Subsequently, 1 g of each standard or QC was weighed into a vial. A 200 μl volume of a R1/R2 mixture (comprising 1 part R1 and 2 parts R2), was added, followed by thorough mixing with a plastic spatula. A portion of the resulting cream was used to fill a detachable well. The surfaces were leveled with a spatula, and the detachable well strips were arranged in the microtiter plate frame for photo capturing.
2.4. Aluminum Assay on Filter Paper
12 μL of a quercetin stock solution (6.66 mg/mL in ethanol) was applied in duplicate on filter paper strips; a thin layer of emulsion was then applied on the quercetin spots and was pressed firmly using a cover glass to spread the emulsion into a thin, even layer. Excess emulsion around the spots was cleared using the cover glass. This process has been described in detail elsewhere [2,3]. Photo capturing of the colored spots followed, to quantify aluminum, as below.
2.5. Photo Capture, Image Analysis, and Data Processing
For photo capturing, the mobile phone was placed over the opening at the top of the white photographic box, at a distance of 23 cm from its base. The default settings of each camera were used upon photo capturing. The samples, whether inside the detachable wells or on the filter paper, were placed flat inside the box, in a straight line and parallel to the LED light source, and never directly under the lights.
For aluminum quantification, a photo was taken immediately after the addition of the chromogenic reagent (quercetin) and every 5 min thereafter, for a total of 10 min. Any time point within this window provided satisfactory results. For iron determination by complexation with ferrozine the optimal capture time was extended to 30-60 min to account for the slower reaction rate of the ferrozine complexation.
Digital images were processed using ImageJ software [40] via RGB analysis, selecting a homogeneous and uniform area in the center of the well or spot of approximately 400–600 square pixels. The resulting RGB values were recorded in Excel, where calibration curves were constructed by plotting color intensity as a function of analyte concentration. These calibration equations were then used to quantify the analyte content in unknown samples. Regarding the optimal color channel: the blue channel was most commonly used for aluminum determination, though green or average components were also employed. For iron determination, the red channel was found to be optimal, while blue and average components frequently also provided satisfactory linearity. It should be highlighted that a new calibration is required whenever the imaging device or acquisition settings change; in practice this means it is essential that each picture of the unknown sample wells (or spots for the paper-based assay) includes the corresponding standard wells (or spots), placed side-by-side within the cube.
2.6. Method Validation
Method performance was evaluated according to the general principles of analytical procedure validation and fitness for intended purpose described in ICH Q2(R2) [41]. Acceptance criteria of ± 15% for accuracy and ≤ 15% for intermediate precision, relaxed to ± 20 %/≤ 20 % at the LLOQ, were adopted as fit-for-purpose criteria
To establish a quantifiable relationship (standard curve) between the concentration of the metals in the standards and the measured signal intensity, linear regression using Microsoft Excel was performed on the concentration-response data. For building each standard curve, at least 5 standards in BC were analysed. Intermediate precision was evaluated using independent analytical determinations of QC samples performed in separate analytical runs on different days and was expressed as CV (%) = 100 × SD/mean, where SD is standard deviation. Each determination comprised a separate aliquot subjected independently to reagent addition, mixing, well filling, image acquisition, and image analysis. The reported n represents the total number of independent determinations at each QC concentration. Calibration-model performance was assessed from the relative bias of back-calculated standard concentrations. Accuracy was evaluated using independently prepared fortified QC and recovery samples and expressed as relative bias (%), where relative bias %= 100 × (mean measured concentration – nominal concentration)/nominal concentration. (1). Agreement with an established analytical method, XRF, was, furthermore, evaluated separately by regression analysis. To determine the sensitivity of the assay, theoretical Limits of Detection (LOD) and Quantification (LOQ) were initially calculated based on the standard deviation of the y intercept and the slope of the linear regression curve, using the Regression function of Microsoft Excel, as: LOD= 3.3 x standard deviation of the y-intercept/slope and LOQ= 10 x standard deviation of the y-intercept/slope. Multiple independent calibration curves were employed in the calculation. In contrast, the experimental Lower Limit of Quantification (LLOQ) was defined as the lowest concentration spiked into the emulsion matrix that empirically satisfied the criteria for accuracy (bias ≤ ± 20 %) and intermediate precision (CV≤ 20 %) across multiple analytical runs on different days. The LLOQ value was used to define the lower end of the working range of the assay.
2.7. XRF Analysis
Cream samples for EDXRF analysis were prepared by applying a thin layer of the formulation over a stretched membrane (Prolene®) on XRF sample caps. Approximately 200 mg of cream was applied to the membrane surface using a plastic spatula and spread evenly to create a uniform, flat layer. Each sample was prepared in triplicate for every metal concentration and allowed to dry at room temperature for 48–72 hours. The resulting dry sample mass was approximately 60–65 mg, which corresponds to a surface density<13 mg/cm2. These were consequently treated as “thin targets” in XRF analysis. [30] Finally, the samples were irradiated using a portable EDXRF system (Amptek’s Experimenter’s XRF Kit), consisting of an X-123 complete spectrometer with a Si-PIN detector (25 mm2, resolution 0.160 keV at 5.9 keV (Mn Kα)) and a Mini-X USB-controlled X-ray tube (50 kV/100 μA) with a silver (Ag) anode. A fixed 45° XRF geometry was employed, with a 1 cm distance between the sample and the experimental setup. A 2 mm collimator and a 25 μm Al filter (in the X-ray tube window) were used. Measurement conditions were set at 40 kV and 20 μA, with acquisition times ranging from 1000 to 1500 s. The adopted yield for each concentration was determined by averaging the yields from the three analytical replicates. The combined standard uncertainty of the measurements was in the order of 8%–10% [42]. Finally, SPECTRW software was used for the spectral analysis [43].
3. Results and Discussion
3.1. Aluminum Determination via Complexation with Quercetin
3.1.1. Preliminary Studies
Initially, we conducted the assay in the detachable wells format, directly in the emulsion, taking advantage of the complexation of aluminum ions (coming from aluminum chlorohydrate (ACH)) with quercetin. While published protocols employing this complexation exist, including for cosmetics analysis [21,44], their in situ application is hampered by the need for complex pre-treatment [21] or sophisticated instrumentation [44]. Our proposed streamlined approach demonstrated a linear correlation between the concentration of ACH (and thus aluminum) in the emulsion standards and the reflected-light RGB intensity from the photographed samples (Figure 1). This linearity was confirmed across at least 9 replicate curves prepared on different days, yielding R2≥ 0.971. For all standards employed in all replicate calibration curves within the validation experiments, the standard concentration was back-calculated within ±17.6% of their nominal concentration (± 18.9% at the LOQ). The linear range extended from 0 up to 0.079% w/w ACH (corresponding to 0-196 μg Al/g of emulsion), suggesting the potential for quantifying aluminum directly within emulsions. These values are much lower than the maximum permissible limits for aluminum (6.25% w/w for non-sprays and 10.60% w/w for sprays) [15]. The practical significance of this is that any commercial emulsion must be significantly diluted in a suitable cream matrix for analysis. This dilution effectively shifts the quantitative determination into the diluent’s matrix, thereby minimising any potential interferences from the original emulsion matrix.
We consistently maintained an aluminum/quercetin ratio above 0.5 to ensure the formation of a 2:1 aluminum-quercetin complex, as established by prior solution studies [45]. This complex offers two key advantages for the assay: greater absorptivity in the visible region and a red-shifted absorbance maximum [45]. We recommend a final quercetin concentration within the 0.6–1.5 mg/mL range. Exceeding this concentration range limits the width of the linear range. Furthermore, the diluent’s pH, should be maintained between 5.1 and 5.5 at 25 ∘C. Aluminum has poor solubility at pH values higher than 5.5, with solubility becoming much more limited around pH 6.0 [46]. Indeed, at a pH of 5.9, we observed a limitation of linearity to a shorter span of concentrations, which we presume is due to a lack of aluminum solubility at these higher concentrations.
3.1.2. Interferences
The proposed assay for aluminum quantification in emulsion matrices relies on the complexation of aluminum with quercetin. Consequently, the presence of other ligands that can also complex with aluminum ions may interfere with the assay. Tests on BC preparations containing 0.011 % w/w ACH indicate that EDTA, citric acid, and a mixture of fatty acids inhibited greatly quercetin-aluminum complexation (Figure 2). These findings align with literature reports where the corresponding colorless to light-yellow complexes between aluminum and the three identified interferents are documented [47,48,49,50]. In contrast, gluconates, lactic acid, and acetic acid showed only moderate inhibition at the concentrations used. Conversely, benzoates and sorbates slightly enhanced the signal (Figure 2).
Furthermore, since quercetin can form coordination compounds with various transition metals [51], the presence of these metal ions in the emulsion matrix could also introduce interference. This would be detectable as a change in the blank reading. Given that aluminum is the dominant metal in antiperspirants, however, its important molar excess is expected to minimize interference from trace metals. Altogether, these findings underscore the necessity of using a metal-free, chelator-free dilution matrix. Furthermore, the use of organic acids as acidifying agents is not recommended, as they can also interfere with the complexation of quercetin with aluminum.
3.1.3. Assay Validation in Microwells
The calculated, through regression analysis, LOQ and LOD for the aluminum microwell assay were 50 μg Al/ g of emulsion and 16.5 μg Al/ g of emulsion, respectively. To further validate the adapted assay and establish its technical characteristics, several quality control (QC) samples were prepared in the BC matrix with known, spiked concentrations of ACH (Table 1). They covered the entire linear range starting at the LOQ and included an additional QC containing 13.7 mg Al/g of emulsion (1.37 % w/w), i.e., commercially relevant levels. The latter was diluted to lower its concentration within the linear range before analysis. Upon aluminum quantification by the proposed assay on 4 different days, the intermediate precision (expressed as coefficient of variation, CV%) and accuracy (expressed as relative bias%) remained mostly within the adopted limits, where a CV and bias of up to 20 % at the limit of quantification and 15 % for higher concentrations are acceptable (Table 1). This QC analysis established the experimentally determined Lower Limit of Quantification (LLOQ) at 51.8 μg Al/g of emulsion, thereby confirming a useful analytical range between 52 and 196 μg Al/g of emulsion.
To further evaluate the accuracy of the proposed method, we analyzed a variety of commercial antiperspirants (Table 2). Each product, containing ACH, was diluted between 1:700 and 1:300 in a BC cream matrix, yielding concentrations within the upper linear range of the assay. Standards in the BC cream were prepared in an identical manner to ensure matrix matching. Using a calibration curve constructed within the BC cream matrix, the concentrations of aluminum in all diluted samples were quantitatively determined (Table 2). The determination accuracy was satisfactory in all cases and broadly conformed to the adopted acceptance limits, which permit a maximum bias of ±15 %. Although one sample exhibited a relative bias of 15.18 %, this value is only marginally above the specified limit. Notably, antiperspirant lotion 1 contained 3.5 % w/w of the fatty acid mixture, while antiperspirant lotion 2 contained sorbate, citrate and benzoate salts (total concentration 0.002 % w/w), which were previously identified as assay interferents. The satisfactory accuracy maintained, despite the presence of interfering components, demonstrates that important dilution in a controlled matrix effectively neutralizes interference from other sample ingredients.
3.1.4. Assay on Filter Paper
An alternative paper-based spot test using Alizarin S and diffuse reflectance spectroscopy has been published [18], which offers superior LOD, LOQ, and repeatability, as well as a similarly broad useful analytical range when compared to the microwell-based assay presented above. Nevertheless, our proposed method provides a distinct practical advantage while still presenting acceptable technical characteristics for routine cosmetic quality control: it requires no specialized laboratory equipment for sample preparation or analysis.
We additionally conducted preliminary experiments to adapt the assay to a paper-based format, as previously validated for other chromogenic quantification techniques [2,3]. Similar to the assay in wells, we observed a robust linear relationship between the reflected-light RGB intensity of spots on paper strips and the concentration of ACH in applied emulsions. Two replicate standard curves achieved R2 values of at least 0.982, with linearity maintained between 0 and at least 0.013% w/w ACH, corresponding to 0-32.4 μg Al/g of emulsion (Figure 3). Further studies are required to examine the analytical validity of this alternative approach.
3.2. Determination of Labile Iron Upon Complexation with Ferrozine
3.2.1. Preliminary Studies
The proposed assay takes advantage of the well-established complexation of ferrous iron with ferrozine, generating a magenta-colored coordination compound, whose absorbance is linearly related to iron concentration [38]. We adapted this method for use in emulsions and integrated digital colorimetric monitoring. To validate the approach, a series of standards were prepared in emulsion BC, with concentrations ranging from 0 to 8.0 μg Fe/g of emulsion (Fe refers to the sum of ferrozine-reactive ferrous and ferric iron, which is primarily associated with the pro-oxidant activity of iron in cosmetic emulsions). Following the addition of the ferrozine R1/R2 mixture, to achieve both labile iron reduction to the ferrous form and complexation, the intensities of the colored standards were captured in microwells via a smartphone camera. Analysis confirmed a linear correlation between ferrozine-reactive iron concentration and reflected-light RGB intensity within most of the examined concentration range, and across at least nine standard curves prepared on different days, yielding R2≥ 0.981 (Figure 4 - circles). For all standards at or above the LLOQ employed in all replicate calibration curves within the validation experiments, the standard concentration was back-calculated within ± 16.7 % of their nominal concentration (± 22.4 % at the LOQ). Using the same procedure, standards were also prepared in two other commercial emulsions of very different composition, where linearity was similarly confirmed (R2 ≥ 0.980, in both cases). The pH along the three emulsions ranged between 5.1 and 5.9, while viscosity between 72,000 and 420,000 mPa·s, highlighting the flexibility of the assay in terms of matrix pH or viscosity.
3.2.2. Interferences
Since the proposed assay relies on the complexation of labile iron(II) with ferrozine, any substance that can complex with iron(II) ions may interfere, leading to inaccurate results. Moreover, since ferrozine readily forms coordination compounds with other transition metals -cobalt and copper [38,39] - the presence of these metal ions in the matrix could also introduce interference.
To identify potential interferents, we investigated the effect of common cosmetic chemicals and metal impurities, using a detachable well-based assay. Our study on BC preparations containing iron revealed interference from several agents. As shown in Figure 5, the relative color Δintensity of the iron-ferrozine complex was greatly reduced in the presence of disodium EDTA and zinc sulfate; conversely the interference was less pronounced in the presence of calcium sulfate, magnesium sulfate, and sodium benzoate. The sulfate anion by itself caused minor interference.
A separate study was run, aimed to identify which common metals generate colored products with ferrozine in the presence of a reducing agent, in an iron-free base cream formulation. While sodium, potassium, magnesium, zinc and calcium ions produced no color, cobalt(II) and copper(II) were found to generate colored emulsions, confirming existing literature [38,39]. The concentrations tested in the emulsion were 3.9 % w/w sodium chloride, 5.0 % w/w potassium chloride, 0.05 % w/w magnesium carbonate, 1.5 % w/w zinc chloride, 0.004 % w/w cobalt(II) nitrate hexahydrate and 0.05 % w/w copper(II) sulfate pentahydrate.
We performed a literature survey on the metals content of 63 non-color cosmetic emulsions [31,32]. This revealed that iron is in important excess, with the mass ratios of Fe/Co and Fe/Cu exceeding 40 and 8, respectively, in 96 % and 82 % of the samples surveyed, respectively. A median iron concentration of 56 μg Fe(III)/g emulsion was present in these samples.
To evaluate the potential effect of Co and Cu interference, a recovery study was initiated utilizing a representative matrix (BC) spike. A blank cosmetic emulsion was fortified to realistic baseline concentrations of 41.7 μg Fe(III)/g emulsion and 1.05 μg Co(II)/g emulsion (corresponding to a Fe/Co ratio of approximately 40), and 4.99 μg Cu(II)/g emulsion (corresponding to a Fe/Cu ratio of approximately 8.3). We subsequently analysed the spiked matrix by the proposed assay, after a suitable dilution of 1: 10 (BC as diluent), to lower iron levels within the linear range. This analysis yielded an accurate iron quantification (bias: + 4.5 %). This finding demonstrates that at such commercially realistic mass ratios, the presence of concomitant cobalt and copper ions exerts negligible interference effects on the quantification of ascorbate-reducible, ferrozine-reactive iron by the proposed assay in spiked/model emulsions.
When the sample matrix is available, interference is best minimized by preparing standards within that exact same matrix. For instance, the concentration of iron standards prepared in an emulsion containing 0.1 % EDTA were accurately back-calculated (with a bias ≤ +0.8 %) when a standard curve in the EDTA-containing matrix was prepared (Figure 4 (squares)).
3.2.3. Assay Validation
The proposed methodology is based on a well-documented reaction for determining ascorbate-reducible, ferrozine-reactive iron in solution [38], yet it has not been previously applied directly to emulsions. It was thus validated in terms of linearity, useful analytical range, accuracy, intermediate precision, limit of detection and limit of quantification. Linearity in the BC matrix was confirmed from 0 to 6.86 μg Fe/g of emulsion, across 7 replicate standard curves (R2 ≥ 0.981). LOQ and LOD were calculated through regression analysis to be 1.38 and 0.46 μg Fe/g of emulsion, respectively (7 replicates, CV:10.5 %). To further evaluate its technical characteristics, matrix-matched QCs (spiked with iron(III) at LOQ, or at low, medium and high levels within the linear range and at a commercially relevant level) were analysed (six runs on five different days). Acceptable assay accuracy (relative bias %) and precision values (CV%), satisfying the adopted criteria, were observed for concentrations higher than 1.25 μg Fe/g of emulsion (Table 3). This QC analysis established the limit of 1.87 μg Fe/g emulsion as a practical lower quantification boundary, thereby confirming a useful analytical range between 1.87 and 6.86 μg Fe/g of emulsion.
Consequently, we further validated the accuracy of the proposed assay through method comparison studies against X-ray fluorescence (XRF), a widely accepted technique for metal analysis in cosmetics [30,33,34,35]. We initially prepared a series of iron QCs in BC within the colorimetric method’s useful analytical range, and analyzed them using both techniques. However, the low concentrations of the range proved to be below the limit of quantification for our portable EDXRF system. To address this, we extended the concentration range. To ensure the colorimetric assay remained linear at these higher levels, the new QCs were prepared in an emulsion containing 0.1 % w/w disodium EDTA dihydrate as a competitive ligand. EDXRF determines elemental iron largely independently of its chemical form. Therefore, complexation of iron by EDTA does not directly inhibit detection as it does in the ferrozine assay, and EDTA does not contribute to the Fe fluorescence signal. A linear relationship was subsequently established between the EDXRF signal and the iron concentration in the emulsion (Figure 6).
The iron concentrations obtained from both methods were then plotted to examine their correlation (Figure 7). The resulting regression yields a slope of approximately 1.14, indicating a consistent 14 % positive bias for the colorimetric method compared to XRF. For non-critical applications such as the one envisaged here, this predictable bias represents an acceptable compromise for a significantly simpler and more cost-effective workflow. Conversely, while the colorimetric assay achieves lower detection and quantification limits than portable EDXRF, as reported previously [30] and observed in the present study, it remains more sensitive to competing ligands, necessitating careful matrix matching or significant dilution in interference-free matrix. Finally, although the established methods of Atomic Absorption Spectroscopy (AAS) after wet digestion [32,36] and Inductively Coupled Plasma with optical emission (ICP-OES) [37] for iron analysis have mostly superior technical characteristics, including a much lower LOQ for AAS only (LOQ determined as 54 ng/g [36] and 100 ng/g for AAS [32], while as 6.28 mg/L for ICP-OES [37]) the herein proposed approach is sufficiently precise, accurate and selective under the defined conditions, and with a sufficient low LOQ for routine cosmetic quality control purposes.
4. Conclusions
We have developed and validated a direct analytical methodology for the quantitative determination of aluminum and ascorbate-reducible, ferrozine-reactive iron in oil-in-water emulsions. The practicality of the approach stems from the elimination of extraction and digestion steps, as well as the absence of specialized laboratory equipment.
Validation via Quality Controls confirmed that assay accuracy (relative bias ≤ +13.7 %) and intermediate precision (CV ≤ 12.6 %) fully comply with the adopted acceptance criteria, confirming the practical reliability of the method without requiring full emulsion digestion.
An inherent boundary of direct colorimetric determination in complex matrices is its susceptibility to ligand exchange and competitive complexation. While certain common cosmetic ingredients and competing transition metals were identified as assay interferents, quantification accuracy was retained in the presence of commercially relevant concentrations of interferents by:
- Matrix Matching: Preparing standard calibration curves within the exact same sample matrix yielded excellent target recoveries with a relative bias ≤ +0.8 %.
- High Dilution: Because commercial formulations contain Al or Fe in excess relative to the interferents and at concentrations well above the methods’ LOQ, substantial dilution into a controlled, interference-free base cream matrix effectively dilutes out matrix interferents to negligible levels. This was successfully demonstrated by the accurate analysis of aluminum in commercial antiperspirants (relative bias ≤ +15.2 %) and successful spike recovery studies for iron (relative bias ≤ +4.5 %).
The presence of high, unexpected, or unquantified concentrations of strong chelators in an unknown commercial emulsion with low aluminum or iron levels—where significant dilution is not possible—remains a primary point of failure for this method. To address this limitation in uncharacterized samples, Standard Addition Spike Recovery will be tested in future work, as a pre-screening technique to detect such competitive interferences prior to quantitative analysis.
Cross-validation against a portable EDXRF system revealed lower quantification thresholds and a 14 % positive bias for the colorimetric iron assay. The origin of this proportional difference was not established and may reflect differences in sample state, measurement principle, matrix effects, or uncertainties associated with either analytical procedure. For routine quality control, this predictable deviation represents a highly acceptable trade-off for an immediate, digestion-free workflow. Moreover, since XRF measures total elemental Fe whereas the colorimetric assay measures ascorbate-reducible, ferrozine-reactive Fe, the comparison should be regarded as a method-performance comparison in spiked model emulsions rather than a direct equivalence study of iron speciation in commercial formulations.
In conclusion, the proposed method can be considered as an accessible tool to quantify aluminum and ascorbate-reducible, ferrozine-reactive iron with acceptable technical characteristics, for routine cosmetic quality control.
Author Contributions
G.E.T.: Conceptualization, Methodology, Validation, Investigation, Formal Analysis, Supervision, Writing- original draft, Writing – review and editing; D.D.: Validation, Investigation, Formal Analysis, G.B.: Validation, Investigation, Formal analysis, M.P.: Methodology, Validation, Investigation, Formal Analysis. Writing- review and editing.
Funding
This research received no external funding
Data Availability Statement
Data are contained in the article
Conflicts of Interest
The authors declare no conflicts of interest.
Abbreviations
The following abbreviations are used in this manuscript:
| AAS | Atomic absorption spectroscopy |
| ACH | Aluminum chlorohydrate |
| Al | Aluminum |
| BC | Base-cream emulsion matrix |
| BfR | German Federal Institute for Risk Assessment |
| CV | Coefficient of variation |
| DIC | Digital-image colorimetry |
| EDTA | Ethylenediaminetetraacetic acid |
| EDXRF | Energy-dispersive X-ray fluorescence |
| Fe | Iron |
| HPLC | High-performance liquid chromatography |
| ICH | International Council for Harmonisation |
| ICP-OES | Inductively coupled plasma optical emission spectrometry |
| LED | Light-emitting diode |
| LOD | Limit of detection |
| LOQ | Limit of quantification |
| LLOQ | Lower limit of quantification |
| O/W | Oil-in-water |
| QC | Quality control |
| RGB | Red, green and blue |
| SCCS | Scientific Committee on Consumer Safety |
| SD | Standard deviation |
| XRF | X-ray fluorescence |
References
- Tsotsou, G.E. Extraction-Free Analysis in Cosmetics by Digital Image Colorimetry, Illustrated by the Quantification of Urea. Heliyon 2024, 10, e25503. [Google Scholar] [CrossRef] [PubMed]
- Tsotsou, G.E.; Paraskevopoulou, P.E. An Extraction-Free, Smartphone-Based Approach for Measuring the Antioxidant Capacity of Emulsions Using a Paper-Based DPPH Assay. Microchem. J. 2024, 207, 111792. [Google Scholar] [CrossRef]
- Tsotsou, G.E.; Petraki, G.; Chourda, F. Measuring Antioxidant Capacity Directly in Emulsions: A New Paper-Based FRAP Assay and Comparison with Its DPPH Counterpart. MethodsX 2026, 16, 103897. [Google Scholar] [CrossRef] [PubMed]
- Teerasumran, P.; Velliou, E.; Bai, S.; Cai, Q. Deodorants and Antiperspirants: New Trends in Their Active Agents and Testing Methods. Int. J. Cosmet. Sci. 2023, 45, 426–443. [Google Scholar] [CrossRef] [PubMed]
- Oliveira, E.C. V. d.; Salvador, D.S.; Holsback, V.; Shultz, J.D.; Michniak-Kohn, B.B.; Leonardi, G.R. Deodorants and Antiperspirants: Identification of New Strategies and Perspectives to Prevent and Control Malodor and Sweat of the Body. Int. J. Dermatol. 2021, 60, 613–619. [Google Scholar] [CrossRef] [PubMed]
- Paz, L.; Moura, L.; Feio, D.; Cardoso, M.; Ximenes, W.; Montenegro, R.; Alves, A.; Burbano, R.; Lima, P. Evaluation of In Vivo and In Vitro Toxicological and Genotoxic Potential of Aluminum Chloride. Chemosphere 2017, 175, 130–137. [Google Scholar] [CrossRef] [PubMed]
- Sawicka, E.; Wiatrowska, N. The Potential Metalloestrogenic Effect of Aluminum on Breast Cancer Risk for Antiperspirant Users. Int. J. Mol. Sci. 2025, 26, 99. [Google Scholar] [CrossRef] [PubMed]
- Jalili, P.; Huet, S.; Lanceleur, R.; Jarry, G.; Le Hegarat, L.; Nesslany, F.; Hogeveen, K.; Fessard, V. Genotoxicity of Aluminum and Aluminum Oxide Nanomaterials in Rats Following Oral Exposure. Nanomaterials 2020, 10, 305. [Google Scholar] [CrossRef] [PubMed]
- Gorgogietas, V.A.; Tsialtas, I.; Sotiriou, N.; Laschou, V.C.; Karra, A.G.; Leonidas, D.D.; Chrousos, G.P.; Protopapa, E.; Psarra, A.G. Potential Interference of Aluminum Chlorohydrate with Estrogen Receptor Signaling in Breast Cancer Cells. J. Mol. Biochem. 2018, 7, 1–13. [Google Scholar] [PubMed]
- Walton, J.R. Aluminum Involvement in the Progression of Alzheimer’s Disease. J. Alzheimers Dis. 2013, 35, 7–43. [Google Scholar] [CrossRef] [PubMed]
- Sanajou, S.; Şahin, G.; Baydar, T. Aluminium in Cosmetics and Personal Care Products. J. Appl. Toxicol. 2021, 41, 1704–1718. [Google Scholar] [CrossRef]
- Bundesinstitut für Risikobewertung. FAQs about aluminium in food and products intended for consumers. Available online: https://www.bfr.bund.de/en/service/frequently-asked-questions/topic/faqs-about-aluminium-in-food-and-products-intended-for-consumers/ (accessed on 23 March 2026).
- de Ligt, R.; Westerhout, J.; Grossouw, D.; Buters, T.P.; Rissmann, R.; Burggraaf, J.; Windhorst, A.D.; Tozer, S.; Pappa, G.; Wall, B.; Bury, D.; Mason, D.R.; Vaes, W.H. J. Assessment of Dermal Absorption of Aluminium from a Representative Antiperspirant Formulation Using a (26Al)Al Microtracer Approach: A Follow-Up Study in Humans. Toxicol. Res. 2022, 11, 511–519. [Google Scholar] [CrossRef] [PubMed]
- Letzel, M.; Drexler, H.; Göen, T.; Hiller, J. Impact of Daily Antiperspirant Use on the Systemic Aluminum Exposure: An Experimental Intervention Study. Skin. Pharmacol. Physiol. 2020, 33, 1–8. [Google Scholar] [CrossRef] [PubMed]
- Scientific Committee on Consumer Safety (SCCS). SCCS/1647/22; Opinion on the safety of aluminium in cosmetic products—Submission III. European Commission: Brussels, Belgium, 2023.
- Chiu, M.-H.; Kumar, A.S.; Sornambikai, S.; Zen, J.-M.; Shih, Y. Flow Injection Analysis of Aluminum Chlorohydrate in Antiperspirant Deodorants Using a Built-in Three-in-One Screen-Printed Silver Electrode. Electroanalysis 2010, 22, 2421–2427. [Google Scholar] [CrossRef]
- Hassan, S.S. M.; Kamel, A.H.; El-Naby, H.A. Flow-Through Potentiometric Sensors for Alizarin Red S Dye and Their Application for Aluminum Determination. J. Chin. Chem. Soc. 2014, 61, 295–302. [Google Scholar] [CrossRef]
- Silvestre, A.L. P.; Milani, M.I.; Rossini, E.L.; Pezza, L.; Pezza, H.R. A Paper Platform for Colorimetric Determination of Aluminum Hydrochloride in Antiperspirant Samples. Spectrochim. Acta A Mol. Biomol. Spectrosc. 2018, 204, 432–435. [Google Scholar] [CrossRef] [PubMed]
- Maćkiewicz, E.; Zimon, A.; Pawlaczyk, A.; Albińska, J.; Szynkowska-Jóźwik, M.I. Application of the ICP-OES and SEM-EDS Techniques for Elemental Analysis of Various Types of Cosmetic Products with Antiperspirant and Deodorant Properties Available on the EU Market. Molecules 2025, 30, 4050. [Google Scholar] [CrossRef] [PubMed]
- Salama, A.K. Assessment of Metals in Cosmetics Commonly Used in Saudi Arabia. Environ. Monit. Assess. 2016, 188, 553. [Google Scholar] [CrossRef] [PubMed]
- Abughrin, S.; Alshana, U.; Caleb, J. Smartphone Digital Image Colorimetry for the Determination of Aluminum in Antiperspirant Products. Turk. J. Pharm. Sci. 2022, 19, 618–625. [Google Scholar] [CrossRef] [PubMed]
- Ummiti, K. A New Method for Quantifying Aluminum in Antiperspirant Lotion Using a Differential Refractometer and an HPLC Column Containing a Maleate Functional Group. Adv. Res. Sci. 2024, 2, 1017. [Google Scholar] [CrossRef] [PubMed]
- Castilho, I.N. B.; de Quadros, D.P. C.; Mior, R.; Welz, B.; Carasek, E.; Borges, D.L. G. Determination of Aluminum in Moisturizing Body Lotions Using Graphite Furnace Atomic Absorption Spectrometry. Anal. Methods 2015, 7, 9636–9640. [Google Scholar] [CrossRef]
- Bernstein, E.F.; Sarkas, H.W.; Boland, P. Iron Oxides in Novel Skin Care Formulations Attenuate Blue Light for Enhanced Protection Against Skin Damage. J. Cosmet. Dermatol. 2021, 20, 532–537. [Google Scholar] [CrossRef] [PubMed]
- Tanaka, Y.; Parker, R.; Aganahi, A.; Pedroso, A. Novel Low Viscosity Zinc Oxide, Iron Oxides and Erioglaucine Sunscreen Potential to Protect from Ultraviolet, Visible Light and Near-Infrared Radiation. Opt. Photonics J. 2023, 13, 217–226. [Google Scholar] [CrossRef]
- Lyons, A.B.; Trullas, C.; Kohli, I.; Hamzavi, I.H.; Lim, H.W. Photoprotection Beyond Ultraviolet Radiation: A Review of Tinted Sunscreens. J. Am. Acad. Dermatol. 2021, 84, 1393–1397. [Google Scholar] [CrossRef] [PubMed]
- European Parliament and the Council of the European Union. Regulation (EC) No 1223/2009 of the European Parliament and of the Council of 30 November 2009 on Cosmetic Products. Off. J. Eur. Union 2009, L 342, 59–209. [Google Scholar]
- Halliwell, B. Reactive Oxygen Species in Living Systems: Source, Biochemistry, and Role in Human Disease. Am. J. Med. 1991, 91, S14–S22. [Google Scholar] [CrossRef] [PubMed]
- Hu, Y.; Zhao, G.; Zhang, M.; Cui, G.; He, B. Potential Adverse Health Effects of Dietary Lipid Oxidation Products. J. Food Bioact. 2021, 15, 51–62. [Google Scholar] [CrossRef]
- Melquiades, F.L.; Parreira, P.S.; Endo, L.Y.; Santos, G.D.; Wouk, L.; Filho, O.P. Portable EDXRF for Quality Assurance of Cosmetics. Cosmetics 2015, 2, 277–285. [Google Scholar] [CrossRef]
- Ullah, H.; Noreen, S.; Fozia; Rehman, A.; Waseem, A.; Zubair, S.; Adnan, M.; Ahmad, I. Comparative Study of Heavy Metals Content in Cosmetic Products of Different Countries Marketed in Khyber Pakhtunkhwa, Pakistan. Arab. J. Chem. 2017, 10, 10–18. [Google Scholar] [CrossRef]
- Iwegbue, C.M.; Bassey, F.I.; Tesi, G.O.; Onyeloni, S.O.; Obi, G.; Martincigh, B.S. Safety Evaluation of Metal Exposure from Commonly Used Moisturizing and Skin-Lightening Creams in Nigeria. Regul. Toxicol. Pharmacol. 2015, 71, 484–490. [Google Scholar] [CrossRef] [PubMed]
- Briggs-Kamara, M.A. Elemental Analysis of Selected Epidermal Creams by X-Ray Fluorescence (XRF) Spectrometry. Ph.D. Thesis, University of Texas at Arlington, Arlington, TX, USA, 2012. [Google Scholar]
- Murphy, T.; Lim, S.; Huong, S.P.; Irvine, K.; Bayen, S.; Kelly, B.C.; Wilson, K. Application of Handheld X-Ray Fluorescence Analyzers to Identify Mercury in Skin-Whitening Creams in Cambodia. J. Health Pollut. 2012, 2, 21–31. [Google Scholar] [CrossRef]
- Marguí, E.; Eichert, D.; Jablan, J.; Bilo, F.; Depero, L.E.; Pejović-Milić, A.; Gross, A.; Stosnach, H.; Kubala-Kukus, A.; Banaś, D.; Borgese, L. An Overview of the Applications of Total Reflection X-Ray Fluorescence Spectrometry in Food, Cosmetics, and Pharmaceutical Research. J. Anal. At. Spectrom. 2024, 39, 1700–1719. [Google Scholar] [CrossRef]
- Gyamfi, O.; Aboko, J.; Ankapong, E.; Marfo, J.T.; Awuah-Boateng, N.Y.; Agyei, V.; Sarpong, K.; Dartey, E. Heavy Metals in Local and Imported Cosmetics in Ghana and Their Health Risk Assessment. Cogent Public Health 2023, 10, 2217693. [Google Scholar] [CrossRef]
- Ahmed, M.; Ahmad, M.; Sohail, A.; Sanaullah, M.; Saeed, A.; Qamar, S.; Wani, T.A.; Zargar, S.; Alkahtani, H.M.; Khalid, K. Multivariate Statistical Analysis of Cosmetics Due to Potentially Toxic/Heavy Metal (loid) Contamination: Source Identification for Sustainability and Human Health Risk Assessment. Sustainability 2024, 16, 6127. [Google Scholar] [CrossRef]
- Derman, D.P.; Green, A.; Bothwell, T.H.; Graham, B.; McNamara, L.; MacPhail, A.P.; Baynes, R.D. A Systematic Evaluation of Bathophenanthroline, Ferrozine and Ferene in an ICSH-Based Method for the Measurement of Serum Iron. Ann. Clin. Biochem. 1989, 26, 144–147. [Google Scholar] [CrossRef] [PubMed]
- Kundra, S.K.; Katyal, M.; Rathore, P.S. Spectrophotometric Determination of Copper(I) and Cobalt(II) with Ferrozine. Anal. Chem. 1974, 46, 1605–1606. [Google Scholar] [CrossRef]
- Schneider, C.A.; Rasband, W.S.; Eliceiri, K.W. NIH Image to ImageJ: 25 Years of Image Analysis. Nat. Methods 2012, 9, 671–675. [Google Scholar] [CrossRef] [PubMed]
- European Medicines Agency. ICH Q2(R2) Validation of Analytical Procedures—Scientific Guideline. Available online: https:// (accessed on 3 September 2026).
- Pilakouta, M.; Trapali, M.; Kallithrakas-Kontos, N. Some Educational Uses of EDXRF for Technologists in Health Science. Eur. J. Phys. 2025, 46, 015802. [Google Scholar] [CrossRef]
- Kalfas, C.A.; Axiotis, M.; Tsabaris, C. SPECTRW: A Software Package for Nuclear and Atomic Spectroscopy. Nucl. Instrum. Methods Phys. Res. A 2016, 830, 265–274. [Google Scholar] [CrossRef]
- Lian, H.; Kang, Y.; Bi, S.; Arkin, Y.; Shao, D.; Li, D.; Chen, Y.; Dai, L.; Gan, N.; Tian, L. Direct Determination of Trace Aluminum with Quercetin by Reversed-Phase High Performance Liquid Chromatography. Talanta 2004, 62, 43–50. [Google Scholar] [CrossRef] [PubMed]
- Cornard, J.P.; Merlin, J.C. Spectroscopic and Structural Study of Complexes of Quercetin with Al(III). J. Inorg. Biochem. 2002, 92, 19–27. [Google Scholar] [CrossRef] [PubMed]
- Lydersen, E. The Solubility and Hydrolysis of Aqueous Aluminium Hydroxides in Dilute Fresh Waters at Different Temperatures. Hydrol. Res. 1990, 21, 195–204. [Google Scholar] [CrossRef]
- Zhang, L.; Khan, N.; Pu, C. Influence of Salinity on the Properties of the Different HPAM/Al3+ Systems. Oil Gas. Sci. Technol. 2019, 74, 37. [Google Scholar] [CrossRef]
- Coskuner, O.; Jarvis, E.A. A. Coordination Studies of Al-EDTA in Aqueous Solution. J. Phys. Chem. A 2008, 112, 2628–2633. [Google Scholar] [CrossRef]
- Russo, S.; Brambilla, L.; Thomas, J.B.; Picchio, S.; Colletti, A.; Fabbri, M.; Ruggiero, C. But Aren’t All Soaps Metal Soaps? A Review of Applications, Physico-Chemical Properties of Metal Soaps and Their Occurrence in Cultural Heritage Studies. Herit. Sci. 2023, 11, 172. [Google Scholar] [CrossRef]
- Lakatos, A.; Kiss, T.; Bertani, R.; Venzo, A.; Di Marco, V.B. Complexes of Al(III) with d-Gluconic Acid. Polyhedron 2008, 27, 118–124. [Google Scholar] [CrossRef]
- Liu, Y.; Guo, M. Studies on Transition Metal-Quercetin Complexes Using Electrospray Ionization Tandem Mass Spectrometry. Molecules 2015, 20, 8583–8594. [Google Scholar] [CrossRef] [PubMed]
Figure 1.
Linear relationship between reflected blue color intensity and Al concentration in emulsion BC, determined using the detached wells assay format. Below the graph, an image of the corresponding wells is shown, where Al concentration increases from left (0 μg Al/g of emulsion) to right (157 μg Al/g of emulsion). The coefficient of determination (R2) of the linear regression is provided.
Figure 1.
Linear relationship between reflected blue color intensity and Al concentration in emulsion BC, determined using the detached wells assay format. Below the graph, an image of the corresponding wells is shown, where Al concentration increases from left (0 μg Al/g of emulsion) to right (157 μg Al/g of emulsion). The coefficient of determination (R2) of the linear regression is provided.
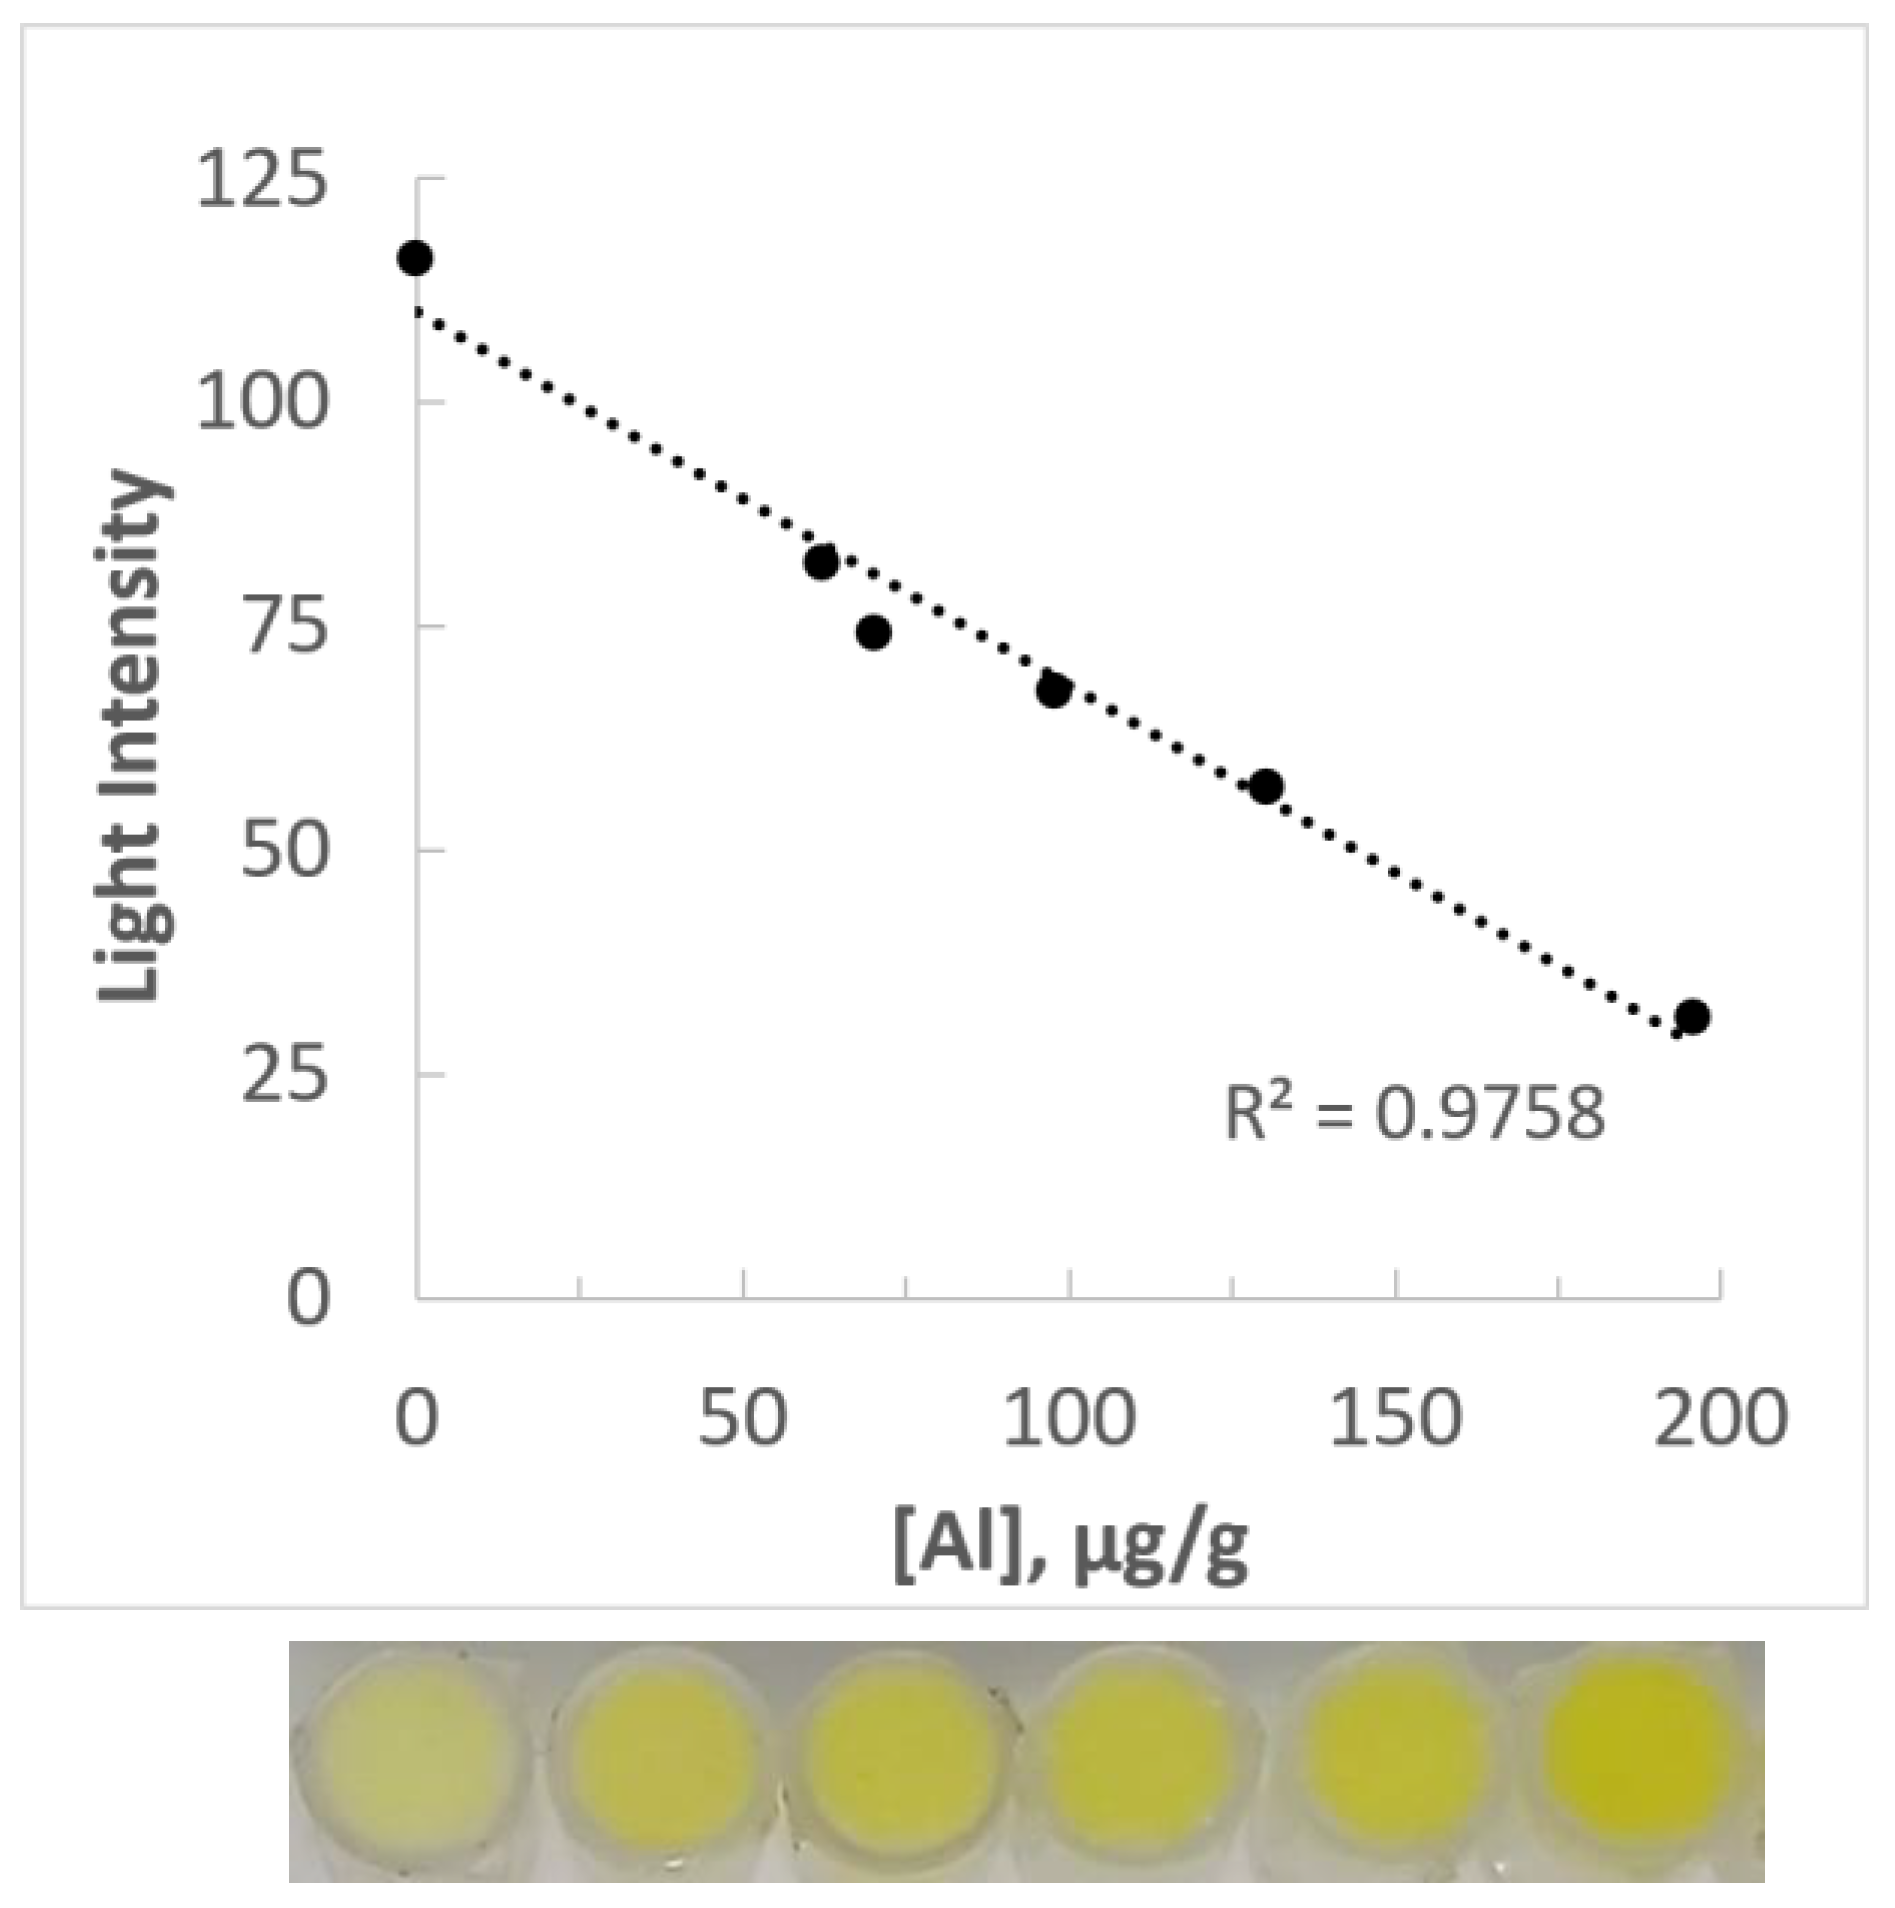
Figure 2.
Effect of interferent on the aluminum-dependent decrease in reflected light intensity in a cosmetic emulsion. The decrease in reflected light intensity attributable to aluminum (Δintensity) was calculated as the difference between the light intensity of the no-ACH control and that of the ACH-containing emulsion: Δintensity = intensity no-ACH control - intensity ACH sample. Δintensity was expressed relative to that of the emulsion where no interferent was added, with the Δintensity value for the no-interferent control defined as 100%. The assay was conducted using an emulsion containing 0.011 % w/w ACH and a potential interferent at commercially relevant or deliberately elevated challenge concentration. Data represent the average of at least three replicate experiments, with error bars denoting one standard deviation. Abbreviations and corresponding concentrations (% w/w): No: no interferent, EDTA: ethylenediaminetetraacetic acid disodium salt (1.0%), SG: sodium gluconate (1.3%), SB: sodium benzoate (0.5%), PS: potassium sorbate (1.5%), LA: lactic acid (0.25%); AA: acetic acid (0.25%); CA: citric acid (2.0%); FA: fatty acids mixture (1.0%).
Figure 2.
Effect of interferent on the aluminum-dependent decrease in reflected light intensity in a cosmetic emulsion. The decrease in reflected light intensity attributable to aluminum (Δintensity) was calculated as the difference between the light intensity of the no-ACH control and that of the ACH-containing emulsion: Δintensity = intensity no-ACH control - intensity ACH sample. Δintensity was expressed relative to that of the emulsion where no interferent was added, with the Δintensity value for the no-interferent control defined as 100%. The assay was conducted using an emulsion containing 0.011 % w/w ACH and a potential interferent at commercially relevant or deliberately elevated challenge concentration. Data represent the average of at least three replicate experiments, with error bars denoting one standard deviation. Abbreviations and corresponding concentrations (% w/w): No: no interferent, EDTA: ethylenediaminetetraacetic acid disodium salt (1.0%), SG: sodium gluconate (1.3%), SB: sodium benzoate (0.5%), PS: potassium sorbate (1.5%), LA: lactic acid (0.25%); AA: acetic acid (0.25%); CA: citric acid (2.0%); FA: fatty acids mixture (1.0%).
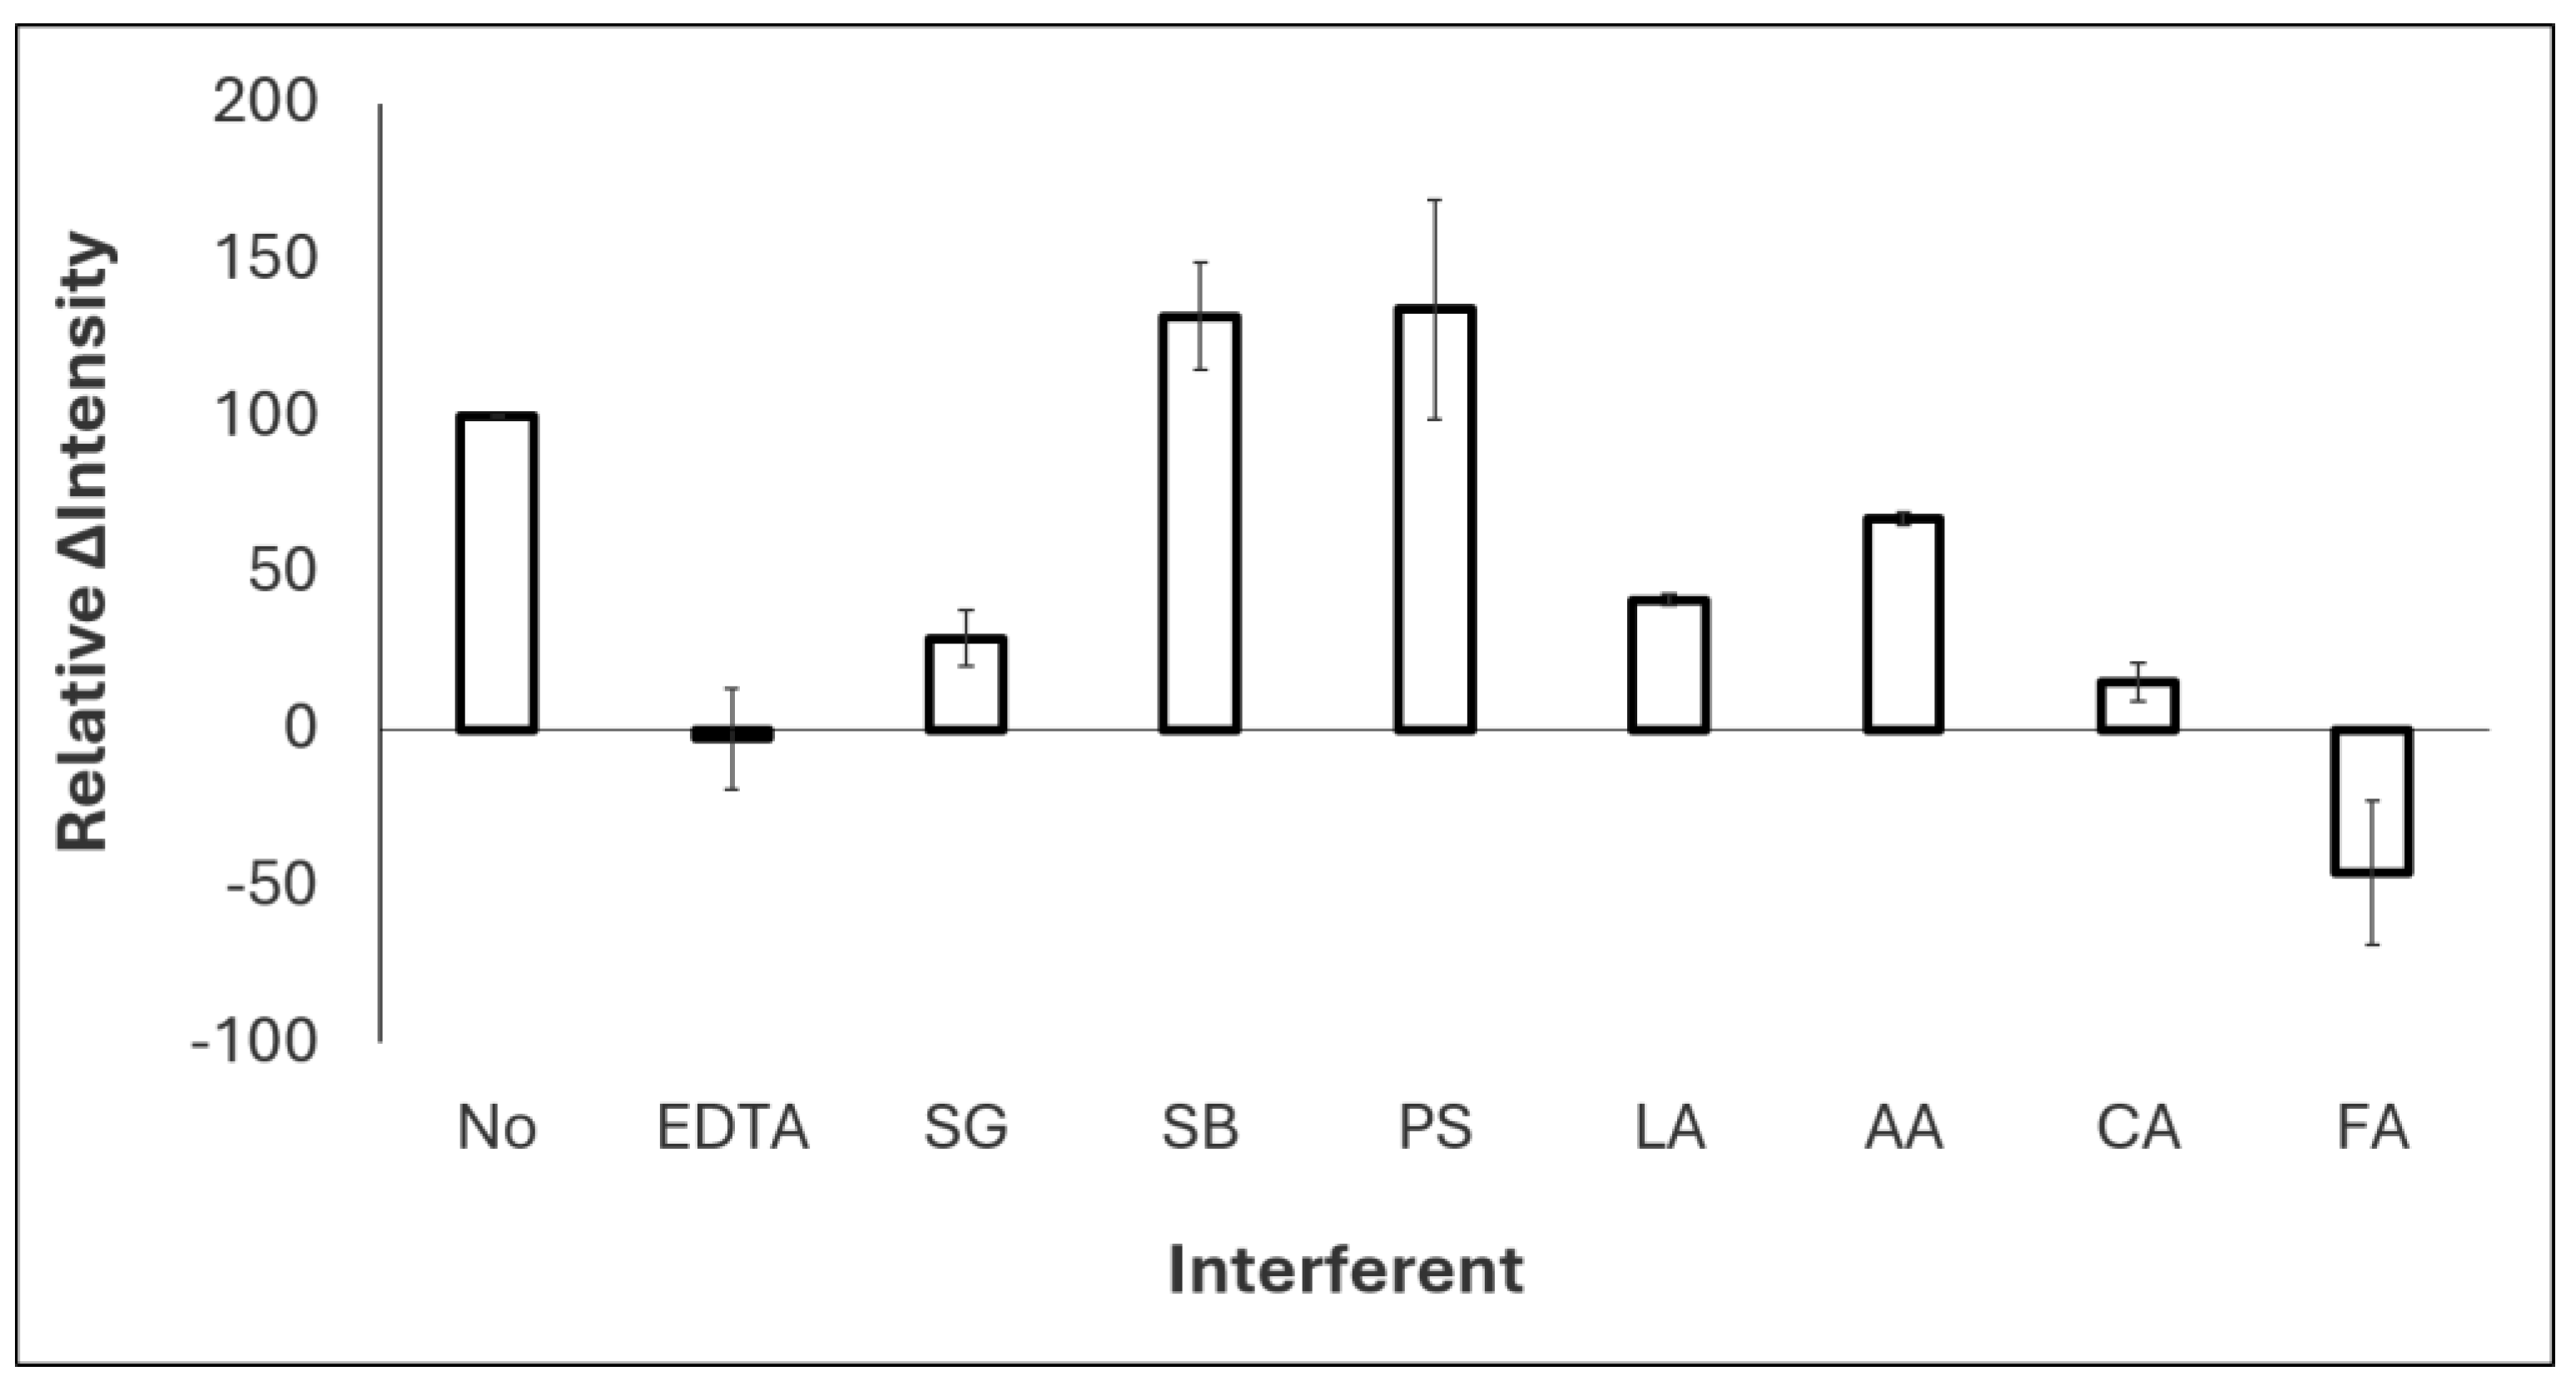
Figure 3.
Linear relationship between reflected blue color intensity and Al concentration in emulsion BC, determined using the paper-based spot assay. Below the graph, an image of the corresponding filter paper spots is shown, where Al concentration increases from left (0 μg Al/g of emulsion) to right (32.4 μg Al/g of emulsion). The coefficient of determination (R2) of the linear regression is provided.
Figure 3.
Linear relationship between reflected blue color intensity and Al concentration in emulsion BC, determined using the paper-based spot assay. Below the graph, an image of the corresponding filter paper spots is shown, where Al concentration increases from left (0 μg Al/g of emulsion) to right (32.4 μg Al/g of emulsion). The coefficient of determination (R2) of the linear regression is provided.
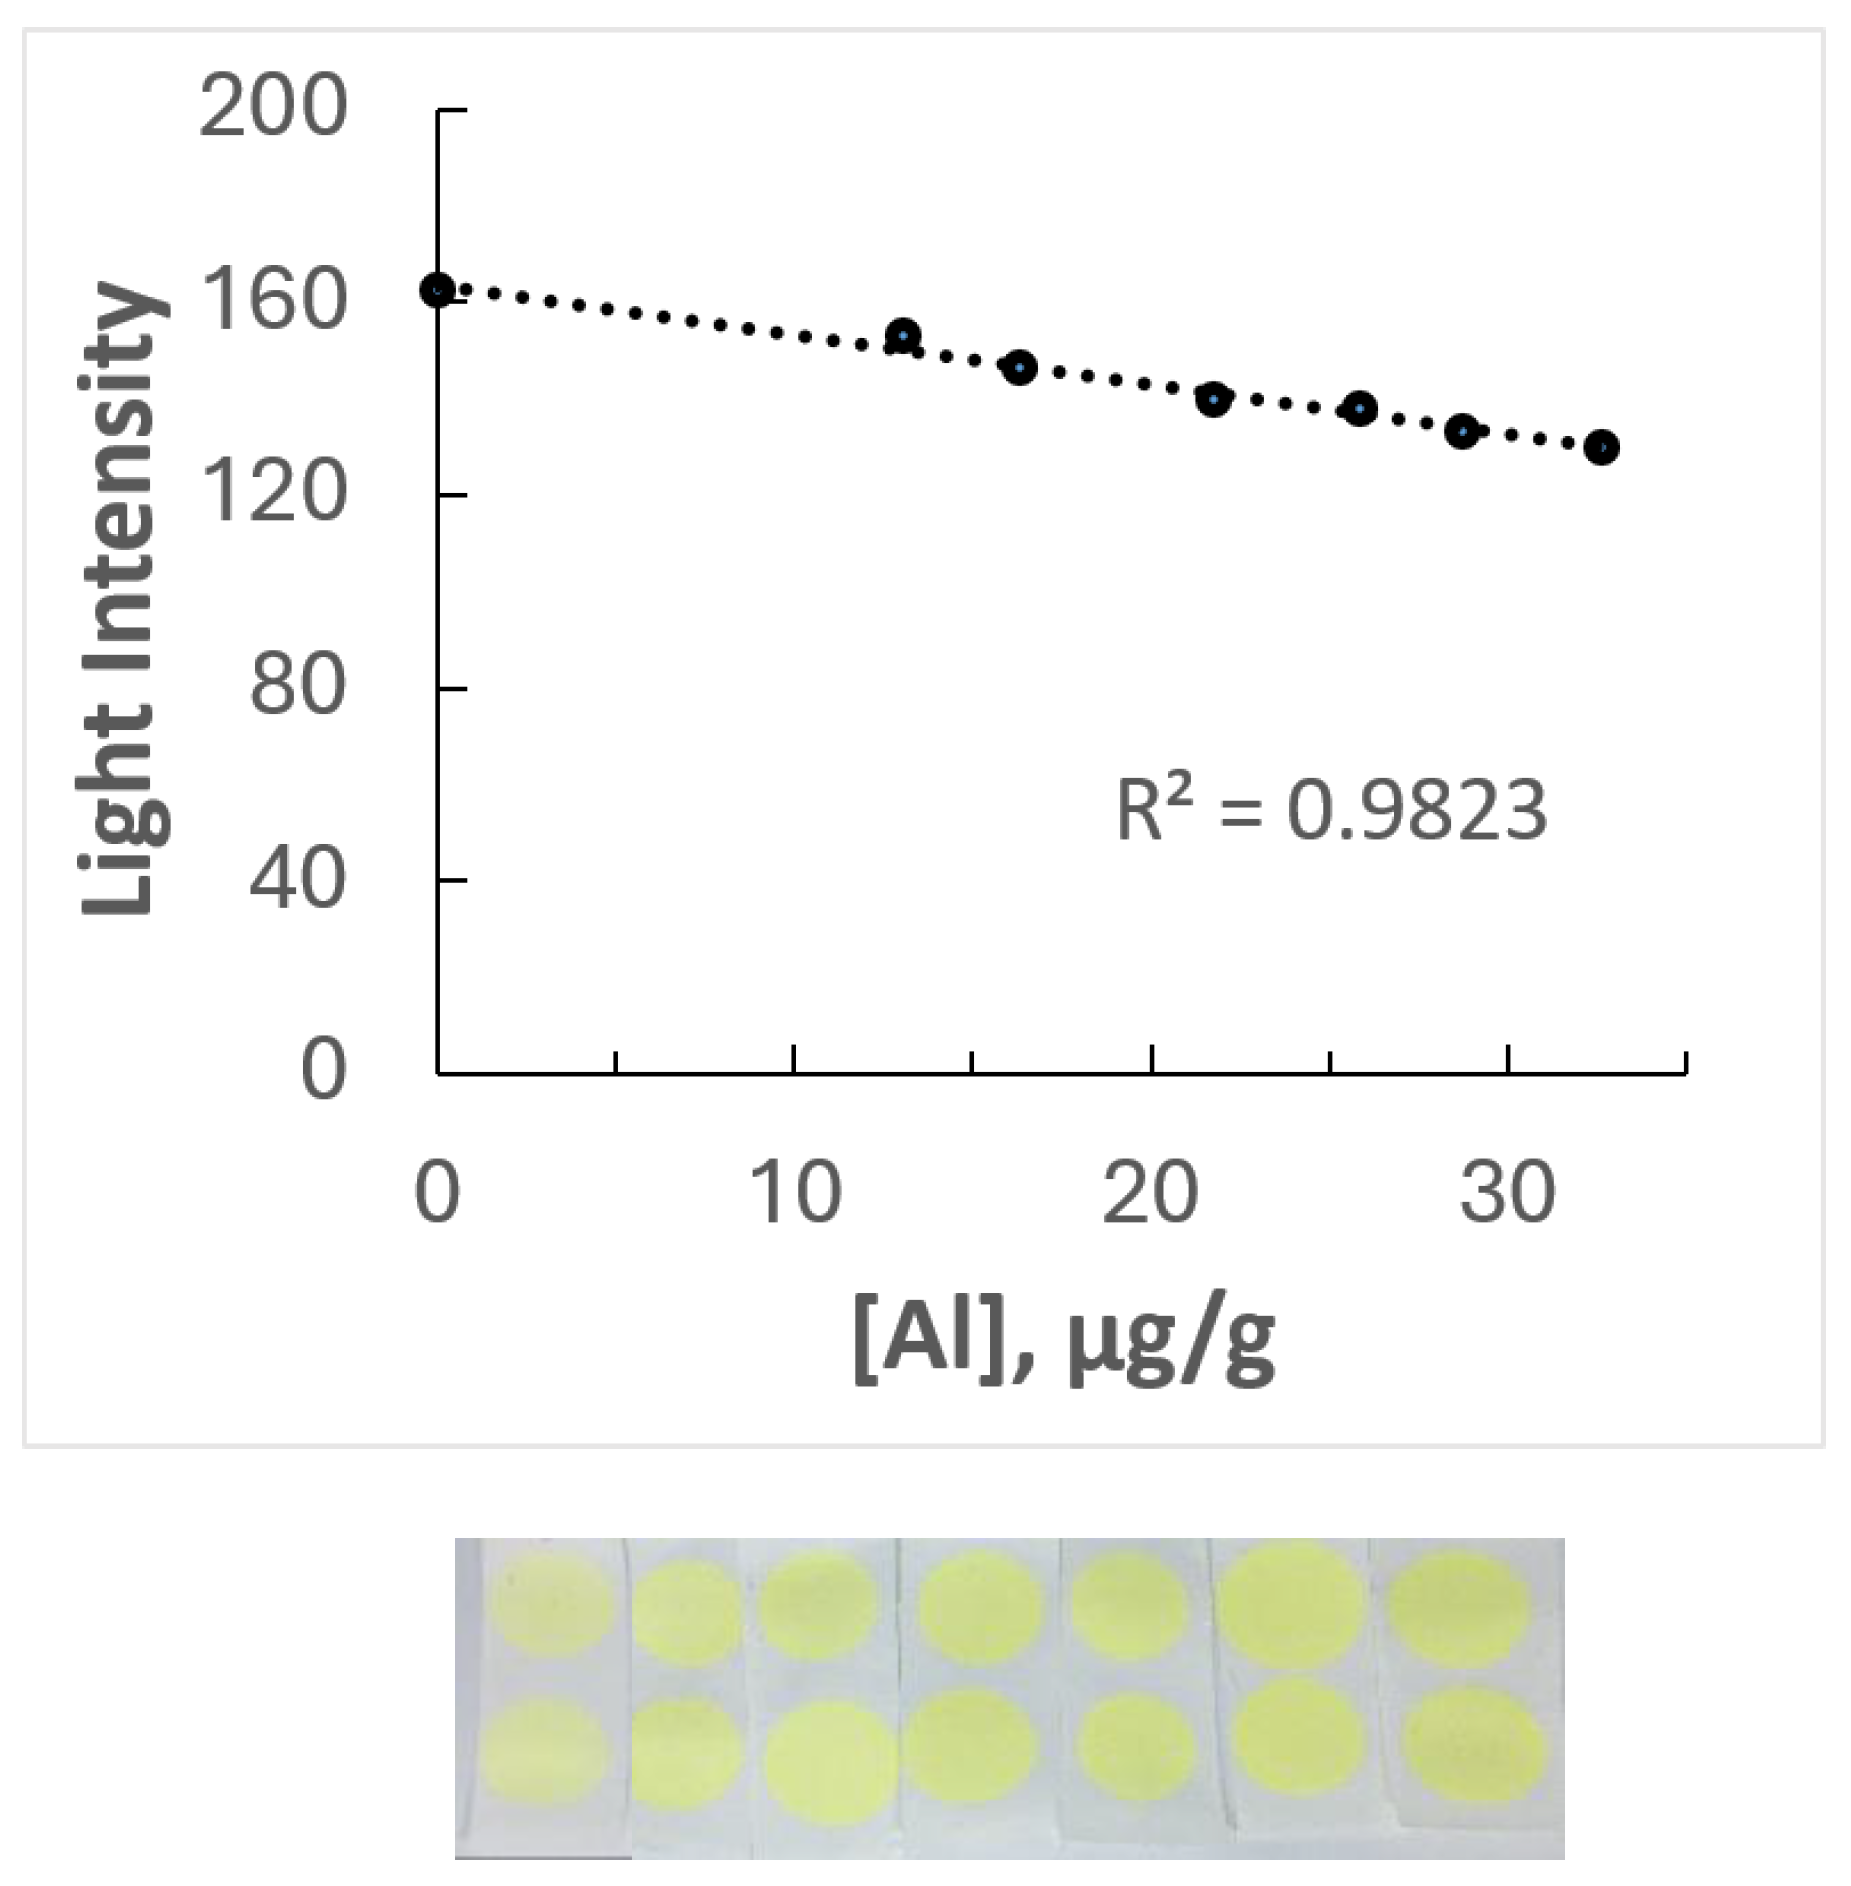
Figure 4.
Linear relationship between reflected red color intensity and ascorbate-reducible, ferrozine-reactive iron concentration in the emulsion, in the absence of EDTA (circles) and in its presence (squares). Below the graph, an image shows the corresponding wells, where ascorbate-reducible, ferrozine-reactive iron concentration increases from left (0 μg/g emulsion) to right (6.55 μg/g emulsion) in the absence of EDTA (series A) and between 0 μg/g emulsion (left) and 65.3 μg/g emulsion (right) in the presence of EDTA (series B). The coefficient of determination (R2) of each linear regression is provided.
Figure 4.
Linear relationship between reflected red color intensity and ascorbate-reducible, ferrozine-reactive iron concentration in the emulsion, in the absence of EDTA (circles) and in its presence (squares). Below the graph, an image shows the corresponding wells, where ascorbate-reducible, ferrozine-reactive iron concentration increases from left (0 μg/g emulsion) to right (6.55 μg/g emulsion) in the absence of EDTA (series A) and between 0 μg/g emulsion (left) and 65.3 μg/g emulsion (right) in the presence of EDTA (series B). The coefficient of determination (R2) of each linear regression is provided.
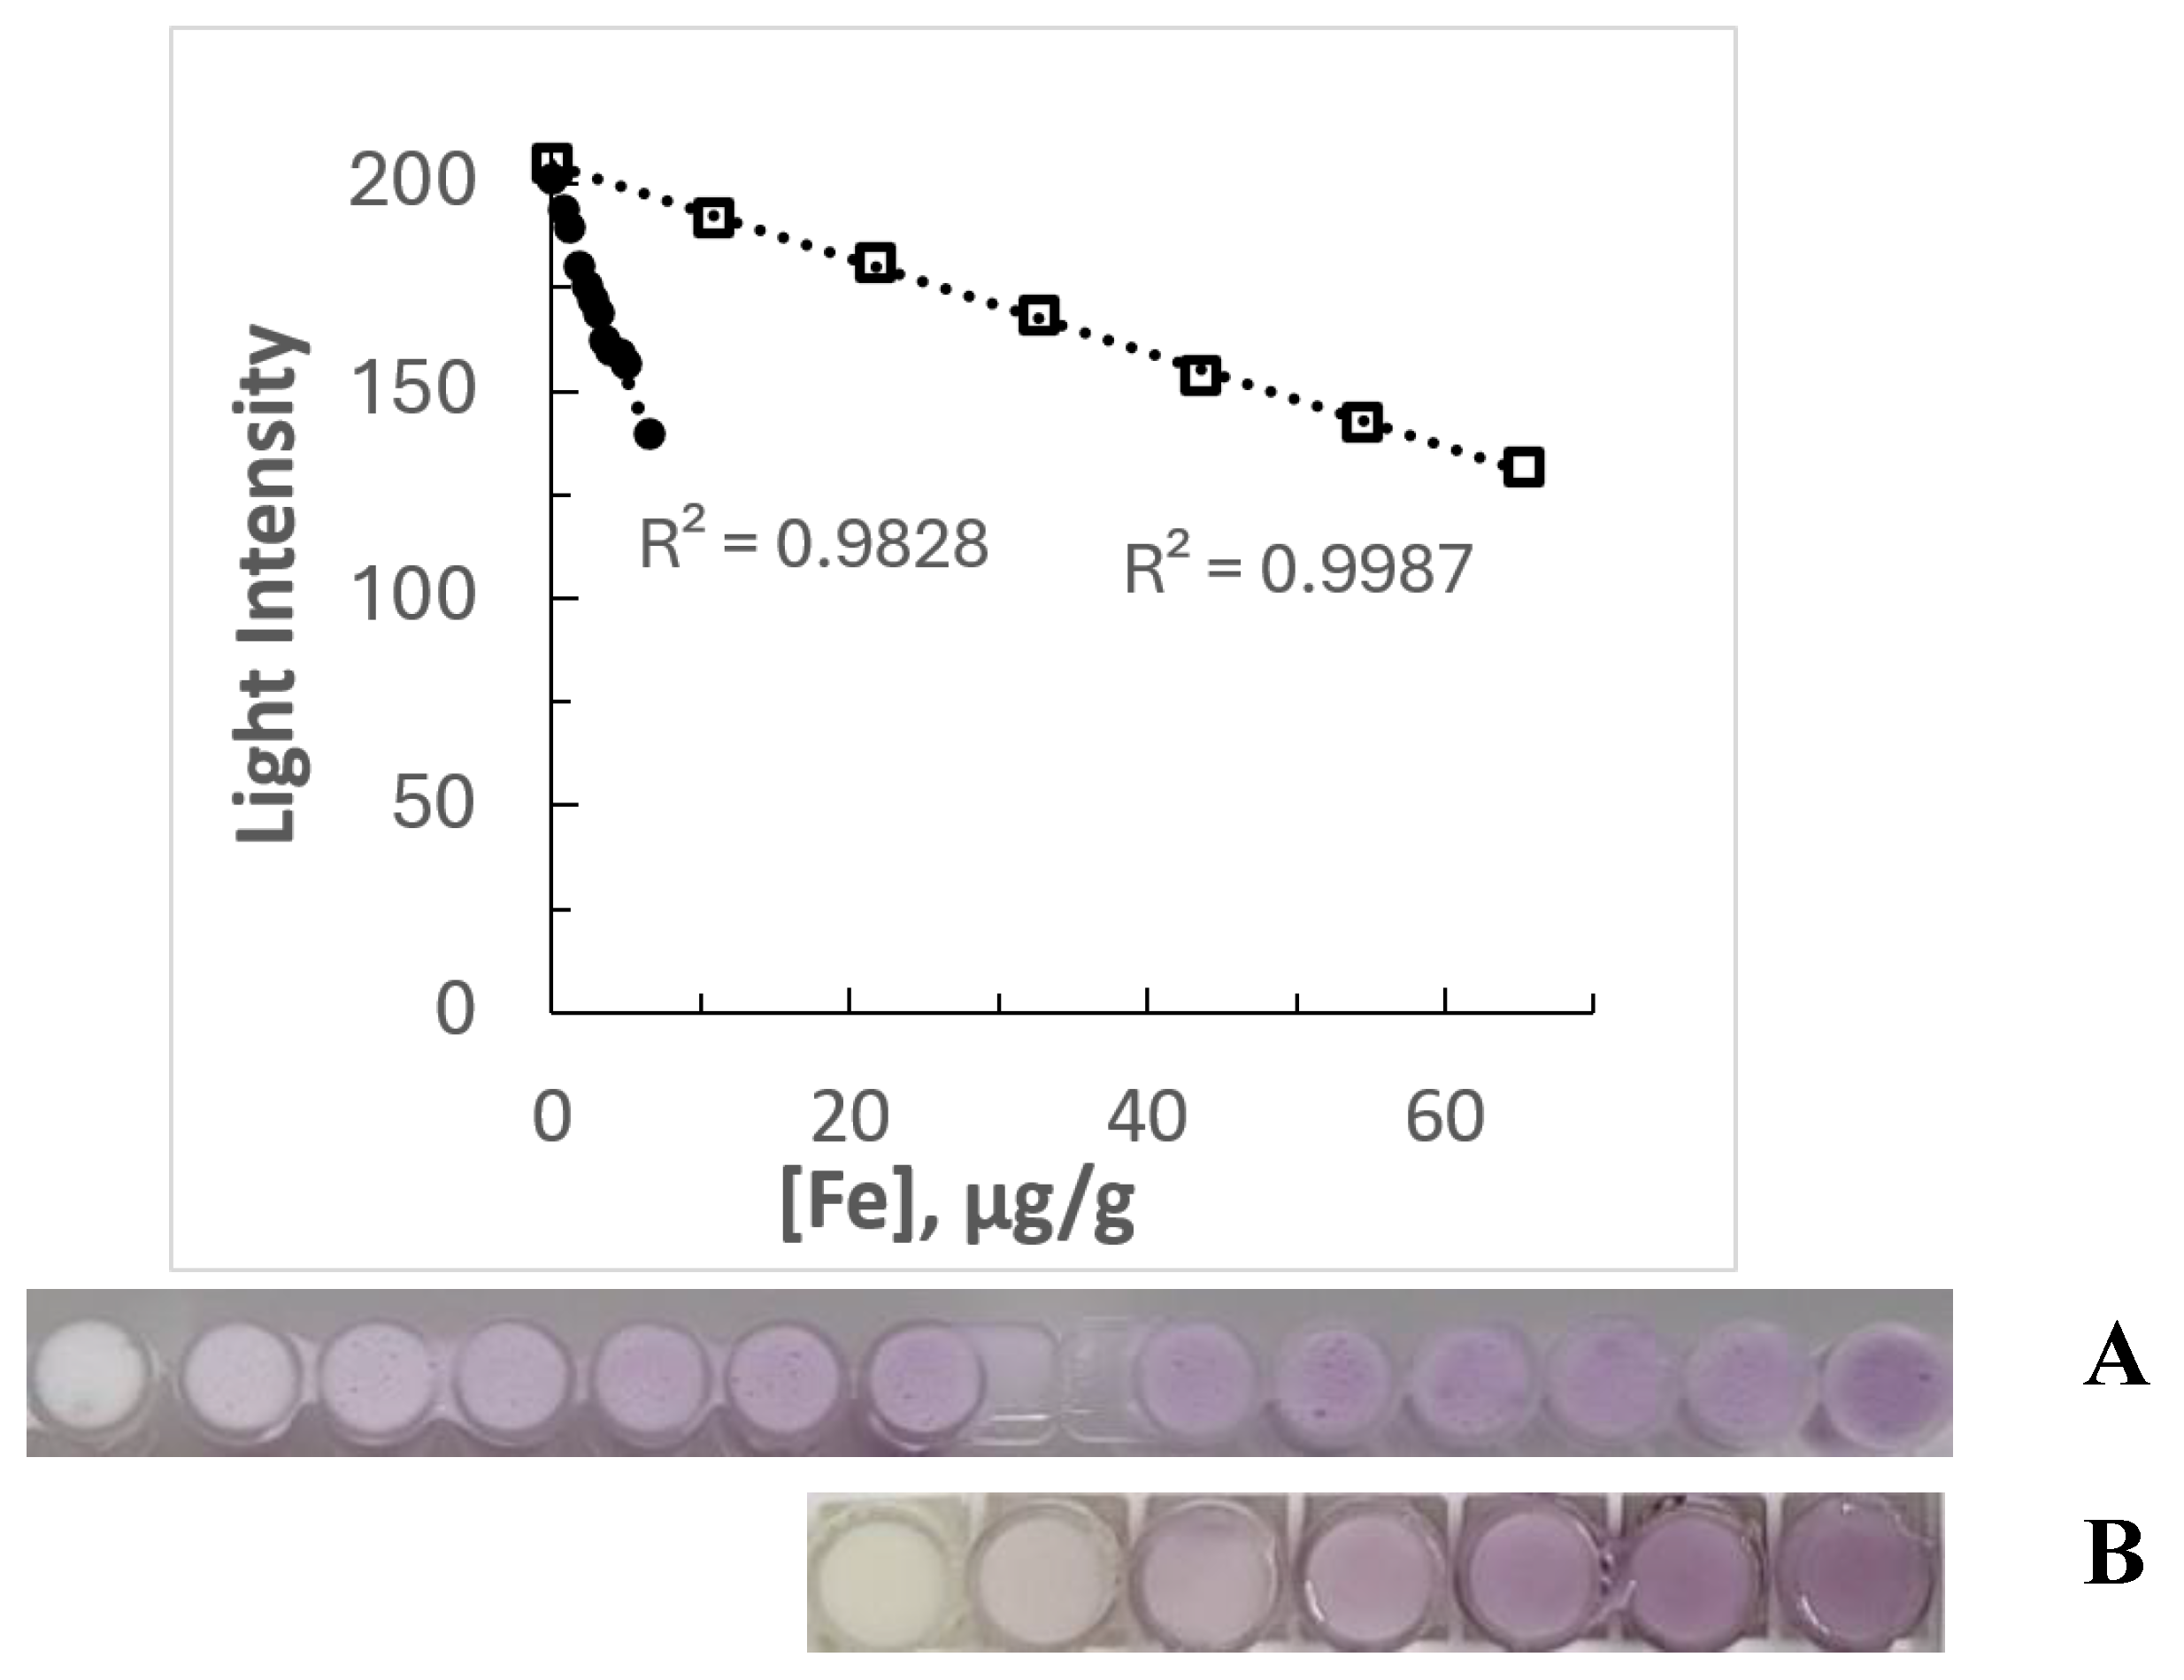
Figure 5.
Effect of interferent on the iron-dependent decrease in reflected light intensity in a cosmetic emulsion. The decrease in reflected light intensity attributable to iron (Δintensity) was calculated as the difference between the light intensity of the no-iron control and that of the iron-containing emulsion: Δintensity = intensity no-Fe control - intensity Fe sample. Δintensity was expressed relative to that of the emulsion where no interferent was added, with the Δintensity value for the no-interferent control defined as 100 %. The assay performed in BC emulsion containing 18 μg Fe(III)/g emulsion and a potential interferent at commercially relevant or deliberately elevated challenge concentration. Data represent the average of at least three replicate experiments, with error bars denoting one standard deviation. Abbreviations and corresponding concentrations (% w/w): No: no interferent, EDTA: ethylenediaminetetraacetic acid disodium salt (1.0 %), SG: sodium gluconate (1.3 %), SB: sodium benzoate (0.5 %), PS: potassium sorbate (1.5 %), LA: lactic acid (0.25 %); AA: acetic acid (0.25 %); CA: citric acid (2.0 %); FA: fatty acids mixture (1.0 %); NaCl (0.74 %); KCl (0.95 %); MgSO4* 7H2O (2.1 %); CaCl2 *2H2O (1.9 %); ZnSO4* 7H2O (2.4 %); Na2SO4 (0.9 %).
Figure 5.
Effect of interferent on the iron-dependent decrease in reflected light intensity in a cosmetic emulsion. The decrease in reflected light intensity attributable to iron (Δintensity) was calculated as the difference between the light intensity of the no-iron control and that of the iron-containing emulsion: Δintensity = intensity no-Fe control - intensity Fe sample. Δintensity was expressed relative to that of the emulsion where no interferent was added, with the Δintensity value for the no-interferent control defined as 100 %. The assay performed in BC emulsion containing 18 μg Fe(III)/g emulsion and a potential interferent at commercially relevant or deliberately elevated challenge concentration. Data represent the average of at least three replicate experiments, with error bars denoting one standard deviation. Abbreviations and corresponding concentrations (% w/w): No: no interferent, EDTA: ethylenediaminetetraacetic acid disodium salt (1.0 %), SG: sodium gluconate (1.3 %), SB: sodium benzoate (0.5 %), PS: potassium sorbate (1.5 %), LA: lactic acid (0.25 %); AA: acetic acid (0.25 %); CA: citric acid (2.0 %); FA: fatty acids mixture (1.0 %); NaCl (0.74 %); KCl (0.95 %); MgSO4* 7H2O (2.1 %); CaCl2 *2H2O (1.9 %); ZnSO4* 7H2O (2.4 %); Na2SO4 (0.9 %).
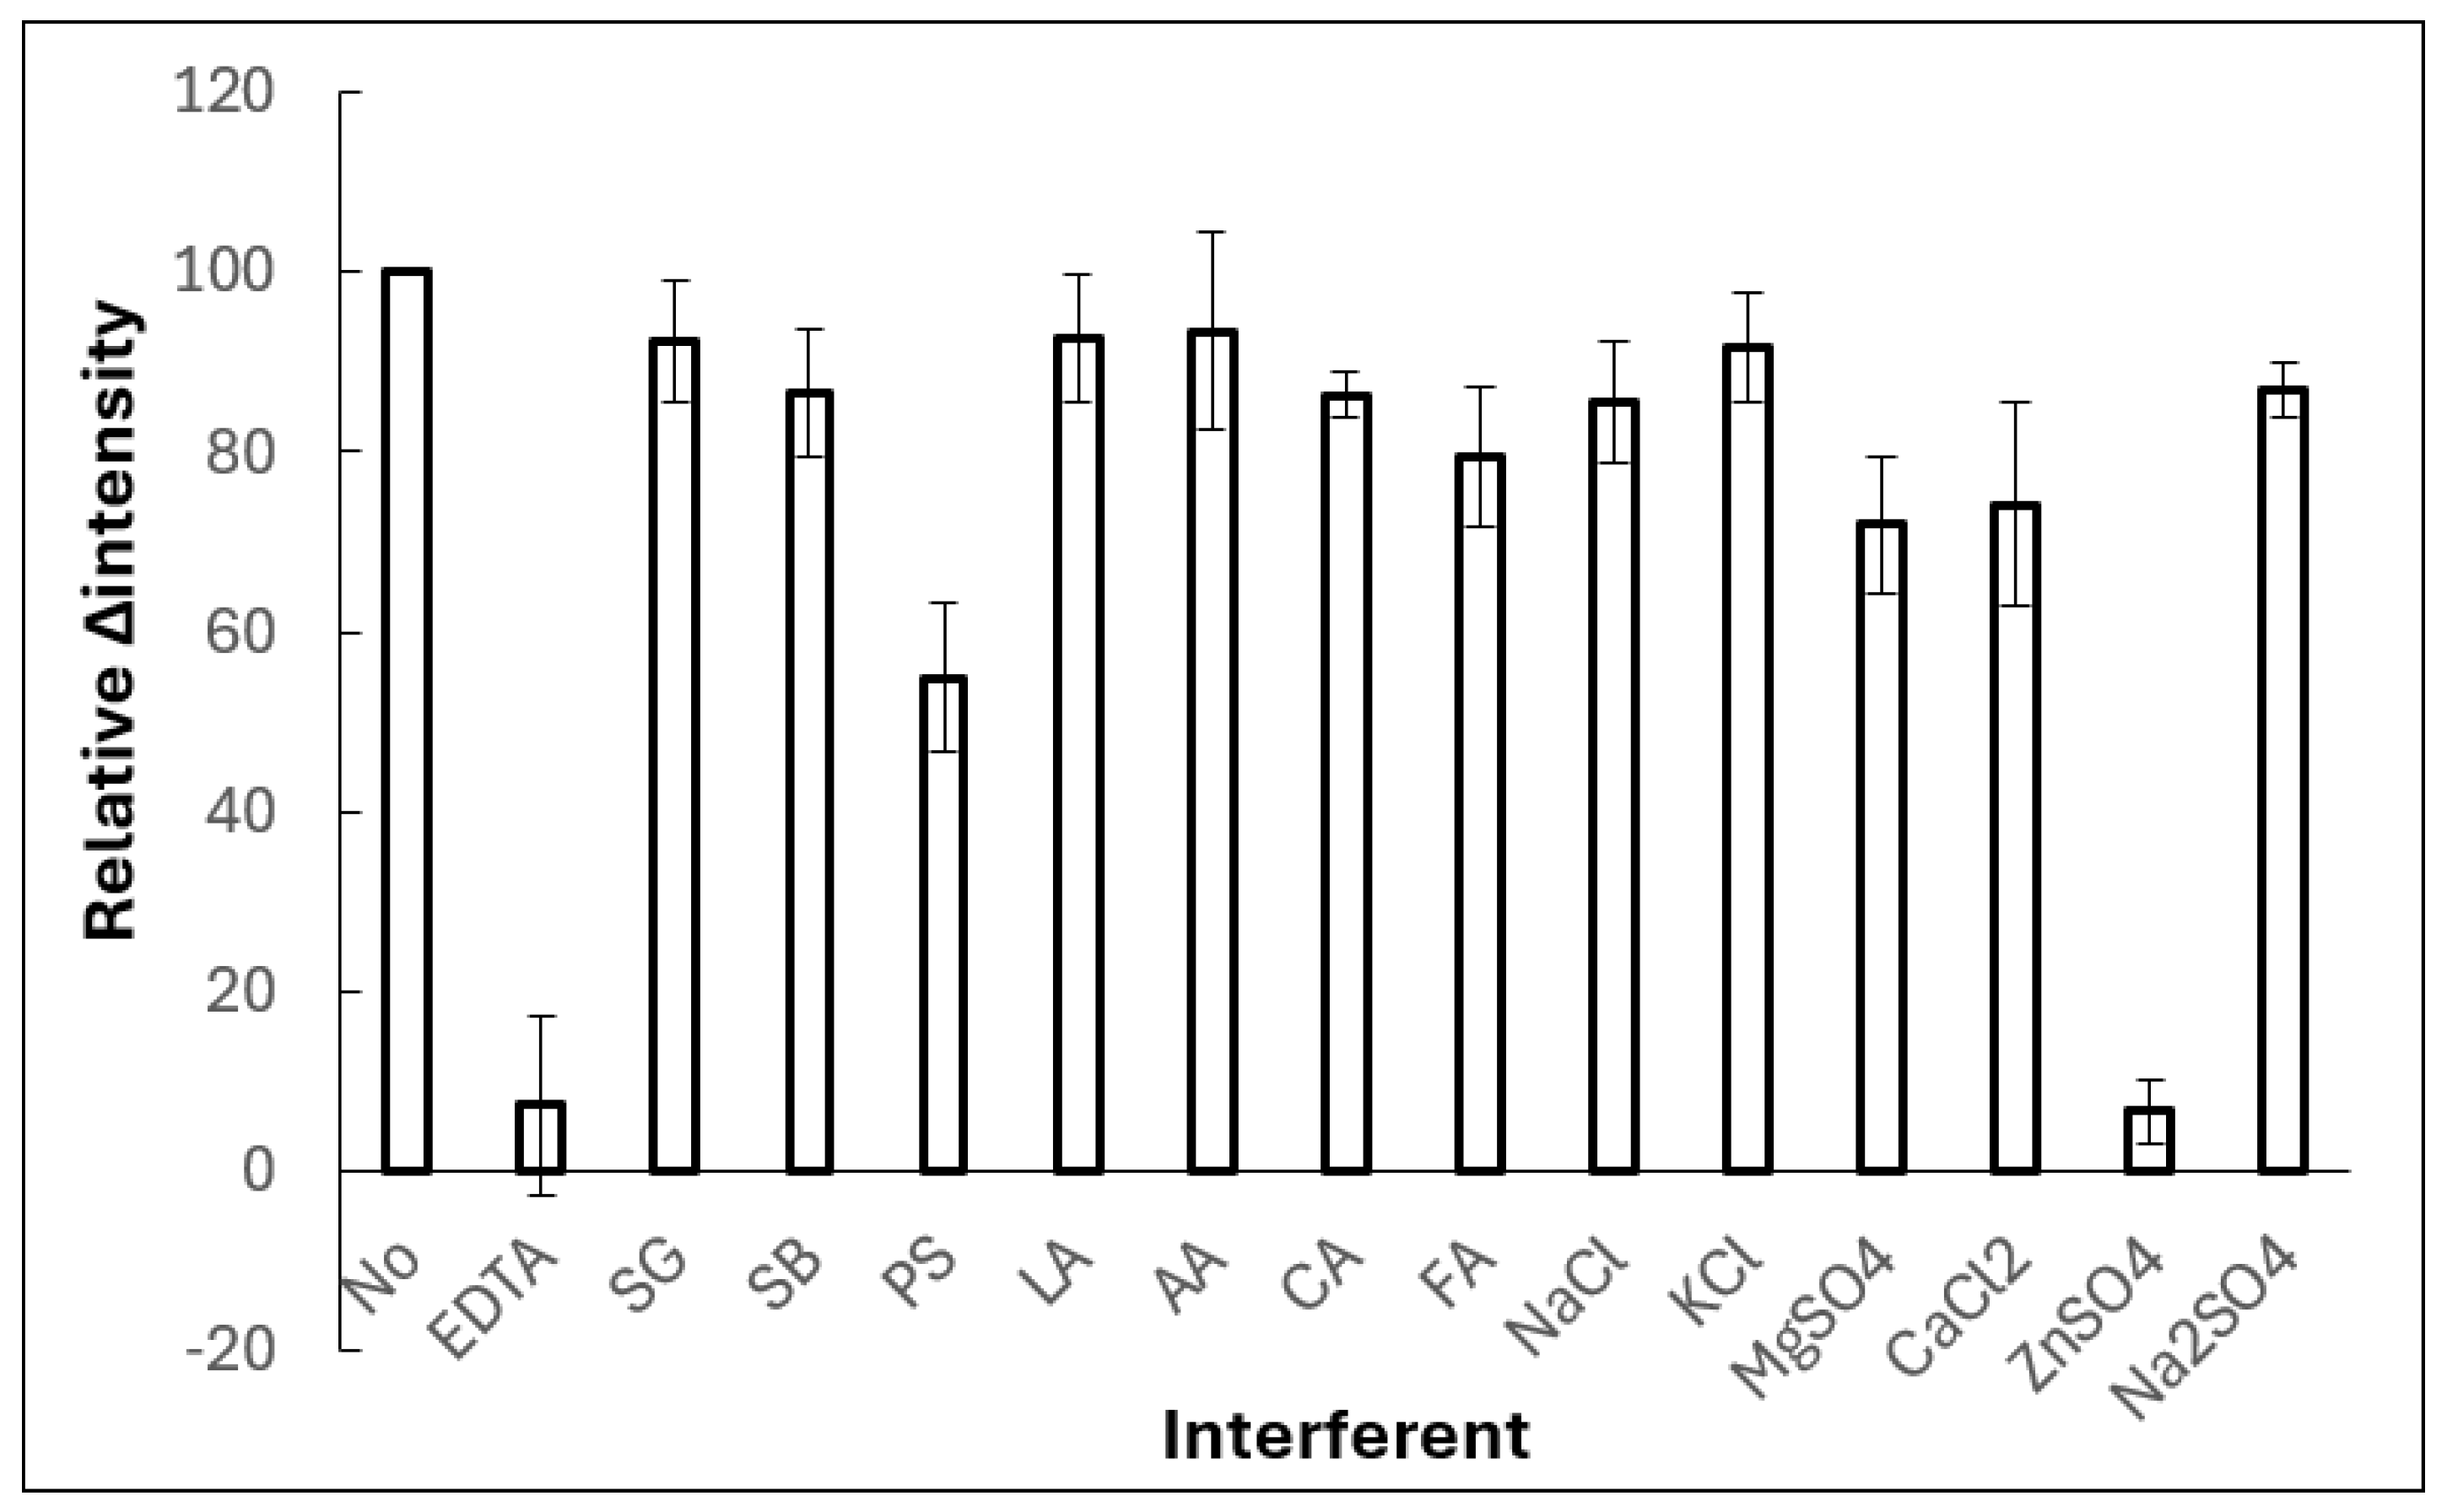
Figure 6.
Linear relationship between the XRF signal/surface density and the spiked iron concentration in emulsion samples.
Figure 6.
Linear relationship between the XRF signal/surface density and the spiked iron concentration in emulsion samples.
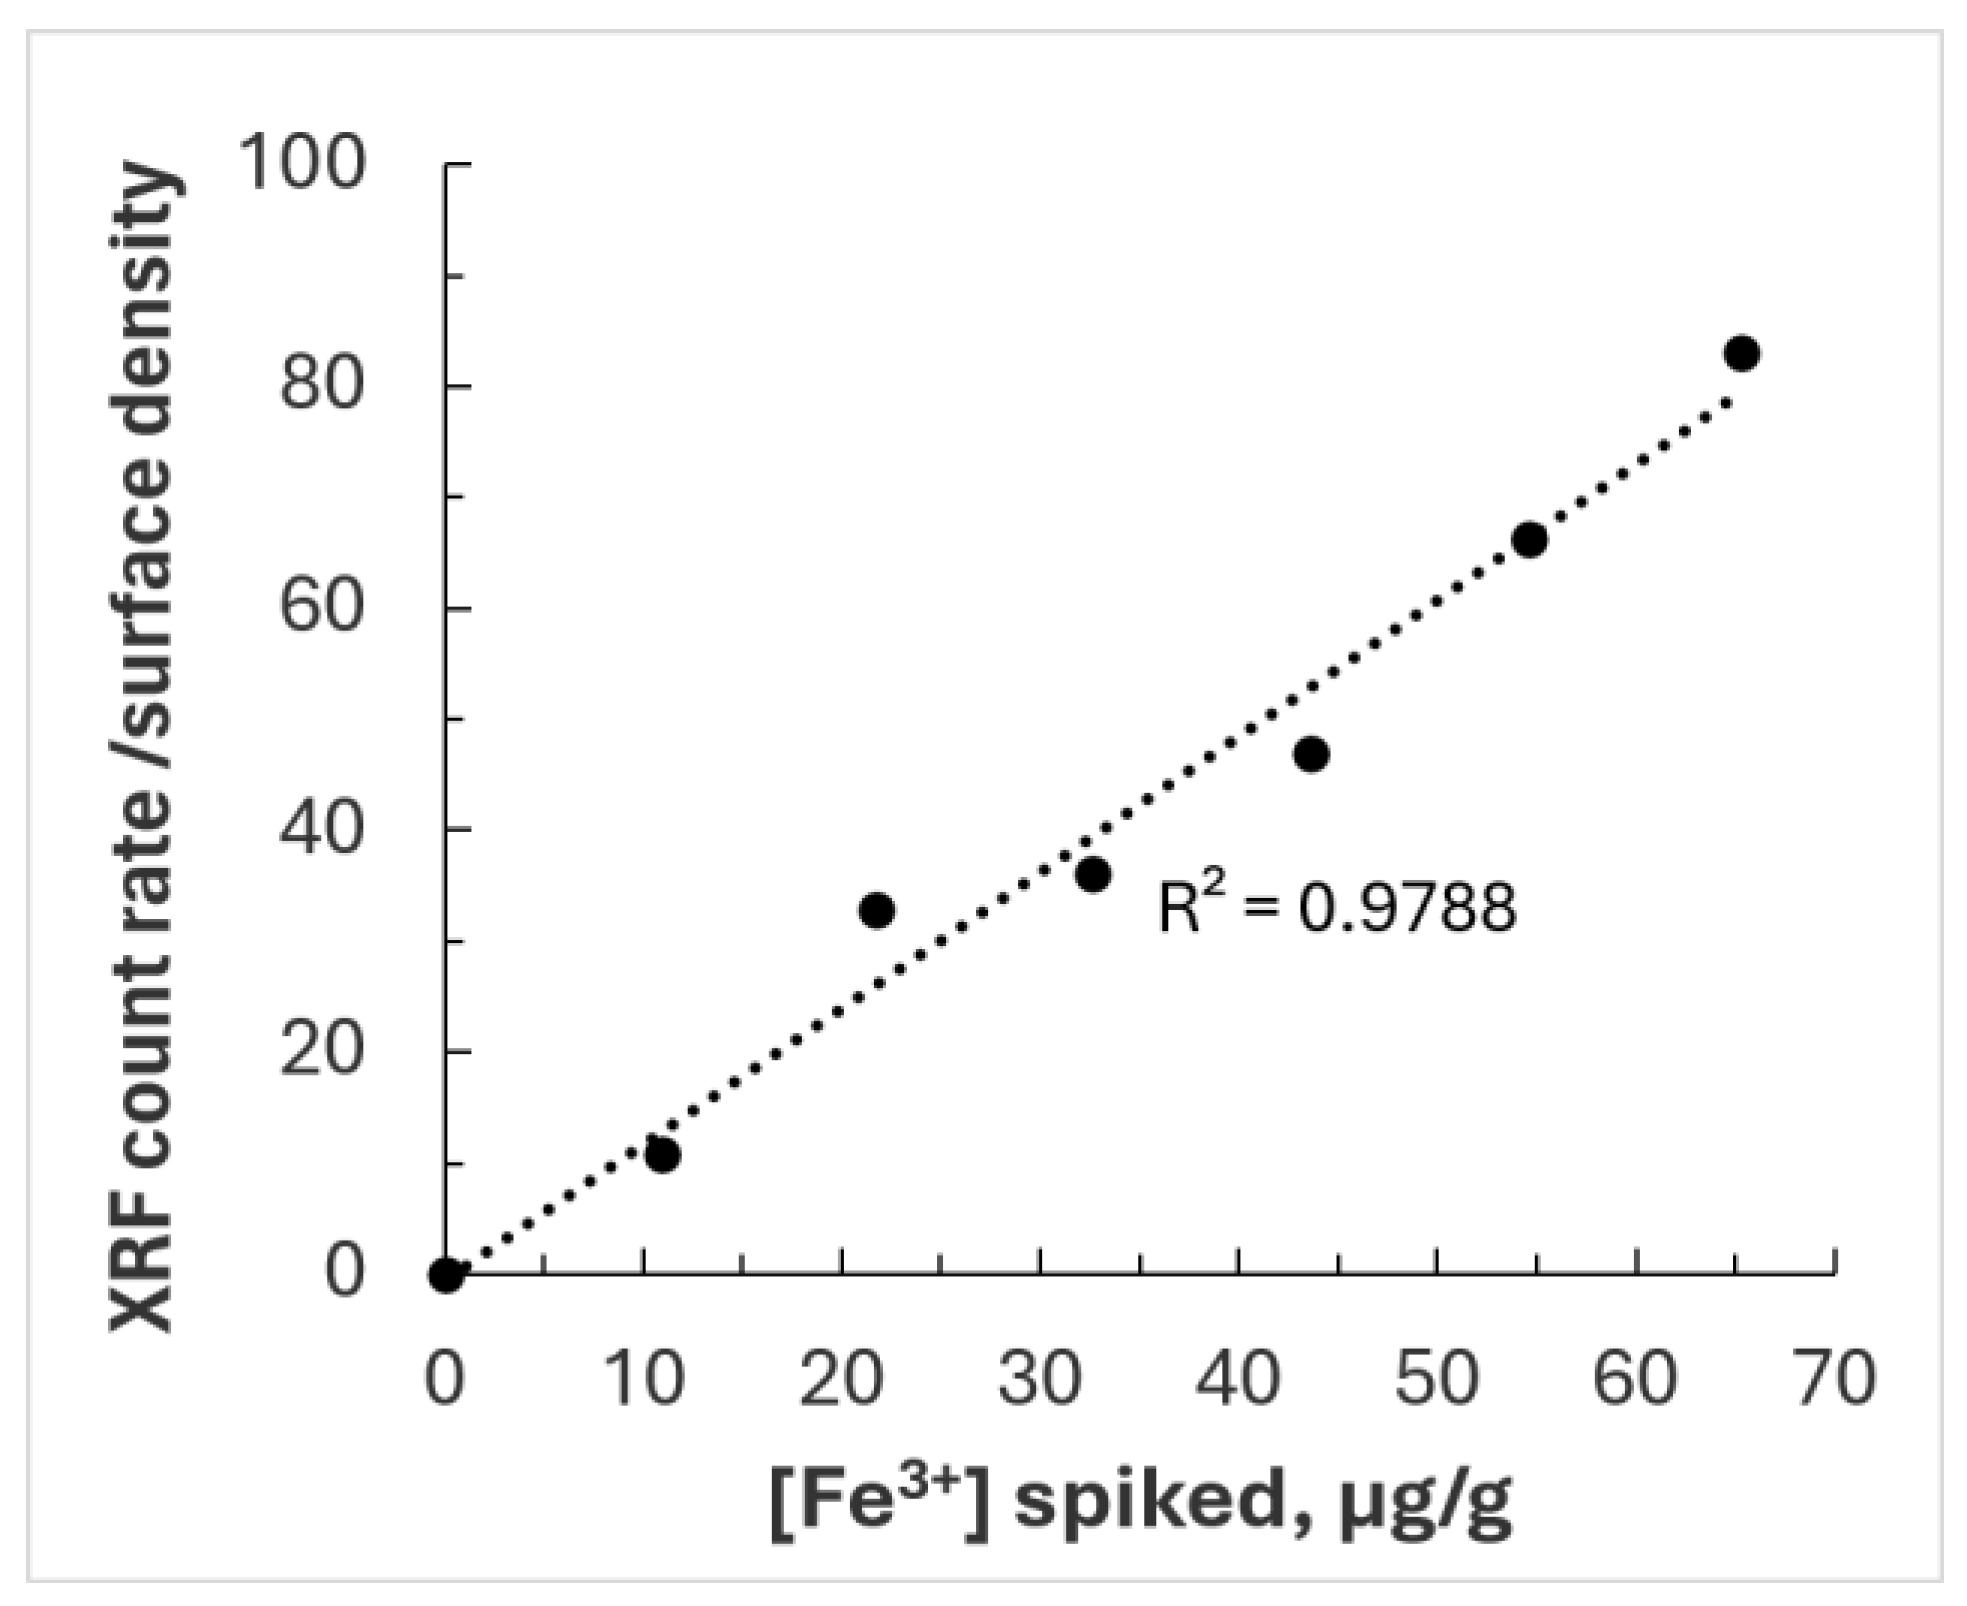
Figure 7.
Linear correlation between iron levels in QC emulsion samples determined by the proposed colorimetric method and the XRF reference method.
Figure 7.
Linear correlation between iron levels in QC emulsion samples determined by the proposed colorimetric method and the XRF reference method.
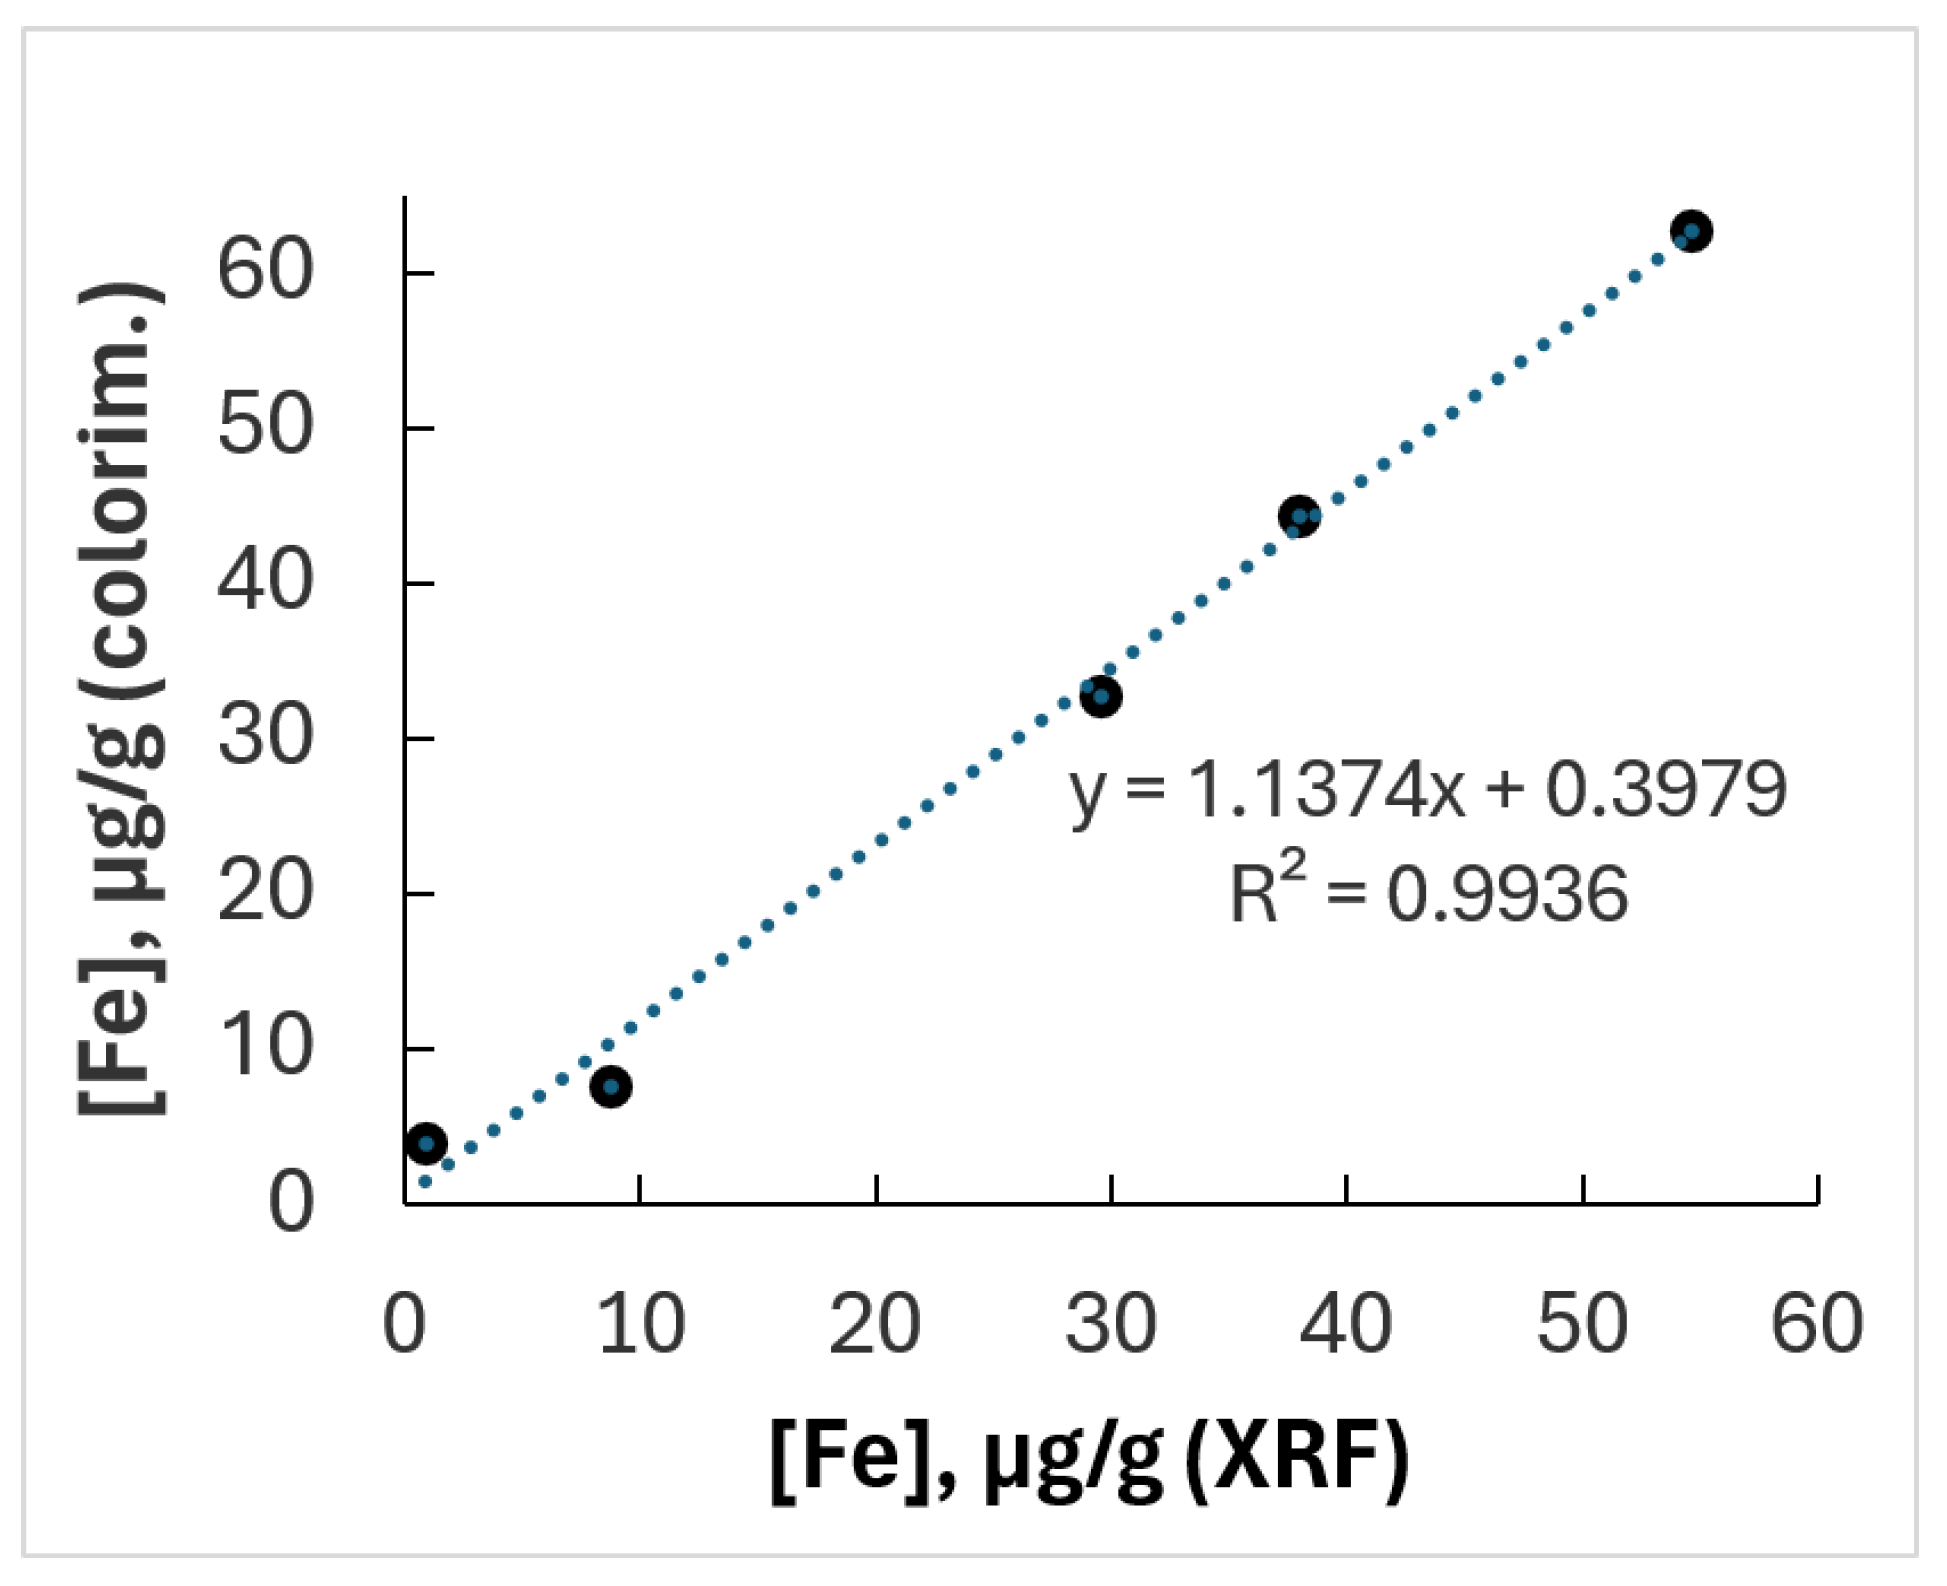

Table 1.
Technical characteristics of the proposed assay for aluminum quantification directly in quality control emulsions.
Table 1.
Technical characteristics of the proposed assay for aluminum quantification directly in quality control emulsions.
| Intermediate precision | Accuracy | Linearity | ||||
|---|---|---|---|---|---|---|
| Mean [Al], μg/g | CV % (n) | Measured [Al], μg/g | Spiked [Al], μg/g | Relative bias % | R2 | Linear range μg/g |
| 53.9 | 19.5 (n=2) | 53.9 | 51.5 | +4.5 | ≥0.971 | 0-196 |
| 99.4 | 9.4 (n=3) | 99.4 | 97.4 | +2.0 | Useful analytical range,μg/g | |
| 137.2 | 9.3 (n=4) | 137.2 | 129.9 | +5.6 | ||
| 178.3 | 5.4 (n=4) | 178.3 | 194.9 | -8.5 | ||
| 13,919 | 7.1 (n=4) | 13,919 | 13,695 | +1.7 | 52-196 | |
n represents independent analytical determinations of the QC sample
Table 2.
Accuracy of the proposed assay for aluminum quantification directly in commercial antiperspirants.
Table 2.
Accuracy of the proposed assay for aluminum quantification directly in commercial antiperspirants.
| Matrix | Antiperspirant lotion 1 | Antiperspirant cream | Antiperspirant lotion 2 | ||
|---|---|---|---|---|---|
| Nominal formulation [Al], mg/g | 13.70 | 9.14 | 9.14 | 10.88 | 9.14 |
| R2 | ≥0.967 | 0.995 | ≥0.967 | 0.967 | 0.995 |
| Relative bias % | -6.81 (n=2) | +15.18 (n=1) | +8.76 (n=3) | + 8.00 (n=1) | -2.55 (n=1) |
n represents independent analytical determinations of the sample
Table 3.
Technical characteristics of the proposed assay for ascorbate-reducible, ferrozine-reactive iron quantification directly in quality control emulsions.
Table 3.
Technical characteristics of the proposed assay for ascorbate-reducible, ferrozine-reactive iron quantification directly in quality control emulsions.
| Intermediate precision | Accuracy | Linearity | ||||
|---|---|---|---|---|---|---|
| Mean [Fe], μg/g | CV % (n) | Measured [Fe], μg/g | Spiked [Fe], μg/g | Relative bias % | R2 | Linear range, μg/g |
| 1.29 | 20.3 (n=6) | 1.29 | 1.25 | + 3.4 | ≥0.981 | 0-6.86 |
| 2.02 | 12.6 (n=4) | 2.02 | 1.87 | +7.9 | ||
| 2.84 | 6.9 (n=6) | 2.84 | 2.50 | +13.7 | Useful analytical range,μg/g | |
| 4.09 | 5.9 (n=6) | 4.09 | 3.74 | +9.2 | ||
| 4.63 | 4.2 (n=6) | 4.63 | 4.78 | -3.3 | ||
| 5.04 | 4.8 (n=6) | 5.04 | 5.20 | -3.0 | 1.87-6.86 | |
| 6.39 | 6.7 (n=4) | 6.39 | 6.86 | -6.9 | ||
| 45.1 | 12.2 (n=6) | 45.1 | 41.7 | +8.3 | ||
n represents independent analytical determinations of the QC sample
Disclaimer/Publisher’s Note: The statements, opinions and data contained in all publications are solely those of the individual author(s) and contributor(s) and not of MDPI and/or the editor(s). MDPI and/or the editor(s) disclaim responsibility for any injury to people or property resulting from any ideas, methods, instructions or products referred to in the content. |
© 2026 by the authors. Licensee MDPI, Basel, Switzerland. This article is an open access article distributed under the terms and conditions of the Creative Commons Attribution (CC BY) license (http://creativecommons.org/licenses/by/4.0/).
Copyright: This open access article is published under a Creative Commons CC BY 4.0 license, which permit the free download, distribution, and reuse, provided that the author and preprint are cited in any reuse.