

Submitted:
03 September 2026
Posted:
04 September 2026
You are already at the latest version
Abstract
The natural gas distributed energy system can achieve the purpose of energy saving and emission reduction with the stepped supply of the combined cooling heating and power, but as a new type of clean energy supply mode, the reasonable benefit in the process of its promotion needs to be estimated. In this paper, the comprehensive evaluation for the applicability of the natural gas distributed energy system was carried out from features such as economic and environment, the applicability evaluation indicator system was built and the semantic classification of the evaluation levels was determined. Then, the weight of each indicator was calculated by the analytic hierarchy process and the applicability level was determined by the set pair analysis theory. Finally, a hotel in Xi’an, Shaanxi province, was taken as an example to evaluate and the results were compared with traditional energy supply methods. The following research results were obtained. First, the comprehensive evaluation result is high availability, and the economy and environment are the key influence factors for the applicability of the natural gas distributed energy system. Second, compared with the traditional energy supply method, the efficiency of energy conservation and emission reduction is remarkable, and the advantages of clean energy and stepped supply method are reflected. Third, the distributed energy system has obvious economical effect, especially in low price areas of natural gas. It is concluded that the research results provide a more scientific decision-making method and the reference for the promotion and application of the natural gas distributed energy system.
Keywords:
natural gas distributed energy system
; applicability
; indicator system
; set pair analysis
; comprehensive evaluation
; energy saving and emission reduction
; economic benefits
1. Introduction
With the depletion of traditional energy and the slow construction of new energy system, the energy short supply has become the bottleneck of economic and ecological development in all countries. At present, the main solution is to improve the utilization rate of conventional energy and promote the use of clean energy. Natural gas distributed energy system is a new technology proposed to solve the problem of energy shortage, and has been popularized because it greatly improves energy utilization and reduces environmental pollution [1]. Natural gas distributed energy system is to install the energy supply system on the user location, and uses natural gas as the fuel to supply energy in CCHP (Combined cooling, heat and power) method according to the user’s demand. The system construction saves the investment of power grid and pipe network, achieves the purpose of environmental protection and efficient utilization in operation, and meanwhile, the system has good economic benefits [2]. Natural gas distributed energy system is still in the initial stage of policy formulation and strategic planning in China, and the theoretical research and practical application are not very extensive.
At present, countries with great environmental protection and higher energy utilization efficiency are more extensive to the promotion and application for distributed energy system. As the energy shortage, in order to ensure the sustainability of energy supply, developed countries have stepped up the construction of distributed energy system. The United States is the first country in the world to develop distributed energy system, and the distributed energy system mainly used is the mode of combined cooling, heating and power driven by natural gas. In order to stimulate the development of distributed energy system, the U.S. government has issued a series of supporting policies, such as tax relief and grid connection. Among the European countries, Denmark is recognized as a country with sustainable development. Its economic development, energy consumption and environmental protection have been organically combined and distributed energy system accounts for 53% of the total domestic power generation in Denmark [3]. As Denmark has adopted a series of incentive policies and vigorously advocated the development of distributed energy, the energy consumption has basically not increased and environmental pollution has not intensified under the premise of doubling its gross national product. In other European countries, Germany mainly uses small-scale cogeneration system, and its natural gas distributed energy system has ranked first in Europe, accounting for 25% of the total power generation of the whole country [4]. In Asia, due to the lack of resources, Japan pays special attention to the methods of improving energy utilization. Therefore, the distributed energy system development in Japan is earlier and the technology is advanced. Japan’s distributed energy system mainly focuses on miniaturized cogeneration and solar photovoltaic power generation. In 2004, Japan issued a long-term energy plan, emphasizing the development of distributed energy in the future. It is estimated that the installed capacity of distributed energy system will reach 16.3 million kW by 2030, and the power generation capacity will reach 20% of the total domestic power generation [5]. After the Fukushima nuclear crisis, Japan is more inclined to develop miniaturized household combined heat and power system, and small-scale natural gas distributed energy system has been widely promoted.
In China, the development of natural gas distributed energy system began at the end of the 20th century, and is still in its infancy. At present, the distributed energy systems build in China are concentrated in economically developed cities, and the application objects include university town, hotel, office building, hospital, airport, etc. [6]. As China’s primary energy consumption is still dominated by coal and the proportion of clean energy consumption is still relatively low [7]. Based on the present condition of China’s energy resources, and the consideration economic development and energy independence, the Chinese government has formulated the strategic plan for the use of clean energy (Figure 1), clean energy will be the main part of China’s energy consumption in the future. Therefore, in order to restrain environmental degradation and maintain the sustainable development of social economy, the research on natural gas distributed energy system has important practical significance.
At present, distributed energy system is widely used in residential buildings [8], office buildings [9], commercial buildings [10], hotels [11], hospitals [12], etc. Wu [13] studied the technology characteristics and prime mover configurations of distributed energy system, and emphasized the importance of the choice for prime mover. Hajabdollahi [14] selected gas engine as prime mover, compared operation strategies of variable electric cooling ratio and constant electric cooling ratio under different climates, and selected the optimum CCHP equipments by maximizing the Relative Annual Benefit (RAB) as objective function. Wang [15] introduced the compression refrigerator on the basis of conventional system configuration, it can improve the energy efficiency ratio (EER) of the refrigeration unit, and also can balance the heat-electricity ratio of the system. Bischi [16] added heat storage device into distributed energy system, and put forward the optimization model for short-term operation of CCHP system. Mago [17] puts forward the parallel operation method of heat and power, the method can switch the operation mode at any time according to the change of the user’s demand load. The whole system does not generate excess energy, and the insufficient power demand or thermal demand is supplemented by the power grid or gas-fired boiler. Liu [18] proposed an operation strategy combined with the hybrid chiller, the electric cooling to cool ratio of the system varies with the different electrical load and heat load in every hour. For the system optimization, Ershadi [19], Glavan [20], Boyaghchi [21] and Ebrahimi [22] studied the optimization model of distributed system from energy saving, economy, environment and exergy efficiency respectively. Linear methods were used for distributed energy system optimization in early stage. Kiarashaki [23] established a linear optimization model based on the capital cost of the system, studied the impact of electricity buyback on operating cost and conducted the sensitivity analysis of some important parameters. Yuan [24] used the mixed integer nonlinear programming (MINLP) algorithm to study the impact of part-load characteristics on economic dispatch of the system. With the development of distributed energy system, intelligent algorithms were widely used in system optimization. Tichi [25] built a nonlinear optimization model according to the cost and payback period of the system, and applied particle swarm optimization algorithm to solve the model. Sanaye [26] used genetic algorithm (GA) and particle swarm optimization (PSO) to calculate the maximum actual annual benefit (AAB), and realized optimization for CCHP system.
However, the existing research mainly focuses on system configuration, operation modes and system optimization methods, and few researches on the applicability evaluation for the system. As for the applicability of natural gas distributed energy system, it is necessary to consider various factors for different application objects, combining with quantitative criteria and methods for comprehensive evaluation. The structure of natural gas distributed energy system is complex, its energy efficiency, economy, environmental protection and other characteristics interact each other, and difficult to evaluate the applicability.
Based on the analysis of characteristic for natural gas distributed energy system, the applicability evaluation system of the natural gas distributed energy system is constructed from the five dimensions of economy, energy efficiency, environment, reliability and energy quality. Considering the cross correlation influence of evaluation indicators, the set pair analysis theory is applied to establish the applicability evaluation model with AHP and eigenvalue judgment method. Finally, an example is given to show the practicability of the model.
2. Applicability Evaluation System of Gas Distributed Energy System
First of all, the basis of applicability evaluation is to establish the evaluation system, including evaluation indicators and evaluation levels.
2.1. Evaluation Indicators
Based on the research data and operation experience, this paper considers the material flow, capital flow and energy flow of the natural gas distributed energy system, and selects the evaluation indicators that affect the applicability, and then establishes the applicability evaluation indicator system with 5 primary indicators and 14 secondary indicators, as shown in Figure 2.
In the first-level indicator layer, economic indicator set reflects information on equipment investments and energy costs of natural gas distributed energy system from the capital flow. Energy efficiency indicator set shows thermodynamic properties of gas distributed energy system directly from energy flow, and also reflects main process of system, energy utilization and energy efficiency level of equipment. Environment indicator set includes the compulsory control index of the national environmental protection policy to the system emission. Reliability indicator set expresses the reliability of system energy supply, including planned outage factor, unplanned outage factor, unit derated factor and equivalent availability factor. Energy quality indicator set measures the availability of system energy by using second law of thermodynamics.
In the second-level indicator layer, the initial equipment investment is the total investment cost of the initial hardware and equipment of the natural gas distributed energy system. The payback period is the years required for the total income to reach the total investment after the system is put into operation. Financial internal rate of return is the discount rate when the sum of the present values of the annual net cash flows equals to zero in the whole system calculation period. Primary energy efficiency is the ratio of system output energy to primary energy consumption. Waste heat utilization efficiency is the proportion of waste heat resources that can be recycled by the system to the total waste heat resources. Relative energy saving ratio is the ratio of the energy saved by the system to the energy consumption of traditional energy supply systems such as thermal power generation systems and coal-fired boilers. Planned outage factor is the ratio of the planned outage hours of the system to the hours in the statistical period. Unplanned outage factor is the ratio of unplanned outage hours to the statistical hours. Unit derated factor is the percentage of equivalent unit derated hours of the system in a given time to the given time. Equivalent availability factor is the ratio of system available hours minus the equivalent unit derated hours to the statistical hours. Exergic efficiency is to the conversion, utilization and loss of exergy in the system. Exergic utilization of waste heat is exergic efficiency of system recycled waste heat resources. Meanwhile, the pollutants of the system are mainly NOx and CO2, and these pollutants are mainly produced by gas turbines and gas-fired boilers.
2.2. Evaluation Levels
For the classification of evaluation levels, usually the more levels, the more accurate the final evaluation results will be. However, too many evaluation levels make the evaluation work complex and also lead to difficult ideographic understanding. American psychologist George Miller [27] has proved that human can effectively distinguish the number of between 5 and 9 when discriminating the amount things, and have a greater sensitivity to odd numbers than even numbers. Therefore, based on the Fourteenth Five-Year Plan of China-Comprehensive Work Plan for Energy Saving and Emission Reduction, the applicability of the natural gas distributed energy system is divided into five evaluation levels and the explanations as following:
Level I: Compared with power transmission and energy supply methods, the energy saving, emission reduction effect and economic benefits are very considerable (e.g., standard coal can save energy more than 15%, and the investment payback period is less than 5 years);
Level II: Compared with power transmission and energy supply methods, the energy saving and emission reduction effect are very considerable, and economic benefits are acceptable (e.g., standard coal can save energy more than 15%, and the investment payback period is more than 5 years);
Level III: Compared with power transmission and energy supply methods, the energy saving, emission reduction effect and economic benefits are acceptable (e.g., standard coal can save energy by 0-15%, and the investment payback period is more than 5 years);
Level IV: Compared with power transmission and energy supply methods, there is no obvious advantage in energy saving, emission reduction effect and economic benefit (e.g., standard coal only can save energy by 0-5% and low return on investment), and the system requires continuous policy subsidies to keep operation.
Level V: The energy saving, emission reduction effect and economic benefit are far less than the traditional energy supply method.
3. Applicability Evaluation Model for Gas Distributed Energy System
3.1. Theoretical Basis of Set Pair Analysis Method
Zhao keqin [28] proposed the set pair analysis method for uncertain systems problem, and the method is a mathematical analysis theory to establish the relational degree expression for the interaction between two sets. Its key idea is to take the certainty and uncertainty between sets as a system, the certainty and uncertainty are interrelated and influenced in this system, and could be transformed under certain conditions [29]. Therefore, the set pair analysis method is particularly suitable for evaluating indicators with cross correlation. In this paper, the applicability of distributed natural gas energy system is comprehensively evaluated by using set pair analysis, the mathematical expression is as follows:
(1) Assuming M and N are two sets, and defining the set pair H = (M, N), and the relational degree is defined as:
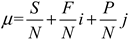 where μ is the relational degree; N is the total number of characteristic included in the set pair, S is the common characteristic number of two sets, P is the opposite characteristic number and F is the characteristic number that neither common nor opposed. S/N, F/N, and P/N are called the identity degree, the difference degree and opposition degree respectively, and they satisfy the constrained equation: S/N + F/N + P/N =1,where i∈[0,1] is the coefficient of difference degree, and j= -1is the coefficient of opposition degree.
(2) Because almost all systems have certainty and uncertainty information, the difference degree is usually expanded according to the background of the problem need to be solved:
 whereF1,F2,…,Fm is the characteristic number that neither common nor opposed in different levels of the two sets.
(3) Since the system contains multiple evaluation indicators and the influence effect of each indicator is different. Therefore, set pair analysis of identity degree, the difference degree and opposition degree for each evaluation indicator in the system is carried out, and obtained the relational degree of each indicator. In order to reflect the influence of all evaluation indicators comprehensively, it is necessary to consider the weight to calculate the average relational degree μa:
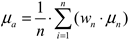 where n is the indicator numbers and wn is the weight.
3.2. Indicator Weight Calculation Method Based on AHP
According to the set pair analysis theory, we know that an important factor influencing the average relational degree is the indicator’s weight, and the weight accuracy is directly affects the final evaluation result accuracy. In this paper, the analytic hierarchy process (AHP) is applied to calculate the weight. By analyzing the final evaluation target, AHP method breaks it down into different impact indicators, and constructs the indicators into a multi-level analysis structure model according to the relevance and subordination among the indicators. The relative importance matrix is established by comparing two indicators at each level, and the weight of indicators was finally obtained [30]. The calculation steps are as follows:
(1) Construction of judgment matrix.
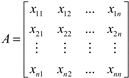 where A is the judgment matrix, xij is the importance of indicator i to indicator j, i,j=1,2,3…,n. The judgment scales are defined as shown in Table 1.
(2) Calculation of the largest eigenvalue. According to the judgment matrix, calculating the largest eigenvalue as:
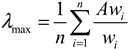 with
with
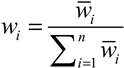
 where λmax is the largest eigenvalue, wi is the ith indicator weight,
  is the geometric mean of the values of each row in the judgment matrix.
is the geometric mean of the values of each row in the judgment matrix.(3) Consistency testing. Whether the obtained weights are reasonable or not requires further consistency test to the judgment matrix:
where CR is the consistency index of the judgment matrix, RI is the mean random consistency index as shown in Table 2, CI is the general consistency metrics defined by:
CR = CI/RI
CI = (λmax-n) / (n-1)
If CR< 0.1, the judgment matrix is considered to have satisfactory consistency; otherwise the judgment matrix needs to be adjusted appropriately until CR< 0.1 is satisfied.
3.3. Calculation Method of Applicability Level
For the judgment of the final applicability evaluation level, the principle of maximum membership [31] is usually used to select the level that the maximum value belonged to. This judgment method is intuitive, but in practice, it is found that the influence of other relational degrees on the evaluation results cannot be ignored.
It is assumed that the identity, the difference, and opposition degree in the average relational degree are expressed as a、b1、b2、…、bN-2、c respectively,
Define the maximum value vmax as:
with
vmax= max{a、b1、b2、…、bN-2、c}
vmax≤ ∑{a、b1、b2、…、bN-2、c}-vmax
We can obtain:
vmax≤0.5∑{a、b1、b2、…、bN-2、c}
Equation (8) shows that vmax must be greater than 0.5 that the level of vmax could represent the final evaluation level. Therefore, in order to consider the influence of other relational degree on the evaluation results, this paper uses the level eigenvalue to judge the final applicability level. The calculation method of the level eigenvalue is as follows:
where s is the level eigenvalue. Equation (13) shows that the range of eigenvalues is [1,N],1 means the best condition, N means the worst case,1 and N represent the ideal situation in practice. The eigenvalues range of different levels are identified as follows: level 1: [1,1.5), level 2: [1.5, 2.5),... level N-1: [N-1.5, N-0.5), level N: [N-0.5, N].
Based on the above theoretical basis, the flow chart of applicability evaluation process for gas distributed energy system is shown in Figure 3.
4. A Case Study
As a coal-producing province, coal is the main source of energy supply in Shaanxi, and the excessive use of coal is also leading the severe haze in Guanzhong area in recent years. Meanwhile, Shaanxi is rich in natural gas resources, and the efficient use of natural gas instead of coal for energy supply is an urgent problem to be addressed. A star-rated hotel in Xi’an covers an area of 15,000 m2, with a floor area of 124,000 m2, including guest/suite room, restaurant, conference hall, swimming pool, indoor stadium and other supporting facilities. In order to save energy, reduce emission, relieve power shortage and improve investment efficiency, the distributed natural gas energy system is planned to be used. And it is necessary to evaluate the applicability of natural gas distributed energy system for this hotel.
Based on the historical energy consumption data and equipment operation records of the hotel, the curve of cooling, heating and electrical load in different seasons is drawn, as shown in Figure 4. Study has shown that gas turbine and steam waste heat boiler should be used when the heat-electricity ratio is greater than 1.5 [32]. Therefore, the combined heat and power system with gas turbine, heat recovery steam generator (HRSG) and absorption refrigeration system is adopted in the hotel. The working flow diagram of the system is shown in Figure 5 and the equipment performance parameters are shown in Table 3.
The gas turbine drives the generator set to generate electricity by burning natural gas and outputting mechanical power, the generated electric load meets the self-consumption of the hotel and the insufficient power is purchased from the power grid. The HRSG recovers the heat from gas turbine and generates steam. The steam is used for heating in winter and as the driving heat source for lithium bromide refrigerator in summer. When the waste heat is insufficient, the gas-fired boiler can make up for it. Figure 4 shows that the maximum power consumption of normal daily in winter is 3750 kW and5000 kW in summer. Therefore, two gas turbines are required for the hotel, and the power generation can be consumed by the hotel without energy storage equipment. However, in actual use, two gas turbines, two heat recovery steam generators, two lithium bromide refrigerators and two gas-fired boilers need to be used in the daytime, and only one gas turbine and one heat recovery steam generator need to be worked at night to meet the load demand. In some peak hours, a gas-fired boiler is required to provide additional steam demand.
4.1. Calculation of Indicator Weight
Calculating the evaluation indicators weights of applicability and the primary indicators are calculated firstly. Experts are invited to assess the importance of different indicators, as shown in Table 4. Based on Equation (4)-(7), the weight values of primary indicators are calculated as follows: 0.2951, 0.0718, 0.3799, 0.0904 and 0.1623, and the consistency index: CR=0.0847. Based on Table 2, it indicates that the weight values have passed consistency test [33] and could be used for applicability evaluation.
For the second-level indicators, it is assumed that there is no difference in the effect of each indicator, and finally the indicator weight is obtained as shown in Table 5.
4.2. Set Pair Analysis Evaluation
The evaluation levels of applicability indicators are defined. Considering the rationality of reality, the initial equipment investment, the payback period, and financial internal rate of return follow the Gaussian distribution, and divided into 5 levels according to the interval of (0,0.0227], (0.0227,0.1576], (0.1576,0.8402], (0.8402,0.9761] and (0.9761,1] respectively. The evaluation levels of the other indicators are divided equally. In addition, it should be noted that the initial equipment investment, the payback period, NOx and CO2 emissions, planned outage factor, unplanned outage factor, and unit derated factor are the cost indicator, and other indicators are the benefit indicators.
The actual values and normalized values of indicators are shown in Table 6. Referring to relevant investment cases, the maximum psychological amount of initial investment is set at RMB40 million, The payback period is 4-10 years, The maximum financial internal rate of return is 10% based on conservative empirical value, the emissions of CO2 and NOx are based on the emissions from coal-fired power generation: the maximum emission of CO2 is 813 g/(kWh), and NOx is 2.68 g/(kWh).
For the benefit indicators and cost indicators, we calculating the relational degrees of indicators and evaluation levels respectively:
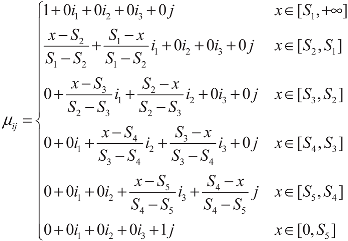
(1) Relational degree for benefit indicator is calculated as:
(2)Relational degree forcost indicator is calculated as:
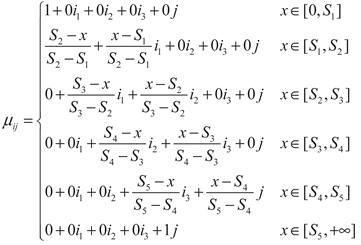 where S1,S2,S3,S4 and S5 are the upper bound values of level 1 to 5 respectively, x is the actual value of indicator. Finally, the relational degree obtained as:
u=0.178i+0.3532i1+0.3622i2+0.1782i3+0j
The maximum membership degree is 0.3622, so the evaluation result should determine by the level eigenvalue method: s = 2.6838, it means the applicability is at level III (i.e., the hotel is suitable for using distributed energy system, the energy saving, emission reduction effect and economic benefits are acceptable).
4.3. Discussion
The applicability evaluation result of natural gas distributed energy for the hotel is 2.6838, it means the hotel is suitable for using natural gas distributed energy system, and trending to level 2. Therefore, it can be considered that the hotel is worthy of investment and transformation from energy conservation, emission reduction and investment income. Meanwhile, it is found that the indicators that have great influence on the applicability are environment and economy. The analysis for the two indicator sets are as follows:
(1) The weights of environmental indicators are the largest, and it indicates that the operation of the distributed natural gas system in the hotel focuses on energy conservation and emission reduction. Based on data in Table 6, the annual effective generation time of the distributed energy system is 6214.56h, the effective annual electrical output is 23,043,600 kWh, the annual saturated steam supply is 80,000 tons, and the heat-electricity ratio is 2.42. The calculated energy consumption data are shown in Table 7, distributed energy system can reduce 1,735.26 tons of standard coal (tce) and the energy-saving rate is 12.35%, it is equivalent to a emission reduction of 4811.00t CO2, 65.07t NOx and 131.4t SO2, with great environmental benefits.
(2)The economy includes three parts: the equivalent annual cost of initial investment, energy consumption cost and maintenance cost. The equivalent annual cost of initial investment is the average investment converted by total investment of system equipment according to the service time, energy consumption cost is the cost of natural gas and electricity purchase consumed by the system, and the annual maintenance cost is the operation and maintenance cost of the system equipment. Assuming that the annual interest rate is 0.07, the service life of the distributed energy system is 15 years, the price of commercial natural gas in Xi ‘an is 2.3 Yuan per standard cubic, and the electricity price is 0.7146 Yuan per kWh. Based on the cooling, heating and power load, it is estimated that the cost of traditional power supply is RMB 35.3053 million, and the calculation costs are shown in Table 8. Table 8 shows that the annual operating cost of distributed energy system is lower than that of traditional energy supply method, and the static investment payback period is 5.2 years, with great economic benefits.
Meanwhile, for economic benefits, it is important to note that the costs calculated in this paperare based on the assumption that government investment incentives, concessional loans, tax breaks and policy support for reducing greenhouse gas emissions are excluded.Therefoer, if all preferential policies are included, the final applicability evaluation results will be more suitable, it is also shows that the promotion and application for distributed energy system in the early stage needs the supports of governments in laws, regulations and financing subsidies.
5. Price Sensitivity Analyses
Based on the current commercial electricity price of 0.7146 Yuan / kWh and natural gas price of 2.3 Yuan / m3 in Xi’an, this paper analyzes the impact of electricity price fluctuation and gas price fluctuation on energy saving and economy for distributed energy system.
5.1. Natural Gas Price Sensitivity Analysis
Figure 6(a) shows the investment payback period curve of the distributed system when the natural gas price fluctuates in the normal range with the electricity price unchanged. With the natural gas price rising, the investment payback period is increasing. But the high price leads to longer payback period, and it is not feasible to invest in equipments. Because the designed service life of the distributed system is 15 years, the curve shows that when the average price of natural gas is higher than 2.85 Yuan / m3, it is difficult to realize the planned service life in terms of the initial investment. Figure 6(b) shows the investment payback period curve under the assumption that the natural gas price can be any value. It can be seen from the curve that when the price of natural gas exceeds 3.1 Yuan / m3, the payback period is negative, it indicating that the use of distributed energy system is not as economic as the traditional energy supply method. Figure 7 shows that with the natural gas price increasing, the energy consumption cost of distributed system is closer and closer to that of the traditional energy supply method. Therefore, the low natural gas price can ensure a short payback period, and under the practical conditions of natural gas production cost, the distributed system can be promoted by reducing the natural gas price as much as possible through subsidies and other ways.
5.2. Electricity Price Sensitivity Analysis
Figure 8(a) shows the investment payback period curve of distributed system when the electricity price fluctuates in the normal range with the natural gas price unchanged. With the electricity price rising, the investment payback period is decreasing. But the low price leads to a longer payback period, and it is not feasible in equipment investment. Because the designed service life of the distributed system is 15 years, the curve indicates that the average electricity price is less than 0.6 Yuan / kWh, and it is difficult to realize the planned service life in terms of the initial investment. Figure 8(b) shows the investment payback period curve under the assumption that electricity price can be any value. It can be seen from the curve that when the electricity price is lower than 0.55 Yuan / kWh, the payback period is negative, it indicating that the use of distributed energy system is not as cost-effective as the traditional energy supply method. Figure 9 shows that with the electricity price increasing, traditional energy supply method need more energy consumption cost than distributed system.
5.3. Fluctuation Comparison of Electricity Price and Natural Gas Price
Figure 10 and Figure 11 shows the energy saving analysis caused by the fluctuation of electricity price and natural gas price, in which the red and blue areas represent the practical electricity price and natural gas price ranges respectively. Figure 10 shows the energy consumption ratio of distributed system and traditional energy supply system under the same price. According to the curve, for different prices, the range of natural gas consumption ratio is larger than that of electricity consumption ratio on the whole, and it indicates that the influence of natural gas price is greater than that of electricity price in the promotion process for distributed system. Further analysis, Figure 11 is the energy-saving rate curve of distributed energy compared with traditional functional system. It can be seen that the change of natural gas price can obtain higher energy-saving rate, and the change range of energy-saving rate is larger than that of electricity price. Therefore, the energy consumption of distributed system is more sensitive to the fluctuation of natural gas price than electricity price.
6. Conclusions
As China puts forward the five major social development concepts of “Innovation, Coordination, Green, Openness and Sharing”, and the implementation of the national energy development strategic action plan, the environmental protection policies and energy system reform will promote the large-scale application of natural gas in distributed energy system. Therefore, the evaluation of natural gas distributed energy system is particularly important. For the promotion and application of natural gas distributed energy system, this paper uses set pair analysis to build the applicability evaluation model, and evaluates a star hotel in Xi’an, Shaanxi Province to verify the model. The conclusions are as follows:
(1) Applicability evaluation indicator system is established, it includes five indicator sets of economy, energy efficiency, environment, reliability and energy quality, and fully reflects the influencing factors that should be paid attention to when promoting the natural gas distributed energy system. The indicator system ensures the effectiveness and scientificity for the evaluation process.
(2) The eigenvalue judgment method could take the contribution of all relational degrees to the evaluation results into consideration. Set pair analysis method can deal with the influence of inter-correlation among indicators, and make the applicability evaluation results more accurate and practical.
(3) Environment set and economy set have great influence on the applicability. By comparing with traditional energy supply method, the energy saving rate of natural gas distributed energy system is 12.35%, the annual operating expenses is reduced by 5,086,100 Yuan and the static investment payback period is 5.2 years. It shows that energy conservation, environmental protection and economic benefit of natural gas distributed energy system is better, especially worth promoting in areas with low gas prices.
The construction and operation experience of natural gas distributed energy system in China are not enough. Through the applicability evaluation, it is clear that the economy is the most important index and followed by the environmental index. According to the practical situation in China, the following suggestions are put forward:
(1) In the preliminary work of the distributed energy project, it is very important to calculate the cooling and heating load, the loads are directly determining the size of the installed capacity and the selection of equipment. In order to realize the energy cascade utilization and the maximization of comprehensive energy utilization efficiency, the peak shaving mode should be reasonably determined.
(2) At present, the continuous rise of natural gas price in China has become a key factor affecting the high operating cost. As the main cost of operation, natural gas price plays an important role in determining the applicability of distributed energy system. If the natural gas price is within a reasonable range, the power generation cost will provide a positive support for the operating profit. And it is suggested that the establishment of LNG and pipeline dual source supply can improve the safety and economy of fuel in energy supply period.
(3) The supporting policy document to encourage the development of natural gas distributed energy has not been implemented, and resulting in a great difference between the local administrative approval and acceptance procedures and the power industry. At present, China’s natural gas price is high, the local government can not afford more subsidies for secondary energy price, the surplus electricity generated can not be dredged and comsumed, the price advantage is not obvious compared with other cold and hot energy. Therefore, the construction of distributed energy systems are still facing great difficulties, and the relevant departments should promote and formulate specific support policies.
Author Contributions
A.B. and S.H. designed the research methodology. D.K. and X.S. collected and analyzed the data. A.B. and S.H. drafted the manuscript. A.B. and X.S. coordinated and secured funding. All authors gave final approval for publication.
Funding
This work was financially supported by the Humanities and Social Science Foundation of the Ministry of Education in China (23YJC630001, 23YJC630154), and the Basic Research Program of Jiangsu (BK20241976).
Data Availability Statement
The data that support the findings of this study are available from the corresponding author upon reasonable request.
Institutional Review Board Statement
Not applicable.
Informed Consent Statement
Not applicable.
Declaration of Competing Interest: The authors declare that we do not have any commercial or associative interest that represents a conflict of interest in connection with the work submitted.
References
- Huang, J.; Jiang, C.; Xu, R. A review on distributed energy resources and MicroGrid. Renew. Sust. Energ. Rev. 2008, 12, 2472–2483. [Google Scholar] [CrossRef]
- Li, M.; Mu, H.; Li, N.; Li, H.; Gui, S.; Chen, X. Optimal option of natural-gas district distributed energy systems for various buildings. Energ. Build. 2014, 75, 70–83. [Google Scholar] [CrossRef]
- Lund, H.; Mnster, E. Modelling of energy systems with a high percentage of CHP and wind power. Renew. Energ. 2003, 28, 2179–2193. [Google Scholar] [CrossRef]
- Schmeck, H.; Karg, L. E-energy-paving the way for an internet of energyauf dem weg zum internet der energie. It-Inf. Technol. 2010, 52, 55–57. [Google Scholar] [CrossRef]
- Keiichiro, Y.; Tsunayoshi, I. The Basic Concept and Decentralized Autonomous Control of Super Distributed Energy Systems. Electr. Eng. Jpn. 2003, 151, 43–55. [Google Scholar]
- Andrew, M.; James, M. Fully Flexible Loads in Distributed Energy Management: PV, Batteries, Loads, and Value Stacking in Virtual Power Plants. Engineering-Prc 2020, 6, 736–738. [Google Scholar] [CrossRef]
- Zou, C.; Pan, S.; Zhao, Q. On the connotation, challenge and significance of China’s “energy independence” strategy. Petrol. Explor Dev.+ 2020, 47, 449–462. [Google Scholar] [CrossRef]
- Gu, Q.; Ren, H.; Gao, W. Integrated assessment of combined cooling heating and power systems under different design and management options for residential buildings in Shanghai. Energ. Build. 2012, 51, 143–152. [Google Scholar] [CrossRef]
- Ayman, M.; Mohamed, H.; Ala, H.; Kai, S. The performance of small scale multi-generation technologies in achieving cost-optimal and zero-energy office building solutions. Appl. Energ. 2015, 152, 94–108. [Google Scholar] [CrossRef]
- Ruan, Y.; Liu, Q.; Zhou, W. Optimal option of distributed generation technologies for various commercial buildings. Appl. Energ. 2009, 86, 1641–1653. [Google Scholar] [CrossRef]
- Zeng, R.; Li, H.; Liu, L. A novel method based on multi-population genetic algorithm for CCHP-GSHP coupling system optimization. Energ. Convers. Manag. 2015, 105, 1138–1148. [Google Scholar] [CrossRef]
- Jing, R.; Wang, M.; Nigel, B.; Zhao, Y. Multi-criteria evaluation of solid oxide fuel cell based combined cooling heating and power (SOFC-CCHP) applications for public buildings in China. Energy 2017, 141, 273–289. [Google Scholar] [CrossRef]
- Wu, D.; Wang, R. Combined cooling, heating and power: A review. Prog. Energ. Combust. 2006, 32, 459–495. [Google Scholar] [CrossRef]
- Hassan, H.; Abdolsaeid, G.; Mohammad, N.M.J. Assessment of new operational strategy in optimization of CCHP plant for different climates using evolutionary algorithms. Appl. Therm. Eng. 2015, 75, 468–480. [Google Scholar] [CrossRef]
- Wang, J.; Jing, Y.; Zhang, C. Optimization of capacity and operation for CCHP system by genetic algorithm. Appl. Energ. 2010, 87, 1325–1335. [Google Scholar] [CrossRef]
- Aldo, B.; Leonardo, T.; Emanuele, M.; Edoardo, A. A detailed MILP optimization model for combined cooling, heat and power system operation planning. Energy 2014, 74, 12–26. [Google Scholar] [CrossRef]
- Mago, P.J.; Chamra, L.M.; Ramsay, J. Micro-combined cooling, heating and power systems hybrid electric-thermal load following operation. Appl. Therm. Eng. 2010, 30, 800–806. [Google Scholar] [CrossRef]
- Liu, M.; Fang, Y. A new operation strategy for CCHP systems with hybrid chillers. Appl. Energ. 2012, 95, 164–173. [Google Scholar] [CrossRef]
- Hamed, E.; Arash, K. Present a multi-criteria modeling and optimization (energy, economic and environmental) approach of industrial combined cooling heating and power (CCHP) generation systems using the genetic algorithm, case study: A tile factory. Energy 2018, 149, 286–295. [Google Scholar] [CrossRef]
- Glavan, I.; Prelec, Z.; Pavkovic, B. Modelling, Simulation and Optimization of Small-Scale CCHP Energy Systems. Int. J. Simul. Model. 2015, 14, 683–696. [Google Scholar] [CrossRef]
- Fateme, A.B.; Mansoure, C. Monthly assessments of exergetic, economic and environmental criteria and optimization of a solar micro-CCHP based on DORC. Sol. Energy 2018, 166, 351–370. [Google Scholar] [CrossRef]
- Masood, E.; Kaveh, A. Integrated energy–exergy optimization of a novel micro-CCHP cycle based on MGT-ORC and steam ejector refrigerator. Appl. Therm. Eng. 2016, 102, 1206–1218. [Google Scholar] [CrossRef]
- Yaser, K. A linear programming optimization model for optimal operation strategy design and sizing of the CCHP systems. Energ. Effic. 2018, 11, 225–238. [Google Scholar] [CrossRef]
- Yuan, Z.; Jing, Z.; Hu, R.; Wu, Q. Operation optimization of CCHP-type microgrid considering units’ part-load characteristics. 2015 IEEE Innovative Smart Grid Technologies-Asia (ISGT ASIA), Bangkok, Thailand, 3-6 Nov 2015. [Google Scholar]
- Tichi, S.G.; Ardehali, M.M.; Nazari, M.E. Examination of energy price policies in Iran for optimal configuration of CHP and CCHP systems based on particle swarm optimization algorithm. Energ. Policy 2010, 38, 6240–6250. [Google Scholar] [CrossRef]
- Sanaye, S.; Hajabdollahi, H. Thermo-Economic Optimization of Solar CCHP Using Both Genetic and Particle Swarm Algorithms. J. Sol. Energ. 2014, 137, 011001. [Google Scholar] [CrossRef]
- Miller, G.A. The magical number seven, plus or minus two: Some limits on our capacity for processing information. Psychol. Rev. 1956, 63, 81–97. [Google Scholar] [CrossRef]
- Zhao, K.; Xuan, A. Set pair theory-a new theory method of non-define and its applications. Syst. Eng. 1996, 14, 18–23. [Google Scholar]
- Zhao, K. An applications of the scheme-appraisal decision matrix based on set pair analysis. Syst. Eng. 1994, 12, 67–72. [Google Scholar]
- Ghodsypour, S. H.; O’Brien, C. A decision support system for supplier selection using an integrated analytic hierarchy process and linear programming. Int. J. Prod. Econ. 1998, 56–57, 199–212. [Google Scholar] [CrossRef]
- Zhao, X.; Liu, Y.; He, X. Fault Diagnosis of Gas Turbine based on Fuzzy Matrix and the Principle of Maximum Membership Degree. Energy Procedia 2012, 16, 1448–1454. [Google Scholar] [CrossRef]
- He, J. The research of simulation analysis and assessing method to the small-scale gas combined heat and power project. Doctoral thesis, Shanghai Jiao Tong University, Shanghai, China, 2006. [Google Scholar]
- Balaram, D.; Bipradas, B.; Bijan, S.; Subir, K.S. Group heterogeneity in multi member decision making model with an application to warehouse location selection in a supply chain. Comput Ind. Eng. 2017, 105, 101–122. [Google Scholar] [CrossRef]
Figure 1.
Energy structure prediction of consumption in China.
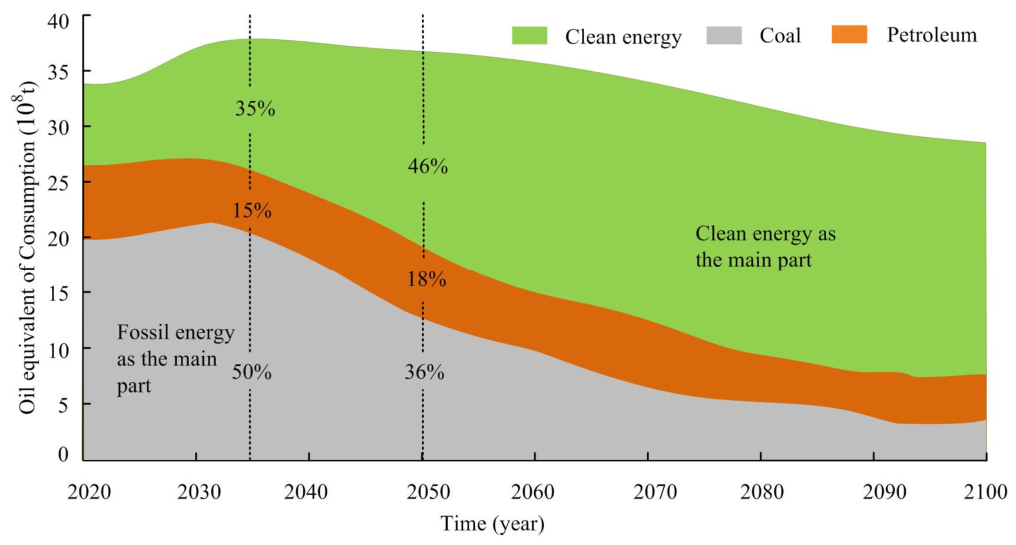
Figure 2.
Adaptability evaluation indicators of natural gas distributed energy system.
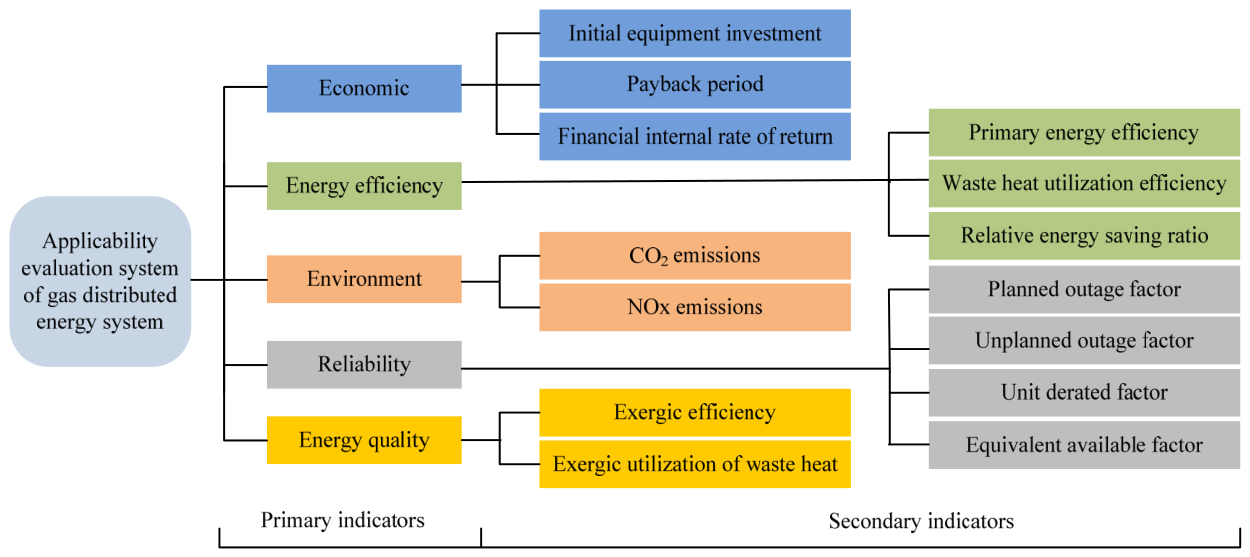
Figure 3.
The flow chart of evaluation model.
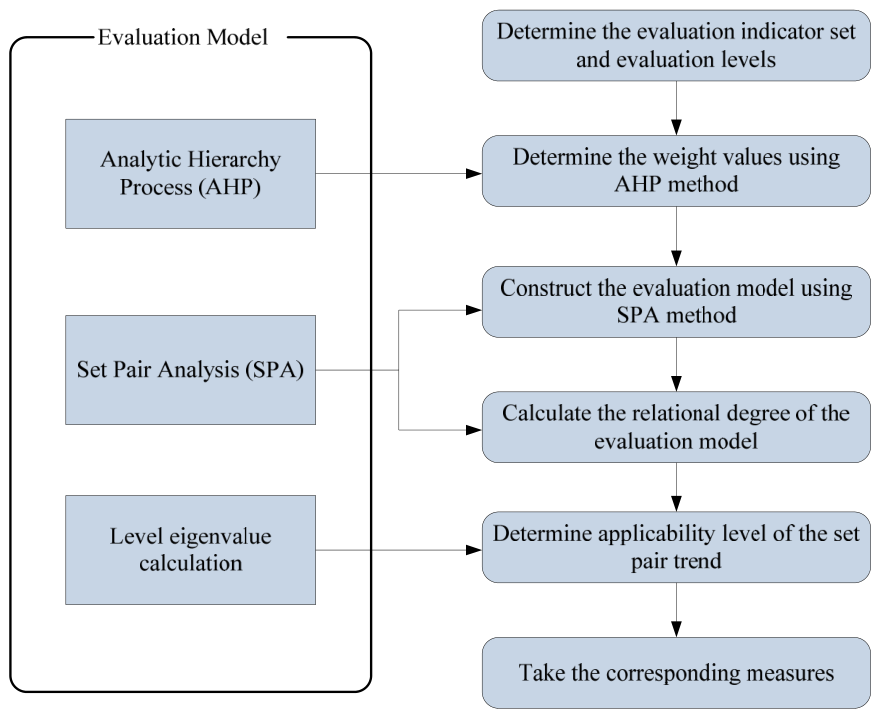
Figure 4.
Curves of cooling load, thermal load and electric load in single day, (a) Typical day in winter; (b) Typical day in summer; (c) Typical day in transitional season.
Figure 4.
Curves of cooling load, thermal load and electric load in single day, (a) Typical day in winter; (b) Typical day in summer; (c) Typical day in transitional season.
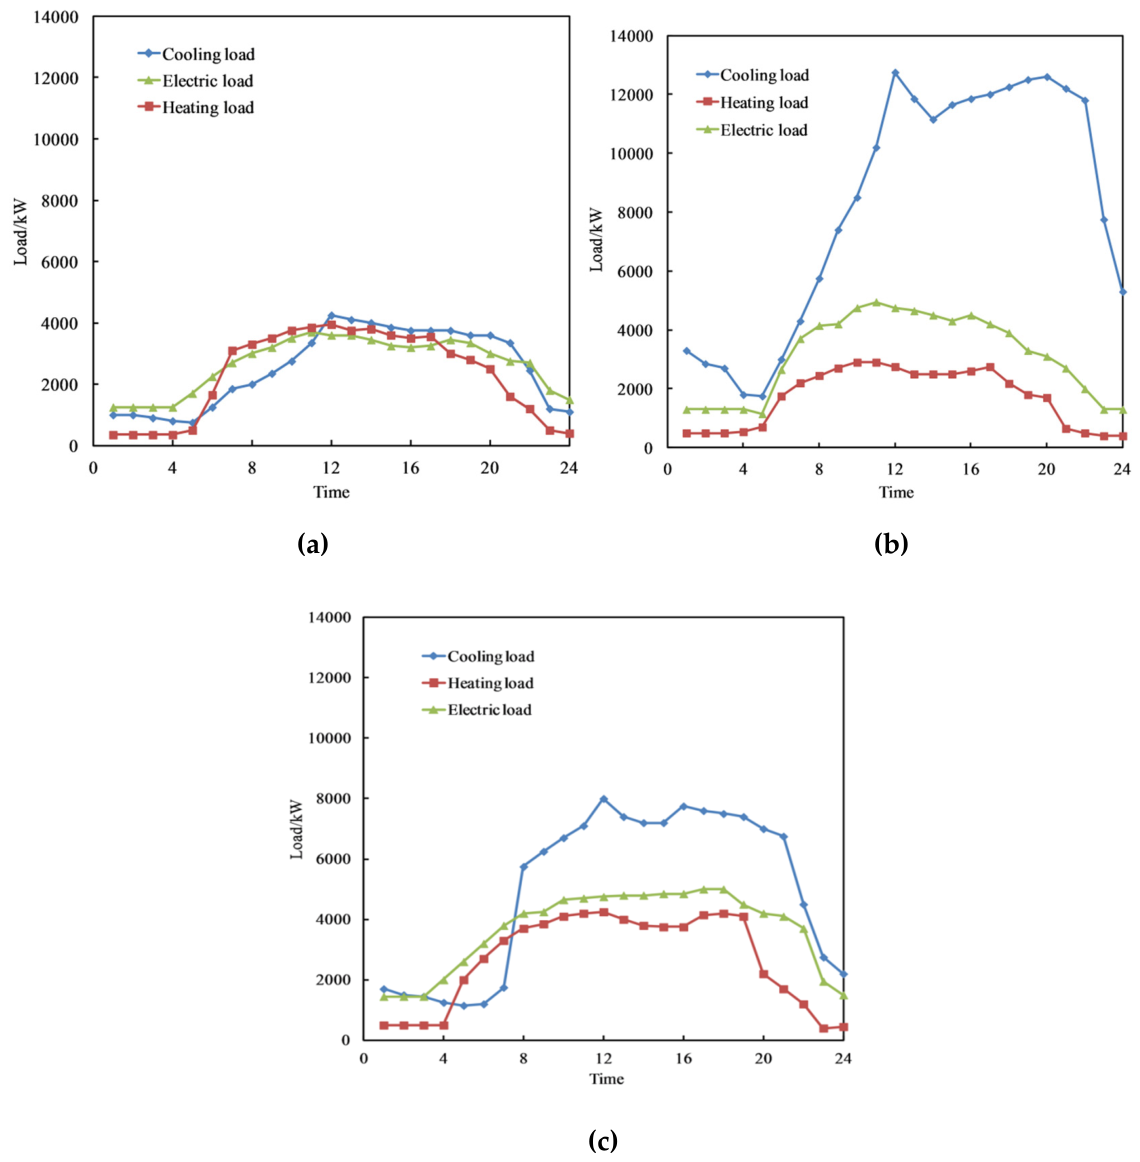
Figure 5.
Flow diagram of natural gas distributed energy system.
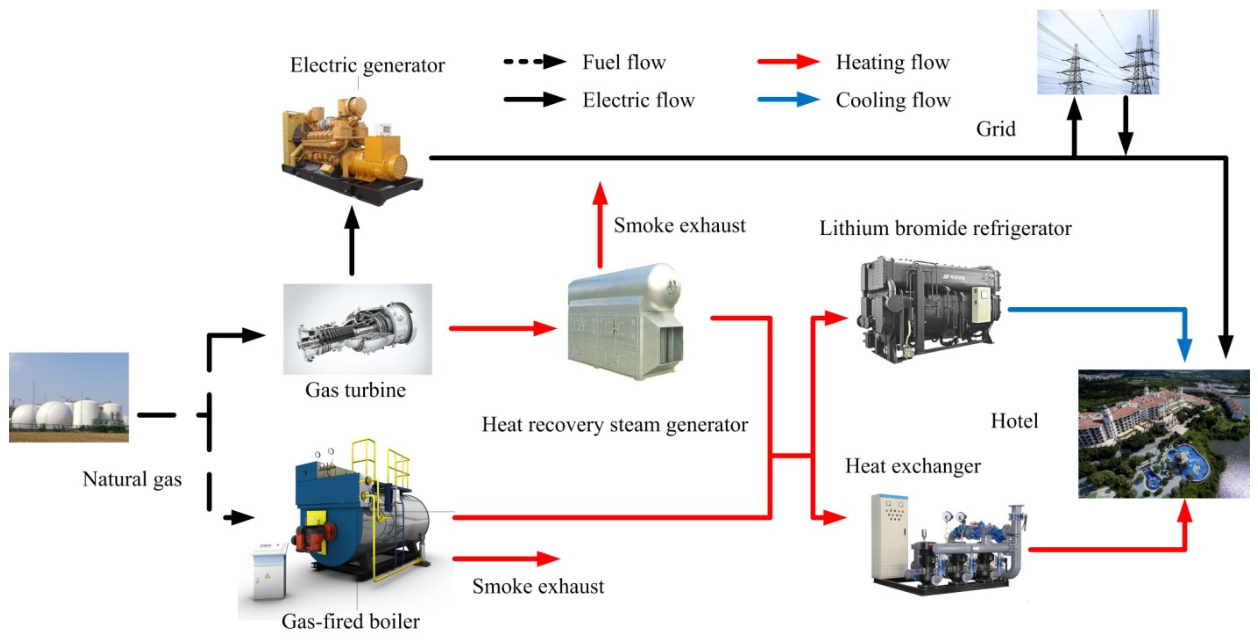
Figure 6.
Investment payback curve based on natural gas price, (a) In the normal natural gas price range; (b) Assume natural gas can be at any price.
Figure 6.
Investment payback curve based on natural gas price, (a) In the normal natural gas price range; (b) Assume natural gas can be at any price.
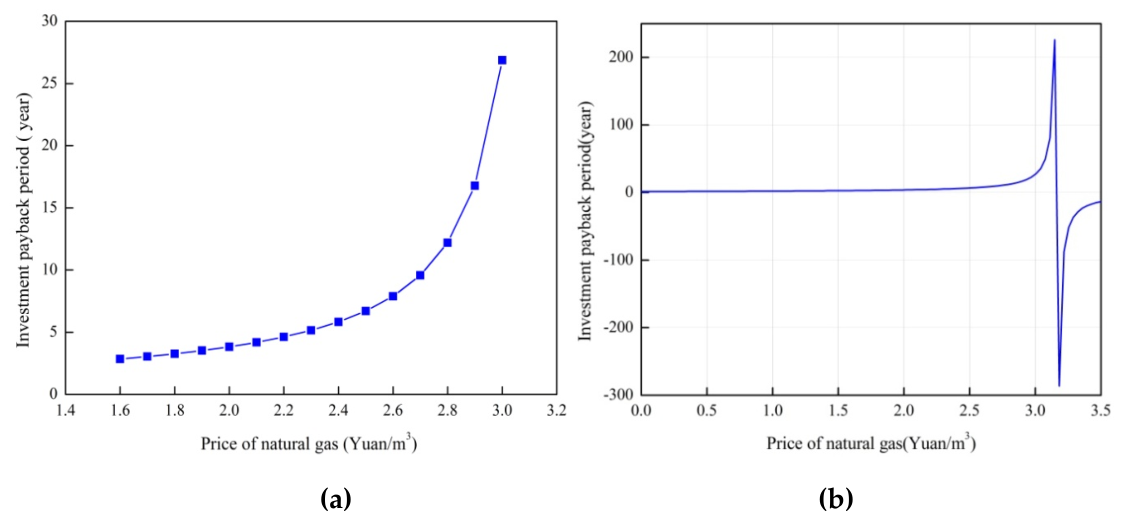
Figure 7.
Energy consumption cost based on natural gas price.
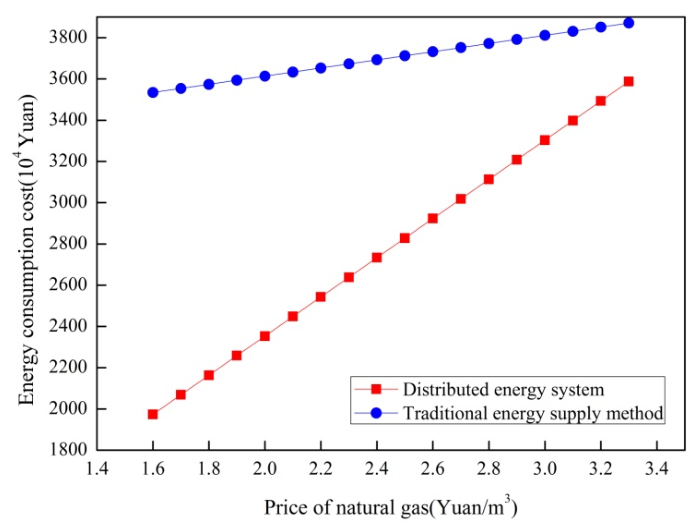
Figure 8.
Investment payback curve based on electricity price, (a) In the normal electricity price range; (b) Assume electricity can be at any price.
Figure 8.
Investment payback curve based on electricity price, (a) In the normal electricity price range; (b) Assume electricity can be at any price.
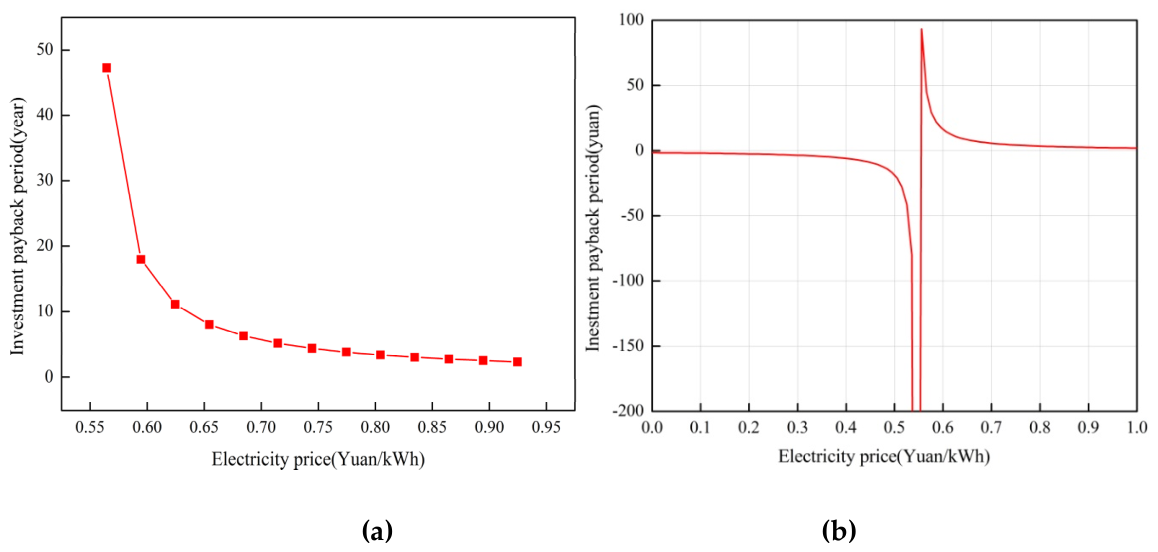
Figure 9.
Energy consumption cost based on electricity price.
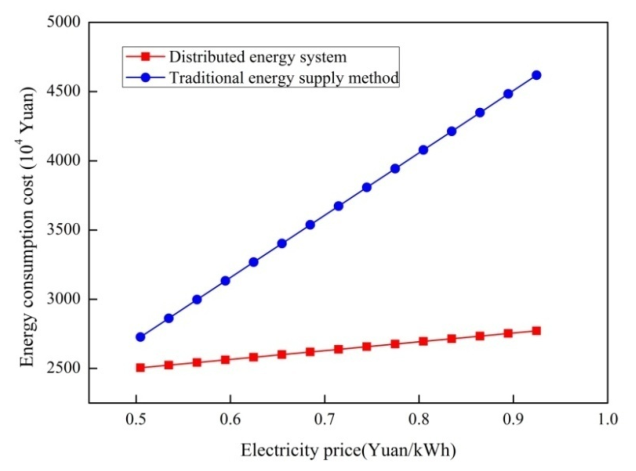
Figure 10.
Curve of energy consumption ratio.
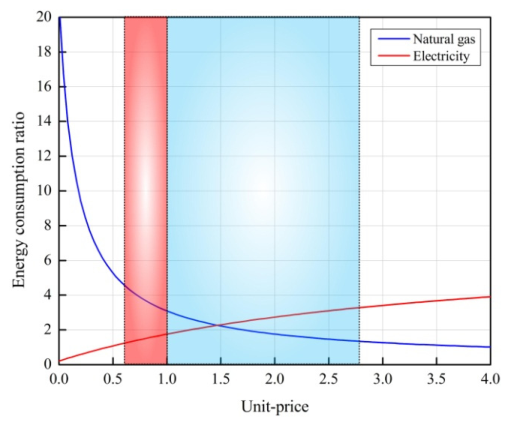
Figure 11.
Curve of energy-saving rate.
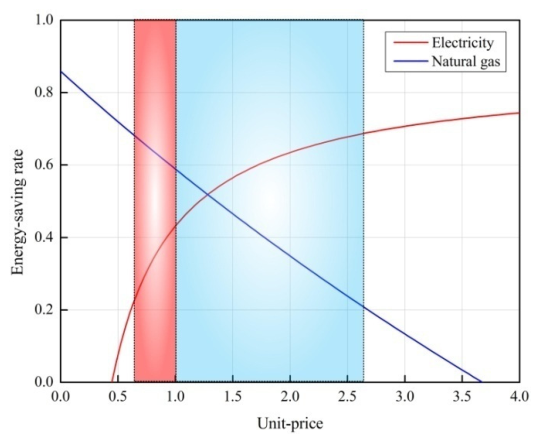

Table 1.
Judgment matrix scales and meanings.
| Scales | Meanings |
| 1 | The two indicators are of equal importance compared to each other |
| 3 | One indicator is slightly more important than the other when compared to two indicators |
| 5 | One indicator is significantly more important than the other when compared to two indicators |
| 7 | One indicator is enormously more important than the other when compared to two indicators |
| 9 | One indicator is more important than the other extreme when compared to two indicators |
| 2, 4, 6, and 8 | Denotes the median of the above two adjacent judgments |
| 1/xij | Indicatori is compared with j to get judgment xij, and j is compared with i to get judgment xji=1/xij |
Table 2.
The unexpected consistency index.
| Matrix order | 3 | 4 | 5 | 6 | 7 | 8 |
| RI | 0.58 | 0.89 | 1.12 | 1.24 | 1.36 | 1.41 |
Table 3.
Parameters of equipments.
| 1.Gas turbine | Power/kW | Combustion temperature /°C | Exhaust temperature /°C | Combustion heat consumption /(kJ/kWh) | Fuel flow /(Nm3/h) | |||||
| 1854 | 980 | 573 | 13846 | 764 | ||||||
| 2.HRSG | Exhaust gas temperature /°C | Exergic utilization of waste heat /% | Flue gas temperature /°C | Saturated steam temperature /°C | Rated steam flow /(t/h) | Rated steam pressure /MPa | ||||
| 110 | 81.66 | 577 | 170 | 6 | 1.25 | |||||
| 3.Lithium bromide refrigerator | Cooling capacity /kW | Steam consumption (t/h) | Steam pressure /MPa | Daily running time /h | Annual operation days /d | |||||
| 1800 | 1.9 | 0.6 | 8 | 120 | ||||||
| 4.Gas-fired boiler | Exhaust gas temperature /°C | Design thermal efficiency /% | Rated steam pressure /MPa | Rated steam flow /(t/h) | Saturated steam temperature /°C | |||||
| 90 | 93 | 1.25 | 15 | 193 | ||||||
Table 4.
Judgment matrix of primary indicators.
| Primary indicators |
Economy | Energy efficiency |
Environment | Reliability | Energy quality |
| Economy | 1 | 4 | 1/2 | 6 | 2 |
| Energy efficiency | 1/4 | 1 | 1/3 | 1/2 | 1/3 |
| Environment | 2 | 3 | 1 | 3 | 4 |
| Reliability | 1/6 | 2 | 1/3 | 1 | 1/3 |
| Energy quality | 1/2 | 3 | 1/4 | 3 | 1 |
Table 5.
Weight values of indicators.
| Indicator | Initial equipment investment | Payback period | Financial internal rate of return | Primary energy efficiency | Waste heat utilizationefficiency | Relative energy saving ratio | CO2 emissions |
| Weight | 0.0984 | 0.0984 | 0.0984 | 0.0239 | 0.0239 | 0.0239 | 0.1900 |
| Indicator | NOx emissions | Planned outage factor | Unplanned outage factor | Unit derated factor | Equivalent available factor | Exergic efficiency | Exergic utilization of waste heat |
| Weight | 0.1900 | 0.0406 | 0.0406 | 0.0406 | 0.0406 | 0.0812 | 0.0812 |
Table 6.
Actual values and normalization values of the indicators.
| Indicator | Actual value | Normalization value | Indicator | Actual value | Normalization value | ||
| 1 | Initial equipment investment /104 Yuan | 2939.95 | 0.7350 | 8 | NOx emissions g/(kW∙h) | 1.04 | 0.3741 |
| 2 | Payback period /year | 6.61 | 0.565 | 9 | Planned outage factor /% | 4.57 | 0.0457 |
| 3 | Financial internal rate of return /% | 8.08 | 0.8080 | 10 | Unplanned outage factor /% | 0.31 | 0.0031 |
| 4 | Primary energy efficiency/% | 78.96 | 0.7896 | 11 | Unit derated factor /% | 0.53 | 0.0053 |
| 5 | Waste heat utilizationefficiency /% | 81.66 | 0.8166 | 12 | Equivalent available factor /% | 94.59 | 0.9459 |
| 6 | Relative energy saving ratio /% | 19.3 | 0.1930 | 13 | Exergic efficiency/% | 48.00 | 0.4800 |
| 7 | CO2 emissions g/(kW∙h) | 580 | 0.7134 | 14 | Exergic utilization of waste heat /% | 79.9 | 0.7990 |
Table 7.
Energy consumption data.
| Energy consumption | Converted to standard coal | |||
| Traditional energy supply method | Distributed energy system | Traditional energy supply method | Distributed energy system | |
| Electricity consumption | 0 | 6.3564’106 kWh | 0 | 781.20tce |
| Gas consumption | 1.9804’106 Nm3 | 949.58w Nm3 | 2404.80 tce | 11530.80tce |
| Coal consumption | 16305.97t | 0 | 11642.46tce | 0 |
| Total | / | / | 14047.26tce | 12312.00tce |
Table 8.
Annual operating cost of distributed energy system.
| Equipment | Rated Capacity /kW | Initial investment /(Yuan/kW) | Maintenance cost /(Yuan/kWh) | ||
| Gas turbine | 2318 | 5533 | 0.03 | ||
| Heat recovery steam generator | 700 | 1100 | 0.00216 | ||
| Steam-driven lithium bromide refrigerator | 2908 | 1070 | 0.0097 | ||
| Gas-fired boiler | 700 | 800 | 0.00216 | ||
| Operating costs | |||||
| Equivalent annual cost of initial investment /104 Yuan | 368.61 | Maintenance cost /104 Yuan | 15.05 | ||
| Total investment cost /104 Yuan | 3357.11 | Annual operating cost /104 Yuan | 3021.92 | ||
| Energy consumption cost /104 Yuan | 2638.26 | Static investment payback period /year | 5.2 | ||
Disclaimer/Publisher’s Note: The statements, opinions and data contained in all publications are solely those of the individual author(s) and contributor(s) and not of MDPI and/or the editor(s). MDPI and/or the editor(s) disclaim responsibility for any injury to people or property resulting from any ideas, methods, instructions or products referred to in the content. |
© 2026 by the authors. Licensee MDPI, Basel, Switzerland. This article is an open access article distributed under the terms and conditions of the Creative Commons Attribution (CC BY) license (http://creativecommons.org/licenses/by/4.0/).
Copyright: This open access article is published under a Creative Commons CC BY 4.0 license, which permit the free download, distribution, and reuse, provided that the author and preprint are cited in any reuse.