

Submitted:
02 September 2026
Posted:
03 September 2026
You are already at the latest version
Abstract
Although conventional hammering inspection remains a standard practice across various industries, its effectiveness is often limited by a heavy reliance on the inspector’s subjective skill, leading to qualitative and inconsistent results. To address these limitations, this study introduces a digital hammering inspection system integrated with Acoustic Emission (AE) sensors, designed for enhanced quality control and long-term aging management. The system has been extensively implemented in the diagnostic evaluation of social infrastructure, encompassing both metallic and concrete structures. By leveraging the principles of natural vibration, the system provides an objective, quantitative, and recordable screening process that significantly reduces human error and ensures high-speed data acquisition. Furthermore, its lightweight design and portability facilitate seamless field application, enabling comprehensive, on-site diagnostics that are both reliable and scalable for diverse engineering environments.
Keywords:
acoustic emission sensor
; quality management
; age-related management
; digital hammering inspection
; non-destructive testing
; infrastructure
1. Introduction
Social infrastructure in Japan is facing significant aging, and the number of road sections that have been in service for more than 50 years continues to increase, as shown in Figure 1 [1]. As these structures age, deterioration mechanisms such as fatigue, corrosion, and material degradation become more pronounced, making systematic maintenance increasingly important. Maintenance of road structures—including bridges, tunnels, and auxiliary facilities—has therefore become an urgent issue, and the importance of ensuring their soundness through periodic and efficient inspections has become even more essential for maintaining safety and reliability. In particular, adequate repairs implemented on the basis of early inspections offer the advantage of reducing the total lifecycle cost of social infrastructure during the in-service period, as they help prevent minor defects from developing into severe and costly damage.
Although close visual inspections and conventional hammering inspections have long been employed in fields such as civil engineering, public transportation, construction, and power generation, these traditional methods exhibit inherent limitations. Because they rely heavily on the skill, experience, and intuition of individual inspectors, the resulting on-site judgments tend to be subjective and largely qualitative, leading to variability in diagnostic accuracy. Moreover, as infrastructure systems continue to age and the demand for more reliable condition assessment increases, the dependence on such inspector-dependent techniques poses challenges in ensuring consistency, reproducibility, and traceability of inspection results across different sites and personnel.
Therefore, a large number of digital hammering inspection systems incorporating sensors have been proposed, and several of them have been standardized, particularly for concrete structures such as bridges and tunnels [2,3,4,5,6,7,8,9,10].
We have developed a digital hammering inspection system equipped with an AE sensor (hereinafter referred to as the AE digital hammering inspection system) and have applied it to a wide range of social infrastructure fields, leveraging the fundamental principles of natural vibration phenomena. With the AE digital hammering inspection system, the sensor is placed on the inspection surface with one hand, without any need for pretreatment such as flattening or polishing, and the area adjacent to the sensor is subsequently struck with a conventional hammer. Since the battery-powered system is portable and easy to deploy in the field, it enables simplified on-site diagnosis, and when necessary, more detailed analysis can subsequently be performed in the office based on the recorded inspection data. This provides a rapid non-destructive screening method for assessing the integrity of social infrastructure prior to conducting detailed, costly, and time-consuming state-of-the-art non-destructive testing (NDT) procedures.
The natural frequency measured by digital hammering inspection is primarily governed by the mass, geometry, and stiffness of the inspected object, as well as by the boundary constraints imposed by its surrounding environment. When improper installation, structural defects, or aging-related deterioration are present, the peak frequency deviates from the reference value characteristic of a sound condition.
This paper presents the fundamental principles of digital hammer inspection, which evaluates structural conditions based on the natural frequency characteristics of objects, and reports the results of applying the AE digital hammering system to a variety of road related metal components and concrete structures. Through these applications, the study demonstrates the system’s broad applicability to the diagnosis of social infrastructure for both quality management and age-related deterioration management.
2. Materials and Methods
A portable AE-based digital hammering inspection system, together with the fundamental principles of natural vibration phenomena that underpin its application to actual social infrastructure, is summarized below.
2.1. Portable AE Digital Hammering Field Inspection System
When using the portable AE-based digital hammering field inspection system (Figure 2(a)), the inspection target is struck with a conventional hammer to induce vibration, while the sensor is placed near the impact point with one hand, without any need for surface pretreatment such as flattening or polishing. The frequency response of the broad-band AE sensor (AE-900S-WB, NF Corporation, Yokohama, Japan) is shown in Figure 2(b). The frequency response in the 1,000–10,000 Hz range, which is primarily used for diagnosing social infrastructure, is nearly flat; therefore, the sensor is well suited for stable vibration measurement. The natural vibration peak is extracted from the frequency spectrum of the measured waveform after FFT (Fast Fourier Transform) processing, and the frequency is used as an evaluation index (Figure 2 (c)).
The index frequency is determined by identifying natural vibration peaks that exceed a predefined threshold and selecting the lowest-frequency peak among them. The rationale for selecting the lowest-frequency natural vibration peak that exceeds the threshold is that this frequency corresponds to a lower-order vibration mode—typically a simple bending mode—that is not affected by overlapping peaks associated with different vibration modes or higher-order modes that appear in the higher-frequency range.
The principle of natural vibration of a simple harmonic motion of spring is shown by Equation (1),
where is natural frequency, is spring constant and m is mass [11]. Equation (1) suggests how parameters such as mass and stiffness influence the natural frequency, as described below. The natural frequency increases when the mass or structural configuration becomes smaller, and when the stiffness or boundary restraint from the surrounding environment becomes greater. Considering these effects, an example of diagnosing post-installed adhesive M16 anchors based on mock-up tests is shown in Figure 3. When improper installation or age-related deterioration is present, the evaluated peak frequency generally decreases from the predetermined reference value corresponding to a sound condition.
2.2. Digital Hammering Inspection Applied to Actual Social Infrastructure
To provide a comprehensive understanding of the methodology, the fundamental physical principles governing digital hammering inspection, particularly its practical implementation in the structural health monitoring of critical social infrastructure, are summarized below.
Equation (2) [11] can be applied to inspections of beam-shaped metal components, such as bolts and pipes, for which the fundamental vibration characteristics are governed primarily by their geometric dimensions and material properties.
where is natural frequency of bending, is mode order of vibration system, is cross section of beam, is second moment of area, is longitudinal elastic modulus, is constant of constraint condition of beam, is mass density and is the length of beam. Because Equation (2) is formulated for idealized, complete beam members, the actual geometry of components—such as the combined configuration of bolts and nuts—must be taken into account when applying it in practice. Moreover, since Equation (2) does not include a stress term, the axial tension force acting on bolts must also be considered when evaluating their condition.
For the inspection of plate-shaped concrete structures—such as bridge girders, deck slabs, and tunnel lining concrete—alternative natural-frequency formulations appropriate for plate-type vibration behavior can be applied. From the frequency spectrum obtained through digital hammering inspection of concrete surfaces, attention is directed to the natural frequencies associated with longitudinal resonance and flexural vibration. The longitudinal resonance component is utilized for evaluating the web thickness of concrete members, whereas the flexural vibration component arises in shallow concrete layers and is indicative of defects such as voids or spalling. The natural frequency associated with longitudinal resonance is given by Equation (3). The flexural vibration component is described by Equation (4) for cases in which the concrete cover can be approximated as a rectangular plate and the surrounding boundary condition is assumed to be simply supported [11].
: natural frequency [Hz], : longitudinal elastic modulus [Pa], : mass density [kg/m3], : velocity of elastic wave [m/s], : web thickness [m], : rectangular plate size, : thickness of exfoliation region [m], : Poisson’s ratio, : order of vibration mode.
These natural frequencies deviate from those of a sound condition when the apparent longitudinal elastic modulus decreases along the web-thickness direction due to cracking, internal voids, or reductions in compressive strength, or when flexural vibration of the concrete cover occurs at the surface.
3. Results and Discussion
Examples of on-site digital hammering inspections, conducted in accordance with the fundamental principles represented by Equations (2)-(4) for both metal components and concrete structures, are summarized below.
3.1. Post-Installed Expansion Anchors
On-site inspection results for post-installed expansion M24 anchors supporting five jet fans (JFs) in an expressway tunnel in Figure 4(a) are presented below. The circled numbers 2, 3, 5, and 6 in Figure 4(b) denote the four pieces of metal hardware used to suspend each JF by chains, with four anchors installed on each hardware unit. Based on previous mock-up tests that established the relationship between anchor tightening torque and
Natural frequency, the reference value for the evaluation peak frequency under sound conditions was set to above 2,200 Hz.
Five JF anchors with evaluation peak frequencies below the reference value (Anchor Nos. 2, 4, 9, 62, and 65, shown from left to right by red circles in Figure 4(b)) were selected for torque verification using a torque wrench. All five anchors exhibited tightening torque values lower than the design specification of 240 Nm. Note that the immediate loss of jet-fan safety is unlikely even when several anchors exhibit reduced tightening torque, because each jet fan is supported by a total of sixteen anchors. After retightening the anchors to 240 Nm, the evaluation peak frequencies shifted to higher values, reflecting the increased constraint introduced by the retightening, as shown in Figure 4(c).
3.2. Foundation Bolts
Inspection results for the foundation bolts of expressway sign structures shown in Figure 5(a) are presented below. In routine practice, visual inspection is first performed to identify signs of corrosion before conducting ultrasonic testing [12]. Figure 5(b) shows the evaluation peak frequencies of thirty-six sound M36 foundation bolts, sorted by their surplus length—that is, the protruding length above the nut. The results indicate a clear tendency for the evaluation peak frequency to shift toward lower values as the surplus length increases. This trend is consistent with Equation (2), which predicts a decrease in natural frequency as the effective vibration length becomes longer. Accordingly, deterioration-induced changes in the natural frequency of foundation bolts can be evaluated by correcting for the influence of surplus length.
For the M36 foundation bolt, a first-order regression line was derived, and the correction was performed using a gradient of -37.9 Hz / mm. Figure 5(c) presents the inspection results for the foundation bolts of expressway signs after applying the frequency-correction gradient of −37.9 Hz/mm, using a surplus bolt length of 30 mm as the reference condition. The regression-corrected evaluation peak frequencies of the foundation bolts averaged approximately 3,318 Hz, with a standard deviation of about 282 Hz. In addition, two bolts exhibited markedly lower frequencies, falling well beyond one standard deviation on the low-frequency side, which is attributable to reduced constraint conditions caused by factors such as insufficient tightening torque, bolt corrosion, or deterioration of the concrete foundation.
The inspection requires approximately 90 seconds per bolt and does not involve any surface preparation, a feature that is particularly advantageous for field applicability.
3.3. Ground Anchors
Ground anchors are employed to stabilize cut slopes, as illustrated in Figure 6(a). The residual tensile force of these anchors has traditionally been measured using lift-off testing [13], however, the development of a simpler alternative method for tension assessment is needed to reduce maintenance time and cost.
Because Equation (2) does not include a stress variable for the bending vibration of a beam, the residual tensile force must be explicitly considered when analyzing the bending vibration of ground anchors. Accordingly, a multiple-regression approach incorporating tensile force was adopted, as expressed in Equation (5).
where is estimated tensile force (kN), is evaluation peak frequency (Hz), is surplus length, and are coefficients.
The results of the multiple-regression analysis for the four ground-anchor types are summarized in Table 1. The multiple correlation coefficients R for Type II and Type IV were notably high, whereas the coefficients for Type I (0.39) and Type III (0.43) were comparatively low. These lower coefficients are attributable to the large variability in the evaluation peak frequencies for Type I and the narrow range of measured residual tensile forces for Type III.
Figure 6(b) compares the actual tensile forces obtained from the lift-off tests with the tensile forces estimated using Equation (5) for the 144 ground anchors listed in Table 1 and installed on cut slopes along expressways, thereby providing a comprehensive assessment of the applicability of the proposed estimation method under practical field conditions. The ratio of the estimated tensile force—calculated from the evaluation peak frequency and surplus length—to the measured tensile force ranged from 89% to 120%, and the estimation accuracy was within ±5% for 89% of the anchors, demonstrating that the method yields sufficiently reliable results for the majority of anchors despite inherent variability in site-specific conditions.
3.4. Acoustic Barrier Supports
Acoustic barriers installed along expressways to mitigate traffic noise are susceptible to loosening or detachment under wind pressure. To evaluate the practical applicability of the AE-based digital hammering inspection method, field measurements were conducted on acoustic-barrier support components. A total of 106 supports on barrier walls were inspected. As shown in Figure 7(a), the supports comprised two types: a standard acoustic-barrier support and a transparent acoustic-barrier support, both approximately 2000 mm in height. The AE sensor was positioned 100 mm above the top of the water-shielding plate (measuring condition 1) and 200 mm above it (measuring condition 2), and hammering was performed in the vicinity of the sensor, as illustrated in Figure 7(b).
Figure 8(a) shows the evaluation peak frequencies obtained for the two types of supports. Data from the standard acoustic-barrier supports and the transparent acoustic-barrier supports are distinguished in red and blue, respectively. The average value (dotted line) and the upper and lower bounds corresponding to one standard deviation (solid lines) are also shown in Figure 8(a). The difference in the mean evaluation peak frequency between the standard and transparent supports is approximately 100 Hz. There appears to be no significant influence attributable to the difference in sensor positions between measuring conditions 1 and 2.
Figure 8(b) shows that several acoustic-barrier supports exhibit evaluation peak frequencies markedly below the lower bound of one standard deviation. As an illustrative example, the frequency distributions for Support No. 01 and Support No. 17 are compared in Figure 8(b). Support No. 17 exhibits an evaluation peak frequency of 1,345 Hz, which is clearly lower than that of Support No. 01. This pronounced reduction suggests that the fixing force of Support No. 17 provided by its anchor bolts has diminished, resulting in the dominance of a lower-frequency vibration mode.
3.5. Guardrail Support and Embedded Length
Guardrail supports often undergo corrosion at ground level after extended service periods, particularly in regions where snow-melting agents are routinely applied, leading to progressive material loss and localized weakening that may ultimately compromise the load-bearing capacity of the support if not detected at an early stage. Because conventional inspection relies primarily on ultrasonic thickness measurements [14], which require point-by-point evaluation and can be time-consuming over long roadway sections, a more efficient screening technique is desirable for early detection of deterioration and for prioritizing supports that require detailed follow-up inspection. To this end, mock-up specimens with controlled, machined corrosion were prepared, and AE-based digital hammering inspection was applied to assess its feasibility as a rapid, non-destructive screening method, as shown in Figure 9(a). The machining allowed systematic variation of the remaining cross-section, enabling a clear examination of the relationship between structural degradation and vibration characteristics and providing a controlled environment for validating the sensitivity of the method. As illustrated in Figure 9(b), the evaluation peak frequency exhibits a consistent downward shift as the simulated corrosion level increases, indicating that the reduction in stiffness associated with material loss can be sensitively captured by the proposed method. This trend suggests that the technique has sufficient resolution to detect even moderate levels of deterioration and may therefore serve as an effective preliminary screening tool prior to more detailed follow-up inspections in actual field applications.
Field inspection results for ten guardrail supports are presented in Figure 10. Pronounced reductions in the evaluation peak frequency were observed for Supports No. 1 and No. 2, where substantial corrosion was also confirmed through visual examination. The clear correspondence between the visually identified deterioration and the downward shift in peak frequency indicates that AE-based digital hammering inspection is sensitive to stiffness loss associated with corrosion-induced thinning. These findings demonstrate that the method is a promising and efficient screening technique for detecting deterioration in guardrail supports.
Acquiring the embedded length of guardrail supports is essential for ensuring that the guardrail system maintains its intended safety performance, in addition to detecting corrosion at the ground level as described above. To evaluate this embedded length, the vibration response of each support is measured by pressing an AE sensor against the cap attached to the top of the support and striking the vicinity of the sensor, as illustrated in Figure 11(a). The full length associated with the longitudinal vibration mode of a guardrail support is expressed by Equation (6) [15], which provides the basis for estimating the embedded portion from the measured natural frequency.
: natural frequency, : constant of constraint condition of beam, : vibration length [m], : Young’s modulus [N/m2], : density [kg/m3].
Two Type-A guardrail supports (No. 1 and No. 2), each with an outer diameter of 139.8 mm, a wall thickness of 4.5 mm, a full design length of 2350 mm, and a design embedded length of 1650 mm, were scheduled for replacement due to pronounced corrosion at the ground line. Prior to their removal, on-site vibration measurements were conducted under actual service conditions, with the rail beams and steel caps still attached, as shown in Figure 11(a). These measurements provided an opportunity to evaluate the applicability of AE-based digital hammering inspection to supports in their in-situ configuration.
After extraction, the actual full lengths of the two supports were measured as 1620 mm. Given that the above-ground portion was 700 mm, the embedded depth was determined to be 920 mm. Because this value is substantially smaller than the design embedded depth of 1650 mm, it was confirmed that both supports had been installed with insufficient embedment, indicating the presence of unauthorized short guardrail supports.
Figure 11(b) presents the frequency distributions obtained from AE digital hammering inspection for the two supports. In both cases, a distinct evaluation peak frequency was observed, enabling reliable estimation of the longitudinal vibration length. Table 2 summarizes the calculated full lengths, obtained by substituting the measured frequencies into Equation (6) using a Young’s modulus of 206 GPa and a density of 7900 kg/m³. The differences between the measured and estimated full lengths were on the order of several tens of millimeters for both supports. This level of agreement demonstrates that the AE-based digital hammering inspection method has practical potential as a screening technique for assessing the integrity of guardrail supports, particularly with respect to detecting insufficient embedded length.
From the above field test results, it was confirmed that AE-based digital hammering inspection can provide a simple and effective means of evaluating both ground-level corrosion and the embedded length of guardrail supports.
3.6. Finger Joints
Finger joints (Figure 12(a)) are susceptible to fatigue cracking during service, and AE-based digital hammering inspection has been introduced as a rapid screening method for detecting such damage, particularly because conventional ultrasonic inspection requires comparatively long inspection times to identify fatigue cracks [16]. Figure 12(b) illustrates the FEM analytical model and corresponding analytical results for a 540-mm-long finger portion of an expansion device. The model consists of 1-mm hexahedral solid elements, and four analytical cases were prepared by introducing a 1-mm-wide crack at the center with cross-sectional deficiency rates of 0%, 25%, 50%, and 75%. Eigenvalue analysis was performed under a cantilever boundary condition, in which the finger root was fully constrained and the material properties of SS400 steel were applied (Young’s modulus: 206.0 GPa; density: 7900 kg/m³; Poisson’s ratio: 0.3). The natural frequency in the sound condition was 1521 Hz within the frequency range of interest, and it decreased progressively to approximately 750 Hz as the cross-sectional deficiency increased to 75%.
Figure 12(c) shows the field inspection results for finger joints Type 1 (540x100x40 mm) and Type 2 (750x100x40 mm) together with the mean values and standard deviation bands. Prior to AE digital hammering inspection, phased-array ultrasonic testing confirmed that no fatigue cracking was present. From Figure 12(c), the obtained evaluation peak frequencies were around 1350 Hz for Type 1 and around 1900 Hz for Type 2. In addition, the standard deviation for each type was within 100 Hz, indicating stable measurement reproducibility. These results suggest that changes in the evaluation peak frequency can serve as an effective indicator for screening abnormalities in finger joints, including fatigue cracking, corrosion, and structural deficiencies.
3.7. Concrete Bridge Deck Slab
Deterioration of concrete and corrosion of reinforcing bars are major factors that lead to the degradation of reinforced concrete structures [17,18]. These two processes often progress in a mutually related manner, and typical forms of damage include salt-induced deterioration and alkali–silica reaction (ASR). Such degradation mechanisms gradually weaken the structural capacity of concrete members and, in severe cases, may ultimately result in structural failure. Although close visual inspection and conventional hammering inspection have traditionally been employed to assess these conditions, the increasing demand for more quantitative and objective diagnostic methods has highlighted their limitations. In response, AE-based digital hammering inspection has been applied to concrete structures as a promising candidate for quantitative evaluation of deterioration, offering the potential to detect internal defects and material degradation with greater consistency and reliability.
Figure 13 shows the back side of a concrete bridge deck slab, the grid of inspection points, and the color-contour map of the evaluation peak frequency. Two areas highlighted with red circles correspond to locations previously judged as spalling based on a conventional hammering inspection conducted in advance. In these areas, the evaluation peak frequencies were in the range of 2–3 kHz, which is markedly lower than the average peak frequency observed across the inspected region. This pronounced reduction is consistent with the presence of material degradation and indicates that the digital AE hammering inspection successfully captured the same anomalies identified by the traditional method. These results demonstrate that the digital hammering approach provides diagnostic performance comparable to conventional hammering inspection, while offering the additional advantage of quantitative frequency-based assessment.
3.8. Concrete Bridge Pier
The effectiveness of AE-based digital hammering inspection for evaluating the surface quality of a concrete bridge pier during the construction stage was also investigated, given that the surface condition plays a critical role in the subsequent deterioration of concrete, particularly in relation to freeze–thaw damage [19]. This examination aimed to determine whether early-stage surface irregularities or defects, which are known to accelerate freezing-induced degradation, can be quantitatively detected through variations in the measured peak frequency.
Figure 14 shows the snapshot of inspection (a), site appearance (b), inspection results visualized by evaluation peak frequency color-contour (c). The concrete placement conditions are “regular” in the area of Part II and “carefully placed” in the areas of Part III and IV. The inspection was carried out at equal intervals of 50 cm lattice. The state of concrete surface can be seen almost uniform without significant drop due to defects by the contour. On the other hand, the average evaluation peak frequencies in the carefully placed regions (Parts III and IV) were several tens to nearly 100 Hz higher than those in the regularly placed Part II. This increase can be attributed to the greater stiffness of Parts III and IV, which results from the higher density and improved consolidation achieved through careful concrete placement.
3.8. Concrete Bridge Abutment
AE digital hammering inspection was conducted on a 1600-mm-thick bridge abutment exhibiting concerns regarding ASR-induced deterioration. Core sampling at two locations revealed compressive strengths of 23.9 and 21.4 N/mm², values notably lower than those typically observed in concrete bridge structures. In addition, long horizontal cracks and localized hexagonal cracking were identified on the abutment surface. The inspection covered an area of 1900 mm in the vertical direction and 5800 mm in the horizontal direction, with measurements taken on a 100-mm grid. Figure 15(a) shows a photograph of the abutment, the grid of inspection points, and the mapped locations of visible cracking indicated by red lines.
Figure 15(b) presents the results of the digital hammering inspection, which reveal lower evaluation peak frequencies along the long horizontal cracks and extremely low-frequency regions at localized points where ASR deterioration appears to be progressing. These reductions in frequency suggest a decrease in elastic modulus, consistent with the presence of ASR-related internal damage.
3.9. PC Grout Insufficient Filling
As an application of AE-based digital hammering inspection, the technique has been employed to identify insufficient grout filling within the sheaths of girders in pre-stressed concrete (PC) bridges. Inadequate grout filling can lead to corrosion of the pre-stressing wires housed in the sheath, posing a significant threat to the structural safety and long-term durability of the bridge. Because such corrosion often progresses invisibly within the sheath, early detection of grout-filling deficiencies is essential for preventing sudden loss of prestress and subsequent structural degradation. Although X-ray transmission methods have been developed and used for this purpose, they remain time-consuming, require specialized equipment and traffic restrictions, and are therefore difficult to apply widely in routine inspections [20]. In contrast, AE-based digital hammering inspection offers a more practical and potentially scalable approach by enabling rapid, non-destructive, and quantitative assessment of grout-filling conditions based on frequency-response characteristics.
Twelve areas along the PC cables were selected for AE-based digital hammering inspection inside the box-shaped girder of a PC bridge. One of these areas had previously been identified, through drilling surveys, as exhibiting insufficient grout filling. In each area, measurements were taken at 20 positions located directly above the PC cable, together with additional measurements at vertical offsets of ±10 cm to obtain reference values representing sound conditions. The inspected regions had a concrete cover of approximately 55 mm over the PC cable and a web thickness of roughly 200 mm.
Figure 16(a) and (b) show color-contour maps of the evaluation peak frequency for AREA 2, where insufficient grout filling of the PC sheath had been confirmed, and AREA 4, where the grout filling was adequate. The position of the PC cable is indicated by white dotted lines. In AREA 2, the evaluation peak frequencies measured directly above the PC cable were markedly lower than those obtained at the vertical offset positions of ±10 cm, as well as those observed in the sound AREA 4. This clear contrast demonstrates that the grout-filling condition can be visually distinguished by comparing the frequency distribution immediately above the cable with that in the surrounding regions.
Figure 16(c) presents (A) the average evaluation peak frequency obtained from the ten measurement points located directly above the PC cable, (B) the average values from the five measurement points positioned 10 cm above and below the cable, and the corresponding difference (A − B) for all twelve inspected areas. The difference in evaluation peak frequency for AREA 2 is conspicuously larger than that of the other areas. This pronounced deviation indicates a localized reduction in stiffness consistent with insufficient grout filling, suggesting that AE-based digital hammering inspection has the potential to quantitatively assess grout-filling deficiencies.
4. Conclusions
The AE-based digital hammering inspection system has been developed as an effective screening tool for the condition assessment of social infrastructure. The study clarified the fundamental principles governing digital hammering inspection by formulating the natural vibration characteristics of beam-shaped metal components and plate-shaped concrete structures in relation to their geometric dimensions and material properties. Field applications to post-installed expansion anchors, foundation bolts, ground anchors, acoustic barrier supports, guardrail posts and their embedded lengths, finger joints, concrete bridge deck slabs, piers, abutments, and the grout-filling fraction of prestressed concrete members demonstrated the system’s broad applicability across diverse structural types. These findings confirm that the AE digital hammering inspection system provides a practical and versatile approach for diagnosing the integrity of social infrastructure and has strong potential to support both routine maintenance and long-term deterioration management.
Author Contributions
Conceptualization, Y.I. and T.Y.; methodology, Y.I. and T.M.; software, R.O.; validation, Y.I., T.Y. and J.T.; formal analysis, R.O.; investigation, M.S., H.F. and M.I.; resources, Y.I. and J.T.; data curation, T.M.; writing—original draft preparation, Y.I.; writing—review and editing, Y.I. and T.Y.; visualization, T.M.; supervision, Y.I.; project administration, T.Y.; funding acquisition, Y.I. All authors have read and agreed to the published version of the manuscript.
Funding
This research was partially funded by the research project titled “Realization of Concrete Internal Structure Diagnosis by Integrated Utilization of Digital Hammering Inspection and AI/Simulation”, conducted from FY2019 to FY2022 under the Construction Technology Research and Development Subsidy Program of the Ministry of Land, Infrastructure, Transport and Tourism, Japan.
Data Availability Statement
Measurements and other relevant data are available from the corresponding author upon request via email.
Conflicts of Interest
The authors declare no conflicts of interest. The funder had no role in the design of the study; in the collection, analyses, or interpretation of data; in the writing of the manuscript; or in the decision to publish the results.
References
- Ministry of Land; Infrastructure; Transport and Tourism Japan. Maintenance, Road Bureau. 2022. Available online: https://www.mlit.go.jp/road/road_e/s3_maintenance.html (accessed on 22 July 2026).
- Standard test method for measuring the P-wave speed and the thickness of concrete plates using the impact-echo method; American Society for Testing and Materials, 1998; pp. C1383–98a.
- Gucunski, N.; Imani, A.; Romero, F.; Nazarian, S.; Yuan, D.; Kutrubes, D. Nondestructive testing to identify concrete bridge deck deterioration, The Second Strategic Highway Research Program, SHRP 2 Report S2-R06A-RR-1; National Academies of Sciences, Engineering, and Medicine, 2012. [Google Scholar]
- Tong, J.; Chiu, C.; Liao, S. An elastic-wave-based imaging method with synthetic aperture focusing technique for scanning defects inside concrete structure. J. Appl. Sci. Eng. 2013, 16(1), 45–50. [Google Scholar]
- Ye, J.; Kobayashi, T.; Iwata, M.; Tsuda, H.; Murakawa, M. Computerized hammer sounding interpretation for concrete assessment with online machine learning. Sensors 2018, 18(3), 833. [Google Scholar] [CrossRef] [PubMed]
- Younes, J.; Kasahara, L.; Yamashita, A.; Asama, H. Acoustic inspection of concrete structures using active weak supervision and visual information. Sensors 2020, 20(3), 629. [Google Scholar] [CrossRef] [PubMed]
- Fujino, Y.; Siringoringo, D. M. Recent research and development programs for infrastructures maintenance, renovation and management in Japan. Struct. Infrastruct. Eng. 2019, 16(1), 3–25. [Google Scholar] [CrossRef]
- Liarakos, E. V.; Providakis, C. P. Concrete damage mapping combining laser scanning vibrometry, dynamic response modeling, and ordinary kriging regression. Mat. Des. Process Comm. 2021, 3, e153. [Google Scholar] [CrossRef]
- Scherr, J. F.; Grosse, C. U. Delamination detection on a concrete bridge deck using impact echo scanning. Struct. Concr. 2021, 22, 806–812. [Google Scholar] [CrossRef]
- Sugimoto, K.; Sugimoto, T.; Utagawa, N.; Kuroda, C. Noncontact inspection using identifying each resonance frequency of defect and laser Doppler vibrometer by spatial spectral entropy. Proceedings of Mtgs. Acoust., Bruges, Belgium, 3–6 September 2019. [Google Scholar]
- Multiphysics CYCLOPEDIA, COMSOL. Eigenfrequency Analysis. Available online: https://www.comsol.com/multiphysics/eigenfrequency-analysis (accessed on 22 July 2026).
- Reid, D. J. Ultrasonic testing of anchor bolts. NDT Tech 2020, 19(1), 1–5. [Google Scholar]
- Liu, X.; Wang, J.; Huang, J.; Jiang, H. Full-scale pullout tests and analyses of ground anchors in rocks under ultimate load conditions. Eng. Geol. 2017, 228(13), 1–10. [Google Scholar] [CrossRef]
- Yinghong, Z.; Bin, W.; Xiao, X.; Zhenghua, Q. A study on torsional guided wave EMAT array and its application in embedment depth inspection of guardrail post. Int. J. Appl. Electromagn. Mech. 2020, 64(1-4), 1065–1072. [Google Scholar] [CrossRef]
- Rao, S. S. THEORY OF VIBRATION Energy Methods, Encyclopedia of Vibration; Elsevier Ltd.: London, United Kingdom, 2001; pp. 1308–1324. [Google Scholar]
- Lima, A. J. M.; de Brito, J. Road Bridge Expansion Joints: Existing Systems and Most Common Defects. Proceedings of Third International Conference on Bridge Maintenance, Safety and Management (IABMAS’ 06), Porto, Portugal, 16–19 July 2006. [Google Scholar]
- PCA R&D Serial No. 2617; Portland Cement Association, Types and causes of concrete deterioration. 2002.
- Malhotra, V. M. CHAPTER 31 Durability of Concrete, Uhlig’s Corrosion Handbook, 3rd ed.; John Wiley & Sons, Inc.: Hoboken, New Jersey, in the United, 2011; pp. 439–450. [Google Scholar]
- Pentacle, V.; Al-Neshawy, F.; Lehtinen, T.; Räsänen, V. Internal and surface deterioration of concrete due to frost action. Proceedings of 15th Internationale Baustofftagung (ibausi), Weimar, Germany, 24–27 September 2003. [Google Scholar]
- Uesaka, M.; Yang, J.; Dobashi, K.; Kusano, J.; Mitsuya, Y.; Iizuka, Y. Quantitative Evaluation of Unfilled Grout in Tendons of Prestressed Concrete Girder Bridges by Portable 950 keV/3.95 MeV X-ray Sources. Appl. Sci. 2021, (11), 5525. [Google Scholar] [CrossRef]
Figure 1.
Aging bridges and tunnels in Japan that have been in service for more than 50 years.
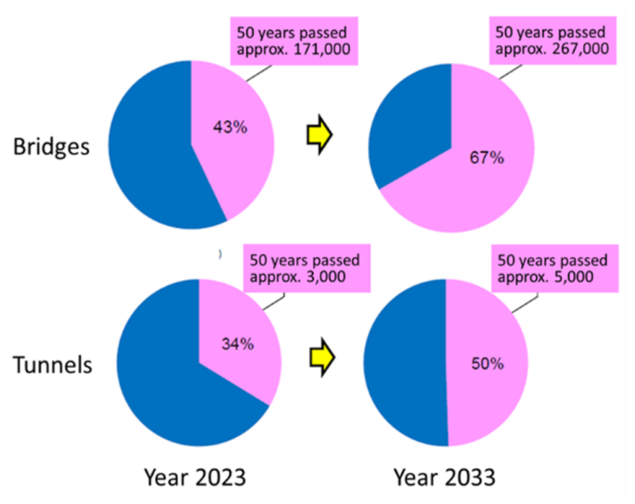
Figure 2.
AE digital hammering inspection system and an example of signal analysis. (a) Portable AE-based digital hammering field inspection system. (b) Frequency response in the 1,000–10,000 Hz range. (c) Signal analysis using FFT (Fast Fourier Transform) processing.
Figure 2.
AE digital hammering inspection system and an example of signal analysis. (a) Portable AE-based digital hammering field inspection system. (b) Frequency response in the 1,000–10,000 Hz range. (c) Signal analysis using FFT (Fast Fourier Transform) processing.
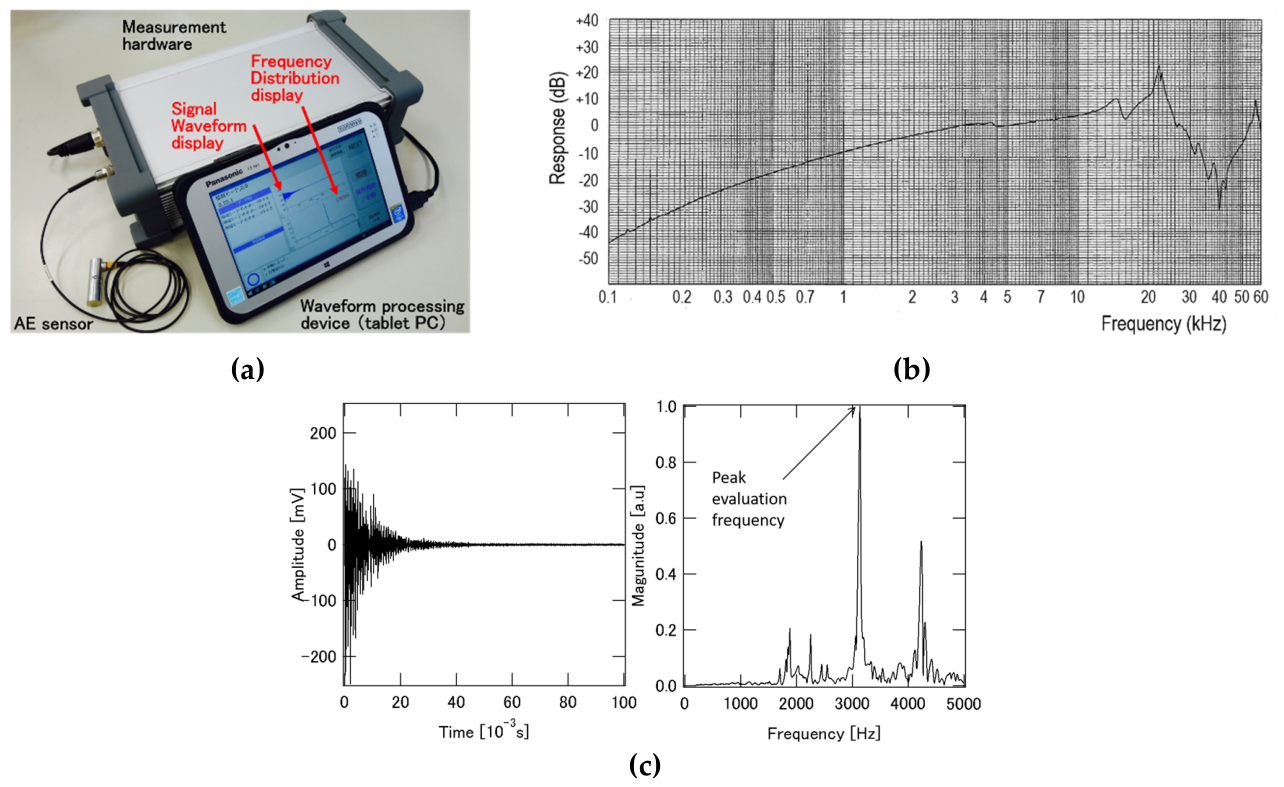
Figure 3.
Relationship between construction defects, age-related deterioration, and natural frequency of M16 anchors.
Figure 3.
Relationship between construction defects, age-related deterioration, and natural frequency of M16 anchors.
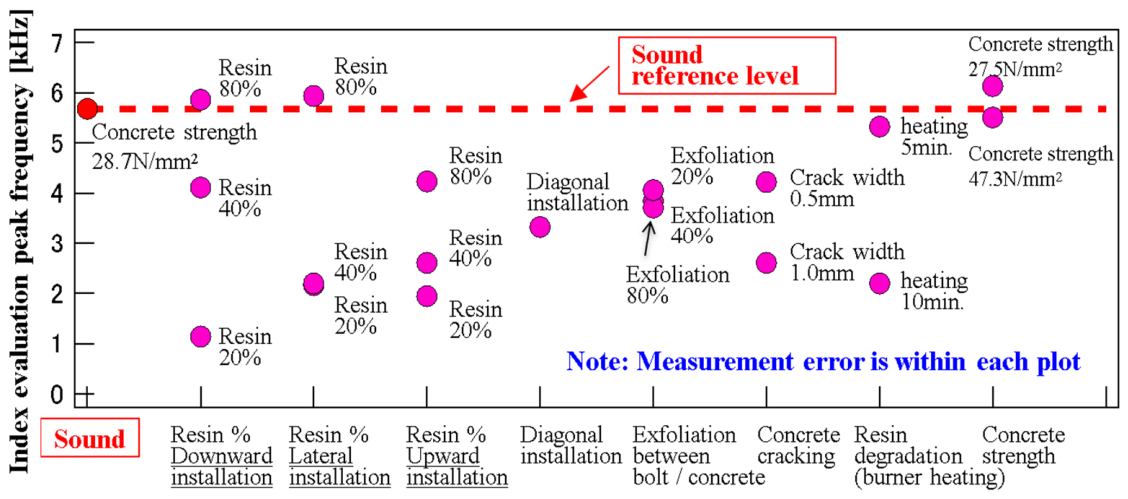
Figure 4.
Examples of on-site inspection of jet fan anchors. (a) On-site inspection of jet fans. (b) Inspection results of anchors supporting jet fans (c) Before and after retightening anchors.
Figure 4.
Examples of on-site inspection of jet fan anchors. (a) On-site inspection of jet fans. (b) Inspection results of anchors supporting jet fans (c) Before and after retightening anchors.
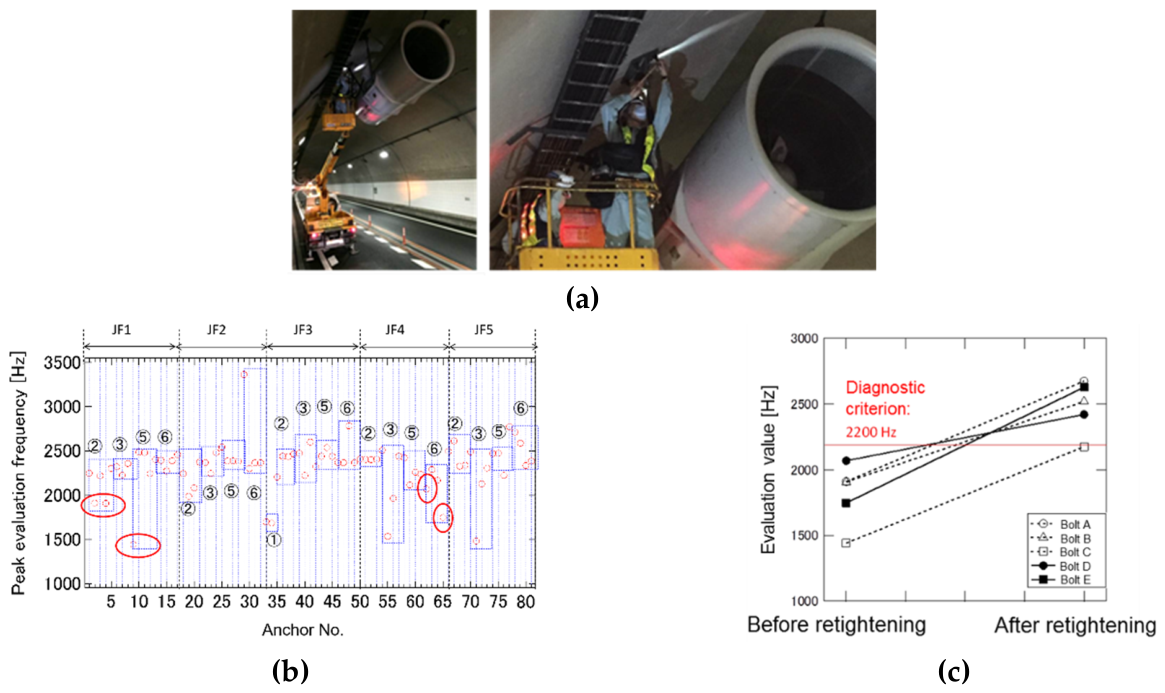
Figure 5.
(a) Inspection for foundation bolts of expressway sign structures. (b) Peak evaluation frequency of foundation bolts after correction for anchor head surplus length. (c) Inspection results.
Figure 5.
(a) Inspection for foundation bolts of expressway sign structures. (b) Peak evaluation frequency of foundation bolts after correction for anchor head surplus length. (c) Inspection results.
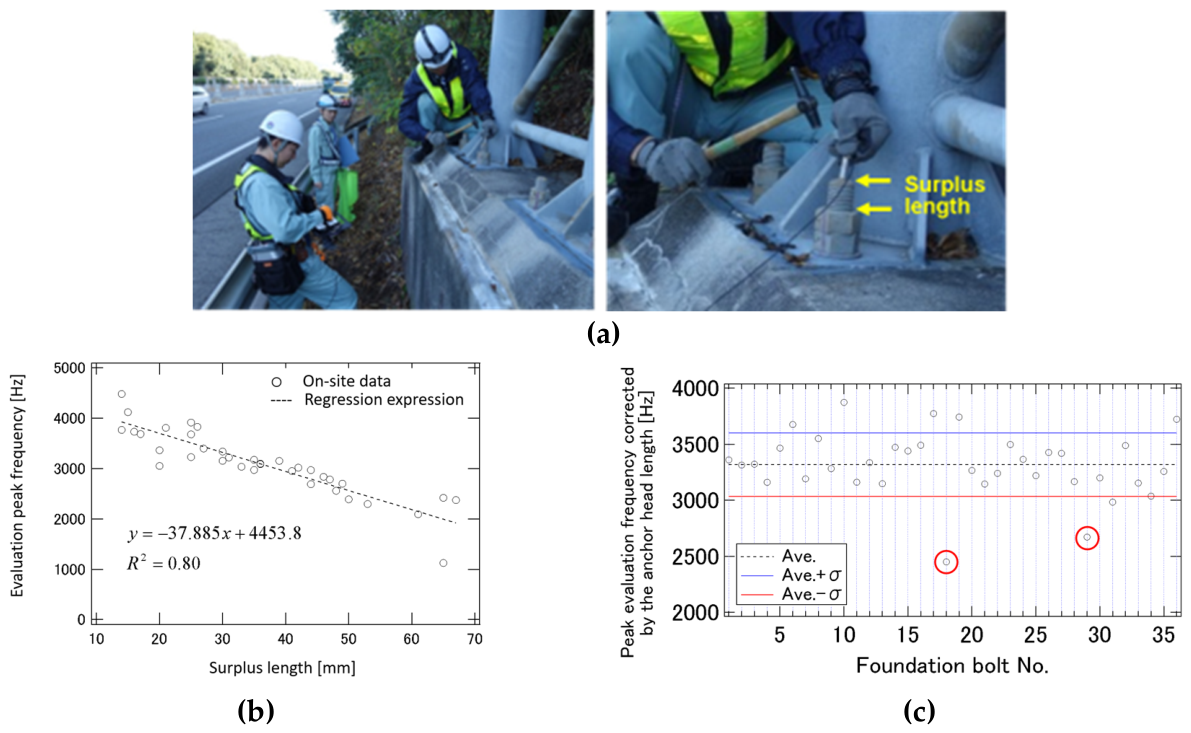
Figure 7.
Field inspections of acoustic barrier support. (a) Two types of acoustic barrier support. (b) Inspection procedure.
Figure 7.
Field inspections of acoustic barrier support. (a) Two types of acoustic barrier support. (b) Inspection procedure.
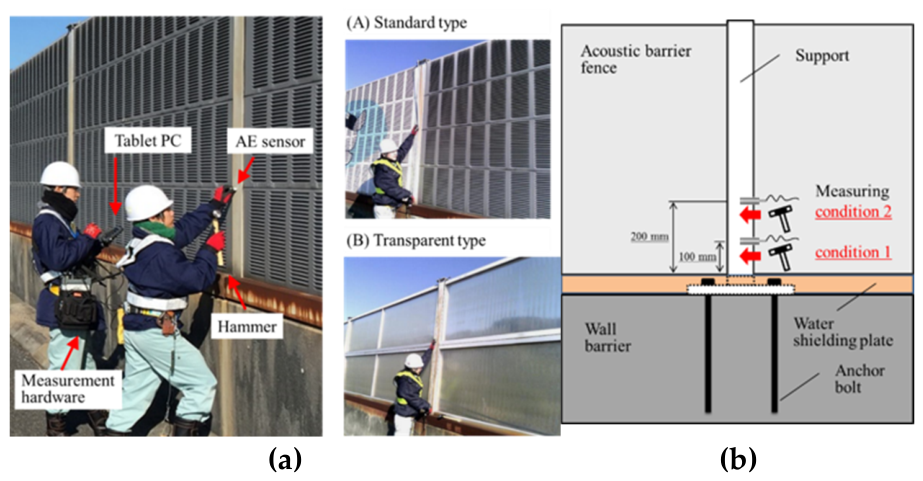
Figure 8.
Field inspection results of acoustic barrier support. (a) Inspection results of two types of support. (b) Comparison of frequency distributions for Support No. 01 and Support No. 17.
Figure 8.
Field inspection results of acoustic barrier support. (a) Inspection results of two types of support. (b) Comparison of frequency distributions for Support No. 01 and Support No. 17.
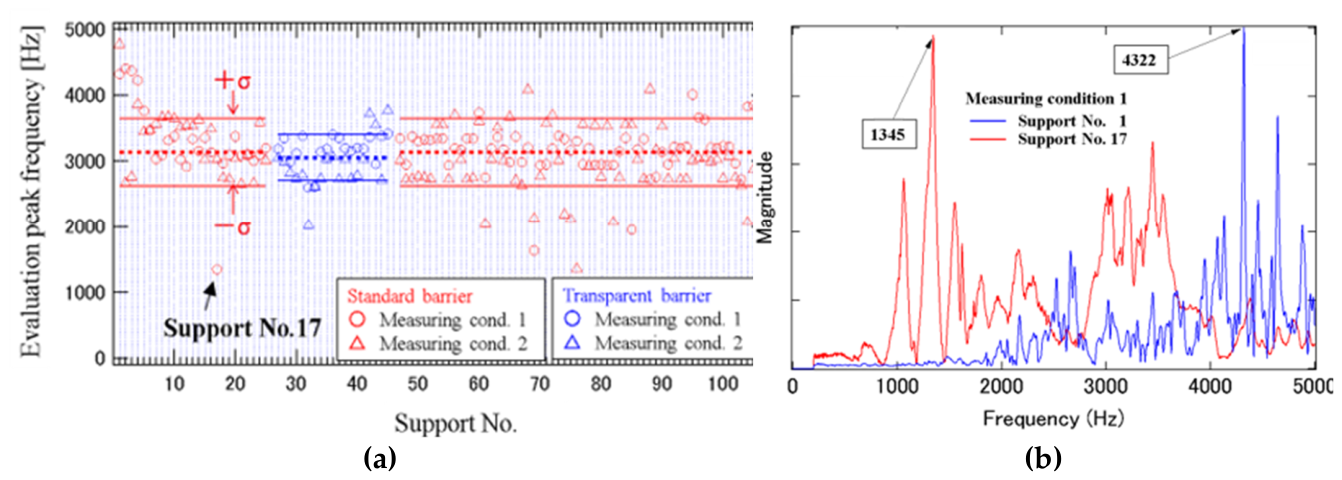
Figure 9.
Inspection for simulated corrosion in guardrail supports. (a) Frequency distribution of the mock-up specimens. (b) Peak frequency change of the specimens.
Figure 9.
Inspection for simulated corrosion in guardrail supports. (a) Frequency distribution of the mock-up specimens. (b) Peak frequency change of the specimens.
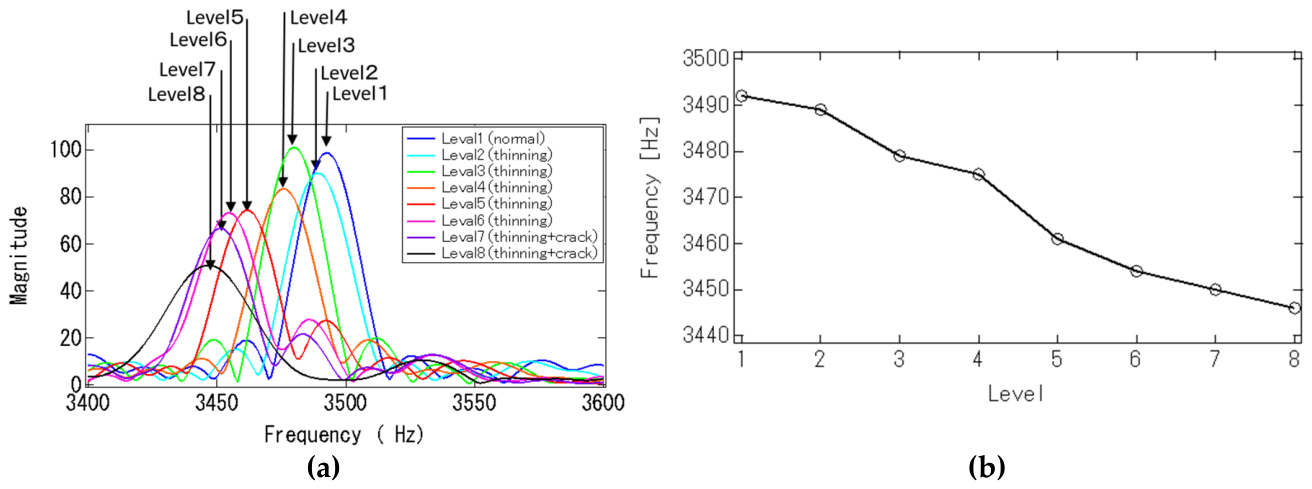
Figure 10.
Field inspection results of corrosion damage in guardrail supports.
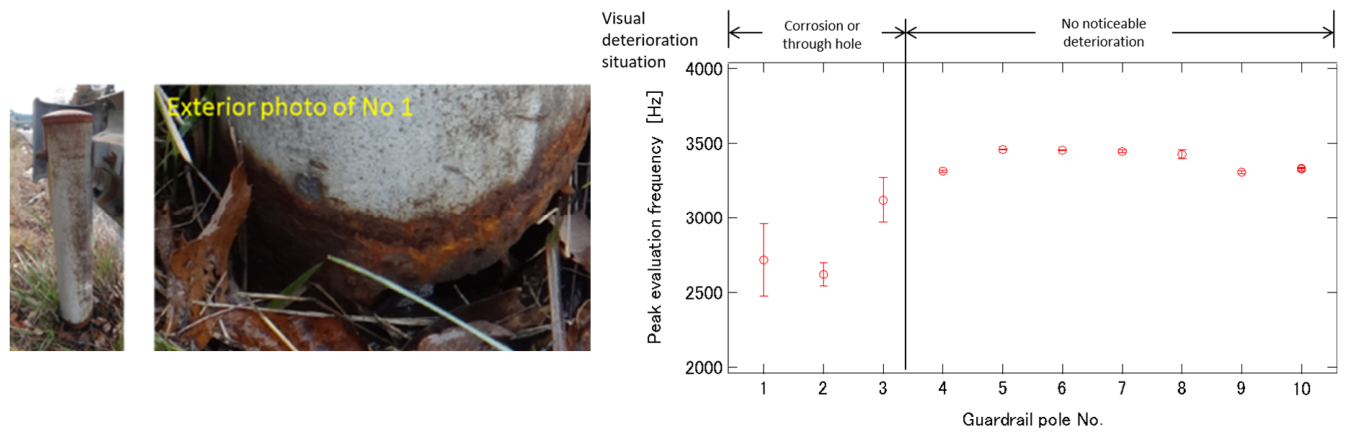
Figure 11.
Field inspection of the embedded length of guardrail supports. (a) Inspection in their in-situ configuration. (b) Frequency distributions.
Figure 11.
Field inspection of the embedded length of guardrail supports. (a) Inspection in their in-situ configuration. (b) Frequency distributions.
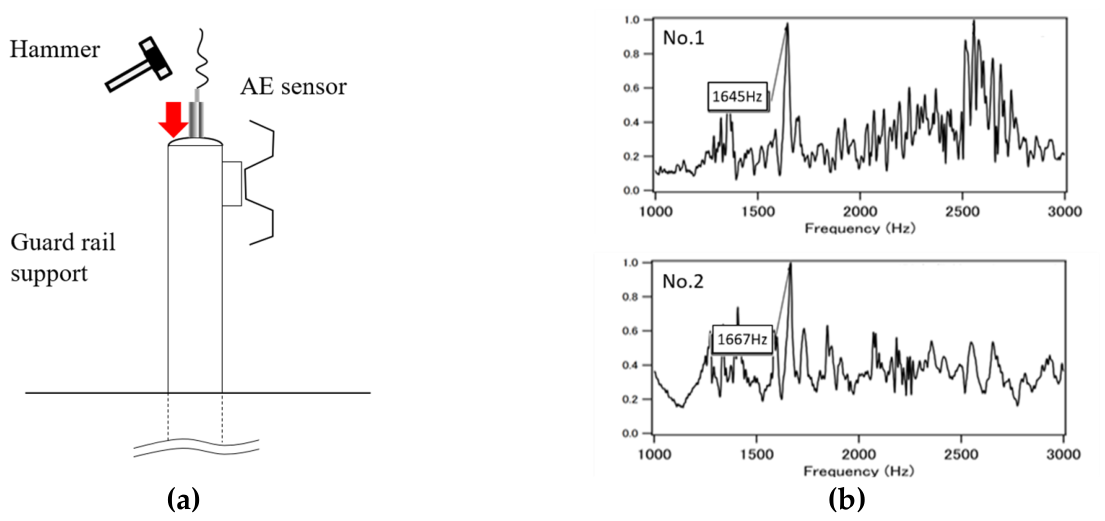
Figure 12.
Inspection of finger joints subjected to fatigue damage. (a) Field inspection. (b) FEM analysis. (c) Field inspection results.
Figure 12.
Inspection of finger joints subjected to fatigue damage. (a) Field inspection. (b) FEM analysis. (c) Field inspection results.
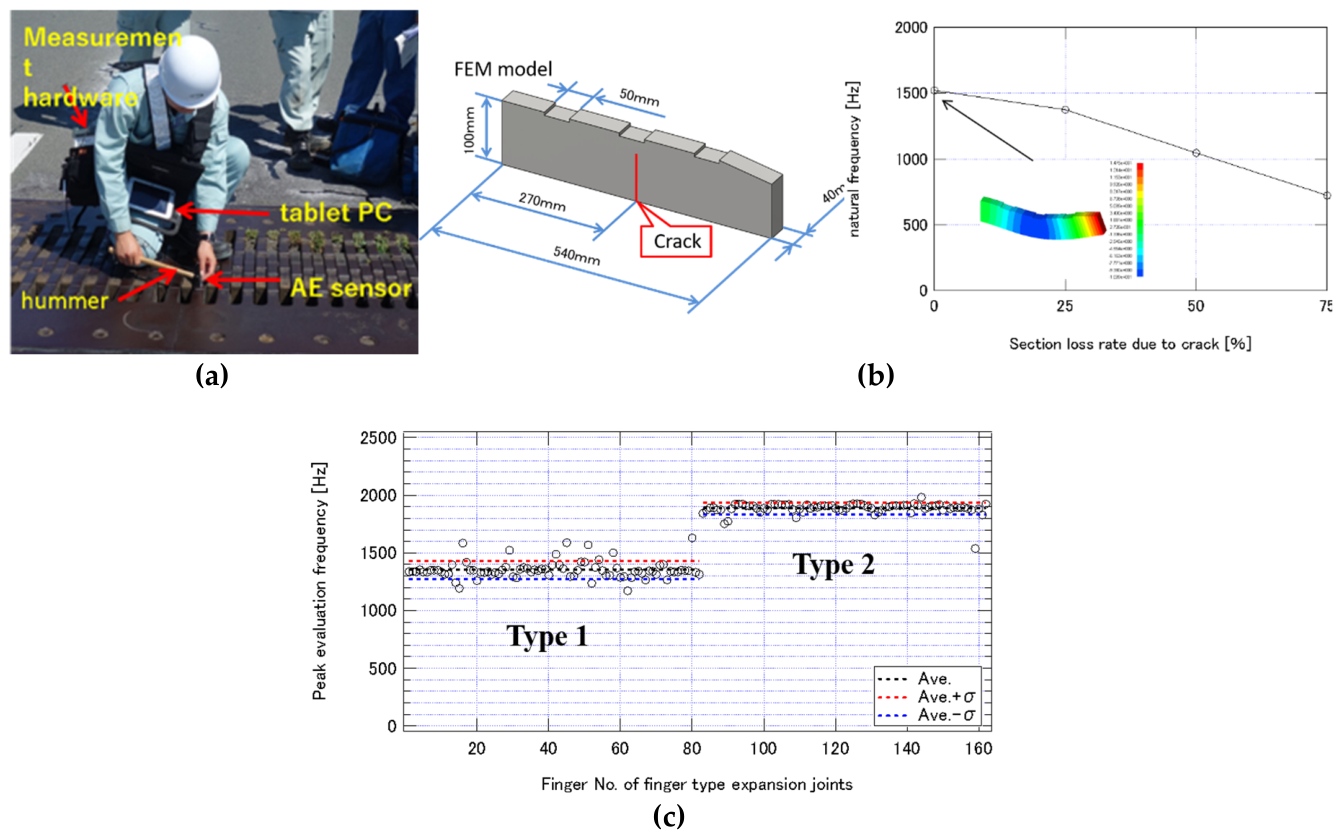
Figure 13.
Inspection of finger joints subjected to fatigue damage.
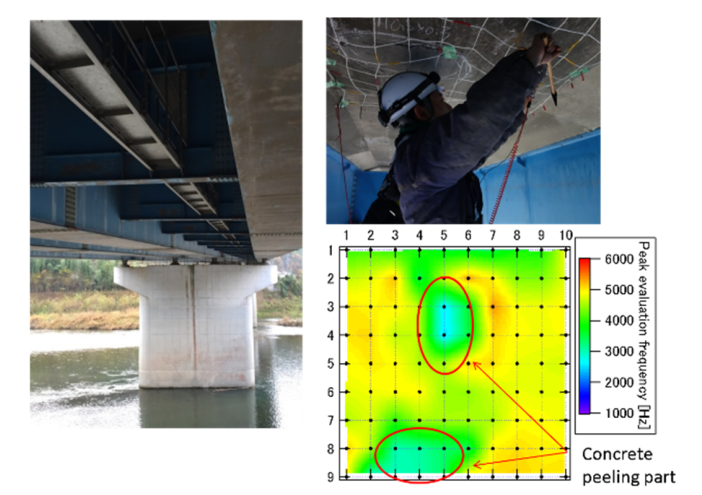
Figure 14.
Field inspection of the quality of a concrete bridge pier. (a) Field inspection. (b) Concrete bridge pier. (c) Field inspection results.
Figure 14.
Field inspection of the quality of a concrete bridge pier. (a) Field inspection. (b) Concrete bridge pier. (c) Field inspection results.
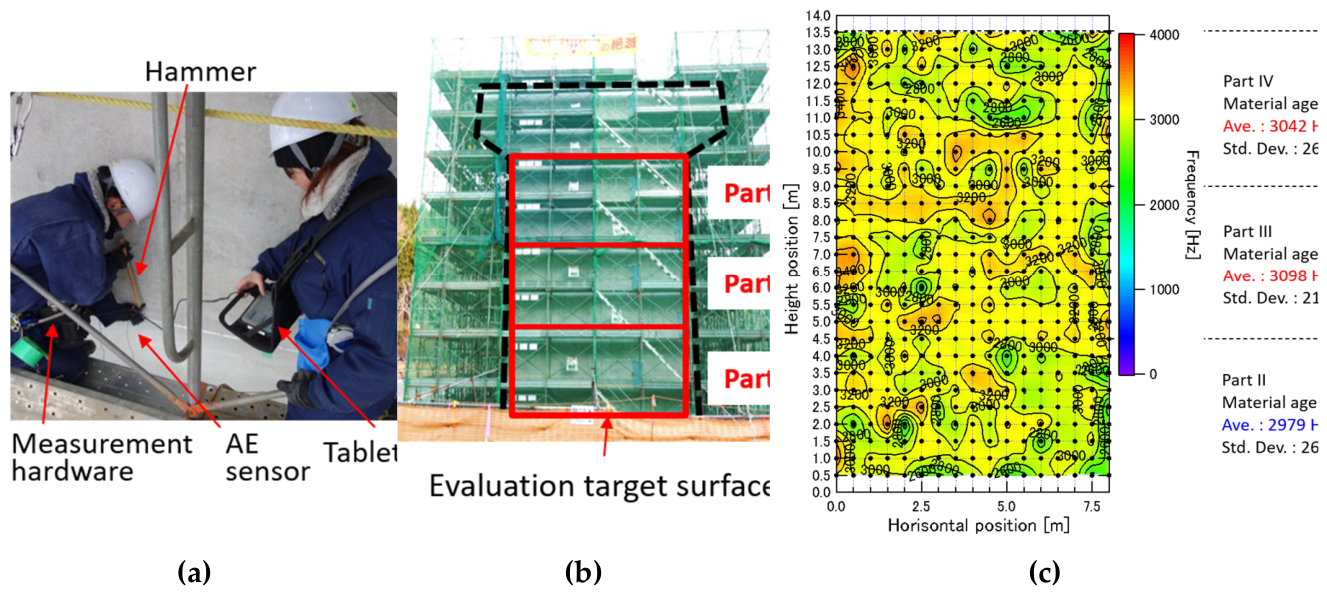
Figure 15.
Field inspection of a concrete bridge abutment. (a) Photograph of the abutment and visible cracking indicated by red lines. (b) Results of inspection showing evaluation peak frequencies.
Figure 15.
Field inspection of a concrete bridge abutment. (a) Photograph of the abutment and visible cracking indicated by red lines. (b) Results of inspection showing evaluation peak frequencies.
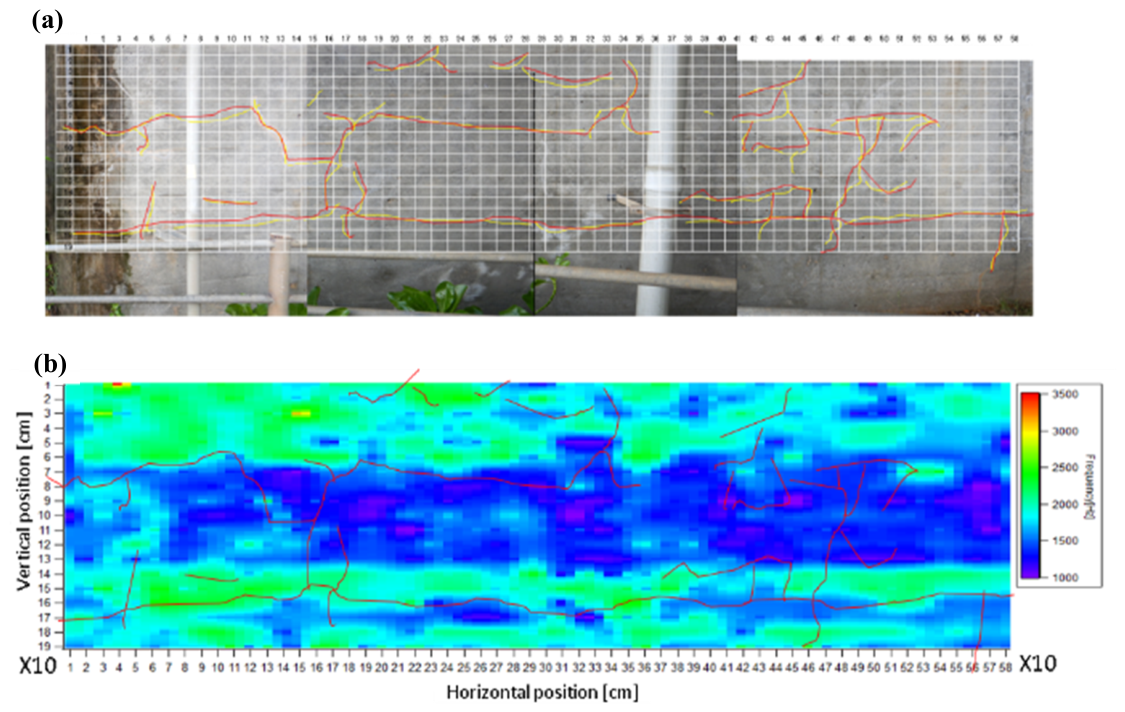
Figure 16.
Field inspection of insufficient PC grout filling. (a) Color-contour map of the evaluation peak frequency for insufficient grout filling of the PC sheath. (b) Color-contour map of the evaluation peak frequency for sufficient grout filling of the PC sheath. (c) Field inspection results.
Figure 16.
Field inspection of insufficient PC grout filling. (a) Color-contour map of the evaluation peak frequency for insufficient grout filling of the PC sheath. (b) Color-contour map of the evaluation peak frequency for sufficient grout filling of the PC sheath. (c) Field inspection results.
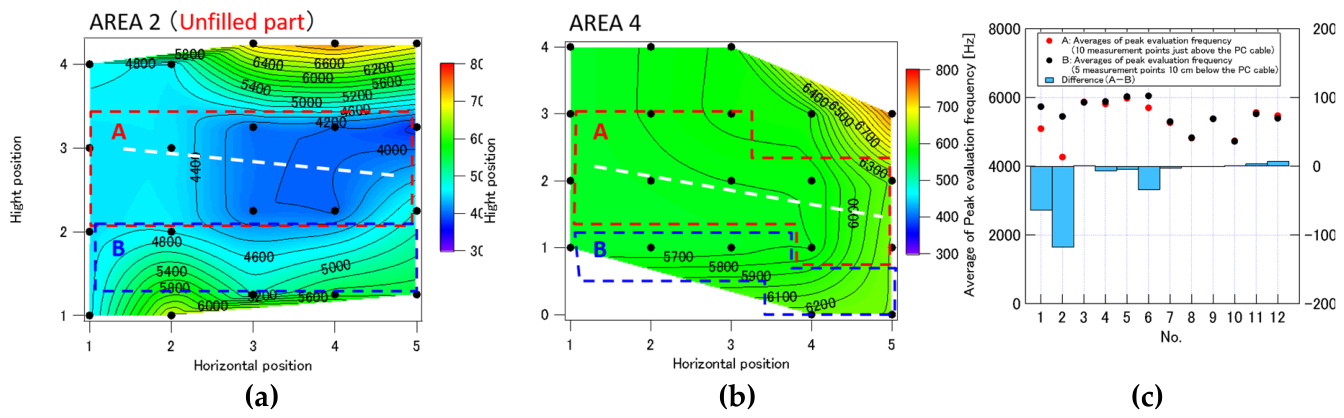

Table 1.
Multiple regression analysis of ground anchor inspection results.
| Anchor type | Product No. of SE corporation |
Anchor head diameter (mm) |
Multiple correlation coef. R |
coef. A | coef. β | coef. γ |
| Type I | F30TA | 40 | 0.39 | 0.045 | -0.446 | 201.3 |
| Type II | F60UA | 48 | 0.87 | 0.235 | -5.413 | 296.3 |
| Type III | F70UA | 48 | 0.43 | 0.029 | -0.196 | 397.0 |
| Type IV | F40UA | 40 | 0.72 | 0.033 | -0.223 | 74.3 |
Table 2.
Results for estimating the embedded length of guard rail supports in soil/.
| Support No. |
Evaluation peak Frequency [Hz] |
Estimated value (full length) [mm] |
Measured value (full length) [mm] |
Difference between estimated and measured [mm] |
| No.1 | 1,645 | 1,552 | 1,620 | -68 |
| No.2 | 1.667 | 1,532 | 1,620 | -88 |
Disclaimer/Publisher’s Note: The statements, opinions and data contained in all publications are solely those of the individual author(s) and contributor(s) and not of MDPI and/or the editor(s). MDPI and/or the editor(s) disclaim responsibility for any injury to people or property resulting from any ideas, methods, instructions or products referred to in the content. |
© 2026 by the authors. Licensee MDPI, Basel, Switzerland. This article is an open access article distributed under the terms and conditions of the Creative Commons Attribution (CC BY) license (http://creativecommons.org/licenses/by/4.0/).
Copyright: This open access article is published under a Creative Commons CC BY 4.0 license, which permit the free download, distribution, and reuse, provided that the author and preprint are cited in any reuse.