

Submitted:
02 September 2026
Posted:
02 September 2026
You are already at the latest version
Abstract
Discrepancies between announced regional seismic intensity and shaking experienced indoors may affect household mitigation and risk communication. We report on a three-year field experiment (2021–2024) in the Greater Tokyo Metropolitan Area combining citizen-hosted low-cost sensors with subjective reports. Up to 92 volunteers participated; sensor hosts kept plug-in micro-electromechanical systems (MEMS) seismometers at home, and participants completed questionnaires after 96 target earthquakes. The system yielded 5,724 responses to 8,054 delivery attempts (response rates of 80.6% in 2022 and 67.6% in 2023), with 96% returned within 72 hours. Findings were robust to unrounded measures. First, municipal Japan Meteorological Agency (JMA) seismic intensity < perceived seismic intensity < indoor seismic intensity; indoor seismic intensity exceeded municipal JMA seismic intensity by roughly one-third of a class (median +0.34 against unrounded instrumental values), with a 1.4-class variation across structures. Second, local intensity was the primary predictor of feeling an event (odds ratio 2.57 per class), whereas the floor-height association was weaker. Third, repeated feedback did not produce detectable calibration; over-reporting biases (+0.4 to +0.7 classes) persisted over up to 96 events. These findings support indoor seismic intensity as a complement to regional metrics for indoor seismic-hazard evaluation, last-mile early warning, and risk communication.
Keywords:
seismic intensity
; felt reports
; citizen seismology
; macroseismic observation
; low-cost MEMS seismometers
; earthquake early warning
; indoor seismic hazard
; risk communication
; site amplification
; Japan
1. Introduction
A macroseismic scale measures the severity of earthquake shaking from its observed effects on people, objects, buildings, and the natural environment and has long played an indispensable role in seismology. It serves four important purposes. First, it quantifies actual damage, which physical metrics recorded by seismometers, such as peak ground acceleration (PGA), cannot directly express. Second, it allows the size of historical earthquakes that predate instrumental networks to be reconstructed from documentary records. Third, it yields shaking distributions dense enough to fill spatial gaps between instruments. Fourth, it provides a common yardstick across countries with different instrumental standards and setups.
Citizen participation in seismology has historically developed along two distinct lineages: sensor hosting and felt reporting. In the sensor-hosting lineage, volunteers host low-cost accelerometers, ranging from the global Quake-Catcher Network [1,2] to Raspberry Pi–based community networks in Japan [3], to densify instrumental observations; the participant’s role is primarily passive in housing a device. Conversely, they are actively reporting their own experiences to systems such as the USGS "Did You Feel It?" (DYFI) framework which aggregates internet questionnaires into community intensities. Over five million responses accumulated over two decades have demonstrated that DYFI provides a surprisingly robust measure of earthquake ground motions (Atkinson and Wald, 2007) [4]. In Japan, macroseismic observation and risk communication have likewise long been pursued through citizen engagement (Furuya and Hirata, 2021) [5].
However, each lineage inherently lacks what the other measures: sensor networks do not record human perception or response, whereas felt-reporting systems lack instrumental measurements at the respondent's exact location. A 20-year retrospective review of the DYFI system (Quitoriano and Wald, 2020; Chen et al., 2020) [6,7] highlighted three key limitations arising from this gap: self-selection bias (fewer than 3% of entries report "not felt", leaving the true denominator unknown); observer-condition variance of roughly 0.6 intensity units, which arises because respondents report from different indoor and outdoor settings and is assumed to cancel out when many reports are averaged, although those settings are not recorded; and validation that must rely on converting ground-motion data from the nearest, often distant, network stations. The review identified physical co-location of human and instrumental measurements as an important future direction for addressing these structural limitations.
Japan provides exceptional conditions for addressing this challenge. The Japan Meteorological Agency (JMA) operates one of the world's densest instrumental intensity networks and publishes municipality-level intensities within minutes of an earthquake, embedding the intensity scale itself into everyday language. In this setting, the critical question is not whether instruments can substitute for felt reports, but how well officially announced municipal JMA seismic intensity represents the shaking that residents actually experience inside their homes and whether that perceptual gap narrows as they accumulate experience alongside immediate, objective feedback.
This question bears directly on seismic mitigation. Earthquakes are experienced, inside dwellings and protective actions are taken or not. Toppling of furniture toppling and injuries depend on indoor shaking rather than free-field intensity on open ground outside the building. Intensity-based alerting, earthquake early warning (EEW) systems, and community preparedness programs all implicitly target indoor environments. Determining how far published municipal intensity departs from indoor conditions is therefore important for assessing indoor seismic hazard.
Here, we report on a three-year panel experiment in the Greater Tokyo Metropolitan Area that combined repeated felt reports with co-located home-seismometer measurements and personalized feedback. Panel here denotes a fixed group of residents who reported repeatedly across successive earthquakes, so that the same individuals are observed under many different levels of shaking. Sensor-hosting residents kept a plug-in micro-electromechanical systems (MEMS) seismometer in their homes, and reported after target earthquakes how strongly they felt the shaking and where they were located. The system also provided personalized information, including measured indoor intensity, nearest-station intensity, and EEW-predicted intensity, as applicable. Human and instrumental observations were collected across 96 earthquakes. We test three core hypotheses:
- H1 (local representativeness): Officially announced municipal JMA seismic intensity under-represents indoor shaking in residences, which exhibits significant home-specific amplification.
- H2 (perception follows local input): The probability of feeling an event is associated primarily with local intensity rather than magnitude or distance alone and increases with the floor level the participant is residing in.
- H3 (feedback calibration): Repeated exposure to immediate, objective feedback reduces the systematic over-reporting error of felt reports over time. This hypothesis motivated the experimental design; the empirical data do not support it.
The behavioral outcomes of the same experiment, focusing on household preparedness and protective actions taken during these earthquakes, are examined in a companion paper (in preparation).
2. The Experiment
2.1. Plug-In Home Seismometer and Automated Survey System
Each participant assigned to host a sensor received a palm-sized MEMS accelerometer unit equipped with a Raspberry Pi–class processor and a mobile Wi-Fi router. The unit was installed by plugging it into a standard wall outlet (Hirata et al., 2022, 2023a, 2023b) [8,9,10]. This unit functions as the QuakeSaver sensor, and its technical deployment for community earthquake risk communication has been validated in previous operations (Hirata et al., 2022) [8]. The units continuously stream 30-minute waveform segments to a cloud server in miniSEED format. An analysis server at the Earthquake Research Institute (ERI), The University of Tokyo, automatically detects seismic events and computes a JMA-equivalent measured instrumental intensity () for each event, referred to here as "indoor seismic intensity." Figure 1 shows a unit installed in a participant's home.
Triggered by high-grade JMA Earthquake Early Warning (EEW) messages, the automated survey pipeline compiled and dispatched personalized messages to participants within approximately 10 to 30 minutes after each target earthquake via email (starting in 2022) or the LINE messaging application (starting in 2023). These notifications reported (a) the participant's own measured indoor seismic intensity, (b) the observed instrumental intensity at the nearest JMA station, and (c) the site-specific EEW-predicted intensity at their home location. Participants who did not host a sensor received the same messages without item (a). The EEW-predicted intensity was calculated from the final real-time EEW telegram using the standard ground-motion attenuation relationship developed by Si and Midorikawa (1999) [11], accounting for local site amplification factors. Each message also contained a link to a secure smartphone/PC questionnaire and a link to the seismic waveform recorded at the sensor. Figure 2 summarizes the complete pipeline from the sensor in the home, through the cloud, to the analysis and delivery server at ERI, and back to the participant.
2.2. Configuration of Seismic Intensity Stations and Indoor Seismometers
High-density seismic observation networks are essential for rapid post-event emergency response after a destructive earthquake. Japan maintains one of the world's densest instrumental intensity networks, with 4,424 active stations nationwide as of October 2023. The Kanto region contains approximately 720 stations, including 708 active stations within our immediate study area (34.9–36.9° N, 138.9–140.9° E). This configuration provides a mean station spacing of 3.38 km (SD 2.11 km; median 3.06 km; range 0.0–14.7 km).
Station coordinates were taken from the official catalogs published by the Japan Meteorological Agency, the National Research Institute for Earth Science and Disaster Resilience (NIED), and the Headquarters for Earthquake Research Promotion. The JMA synthesizes real-time data from this combined network to publish a single representative maximum intensity value for each administrative municipality immediately after an event. We use these official data as our baseline regional metric, defined as "municipal JMA seismic intensity."
Despite the density of the public network, a mean station spacing of ~3.4 km remains insufficient to capture the microscale shaking variations experienced within an individual's living space. Figure 3 overlays the geographic distribution of the citizen-hosted indoor seismometers on the public station network. Hosting was counted separately in each study period, so the 106 installations correspond to 76 distinct homes: 50 residents hosted a sensor in 2022 and 56 in 2023, and 30 of them hosted in both periods. The public stations are spread uniformly across the Kanto plain, whereas the participant-hosted sensors are concentrated within a densely populated urban belt extending from the Tokyo wards through southern Saitama, northwestern Chiba, and eastern Kanagawa, reflecting our recruitment channels. Figure 3b places the target earthquakes in their regional context: their epicenters extend well beyond the study frame, from the 2024 7.6 Noto Peninsula sequence in the west to events off Aomori in the north and in the Izu–Ogasawara region in the south.
The linear distance from each participant's residence to the single nearest active public station averaged 2.08 km (SD 1.37 km; median 1.78 km; range 0.01–8.15 km). Thus, even in densely built metropolitan environments where the public network is most concentrated, an average spatial gap of 2 km separates a resident's home from the nearest ground-surface station. This observational gap motivates the use of co-located indoor instruments and forms the basis for the nearest-station robustness checks detailed in Section 4.1.
2.3. Three-Year Cohort Design
The longitudinal panel experiment expanded across three distinct study periods between 2021 and 2024 (Figure 4; Table 1). A preliminary pilot study in Zama City in 2021 (enrolling 10 sensor hosts and 10 questionnaire-only participants from a local disaster-volunteer network) established the basic questionnaire wording and highlighted the operational need for an automated, real-time survey delivery pipeline.
The 2022 metropolitan study period enrolled 69 residents (50 sensor hosts, 19 non-hosts) across 31 target earthquakes occurring between September 2022 and January 2023, generating 2,139 survey deliveries. The expanded 2023 study period enrolled 92 residents across 65 target earthquakes between September 2023 and March 2024, generating 5,915 deliveries; this period captured the far-field seismic sequence of the 1 January 2024 7.6 Noto Peninsula earthquake. To mitigate potential selection bias, applicants were recruited without being informed of their sensor-hosting assignment at the time of recruitment, and active recording status was continuously verified via server telemetry.
Our participants are active members of safety-leader volunteer networks and university-affiliated community groups. The panel therefore represents a highly disaster-prepared stratum, with a mean baseline score of 7.4 to 7.6 on the ten household preparedness measures of the Tokyo Fire Department's public checklist, Ten Preparations against Earthquakes (https://www.tfd.metro.tokyo.lg.jp/lfe/bou_topic/jisin/sonae10.html). We treat this proactive group as a conservative lower-bound population for evaluating the behavioral and cognitive over-reporting biases identified in this study (Section 5).
2.4. Felt-Report Questionnaire
The per-event digital questionnaire was limited to eight items to optimize response rates and data quality. It captured (i) the respondent's exact indoor location and posture at the time of the shock; (ii) a descriptive shaking assessment using vocabulary compatible with international macroseismic frameworks such as DYFI (e.g., not felt, weak, moderate, strong, violent) (Wald et al., 1999) [12]; (iii) a directly self-assigned perceived seismic intensity using the JMA scale; (iv) any situational information known to the respondent before making their judgment; (v) the specific media channel through which they learned the official JMA intensity; and (vi) whether any pre-planned protective actions were executed, which actions were taken, and which could not be taken (three items).
To address the self-selection and non-reporting biases affecting anonymous, cross-sectional systems (Quitoriano and Wald, 2020) [6], an explicit "did not notice the shaking" pathway was embedded in the interface starting in 2023. This feature raised the "not-felt" capture rate to 85% of total responses in 2023 (Table 1). Metadata analysis of response timestamps further shows that participants referenced the delivered measured indoor intensity before submitting their subjective judgment in only 6% to 10% of felt responses. Thus, in most felt responses, participants submitted their subjective judgments without first consulting the delivered indoor seismic intensity, limiting the potential for immediate feedback to bias their perceived seismic intensity reports.
2.5. The JMA Intensity Scale in International Context
Throughout this study, "intensity" refers strictly to the seismic intensity scale of the Japan Meteorological Agency (JMA), which has been in continuous operational use since the late nineteenth century and is deeply embedded in public language and understanding in Japan. The modern discrete JMA scale consists of ten categories: 0, 1, 2, 3, 4, 5 Lower (), 5 Upper (), 6 Lower (), 6 Upper (), and 7. Since 1996, official JMA bulletins have used automated instrumental calculation rather than human observational reporting: a continuous instrumental intensity value is derived from band-pass-filtered, three-component acceleration waveforms using a 0.3-second duration threshold criterion (Japan Meteorological Agency, 1996) [13]. The discrete JMA class is then assigned using fixed mathematical boundaries (e.g., class 1 spans 0.5 to 1.5; class 2 spans 1.5 to 2.5). Indoor seismometer readings are available as continuous instrumental intensity values and discrete JMA classes, whereas participants directly self-assign discrete perceived seismic intensity values.
For international comparison, Table 2 provides an approximate macroseismic correspondence with the European Macroseismic Scale (EMS-98), following the guidelines established by Musson et al. (2010). Across the weak-to-moderate motion domain analyzed in this study (JMA classes 0 to 4), the scale corresponds approximately to EMS-98 (and Modified Mercalli Intensity, MMI) degrees I to VI.
Two methodological caveats are important. First, such conversions compare the linguistic descriptors of scale definitions rather than empirical co-assignments (Musson et al., 2010; Wong and Trifunac, 1979)[14,15]. Second, a modern JMA value represents automated physical ground motion at a point, whereas EMS-98 or MMI traditionally evaluate aggregated human and environmental effects. Our survey design also differs from the USGS DYFI system (Wald et al., 1999) [12]. Because Japanese citizens are fluent in the JMA scale, they directly self-assign a discrete intensity value, whereas DYFI computes a Community Decimal Intensity (CDI) through a weighted matrix of reported effects (Dengler and Dewey, 1998) [16]. This direct self-assignment is a deliberate feature of our panel design, allowing us to evaluate the accuracy of the metric that residents themselves use and communicate during an emergency.
2.6. Validity of the Plug-In Units at Low Intensity
Because our core statistical comparisons rely on indoor instrumental intensity data, we first need to establish that low-cost plug-in MEMS sensors provide scientifically meaningful data during weak ground shaking. A well-documented limitation of low-cost MEMS accelerometers is their relatively high electronic self-noise floor. For example, the smartphone-based i-jishin network exhibits a continuous internal noise floor of approximately gal, which routinely obscures earthquake waveforms at or below JMA intensity 2 (Naito et al., 2013)[17].
We evaluated the data validity of our QuakeSaver sensors in two ways. First, we isolated the 3,659 person-events for which the JMA published no municipal intensity bulletin, indicating that regional ground motion fell below the instrumental threshold of 0.5. Within this sub-threshold dataset, the median intensity reported by the home sensors was 0.47, with a 5th percentile of 0.06; 80% of all idle readings remained below 1.0. For the 77 home units that recorded at least ten events, every sensor reported a value of 0.44 or lower during its least-active interval, with a median per-unit minimum of 0.06. Because any active reading combines ambient ground motion with electronic noise, these empirical minima bound the true instrumental noise floor of the devices well below intensity 1.0.
Second, indoor intensities were compared with municipal instrumental intensities for the 1,209 person-events for which municipal values were available (Figure 5). The two metrics were strongly correlated (Pearson's , Spearman's ), with indoor values remaining systematically higher because of structural amplification. The lower edge of the distribution is particularly informative. Because indoor shaking is mechanically expected to be at least as intense as free-field ground-surface motion, indoor values for the least-amplified structures should coincide with the municipal baseline. If electronic noise were artificially inflating low-intensity readings, the lower bound of the scatter plot would instead flatten horizontally above the municipal values.
For municipal intensities between 0.5 and 1.5, the binned 10th percentile of indoor intensity aligns closely with the 1:1 line (with minimal offsets ranging from −0.14 to −0.20) and tracks the municipal baseline linearly down to 0.40 without visible flattening. These results indicate that the low-cost devices provide reliable, meaningful instrumental intensities down to the physical threshold of JMA intensity class 1.
3. Data
This study uses three distinct measures of intensity: perceived seismic intensity, indoor seismic intensity, and municipal JMA seismic intensity. The latter represents regional shaking at the administrative level. For each municipality, JMA determines this baseline by selecting the maximum instrumental intensity () recorded among all active stations (operated by JMA, local governments, and NIED) within the municipal boundary. This value is then mapped onto the 10-level discrete JMA seismic intensity scale ranging from 0 to 7. We use these three terms consistently throughout the text.
The analysis compares these three intensity measures for the same participant and earthquake event, with municipal JMA seismic intensity serving as the regional reference for the participant’s municipality. The agreement rates reported below are not variables used in the analysis; rather, they verify the accuracy of the compiled data.
The delivery logs form the raw data pool for statistical analysis, with 5,724 responses obtained from 8,054 delivery attempts to residents (2,139 in 2022; 5,915 in 2023), representing response rates of 80.6% and 67.6%, respectively. The 96 target earthquakes comprise 31 events in the 2022 study period and 65 in 2023; the 2021 pilot used paper questionnaires and is not included in the event count. Response delays were generally brief (median: 3.3 hours; 90% within 24 hours; 96% within 72 hours). Delayed responses were predominantly "not felt" reports, supporting the use of a 72-hour (or until the subsequent event) analytical time window. All 96 events were cross-checked against official JMA epicenter/hypocenter records and municipal JMA seismic intensity data retrieved via the P2P Earthquake Information Archive. One event (21 December 2023, 23:17 JST, off the east coast of Chiba Prefecture) reached no participating municipality at JMA intensity class 1 or above, so JMA issued no seismic intensity bulletin for it. That event is retained in the delivery and response counts, but no municipal intensity or hypocenter record could be assigned to it, and it is therefore absent from the intensity-based analyses.
The assigned municipal intensities aligned closely with the nearest-station values delivered to individual users by our system (71% exact match; 98% within intensity class; Spearman's ). This comparison serves as a compilation check because the two values represent different quantities: the maximum within a municipality and the value at an individual's nearest station. Exact agreement is therefore not expected. Participant records across the three study periods were linked using anonymous individual identifiers and passed a 45-item data integrity audit. Research team members and administrative personnel were excluded from the analysis. Approximately 990 felt reports were obtained from residents; 839 of these, submitted from home for events with defined municipal JMA seismic intensities, formed the core sample for testing hypotheses H1 and H3.
For the 95 events with a JMA record, we additionally compiled the instrumental intensities (to one decimal place) of every station that observed intensity 1 or greater from the seismic-intensity files of the Monthly Seismological Bulletin and the appendices of the Monthly Report on Earthquakes and Volcanoes. A participant's municipal instrumental intensity is not the value at the nearest station but the maximum across all stations within the municipality where that participant lives, following the definition of the published municipal JMA seismic intensity. Reclassifying these values reproduces, for 99.4% of person-events, the class independently assigned to the same municipality in the archive of real-time JMA bulletins. This provides a second compilation check because the same quantity is derived from two sources: the definitive monthly bulletins and the real-time telegrams. It is not a comparison with indoor or nearest-station values.
The 0.6% disagreement (48 of 7,651 person-events) corresponded to 38 independent cases (municipality x earthquake), because several participants shared a municipality and event; all cases were checked individually. In 29 cases, the archive had failed to match the municipality name and assigned no intensity, 25 of them in a single municipality. In the remaining nine, the archive value exceeded the bulletin value, and all occurred during periods when earthquakes happened in quick succession. For such periods, the real-time announcements can carry intensities observed from a different earthquake, and the JMA provides per-earthquake intensities in its periodical bulletins. We therefore treated the bulletin as authoritative at the level of the individual earthquake and used its values here. Stations below intensity 1 are not published, so instrumental values <0.5 are censored; analyses using them bound this censoring (midpoint 0.25; sensitivity bounds 0.00/0.49).
For these data, the statistical analyses comprise (i) class-agreement tabulations; (ii) linear mixed-effects models for the signed gap (felt minus municipal class) with person random intercepts and event demeaning (equivalent to event fixed effects); (iii) population-averaged logistic models using generalized estimating equations (GEE; exchangeable working correlation, person clusters) for the probability of feeling an event; and (iv) person-level nonparametric tests and instrumental-intensity robustness checks. All analyses were performed in Python 3.13.5 with statsmodels 0.14.6, SciPy 1.17.1, NumPy 2.4.4, and pandas 3.0.2.
4. Results
The analysis covers the two primary study periods, 2022 and 2023. As outlined in Section 2.3, the longitudinal experiment included three phases. However, the preliminary 2021 pilot in Zama City was an operational study designed to refine the questionnaire, and its paper-based distribution left the exact response denominator undefined. Accordingly, the results below are based only on the systematic digital datasets from the second and third study periods.
4.1. A Robust Three-Way Ordering: Municipal JMA Seismic Intensity < Perceived Seismic Intensity < Indoor Seismic Intensity (H1)
Figure 6 cross-tabulates at-home perceived seismic intensity against measured indoor seismic intensity and municipal JMA seismic intensity across both study periods. Compared with measured indoor seismic intensity, subjective assessments matched the instrumental classes in exactly 50% of cases in both 2022 and 2023, while under-reporting by exactly one class occurred in approximately one-third of cases (signed mean offset: −0.20 in 2022 and −0.26 in 2023).
Conversely, relative to official municipal JMA seismic intensities, exact class matches were 37% and 41%, respectively. Perceived seismic intensity exceeded official municipal JMA seismic intensity by a stable average of +0.44 classes. This systematic bias was reproduced across two annual cohorts and distinct seismic events.
These results show that the participants generally reported greater shaking than indicated by official municipal bulletins but less than their in-home instruments physically recorded. Perceived seismic intensity therefore lies between the free-field regional baseline and the measured indoor environment and is closer to the indoor measurement. This is supported by the mean absolute differences (0.56 classes against indoor intensity versus 0.72 classes against municipal intensity). Among the 569 discrete felt responses, 219 were closer to the indoor measurement, whereas only 137 were closer to the municipal bulletin (binomial ). Rank correlations with the two reference metrics were similar (Spearman's against indoor intensity and against municipal intensity).
Person-level analyses further support the consistent excess of perceived intensity over official published metrics. When aggregated within individual participants (), the mean individual perceived intensity exceeded the municipal JMA seismic intensity class by +0.38 (95% CI: +0.26 to +0.49; Cohen's ; with Student's , Wilcoxon signed-rank, and sign tests all yielding ). Using the unrounded municipal instrumental intensity derived to one decimal place from official JMA files does not change this conclusion (+0.36 class excess, 95% CI: +0.26 to +0.46, ). The pattern also remains under highly conservative sub-threshold censoring bounds (+0.30 class excess, ).
The over-reporting bias was similar among non-hosts (person-level mean excess: +0.33, ) and active sensor hosts (+0.40, ), with no statistically significant difference between the two groups (). Because non-hosts received the same nearest-station and early-warning intensity information as hosts and differed only in not receiving the intensity measured inside their own homes, this similarity argues against feedback on indoor measurements as the source of the observed behavioral bias. Both groups received the station and early-warning values, so the present design cannot separate any effect of that shared exposure from the bias.
The systematic over-reporting was concentrated at weak-shaking thresholds. Relative to the unrounded municipal instrumental intensity, the perceived excess declined from +1.00 classes for sub-threshold events (intensities below 0.5) to +0.33 and +0.12 classes within the 1.0–1.5 and 1.5–2.0 intensity ranges, where truncation artifacts do not operate, and then to −0.09 classes for events exceeding intensity 2.0. The three-way ordering was also reproduced using continuous unrounded reference values. Among 2023 sensor hosts, the mean nearest-station instrumental intensity (1.16) was lower than human perceived intensity (1.70), which was in turn lower than measured indoor seismic intensity (1.96; ).
Although municipal JMA seismic intensity is the metric that citizens directly encounter, it is defined as the maximum observed value across an entire administrative boundary. This definition may make the regional baseline higher than the localized conditions at a participant's residence. To control for this spatial factor, we re-evaluated the three-way ordering using the single public observation station geographically closest to each resident's address instead of the municipal baseline.
We calculated linear distances between participant coordinates and official public station networks. The station identified geometrically was compared with the station recorded in our real-time delivery logs, showing strong baseline agreement (73% exact match in 2022 and 61% in 2023) and small differences in corresponding instrumental values (mean differences of +0.011 and +0.009; mean absolute errors of 0.06 and 0.09).
Audit logs showed that the station routing table used by the real-time telemetry system inadvertently contained several public stations that had been officially decommissioned before the study (affecting 10 out of 92 residents in 2023). Because published instrumental datasets do not exist for inactive stations, using the system delivery logs directly would introduce a systematic downward bias for these participants. We therefore use the geometrically computed active station network across both cohorts. Restricting the validation model to system logs for active stations yields identical results.
Against this localized nearest-station reference, the mean individual perceived excess increased to +0.48 classes (95% CI: +0.38 to +0.58; Cohen's ; persons; split as +0.42 in 2022 and +0.48 in 2023). This increase is expected because the reference shifts from a municipality-wide maximum to a single localized surface instrument. The three-way ordering was retained under this localized control framework: nearest-station intensity (1.18) < human perceived intensity (1.66) < indoor seismic intensity (1.90; person-events).
4.2. Site Amplification Is Large, Home-Specific, and Stochastically Variable (H1)
For the 106 host-site-years that accumulated at least 15 seismic events, measured indoor seismic intensity correlated strongly with municipal JMA seismic intensity within each fixed structure (median within-site ). However, these models show a substantial site-specific mean excess of +0.55 classes (median) relative to the discrete municipal baseline, spanning from −0.1 to +1.3 classes across unique homes (Figure 7). This 1.4-class spread is consistent with variations in building materials, floor height, and localized geological site amplification factors.
Because public stations registering below intensity 1.0 are omitted from standard JMA bulletins, this discrete class-referenced metric treats sub-threshold municipal ground motion as zero, representing an analytical upper bound. Re-estimating this amplification factor at the household level against continuous, observed unrounded municipal instrumental intensities yields a localized median excess of +0.34 classes (across 76 actively recording homes; with strict sensitivity bounds evaluated at +0.15 to +0.53). We therefore use this +0.34 class value as the baseline estimate of structural amplification. This household-level estimate averages over all delivered events, most of which were not felt, whereas the person-level excess in Section 4.1 averages over at-home felt responses only. The two values are therefore not directly comparable. Across the 570 responses for which all three metrics are available, the three-way ordering is retained: municipal 1.24 < perceived 1.66 < indoor 1.91.
The event-to-event stochastic variability recorded within an individual structure (median within-site SD: 0.41) matches or exceeds the systematic variation measured between structures (between-home SD: 0.30). Structural amplification therefore cannot be modeled as a fixed multiplier. At a constant municipal JMA seismic intensity, the indoor seismic excess increases weakly with epicentral distance ( for class 2 events), a pattern consistent with the long-period resonant response of residential structures to distant deep-source earthquakes.
The structural amplification pattern remained similar when the nearest public station was substituted as the baseline reference (104 site-years; median excess: +0.37 classes; between-home SD: 0.27). Home-level statistics in this section isolate residential environments by excluding two person-years of telemetry recorded from a participant's commercial workplace.
4.3. Probability of Feeling a Seismic Event Is Primarily Associated with Local Intensity (H2)
To evaluate factors associated with noticing an earthquake, we fitted population-averaged logistic regression models using generalized estimating equations (GEE) with exchangeable working correlation structures and person-level clustering across 5,462 distinct delivery responses; the model that adds floor height uses 5,322 responses (Table 3). The odds of a resident noticing a seismic event were most strongly associated with the local intensity of the shock, increasing 2.57-fold per municipal JMA seismic intensity class (95% CI: 2.21 to 2.99). In the fitted model, this association was stronger than those for epicentral distance (OR: 0.39 per log-unit) and earthquake magnitude.
Seismic magnitude retained a small but statistically significant independent positive effect (OR: 2.28 per unit) after controlling for intensity. This association may reflect longer wave durations or long-period spectral content, which are more characteristic of larger ruptures and may affect human perception in ways not fully captured by automated instrumental intensity algorithms. The resulting population-level predicted probabilities increased from a baseline of 9% at JMA class 0 to 63% at JMA class 3 (Figure 8).
Living primarily on the third floor or higher of a residential building was associated with approximately 1.5-fold higher odds of feeling an event, although the estimate was borderline (OR: 1.47; ), and was directionally consistent with the physical instrumental amplification recorded by upper-floor sensors. Active sensor hosts also exhibited higher reporting odds (OR: 1.56) than questionnaire-only participants, a pattern that may reflect greater personal salience or sustained civic motivation within the device-hosting panel.
4.4. No Detectable Perceptual Calibration with Iterative Personalized Feedback (H3 Not Supported)
The core design of this field experiment hypothesized that exposing citizens to dozens of real-time feedback cycles, in which their home's exact instrumental intensity was reported alongside official benchmarks, would gradually reduce the gap between perceived seismic intensity and objective measurements. A naive time-series evaluation appears to support this hypothesis, as the raw signed gap (perceived minus municipal class) decreases linearly over the 2023 calendar timeline.
However, macroseismic analysis indicates that this apparent learning effect is attributable to seasonal changes in earthquake characteristics. When each participant's sequential felt reports are ordered by cumulative personal felt experience, the raw signed over-reporting bias shows no clear trend (Figure 9, panel a). After event demeaning to control for changes in the composition and source parameters of sequential earthquakes, individual perceptual trajectories likewise show no evidence of convergence toward the objective benchmarks (Figure 9, panel b).
To test this formally, we fitted linear mixed-effects models across 839 felt reports clustered within 107 individuals, specifying person-level random intercepts (Table 4). The model indicated that the experience effect was statistically negligible ( per standard deviation of cumulative events; ), with no significant interaction at stronger shaking levels (). More complex random-slopes models produced the same null conclusion.
A positive correlation was observed between an individual's total lifetime felt-report count and mean over-reporting bias (), suggesting that participants who notice minor shaking more frequently may have a relatively stable sensitivity characteristic rather than an easily trainable skill. Together with the longitudinal results, the +0.4 to +0.7 class over-reporting bias relative to official public bulletins appears persistent over the study period despite repeated personalized objective feedback.
5. Discussion
5.1. What Municipal Bulletins Miss and What Perception Recovers
The three-way ordering identified in this study shows that municipality-level public intensity systematically under-represents measured indoor seismic intensity by roughly one-third of an intensity class on average and by about one full class for the most amplified residential structures. Perceived seismic intensity, however, recovers only part of this discrepancy. From a risk-communication perspective, a resident's report that they "felt stronger shaking than the officially announced intensity" may therefore reflect a genuine difference between municipal and indoor conditions rather than only perceptual error. This interpretation is supported by the finding that the participants' perceived seismic intensity was within a single discrete class of measured indoor seismic intensity in 86% to 91% of observed instances.
5.2. Significance of the Null Perceptual Calibration Result
Hypothesis H3 provided the analytical basis for our real-time feedback architecture and reflects an intuitive assumption in risk communication: continuous exposure to objective data may gradually refine subjective human judgment. However, the lack of evidence for calibration within a longitudinal panel exposed to up to 96 feedback cycles suggests that perceived seismic intensity is relatively stable and systematically biased rather than readily trainable.
This finding supports the continued value of direct physical measurements. If subjective human perception remains resistant to calibration, a continuous in-home visual display of measured indoor seismic intensity could provide a direct source of objective situational information. We note, however, that within the limited subsample of strong shaking (JMA class ), the point estimates lean slightly toward weak calibration; a definitive conclusion for this subpopulation will require a larger longitudinal dataset containing high-intensity seismic events.
5.3. Bridging Measurement and Mitigation Paradigms
First, for indoor seismic-hazard assessment, the measured home-specific amplification (median class, reaching up to ) may help inform microscale adjustments to standard free-field hazard assessments, which operate at the ground-surface level, to better represent the physical environment experienced by residents.
Second, for the "last mile" of earthquake early warning (EEW), the source-based localized intensity predictions provided by our automated alert system correlated only moderately with the actual indoor seismic intensities measured post-event (; based on 5,570 deliveries across both study periods). When predicted instrumental intensity was below 0, the automated alert message stated "0 or less." These entries were initially omitted as missing data; however, restricting the analysis to the numeric subset attenuated the correlation to , an artifact of dropping the weak-prediction cases. Treating these low-intensity data points as left-censored ranks increased the correlation to in 2022 and in 2023. This finding highlights the complementary roles of localized sensing and EEW: advance warning forecasts incoming shaking, whereas the in-home sensor evaluates and records the building's actual seismic response.
Third, for public risk communication, given the absence of perceptual calibration in Section 4.4, public safety initiatives may benefit from disseminating observed indoor measurements rather than relying on residents to mentally adjust their assessments. The extent to which this continuous information fosters long-term household earthquake preparedness and protective actions is investigated in an upcoming companion paper (in preparation).
5.4. Establishing a Baseline from Highly Prepared Individuals
Our longitudinal panel consists of trained safety volunteers with an exceptionally high level of disaster preparedness (near-ceiling baseline). Even these highly proactive and motivated participants neither calibrated their subjective perception over time nor frequently consulted the delivered intensity data before submitting their subjective judgments (only 6% to 10% did so before reporting). This finding suggests that the observed cognitive and behavioral limitations may also be relevant to the general population.
5.5. Global Implications for Aggregated Frameworks Like DYFI
Broad community aggregation, such as the USGS "Did You Feel It?" (DYFI) system in the United States, provides valuable regional overviews, whereas this study uses Japanese panel data to add a finer layer of localized detail. Specifically, we quantify individual- and structure-level variation within these aggregates, including a systematic person-level bias of +0.4 to +0.7 classes and a 1.4-class variation in home amplification.
The ability to track a specific panel of individuals, extending beyond traditional anonymous cross-sectional surveys, was important for assessing individual differences in sensitivity and the stability of perception across multiple events. Because our questionnaire intentionally adopted shaking vocabulary from DYFI, findings based on the JMA scale can be compared with and may help enrich existing macro-scale systems internationally, linking insights from US and Japanese frameworks.
5.6. Limitations and Robustness Check
Several structural limitations of this study warrant explicit mention. The sample size is modest and self-selected from a highly disaster-aware population stratum; the observed seismic events were predominantly minor (JMA classes 0–3); and both felt reports and geographic locations rely on participant self-disclosures. Moreover, municipal intensity functions as a coarse spatial proxy in areas without active station triggers.
The primary conclusions were unchanged when the analyses were repeated using unrounded, continuous instrumental intensities derived from device readings and municipal data from JMA bulletins (Section 3). This robustness analysis reproduced the main results with equivalent or enhanced statistical significance. Because the continuous device values lie almost exactly at the discrete class centers (with a mean within-class offset of +0.005), analytical artifacts arising from rounding are unlikely to explain the findings.
The site-amplification median is the only estimate affected by sub-threshold censoring of public station values, which we address using specific sensitivity bounds. Finally, although our confirmatory regression models account for event demeaning and person-level clustering, unobserved event-by-person interactions cannot be entirely ruled out.
6. Conclusions
By directly comparing three distinct measures of intensity, municipal JMA seismic intensity, perceived seismic intensity, and indoor seismic intensity, for the same individuals and earthquake events across three study periods and 96 seismic events, this study yields three main findings: (1) indoor seismic intensity systematically exceeds official municipal JMA seismic intensity by roughly one-third of an intensity class (median offset of +0.34 against unrounded instrumental values), with a ~1.4-class variation across structures; (2) perceived seismic intensity lies between municipal and indoor instrumental metrics, with the probability of feeling an event most strongly associated with immediate local intensity and a weaker association with building floor height; and (3) repeated personalized feedback did not produce detectable perceptual calibration over time. Together, these findings suggest that measured indoor intensity can help address the informational gap between regional metrics and lived indoor experience.
From an operational perspective, automated prompts delivered within ~30 minutes, combined with a 72-hour or next-event response threshold, yielded 96% of responses within 72 hours while maintaining stable data quality. The panel reported here comprised 76 instrumented households, with 106 installations across the two study periods; a follow-on deployment under the Tokyo Metropolitan Government program is planned at the scale of about one thousand households and will test whether the co-located design holds at an order of magnitude larger. For hazard mitigation, this approach shifts intensity information from a macro-level regional proclamation toward a micro-level household measurement. This infrastructure may support indoor seismic-hazard evaluation, complement the "last mile" of earthquake early warning systems, and inform public safety initiatives addressing the discrepancy between announced data and lived experience.
The behavioral dimensions of this experiment are detailed in a companion paper (in preparation).
Author Contributions
Conceptualization, N.H. and T.F.; methodology, T.F.; software and resources, H.T. and D.S.; investigation and data curation, T.F.; formal analysis and visualization, T.F.; writing–original draft preparation, T.F.; writing–review and editing, H.T., D.S. and N.H.; supervision, project administration and funding acquisition, N.H. All authors have read and agreed to the published version of the manuscript.
Funding
This work was supported by JST Belmont Forum Grant Number JPMJBF2006, Japan (Belmont Forum CRA "Resilient Society through Smart-City Technology: Ultra-high-resolution Earthquake Risk Assessment (RESIST)"). The funders had no role in the design of the study; in the collection, analyses, or interpretation of data; in the writing of the manuscript; or in the decision to publish the results.
Institutional Review Board Statement
Ethical review and approval were not required for this study under the University of Tokyo Research Ethics Review Implementation Rule, which requires review only for research covered by the national Ethical Guidelines for Medical and Biological Research Involving Human Subjects issued jointly by the Ministry of Education, Culture, Sports, Science and Technology, the Ministry of Health, Labour and Welfare, and the Ministry of Economy, Trade and Industry of Japan on 23 March 2021 (last revised in 2023) because the study does not seek knowledge that contributes to maintaining or promoting public health, to the recovery of patients from injury or illness, or to improving quality of life, and uses no specimens or genomic information of human origin; it therefore falls outside the scope of those guidelines. The study was non-interventional and consisted of voluntary questionnaire surveys on shaking perception and disaster preparedness. No medical or sensitive personal data were collected, and written informed consent, including consent to publication of the results in anonymized form, was obtained from every participant at enrollment.
Informed Consent Statement
Written informed consent was obtained from all participants at enrollment. Each participant signed (2022 study period) or submitted via web form (2023 study period) a consent document addressed to the principal investigator (Earthquake Research Institute, The University of Tokyo), confirming that they had read the study description, that they participated of their own volition, and that they consented to the publication of the results in academic form on condition that their personal information be protected.
Data Availability Statement
The anonymized panel data generated during this study are available from the corresponding author upon reasonable request. JMA bulletins were accessed via the P2P earthquake-information API (p2pquake.net); municipal geocoding used the GSI address search API. Station instrumental intensities were compiled from the seismic-intensity files of the JMA Monthly Seismological Bulletin, catalog edition (jma.go.jp) and the appendices of the JMA Monthly Report on Earthquakes and Volcanoes (jma.go.jp). The DYFI background materials cited are at usgs.gov.
Acknowledgments
This research is being carried out in cooperation with Public Interest Incorporated Association SL Disaster Volunteer Network. We thank the SL network members and the Bunkyo community participants; the QuakeSaver team for the sensor platform and data infrastructure; and Y. Ono and the project office for survey operations. We also thank M. Ishise (Yamagata University), S. Sakai (Earthquake Research Institute, The University of Tokyo),and F. Gunji for their cooperation. We thank N. Ohbo for his helpful suggestions regarding the locations of municipal seismic intensity stations.
Conflicts of Interest
The authors declare no conflicts of interest.
References
- Cochran, E.S.; Lawrence, J.F.; Christensen, C.; Jakka, R.S. The Quake-Catcher Network: Citizen science expanding seismic horizons. Seismol. Res. Lett. 2009, 80, 26–30. [Google Scholar] [CrossRef]
- Lawrence, J.F.; Cochran, E.S.; Chung, A.; Kaiser, A.; Christensen, C.M.; Allen, R.; Baker, J.W.; Fry, B.; Heaton, T.; Kilb, D.; et al. Rapid earthquake characterization using MEMS accelerometers and volunteer hosts following the M 7.2 Darfield, New Zealand, earthquake. Bull. Seismol. Soc. Am. 2014, 104, 184–192. [Google Scholar] [CrossRef]
- Kim, A.; Uematsu, H.; Iwamoto, S. Towards constructing regional active citizen seismology network. Proceedings of Interaction 2015, (In Japanese) Tokyo, Japan, 5–7 March 2015; pp. 284–286. [Google Scholar]
- Atkinson, G.M.; Wald, D.J. “Did You Feel It?” intensity data: A surprisingly good measure of earthquake ground motion. Seismol. Res. Lett. 2007, 78, 362–368. [Google Scholar] [CrossRef]
- Furuya, T.; Hirata, N. Interdisciplinary and industry–academia collaboration research for enhancing social resilience to natural disasters in the Tokyo Metropolitan Area—DEKATSU activity. J. Disaster Res. 2021, 16, 676–683. [Google Scholar] [CrossRef]
- Quitoriano, V.; Wald, D.J. USGS “Did You Feel It?”—Science and lessons from 20 years of citizen science-based macroseismology. Front. Earth Sci. 2020, 8, 120. [Google Scholar] [CrossRef]
- Chen, K.H.; Bossu, R.; Liang, W.-T. Editorial: The power of citizen seismology: Science and social impacts. Front. Earth Sci. 2020, 8, 610813. [Google Scholar] [CrossRef]
- Hirata, N.; Furuya, T.; Tsuruoka, H. Room seismic intensity measurement by an ultra-compact seismometer. In Proceedings of the Seismological Society of Japan Fall Meeting, 2022. [Google Scholar]
- Hirata, N.; Schorlemmer, D.; Tsuruoka, H.; Furuya, T.; Nagao, H. Affordable smart sensor deployments in the Tokyo area: New means of communicating earthquake risk and chances for seismology. Abstracts, Japan Geoscience Union Meeting, 2023; pp. U06–P04. [Google Scholar]
- Hirata, N.; Furuya, T.; Tsuruoka, H.; Schorlemmer, D. Smart sensor deployments in the Tokyo area: New means of communicating earthquake risk and chances for seismology. In Proceedings of the Seismological Society of Japan Fall Meeting, 2023. [Google Scholar]
- Si, H.; Midorikawa, S. New attenuation relationships for peak ground acceleration and velocity considering effects of fault type and site condition. J. Struct. Constr. Eng. AIJ (In Japanese) 1999, 64, 63–70. [Google Scholar] [CrossRef]
- Wald, D.J.; Quitoriano, V.; Dengler, L.A.; Dewey, J.W. Utilization of the Internet for rapid community intensity maps. Seismol. Res. Lett. 1999, 70, 680–697. [Google Scholar] [CrossRef]
- Japan Meteorological Agency. Explanation Table of the JMA Seismic Intensity Scale (February 1996); Japan Meteorological Agency: Tokyo, Japan, 1996. [Google Scholar]
- Musson, R.M.W.; Grünthal, G.; Stucchi, M. The comparison of macroseismic intensity scales. J. Seismol. 2010, 14, 413–428. [Google Scholar] [CrossRef]
- Wong, H.L.; Trifunac, M.D. A note on an instrumental comparison of the Modified Mercalli (MMI) and the Japanese Meteorological Agency (JMA) intensity scales, based on computed peak accelerations. Earthq. Eng. Struct. Dyn. 1979, 7, 75–83. [Google Scholar] [CrossRef]
- Dengler, L.A.; Dewey, J.W. An intensity survey of households affected by the Northridge, California, earthquake of 17 January 1994. Bull. Seismol. Soc. Am. 1998, 88, 441–462. [Google Scholar] [CrossRef]
- Naito, S.; Azuma, H.; Senna, S.; Yoshizawa, M.; Nakamura, H.; Hao, K.X.; Fujiwara, H.; Hirayama, Y.; Yuki, N.; Yoshida, M. Development and testing of a mobile application for recording and analyzing seismic data. J. Disaster Res. 2013, 8, 990–1000. [Google Scholar] [CrossRef]
Figure 1.
The plug-in home seismometer installed in a participant's home: the MEMS sensor unit plugged directly into a wall outlet and the mobile Wi-Fi router that transmits data to the cloud. The arrow indicates a 10 cm scale.
Figure 1.
The plug-in home seismometer installed in a participant's home: the MEMS sensor unit plugged directly into a wall outlet and the mobile Wi-Fi router that transmits data to the cloud. The arrow indicates a 10 cm scale.
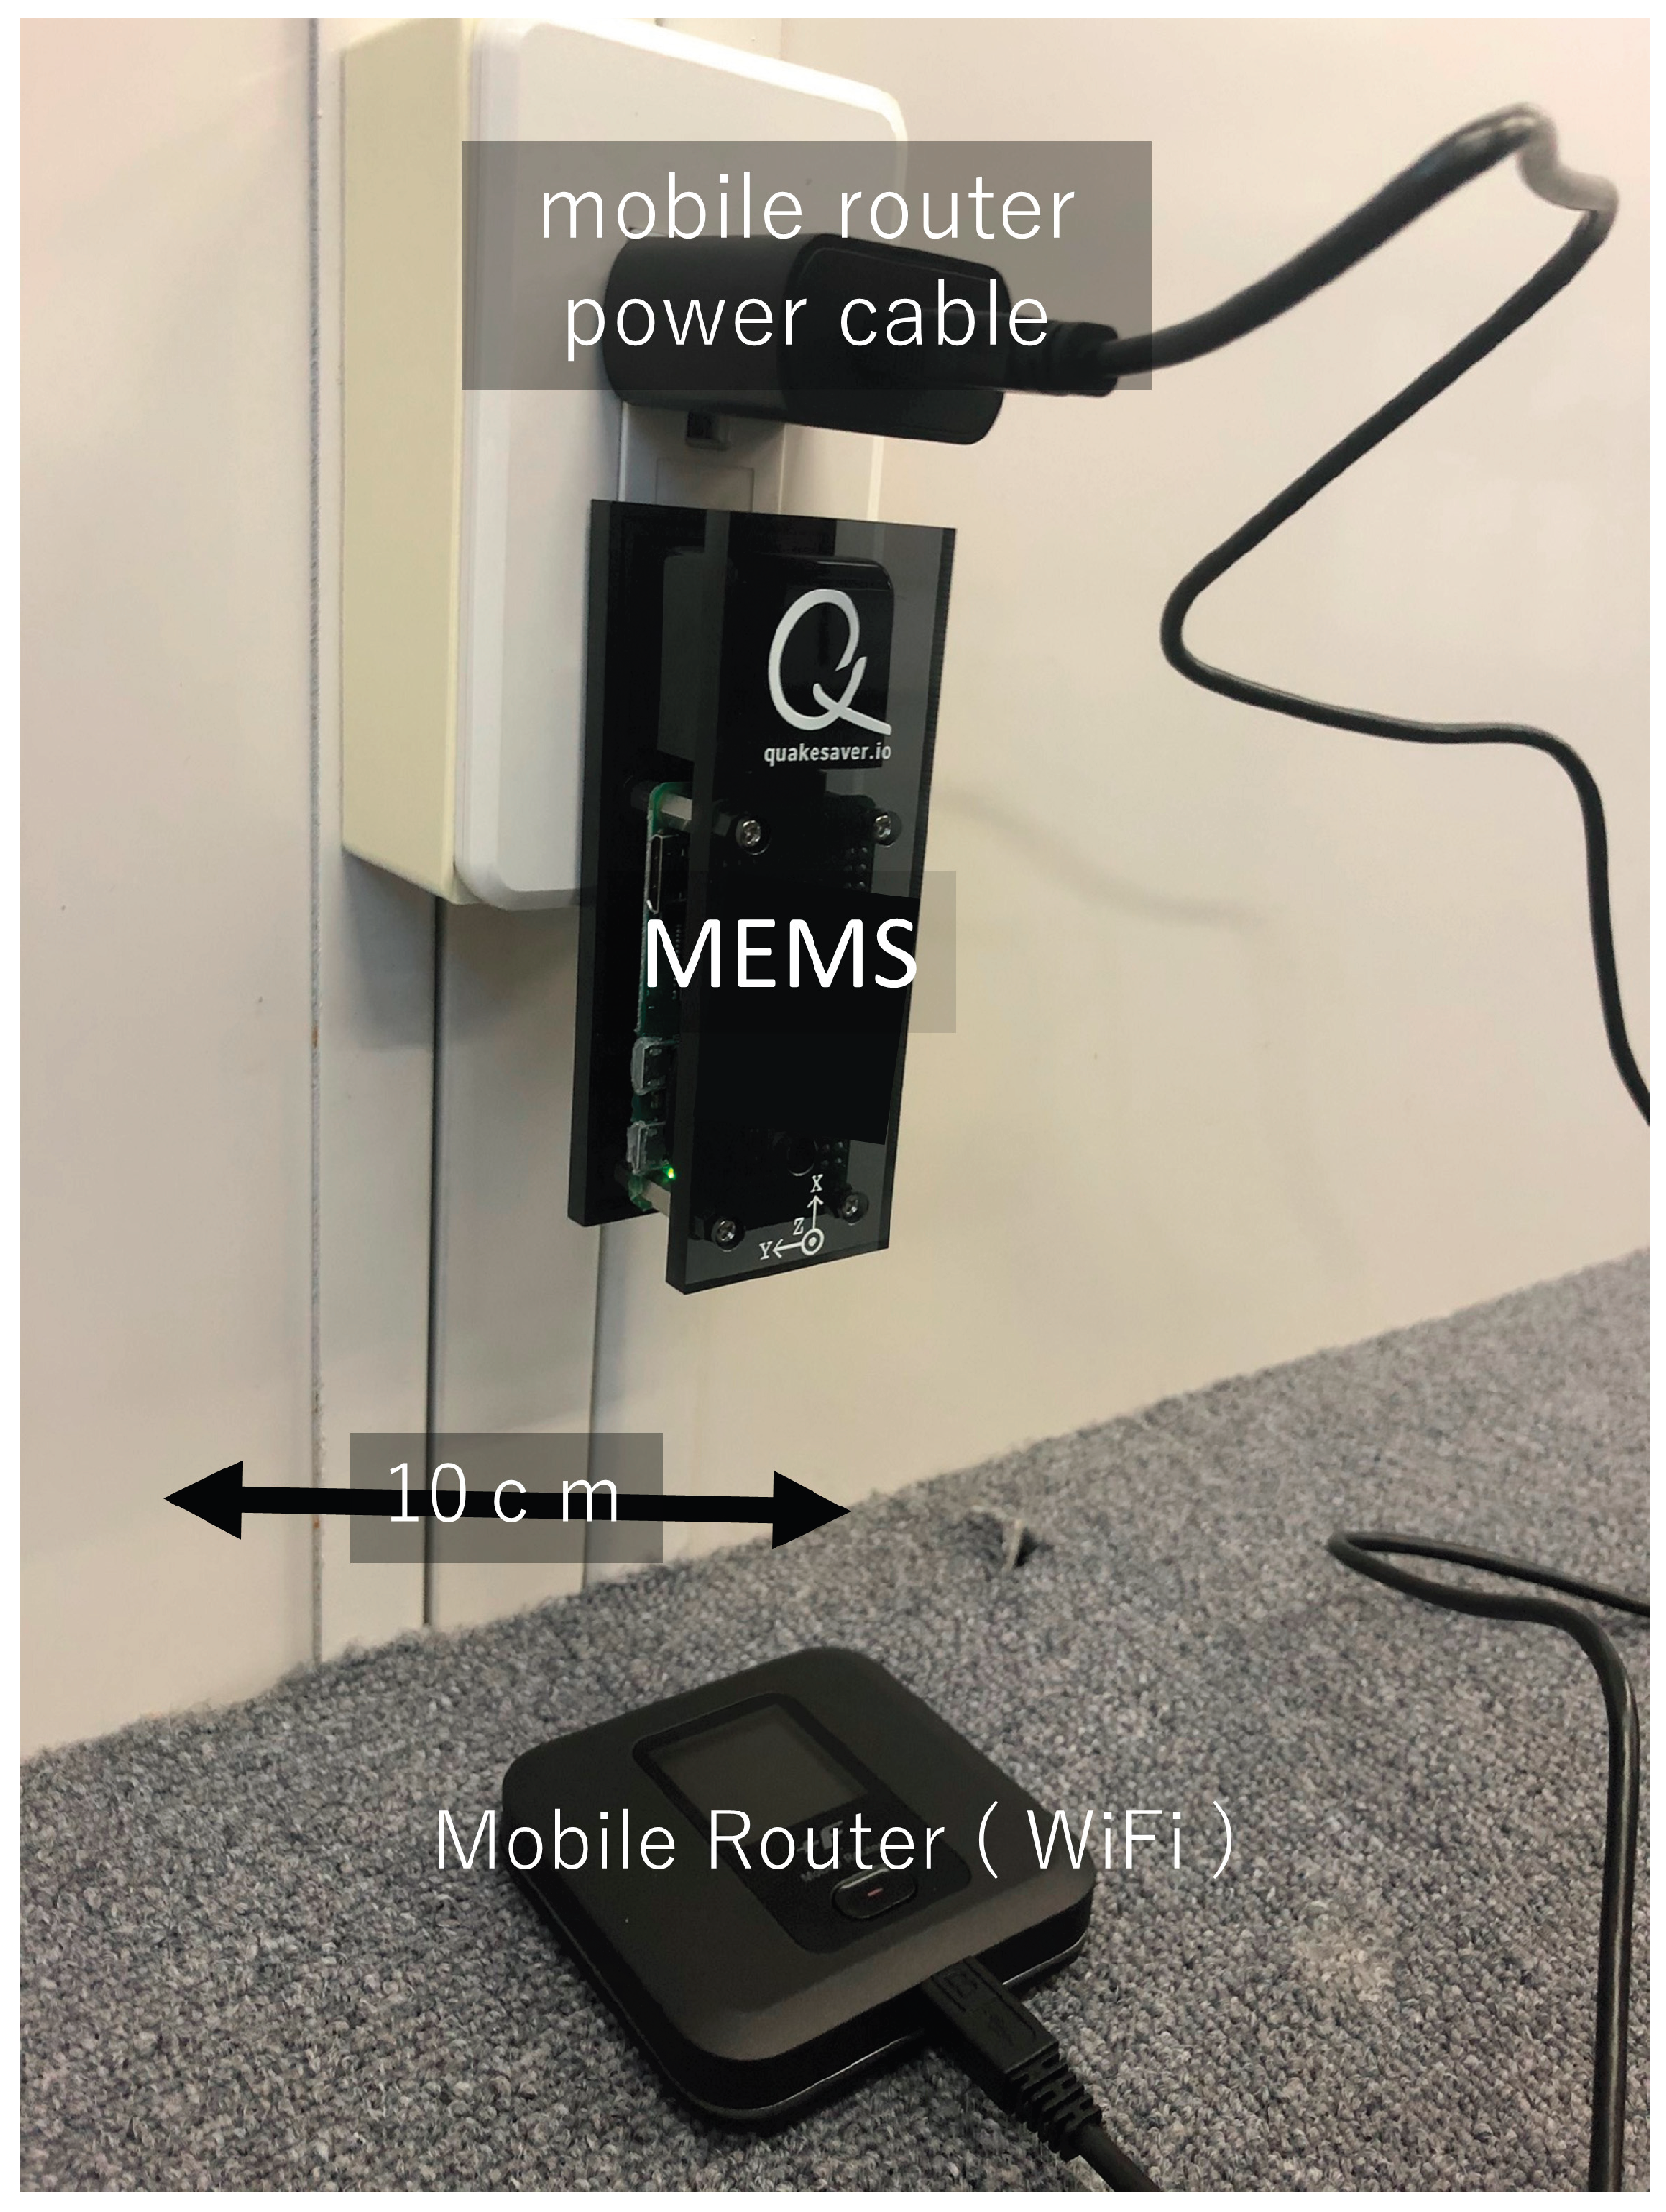
Figure 2.
The plug-in home seismometer and automated per-event survey pipeline. High-grade JMA Earthquake Early Warning messages trigger the pipeline. The analysis server computes indoor seismic intensity from continuously streamed waveforms and assembles a personalized message that reaches the participant within about 10 to 30 minutes. The resident's felt report is then returned to the response database, whose delivery log provides the denominator for the response rates (96 events; 8,054 deliveries; 5,724 responses). The dashed frame marks the components operated on the analysis and delivery server at the Earthquake Research Institute (ERI), The University of Tokyo.
Figure 2.
The plug-in home seismometer and automated per-event survey pipeline. High-grade JMA Earthquake Early Warning messages trigger the pipeline. The analysis server computes indoor seismic intensity from continuously streamed waveforms and assembles a personalized message that reaches the participant within about 10 to 30 minutes. The resident's felt report is then returned to the response database, whose delivery log provides the denominator for the response rates (96 events; 8,054 deliveries; 5,724 responses). The dashed frame marks the components operated on the analysis and delivery server at the Earthquake Research Institute (ERI), The University of Tokyo.
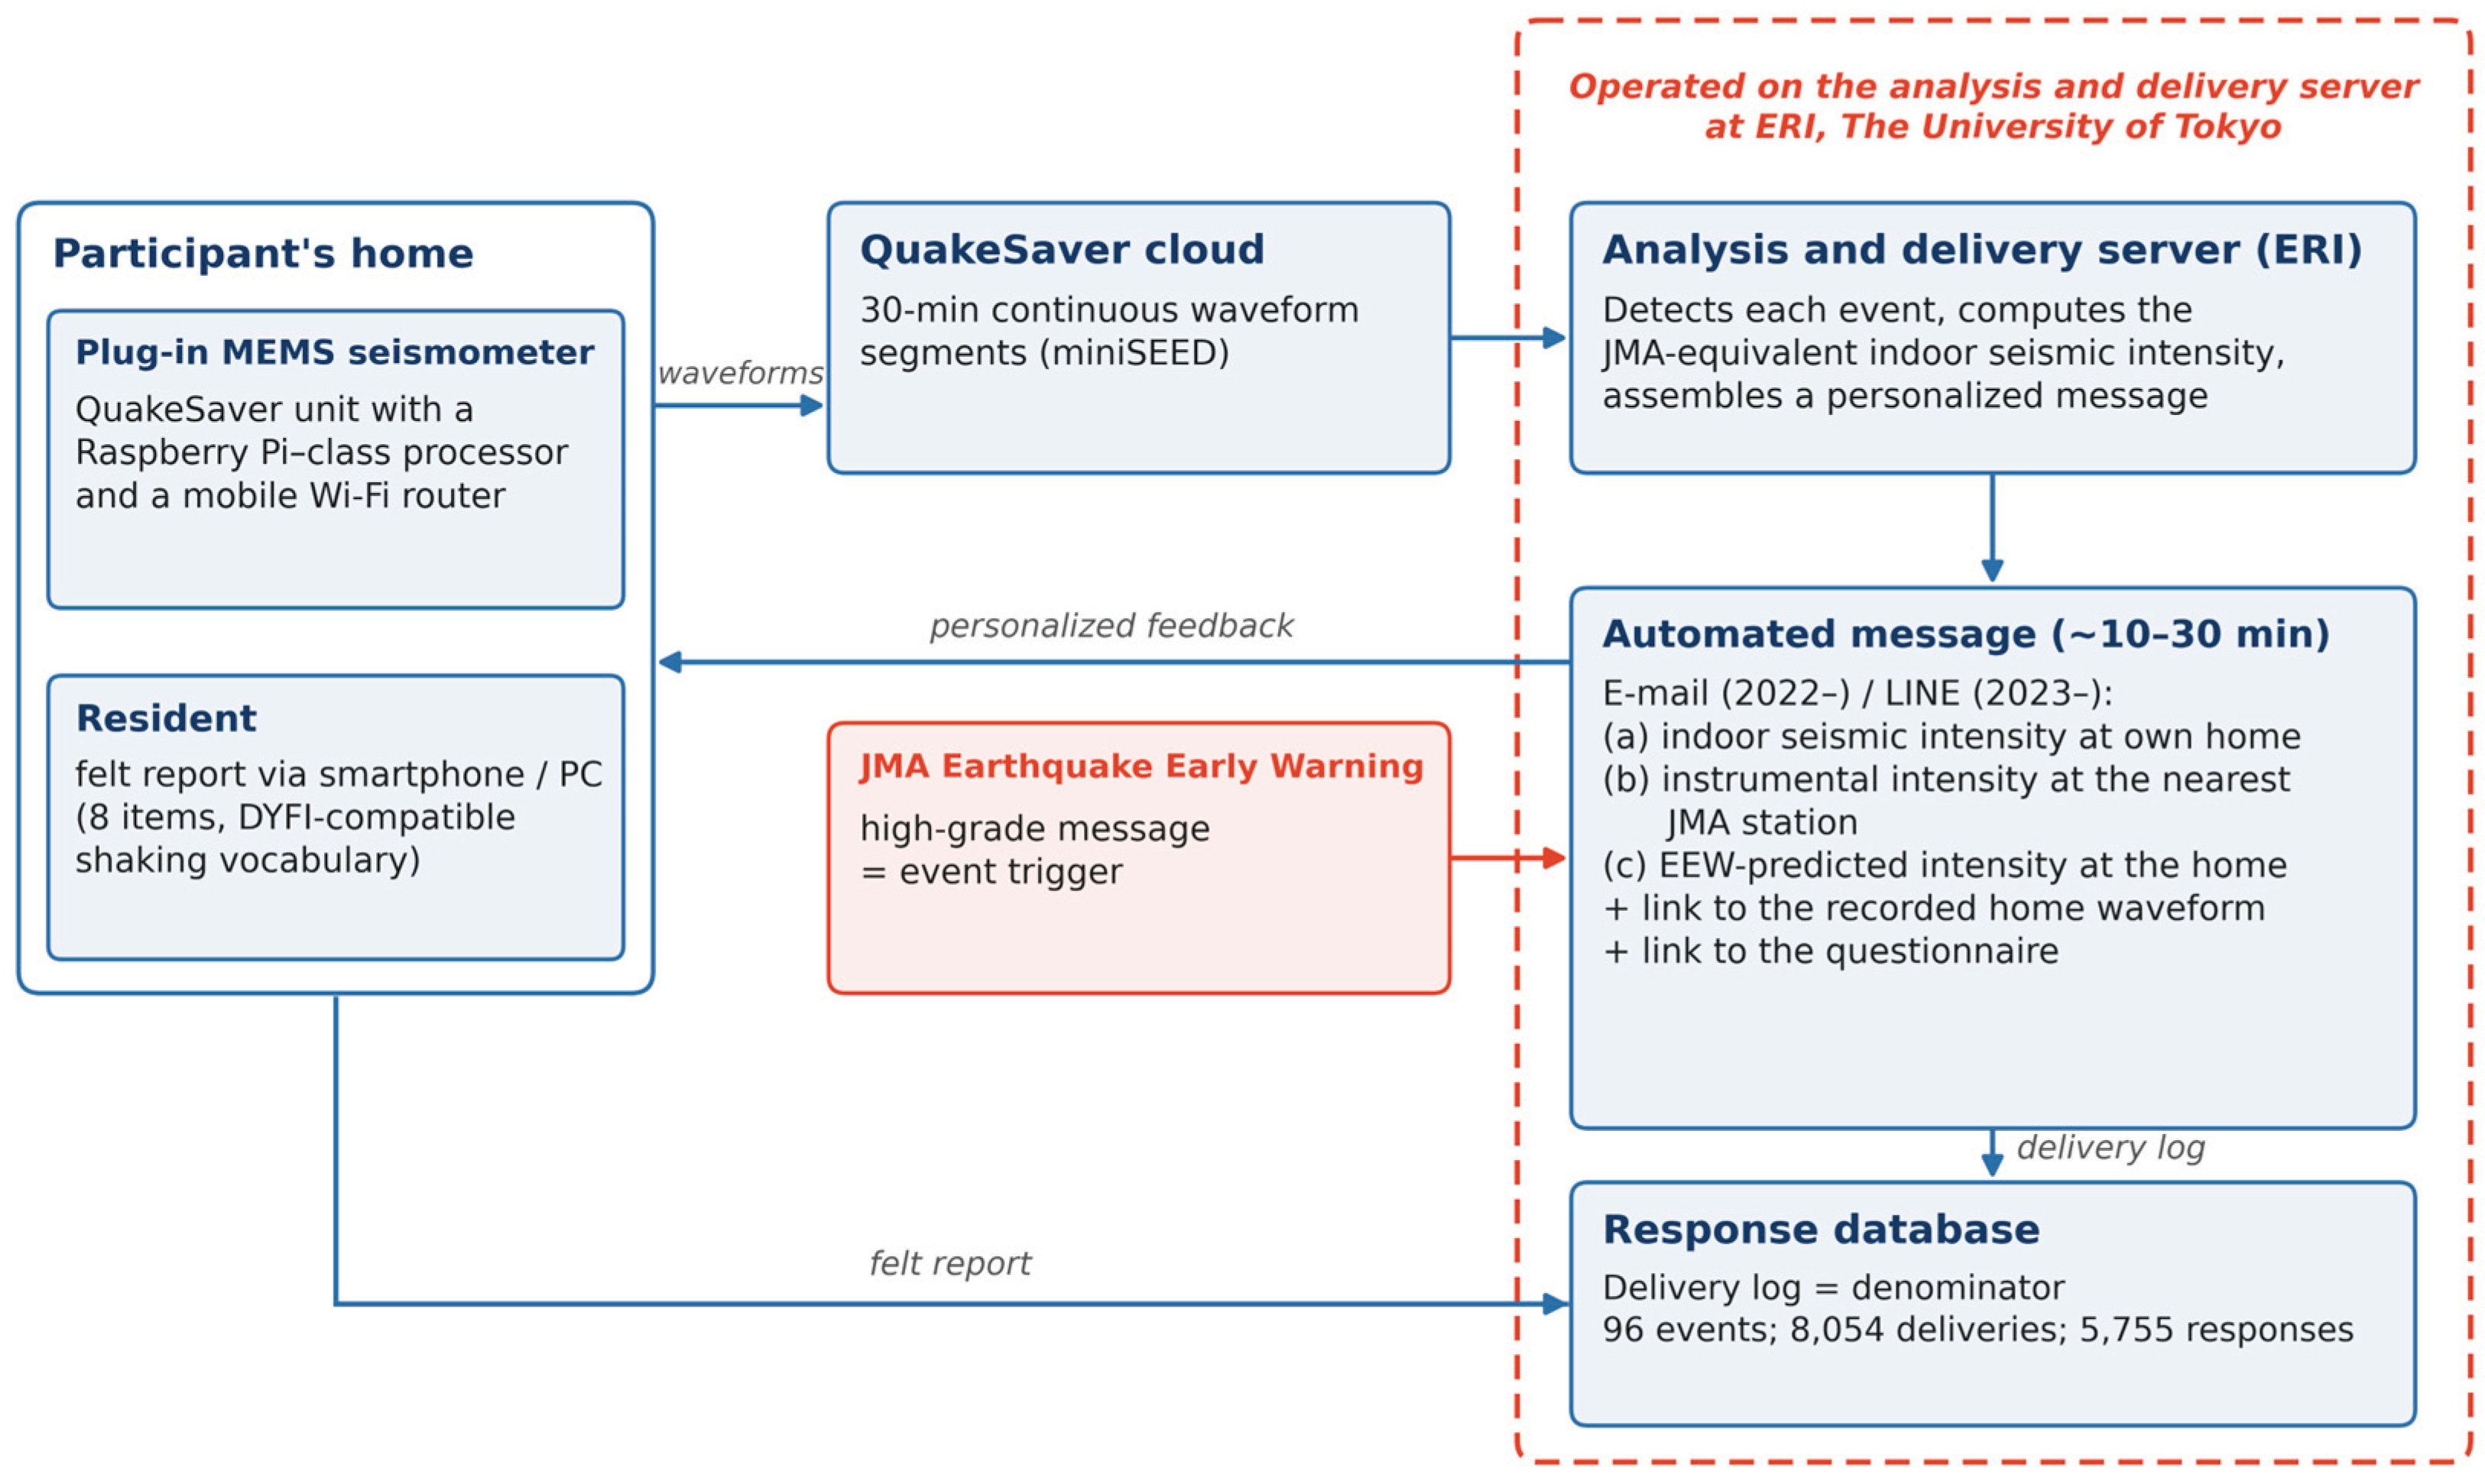
Figure 3.
Seismic intensity stations, indoor seismometers, and target earthquakes. (a) The 708 seismic intensity stations (gray squares) and 106 indoor seismometer installations at 76 participants' homes (red triangles) within the study area (34.9–36.9° N, 138.9–140.9° E), together with the epicenters of the 57 target earthquakes located inside this frame (open circles). (b) Epicenters of 95 of the 96 target earthquakes; the remaining event is not shown because JMA issued no seismic intensity bulletin for it (Section 3). Symbol area scales with , and fill color indicates focal depth. The dashed rectangle marks the frame of Panel (a). Epicenters are plotted at the 0.1° resolution of the JMA catalog, so nearby events can share a plotting position. Prefectural boundaries in (a) are from the National Land Numerical Information administrative-area data (Ministry of Land, Infrastructure, Transport and Tourism (MLIT), 1 January 2024; dataset N03; https://nlftp.mlit.go.jp/ksj/gml/datalist/KsjTmplt-N03-2024.html, accessed on 13 August 2026), processed by the authors to dissolve the municipal polygons into prefectural outlines. These data are used under the MLIT terms of use, which conform to the Government of Japan Standard Terms of Use (Version 2.0) and are compatible with CC BY 4.0. The coastline in (b) is from Natural Earth (1:10 m), which is in the public domain. The aspect ratio is set to true distance at the mean latitude of each panel.
Figure 3.
Seismic intensity stations, indoor seismometers, and target earthquakes. (a) The 708 seismic intensity stations (gray squares) and 106 indoor seismometer installations at 76 participants' homes (red triangles) within the study area (34.9–36.9° N, 138.9–140.9° E), together with the epicenters of the 57 target earthquakes located inside this frame (open circles). (b) Epicenters of 95 of the 96 target earthquakes; the remaining event is not shown because JMA issued no seismic intensity bulletin for it (Section 3). Symbol area scales with , and fill color indicates focal depth. The dashed rectangle marks the frame of Panel (a). Epicenters are plotted at the 0.1° resolution of the JMA catalog, so nearby events can share a plotting position. Prefectural boundaries in (a) are from the National Land Numerical Information administrative-area data (Ministry of Land, Infrastructure, Transport and Tourism (MLIT), 1 January 2024; dataset N03; https://nlftp.mlit.go.jp/ksj/gml/datalist/KsjTmplt-N03-2024.html, accessed on 13 August 2026), processed by the authors to dissolve the municipal polygons into prefectural outlines. These data are used under the MLIT terms of use, which conform to the Government of Japan Standard Terms of Use (Version 2.0) and are compatible with CC BY 4.0. The coastline in (b) is from Natural Earth (1:10 m), which is in the public domain. The aspect ratio is set to true distance at the mean latitude of each panel.
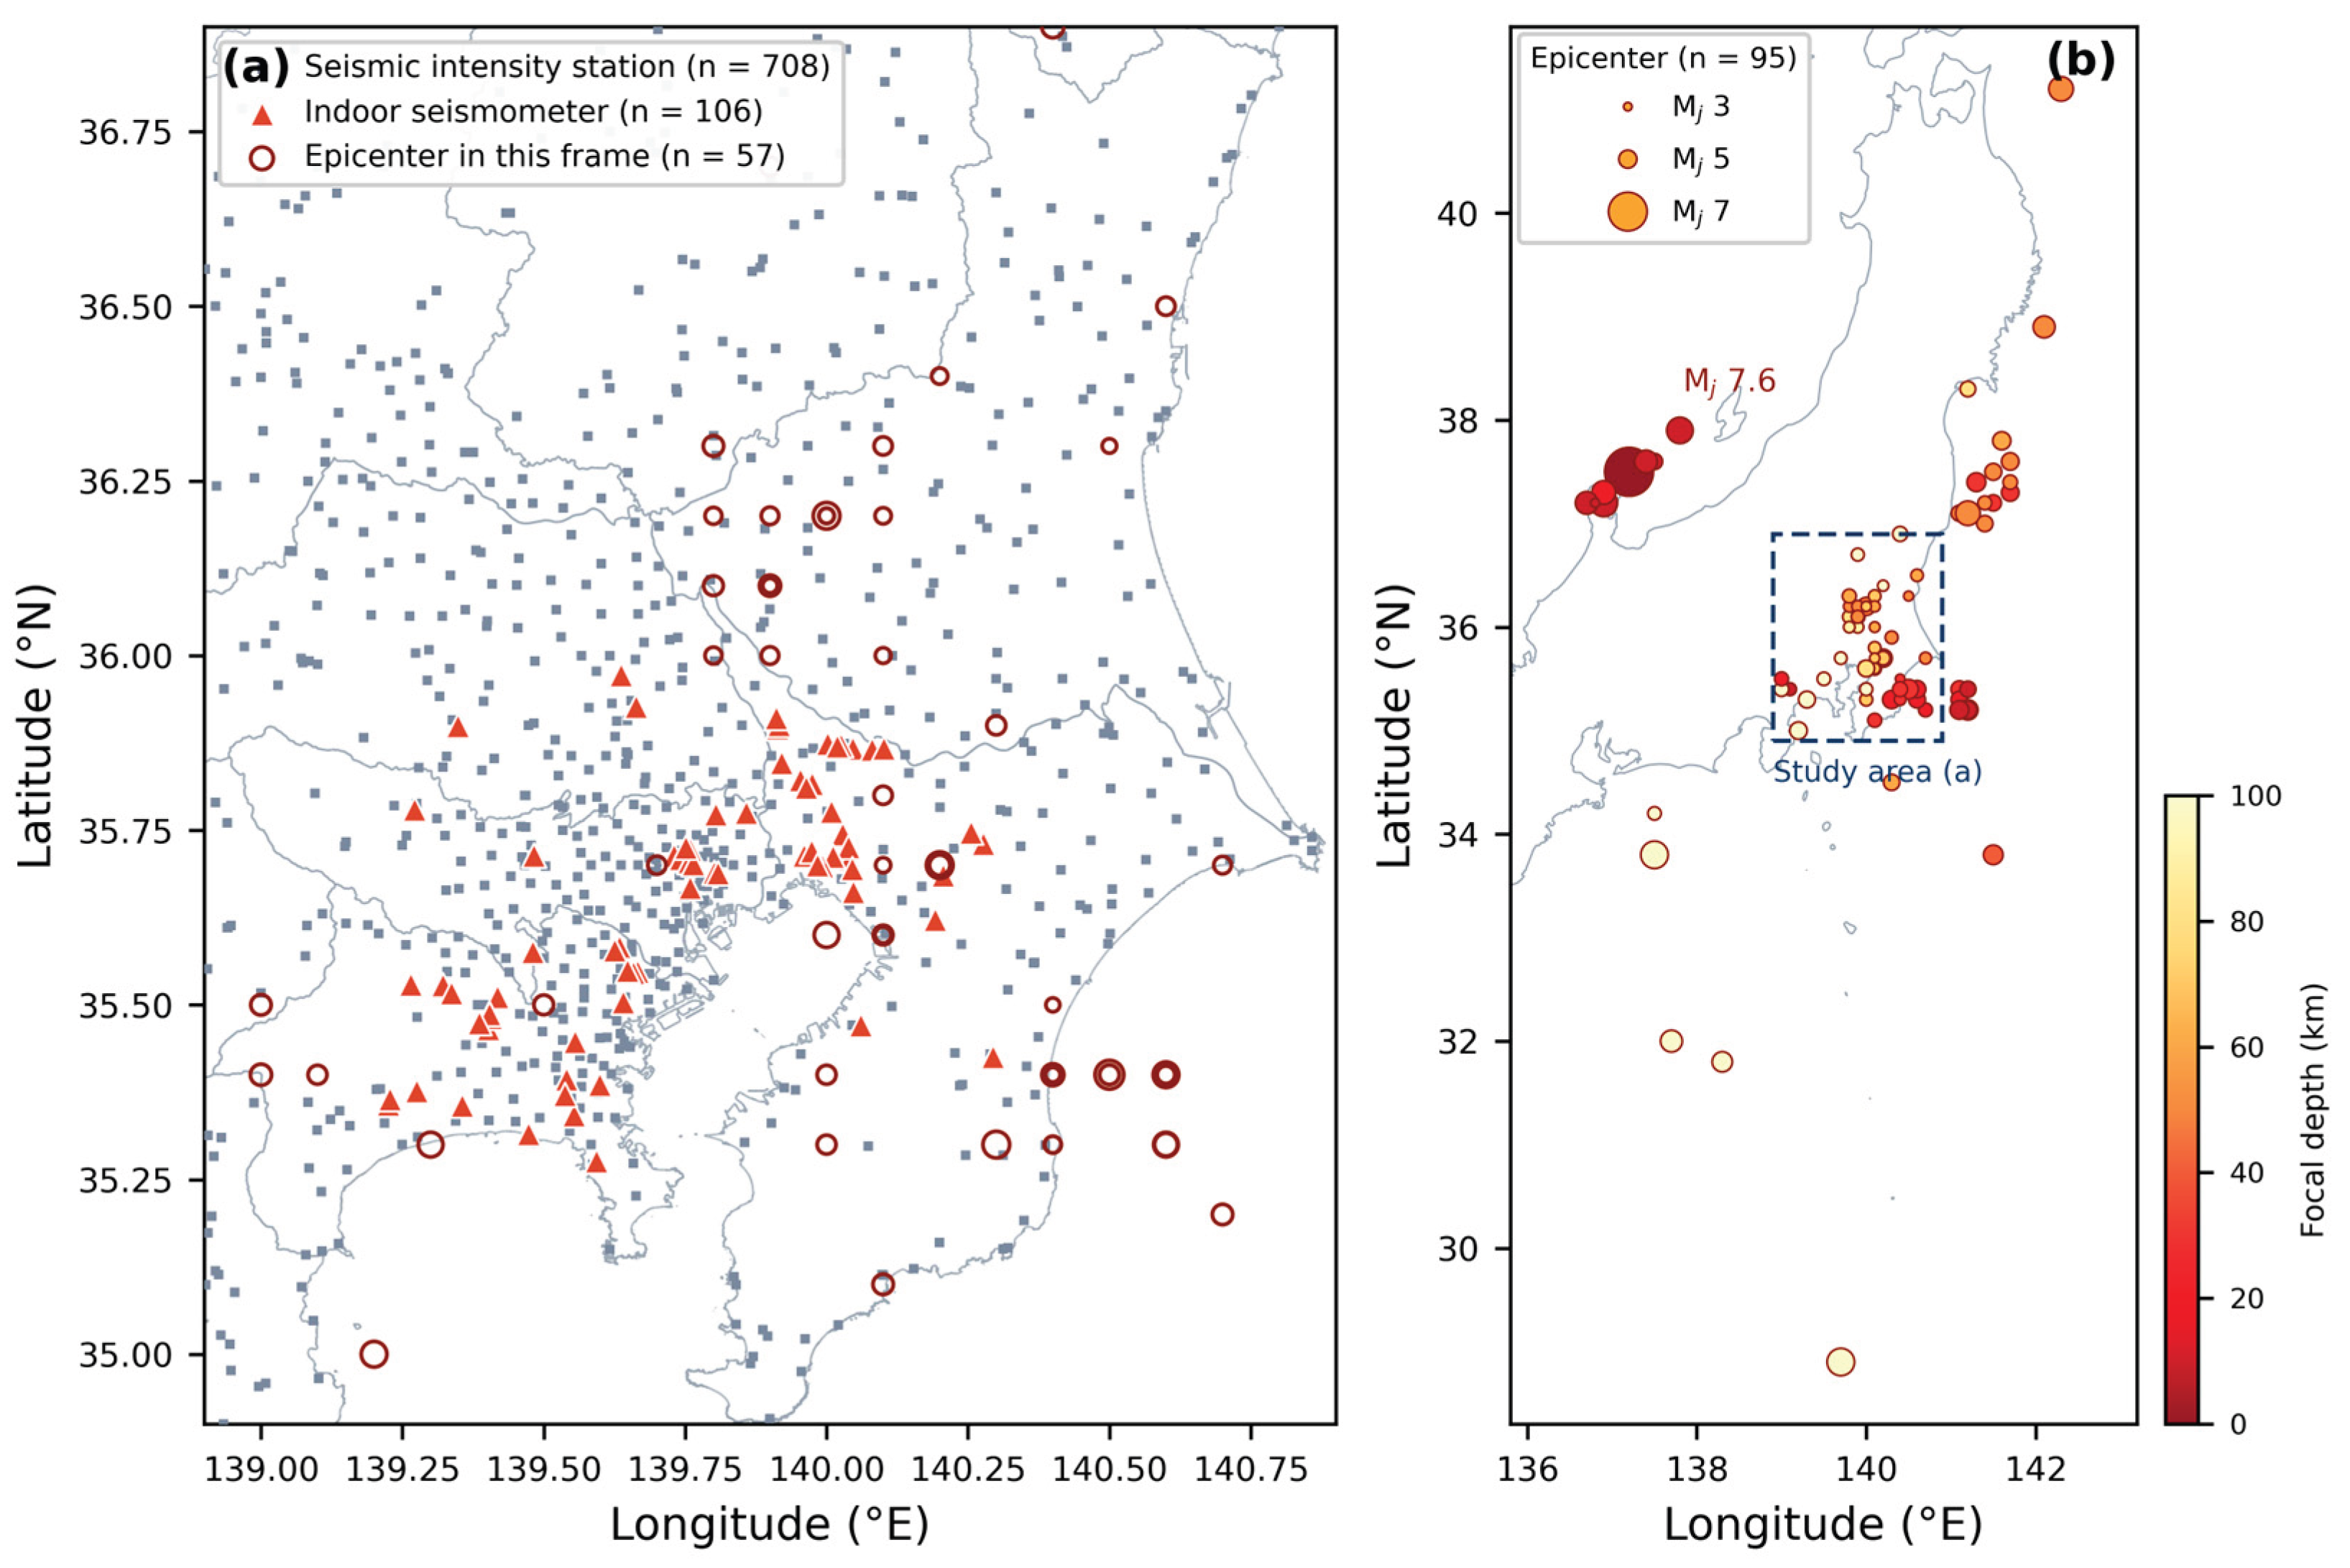
Figure 4.
Overview of the three-year experiment: cohorts, installed/non-installed groups, per-phase response counts, and cross-year continuation(43 residents continued from 2022 to 2023, 38 of them at the same address, and 25 hosted a sensor in both periods).
Figure 4.
Overview of the three-year experiment: cohorts, installed/non-installed groups, per-phase response counts, and cross-year continuation(43 residents continued from 2022 to 2023, 38 of them at the same address, and 25 hosted a sensor in both periods).
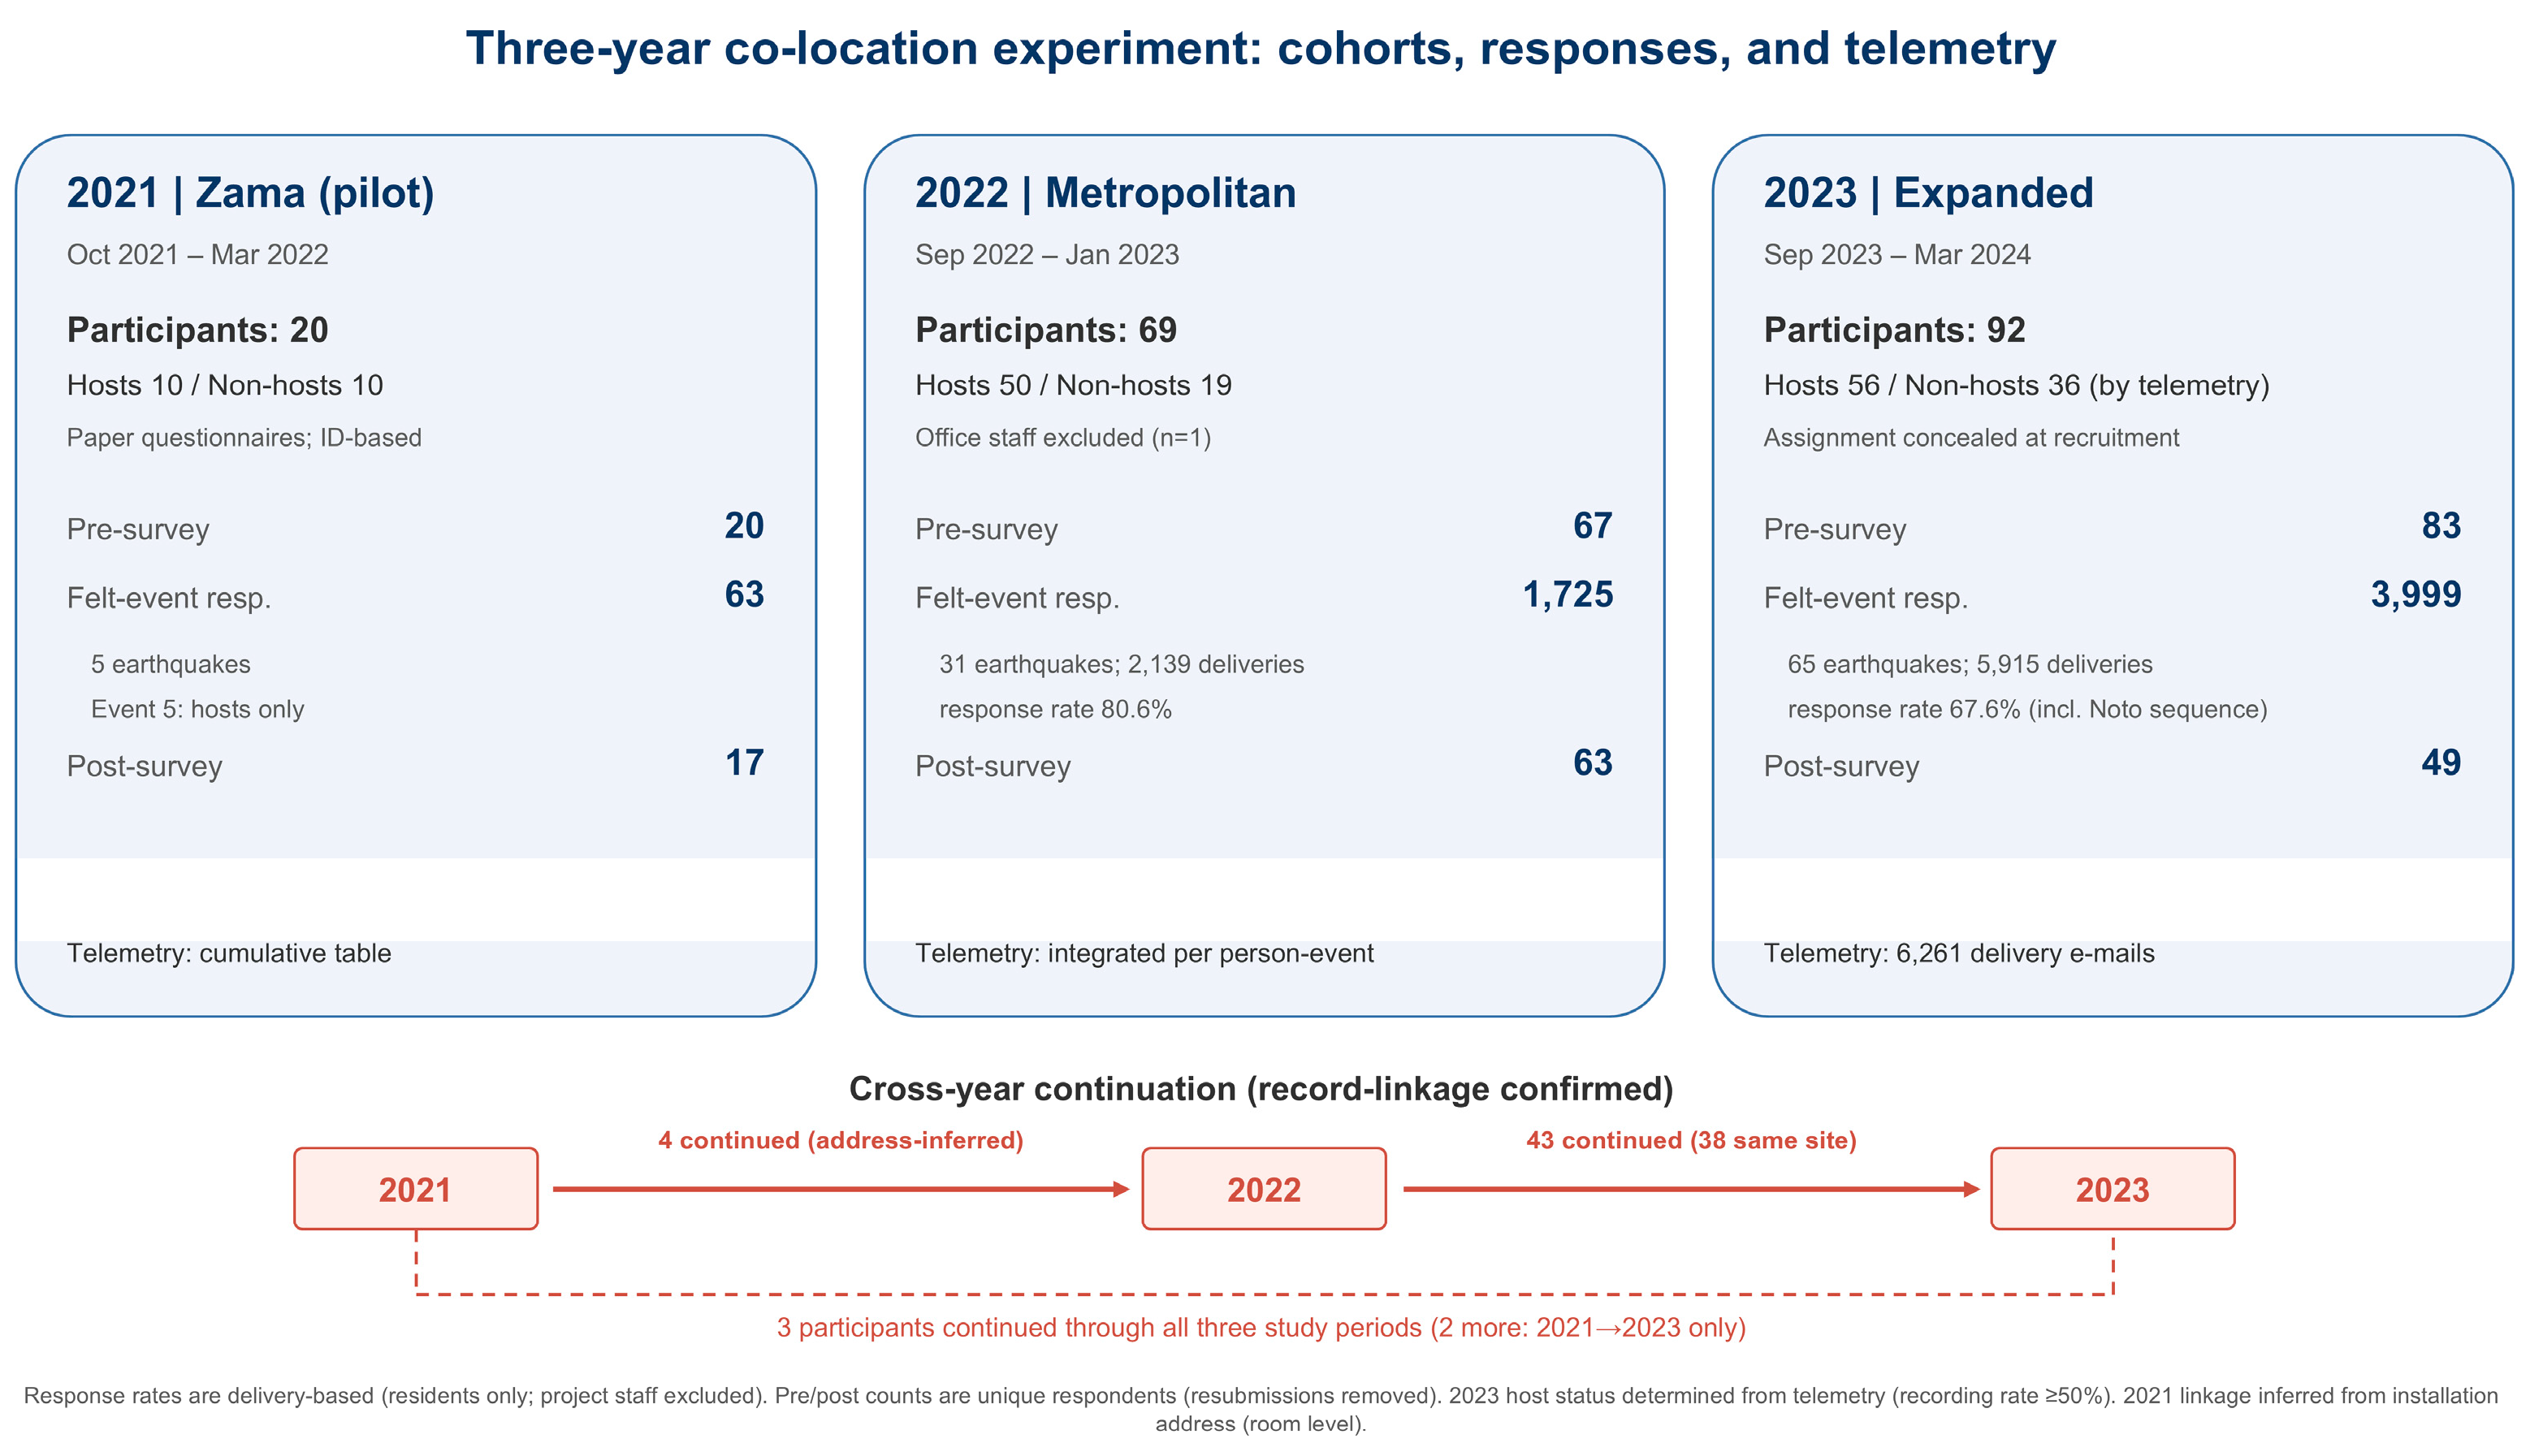
Figure 5.
Indoor (device) versus municipal instrumental intensity for 1,209 person-events in 77 homes. Blue points represent individual person-events (municipal values are published to 0.1 resolution; a horizontal jitter of is applied for legibility). The solid line joins binned medians, and the dashed green line shows the binned 10th percentiles, computed in 0.25-wide bins of the horizontal axis. The shaded band on the left covers events for which no municipal intensity was published (below 0.5); there, device values alone are shown as a box plot (median, quartiles, 5th–95th percentiles; ), and the band carries no horizontal information.
Figure 5.
Indoor (device) versus municipal instrumental intensity for 1,209 person-events in 77 homes. Blue points represent individual person-events (municipal values are published to 0.1 resolution; a horizontal jitter of is applied for legibility). The solid line joins binned medians, and the dashed green line shows the binned 10th percentiles, computed in 0.25-wide bins of the horizontal axis. The shaded band on the left covers events for which no municipal intensity was published (below 0.5); there, device values alone are shown as a box plot (median, quartiles, 5th–95th percentiles; ), and the band carries no horizontal information.
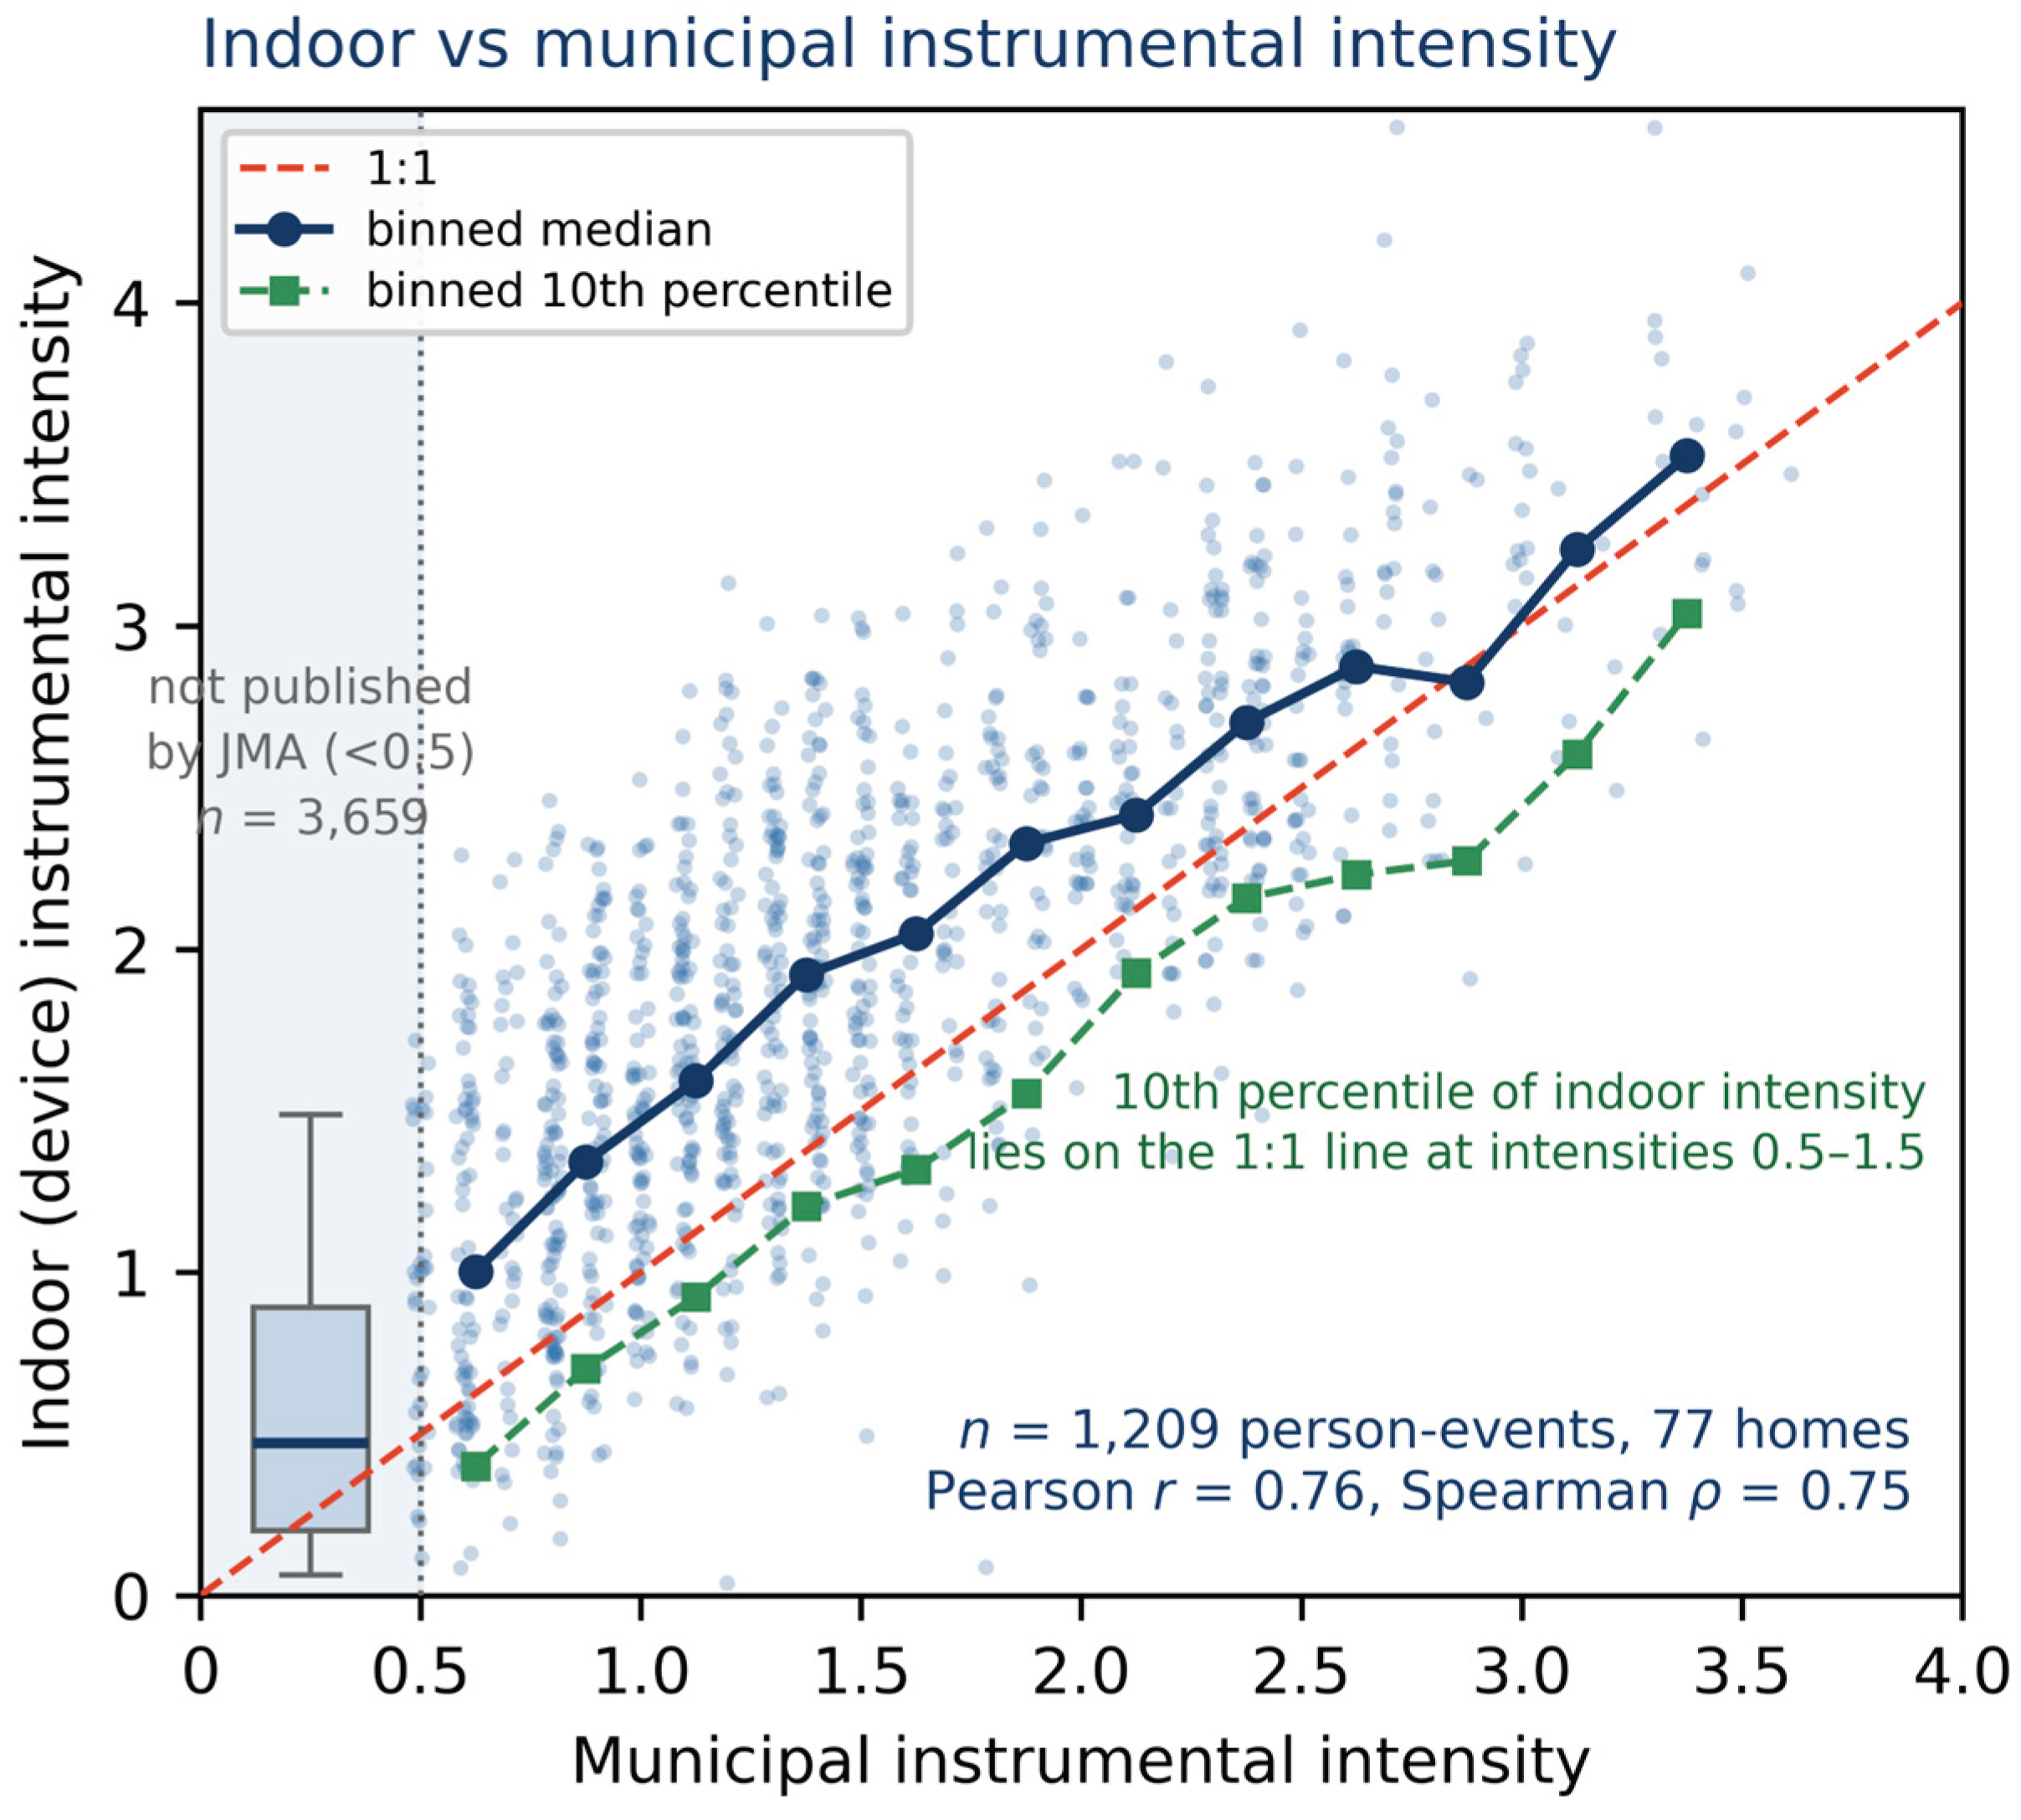
Figure 6.
Perceived seismic intensity versus measured intensity classes for at-home felt responses: against the home seismometer (top) and municipal JMA seismic intensity (bottom), for 2022 (left) and 2023 (right). The red line marks exact agreement.
Figure 6.
Perceived seismic intensity versus measured intensity classes for at-home felt responses: against the home seismometer (top) and municipal JMA seismic intensity (bottom), for 2022 (left) and 2023 (right). The red line marks exact agreement.
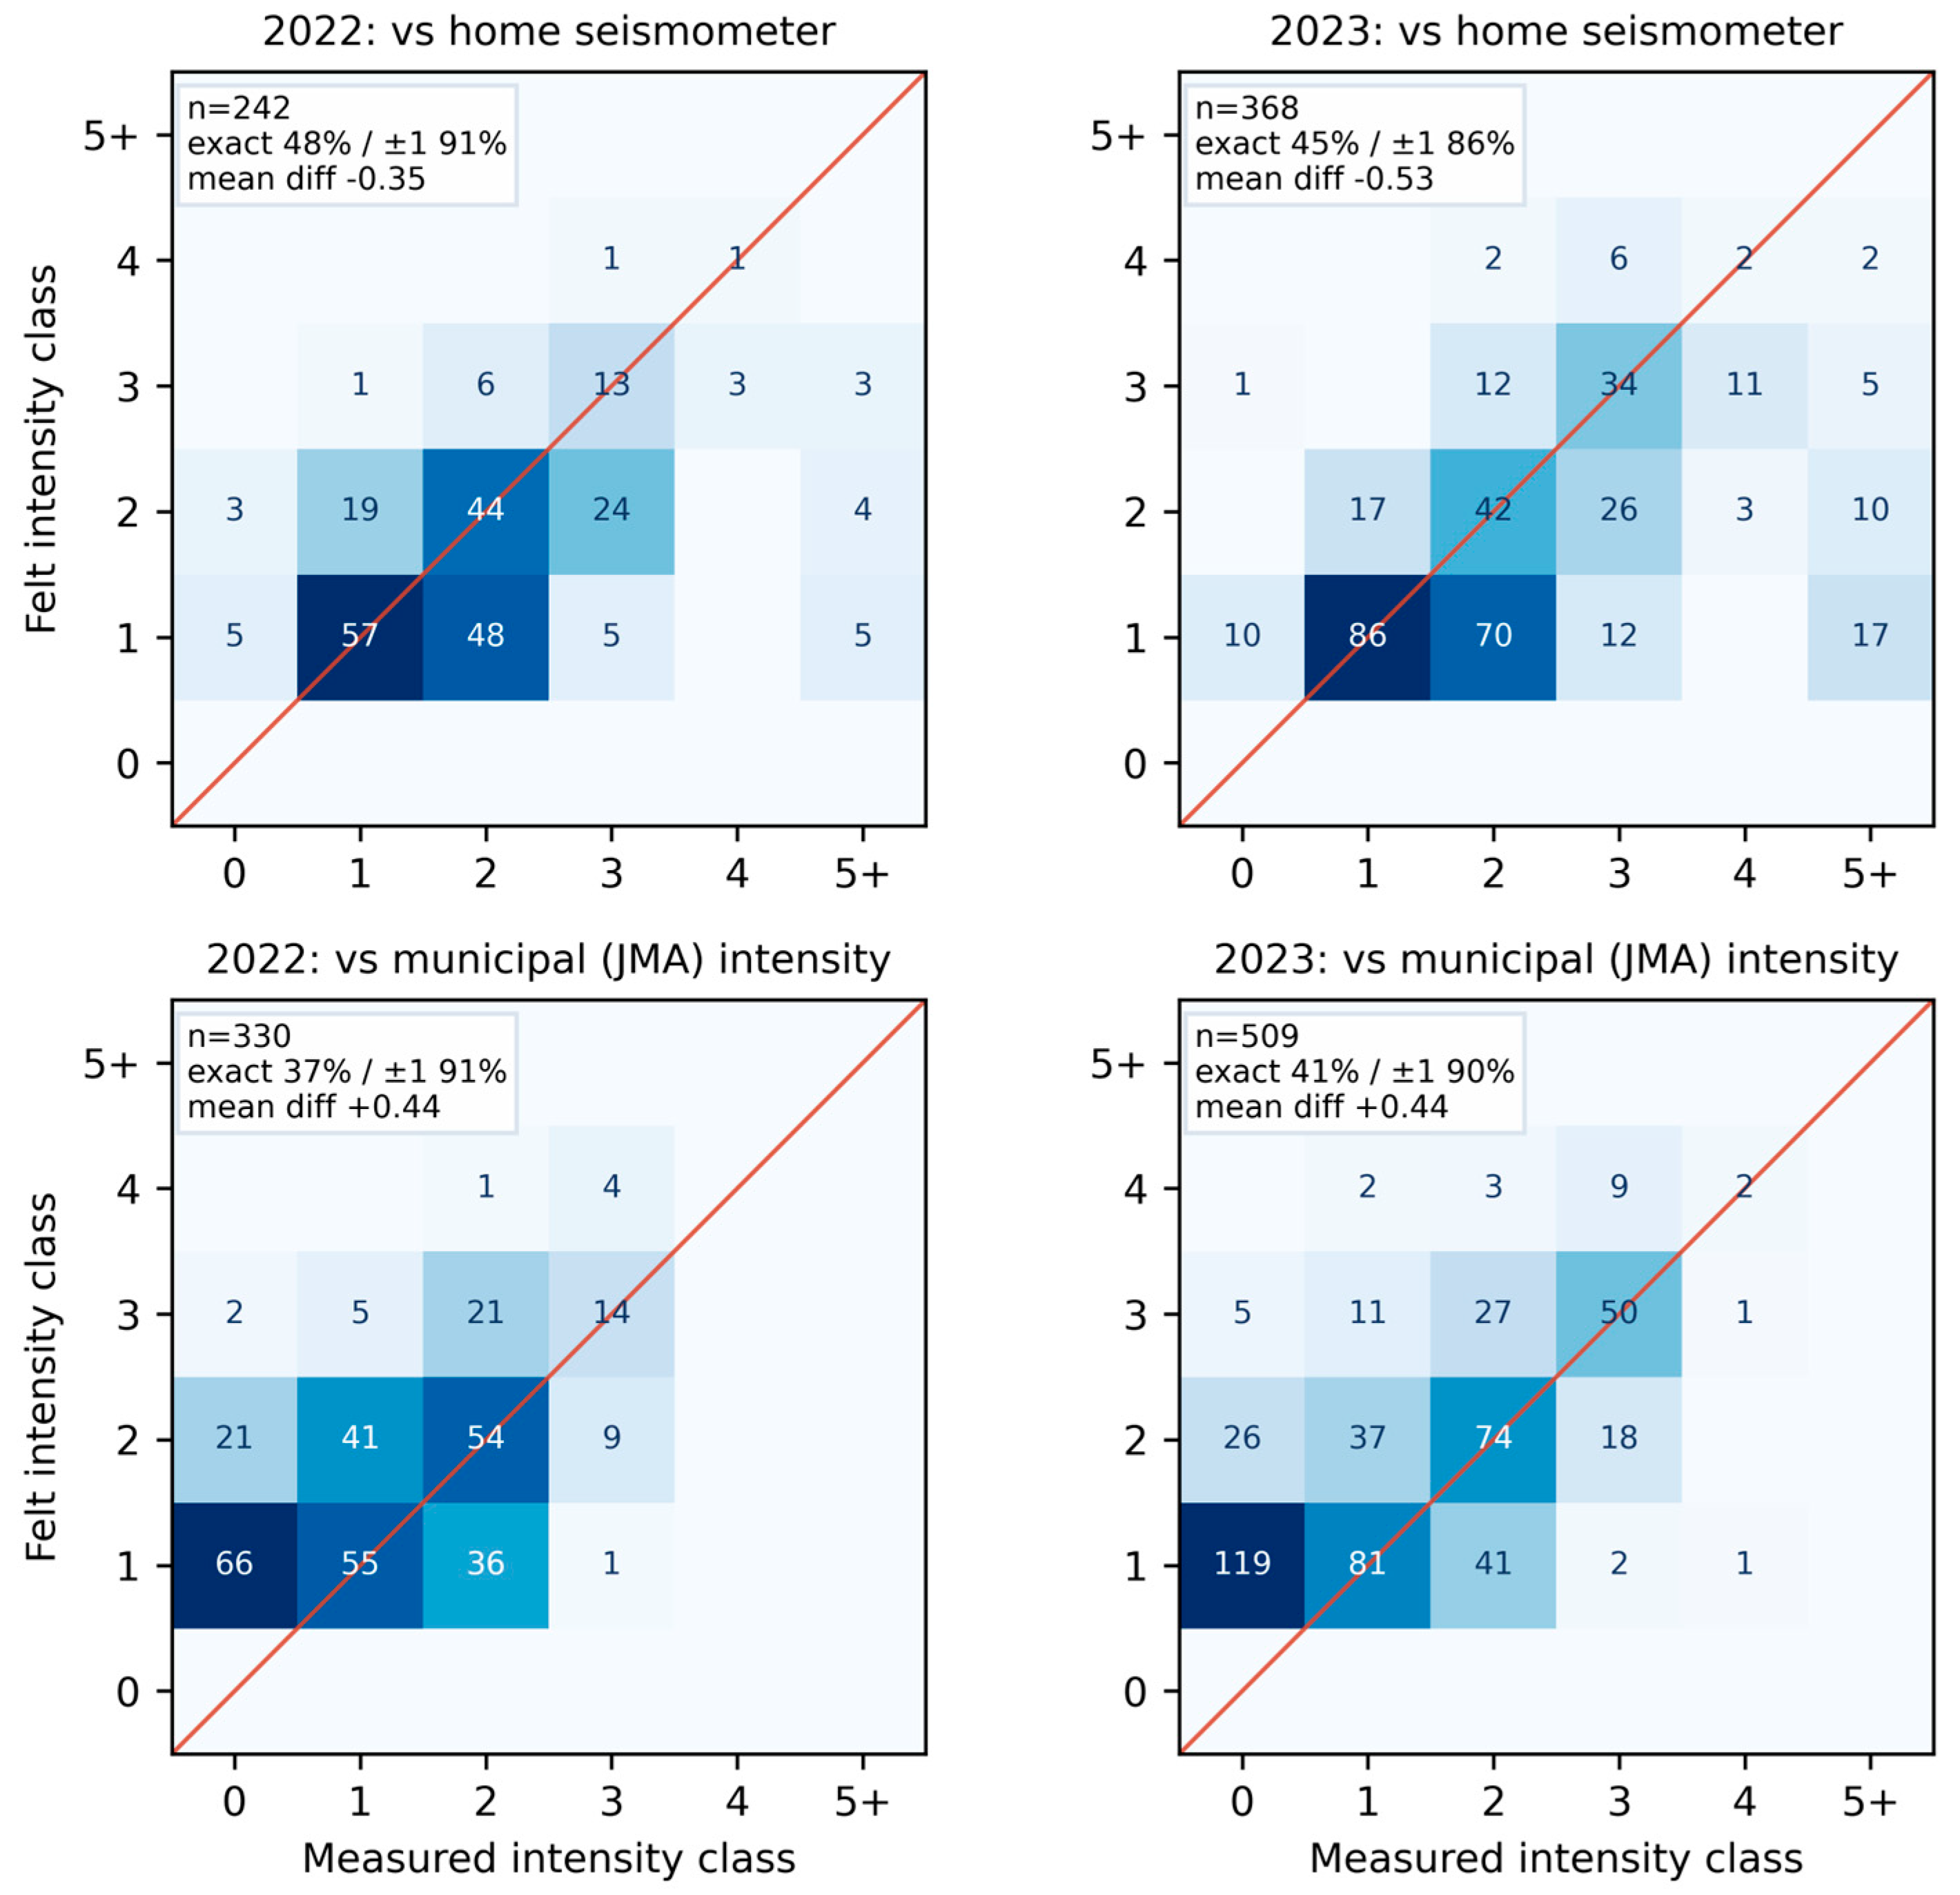
Figure 7.
Site-specific mean excess of indoor over municipal JMA seismic intensity for 106 site-years (at least 15 events each): sorted means SD (a) and their distribution (b). The municipal reference here is the intensity class; against the observed unrounded instrumental reference the median excess is +0.34 (see Section 4.2).
Figure 7.
Site-specific mean excess of indoor over municipal JMA seismic intensity for 106 site-years (at least 15 events each): sorted means SD (a) and their distribution (b). The municipal reference here is the intensity class; against the observed unrounded instrumental reference the median excess is +0.34 (see Section 4.2).
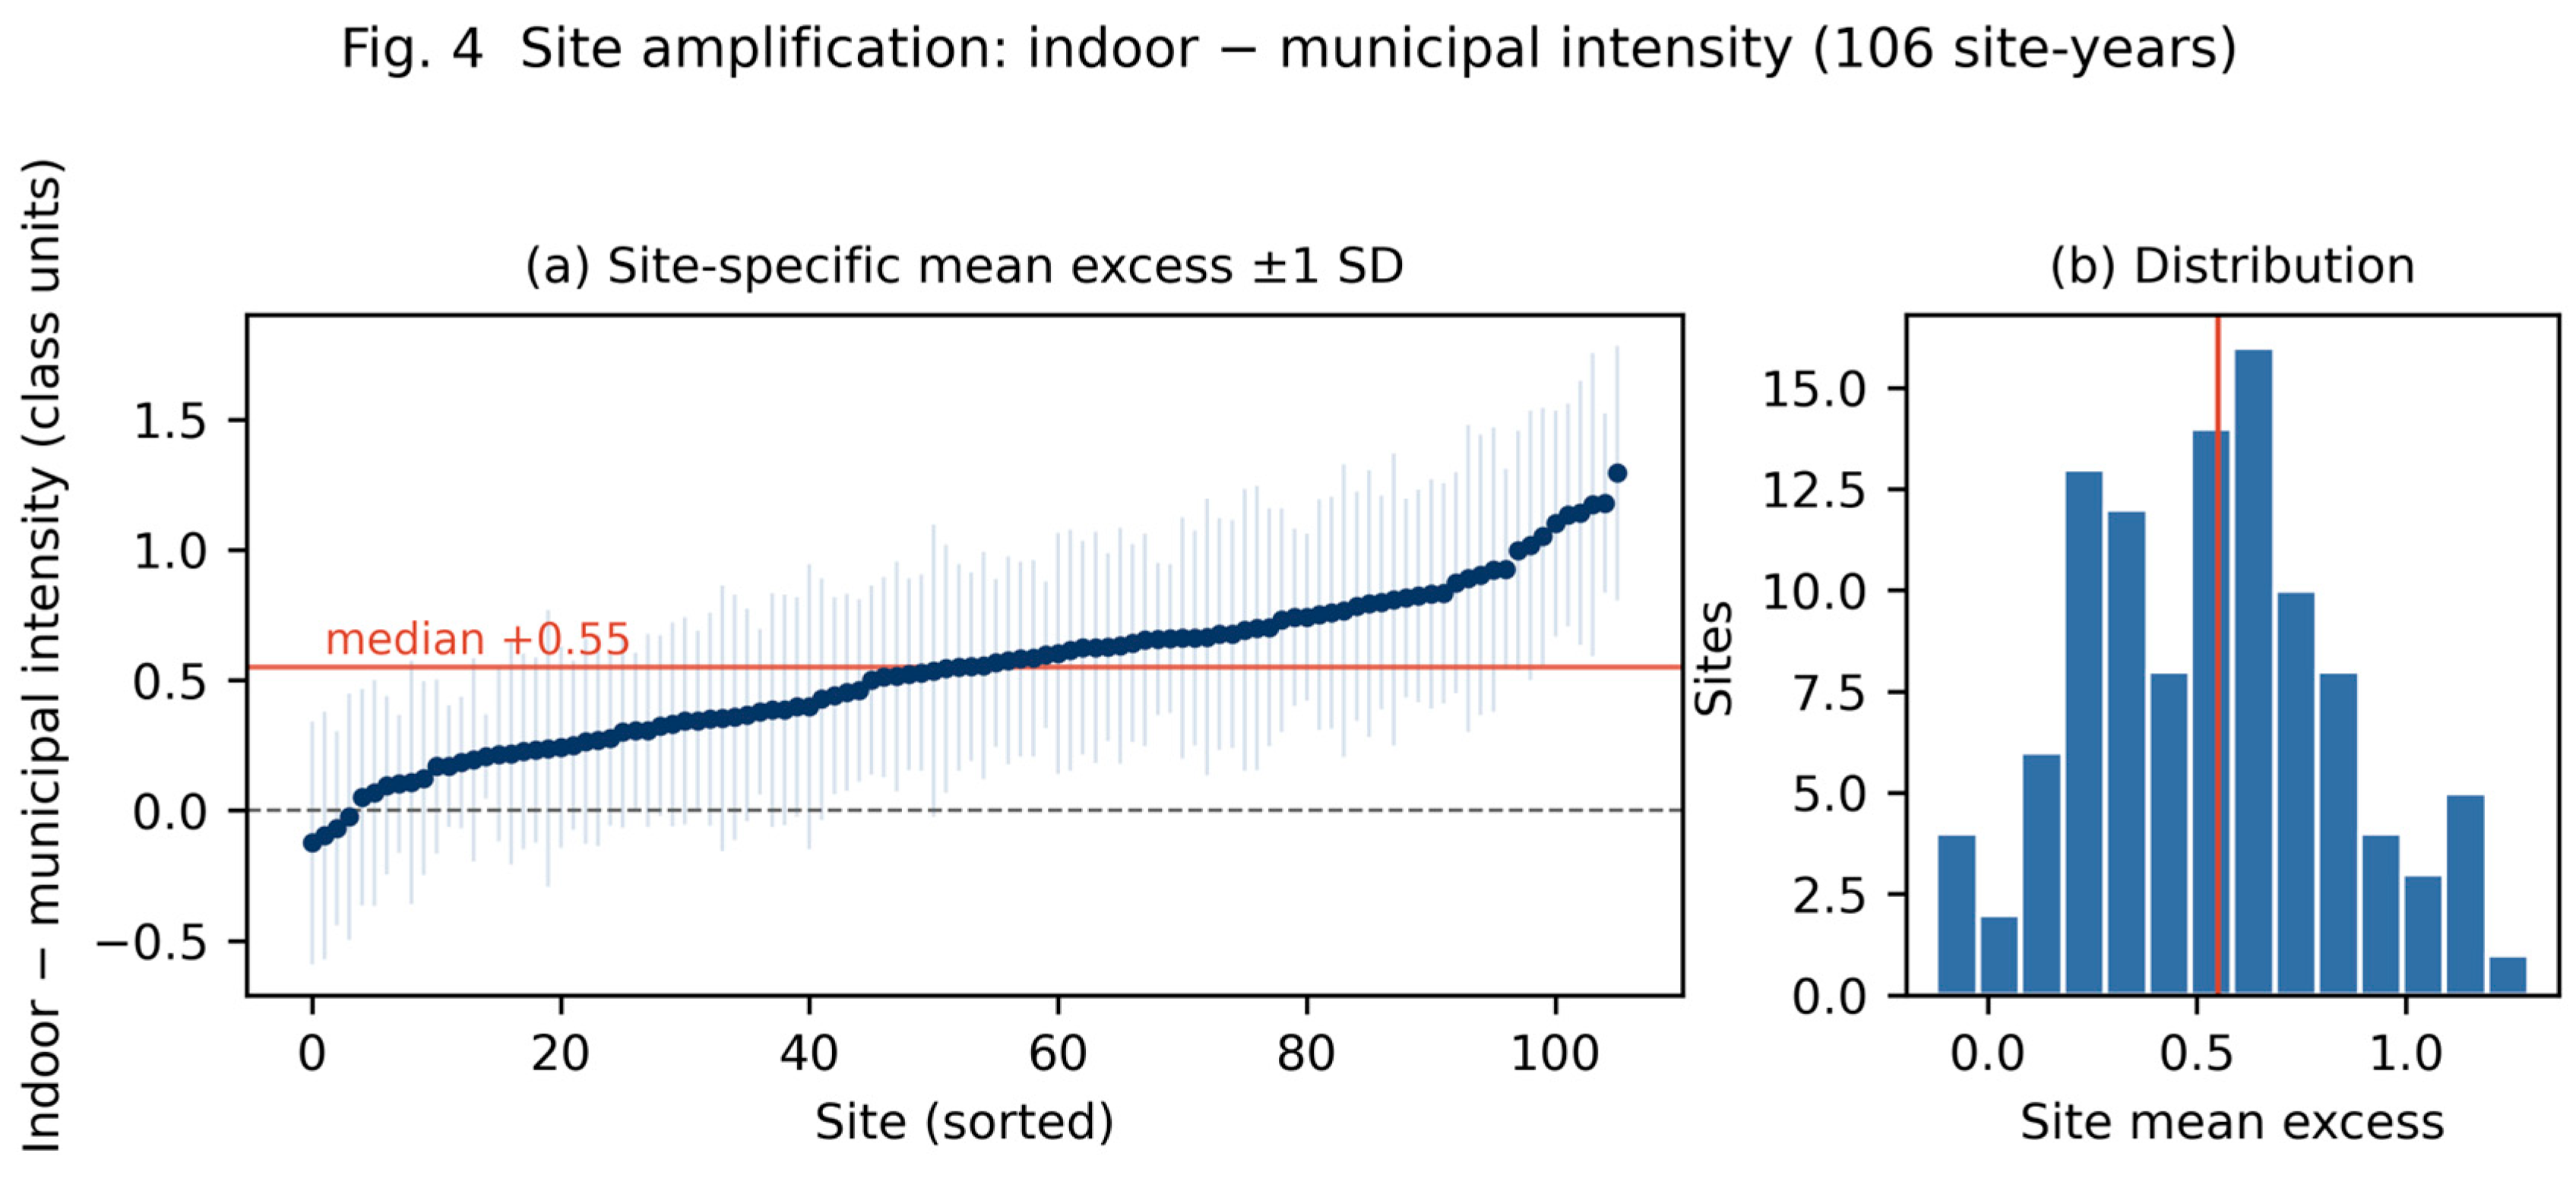
Figure 8.
Probability of feeling an earthquake versus municipal JMA seismic intensity: observed proportions (95% Wilson confidence intervals) and GEE predictions for hosts and non-hosts (curves at covariate means).
Figure 8.
Probability of feeling an earthquake versus municipal JMA seismic intensity: observed proportions (95% Wilson confidence intervals) and GEE predictions for hosts and non-hosts (curves at covariate means).
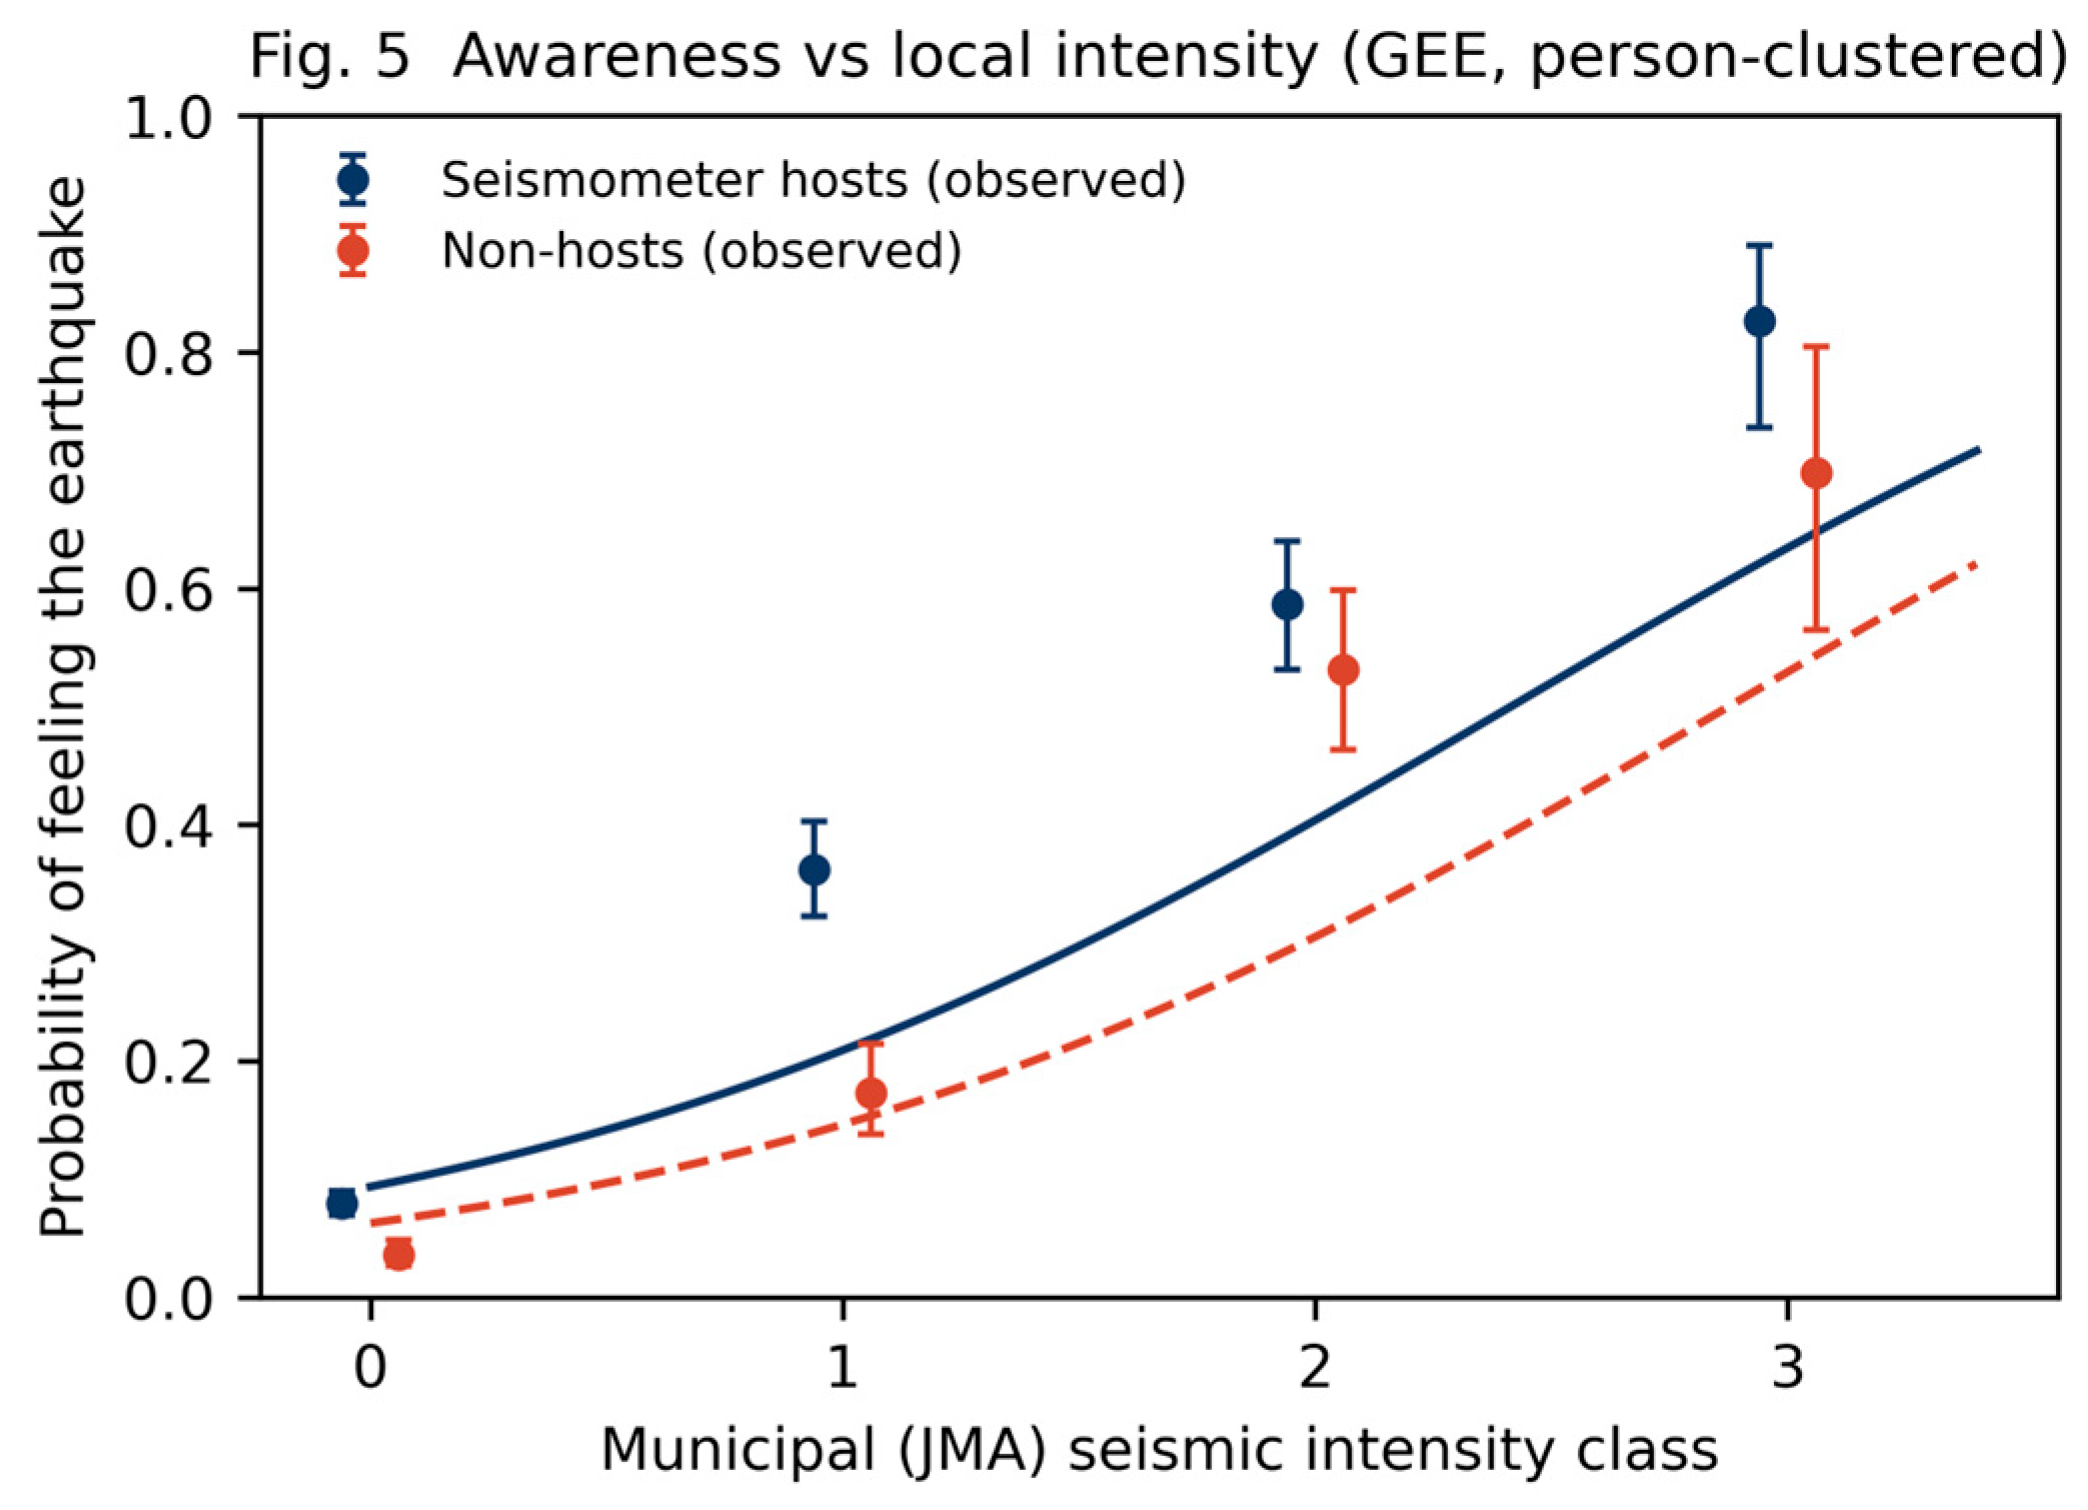
Figure 9.
Test of feedback calibration: mean signed gap (perceived minus municipal JMA seismic intensity) by cumulative felt experience, raw (a) and event-demeaned (b); the mixed-model experience effect is ().
Figure 9.
Test of feedback calibration: mean signed gap (perceived minus municipal JMA seismic intensity) by cumulative felt experience, raw (a) and event-demeaned (b); the mixed-model experience effect is ().
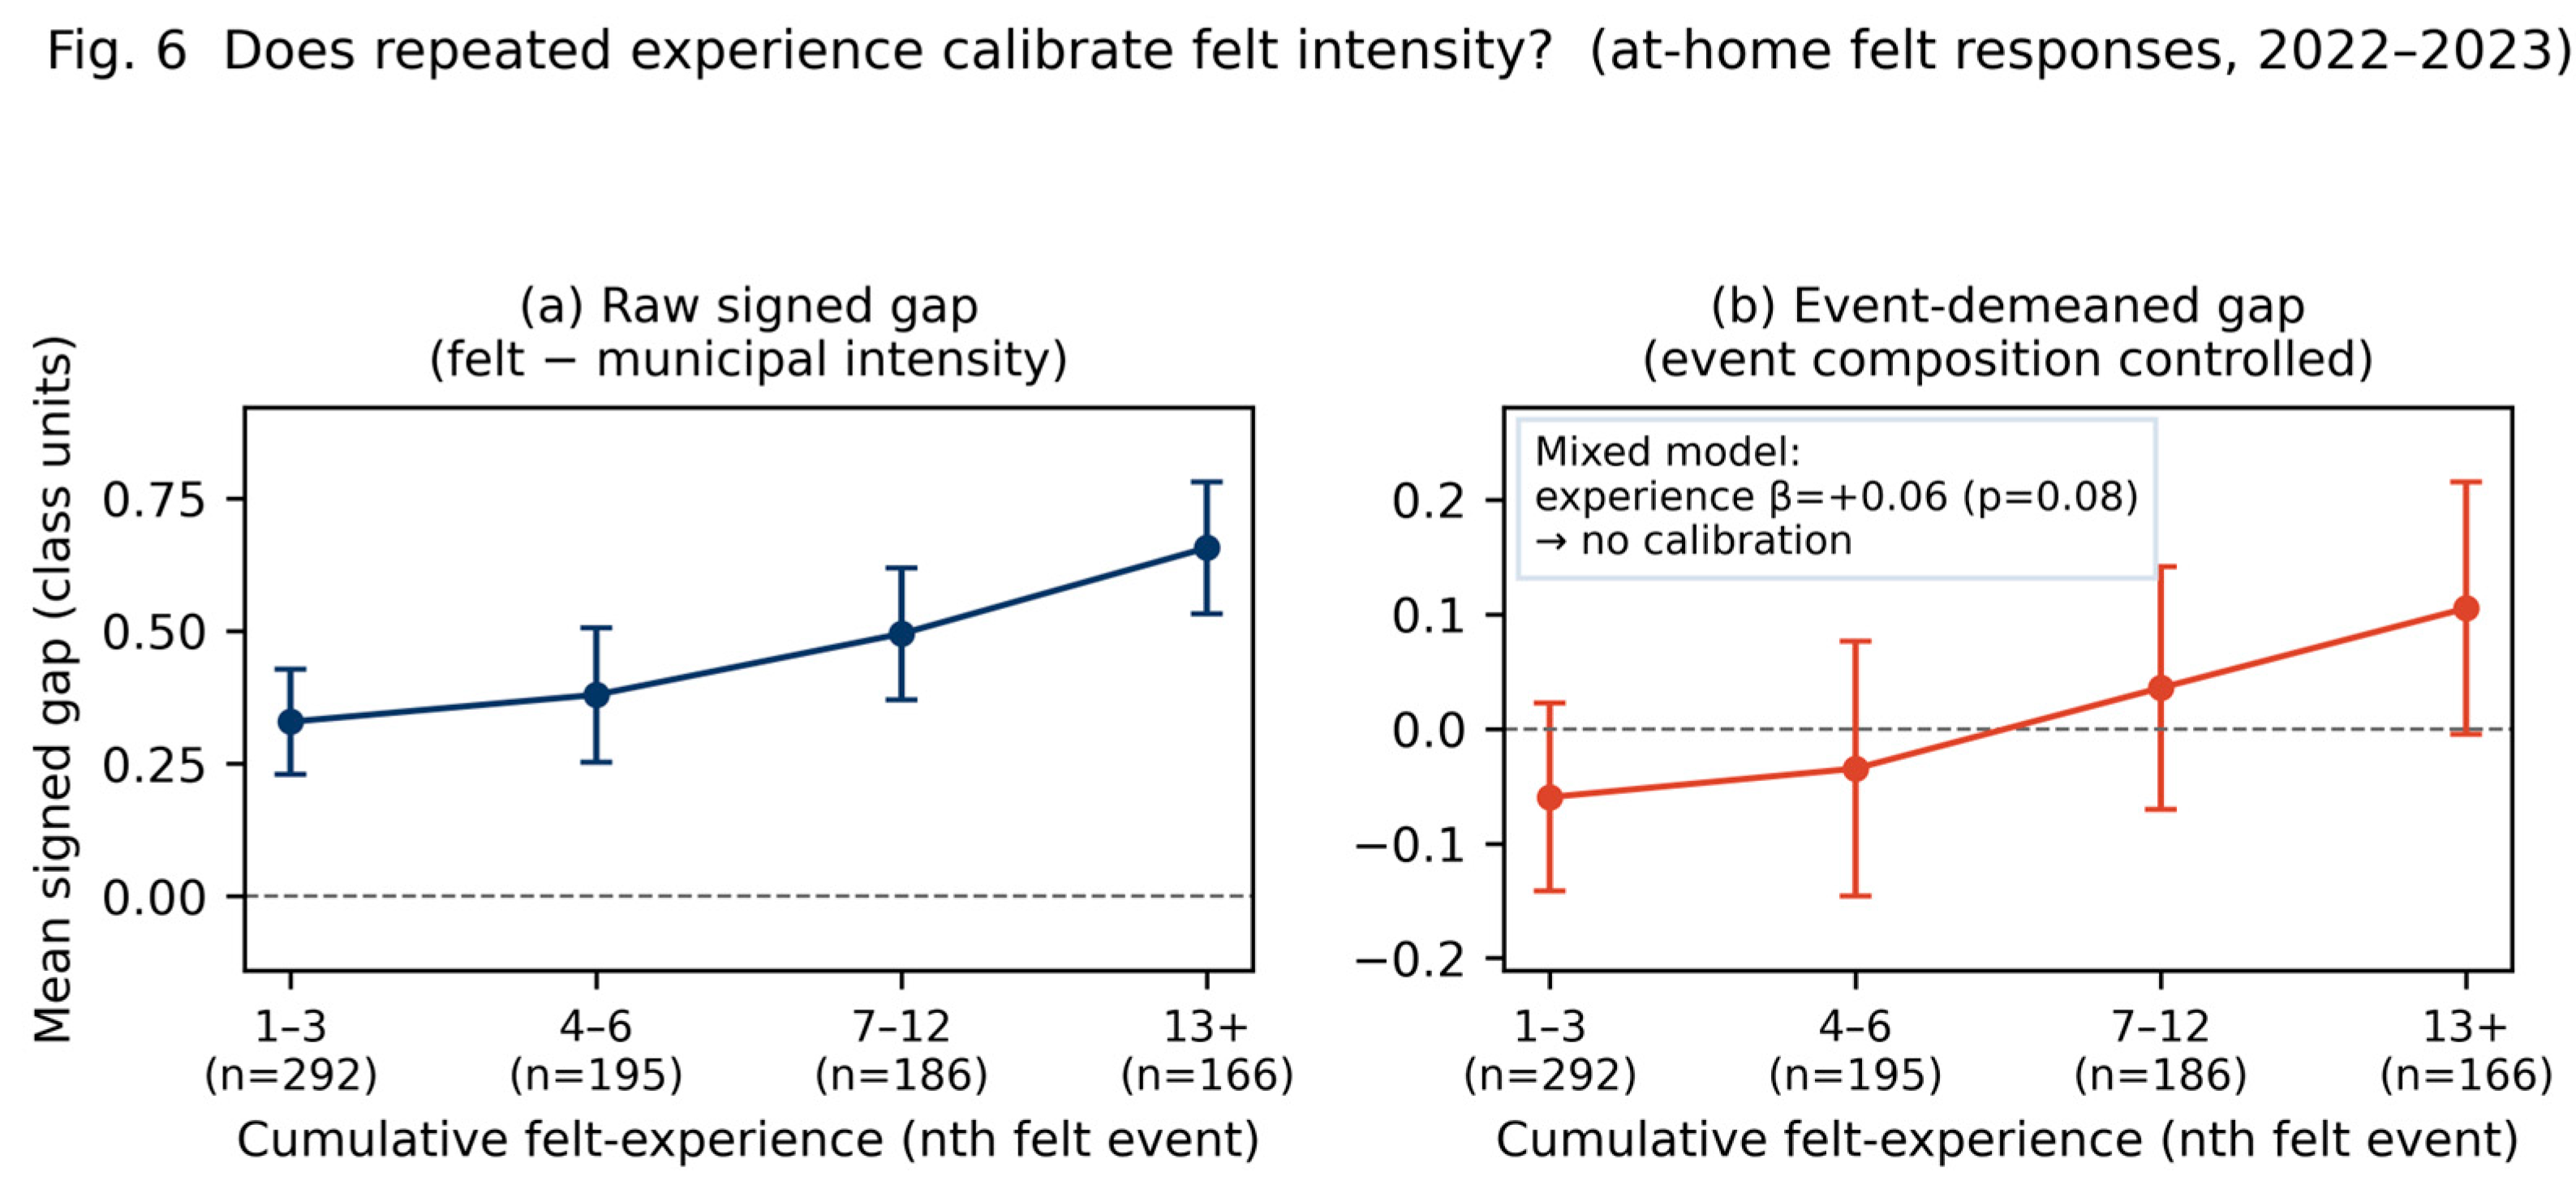

Table 1.
Cohorts, events, and responses (residents only).
| 2021 Zama (pilot) | 2022 Metropolitan | 2023 Expanded | |
| Survey period | Oct 2021 – Mar 2022 | Sep 2022 – Jan 2023 | Sep 2023 – Mar 2024 |
| Participants (hosts / non-hosts) | 20 (10 / 10) | 69 (50 / 19) | 92 (56 / 36) |
| Target earthquakes | 5 | 31 | 65 |
| Felt-survey deliveries | — | 2,139 | 5,915 |
| Felt-survey responses (rate) | 63 | 1,725 (80.6%) | 3,999 (67.6%) |
| Not-felt share of responses | — | 77% | 85% |
| At-home felt reports with municipal intensity | — | 279 | 509 |
| Pre-survey respondents (unique) | 20 | 67 | 83 |
| Post-survey respondents (unique) | 17 | 63 | 49 |
| Delivery channel | paper | e-mail + LINE | |
| Feedback per event | none (survey only) | indoor + station + EEW | indoor + station + EEW |
Table 2.
Approximate correspondence between the JMA intensity scale and EMS-98 (approximately equal to MMI).
Table 2.
Approximate correspondence between the JMA intensity scale and EMS-98 (approximately equal to MMI).
| JMA class | 0 | 1 | 2 | 3 | 4 | 5 Lower | 5 Upper | 6 Lower | 6 Upper | 7 |
| EMS-98 (approximately MMI) | I | II–III | IV | IV–V | V | VI | VII | VIII | IX–X | XI |
Table 3.
Population-averaged logistic GEE models for the probability of feeling an earthquake. Model B1 excludes floor height; Model B2 adds it and uses the subset for which floor height was reported.
Table 3.
Population-averaged logistic GEE models for the probability of feeling an earthquake. Model B1 excludes floor height; Model B2 adds it and uses the subset for which floor height was reported.
| Predictor | Model B1 OR [95% CI] | p | Model B2 OR [95% CI] | p |
| Municipal JMA seismic intensity (+1 class) | 2.56 [2.21–2.97] | <0.001 | 2.57 [2.21–2.99] | <0.001 |
| ln epicentral distance | 0.40 [0.34–0.47] | <0.001 | 0.39 [0.33–0.45] | <0.001 |
| Magnitude (, +1) | 2.23 [1.86–2.68] | <0.001 | 2.28 [1.88–2.76] | <0.001 |
| Main floor ≥3 (Model B2 only) | — | — | 1.47 [0.99–2.16] | 0.054 |
| Seismometer host | 1.54 [1.06–2.25] | 0.023 | 1.56 [1.06–2.28] | 0.024 |
| Study period 2023 | 0.65 [0.53–0.80] | <0.001 | 0.63 [0.51–0.79] | <0.001 |
Note: Model B1, n = 5,462 delivery responses; Model B2, n = 5,322. Both models use person-level clustering with an exchangeable working correlation.
Table 4.
Linear mixed-effects model for the signed gap between perceived and municipal JMA seismic intensity, after event demeaning.
Table 4.
Linear mixed-effects model for the signed gap between perceived and municipal JMA seismic intensity, after event demeaning.
| Fixed effect | β | SE | p |
| Intercept | 0.038 | 0.058 | 0.51 |
| Cumulative felt experience (per SD) | +0.054 | 0.034 | 0.117 |
| Municipal JMA seismic intensity (centered) | −0.191 | 0.024 | <0.001 |
| Study period 2023 | −0.033 | 0.064 | 0.61 |
| Person variance (random intercept) | 0.073 | 0.033 | — |
| Interaction model: experience × (intensity ≥2) | +0.032 | 0.048 | 0.50 |
| Random-slope model: experience | +0.077 | — | 0.119 |
Disclaimer/Publisher’s Note: The statements, opinions and data contained in all publications are solely those of the individual author(s) and contributor(s) and not of MDPI and/or the editor(s). MDPI and/or the editor(s) disclaim responsibility for any injury to people or property resulting from any ideas, methods, instructions or products referred to in the content. |
© 2026 by the authors. Licensee MDPI, Basel, Switzerland. This article is an open access article distributed under the terms and conditions of the Creative Commons Attribution (CC BY) license (http://creativecommons.org/licenses/by/4.0/).
Copyright: This open access article is published under a Creative Commons CC BY 4.0 license, which permit the free download, distribution, and reuse, provided that the author and preprint are cited in any reuse.