
Submitted:
31 August 2026
Posted:
31 August 2026
You are already at the latest version
Abstract
To investigate the effects of dryland tailwater recharge on rice rhizosphere fungi and phosphorus concentrations in the Erhai Lake Basin, two-year (2024–2025) field experiments were conducted in Gusheng Village on the western shore of Erhai Lake. Four water management treatments were established: conventional flooding (CK), controlled irrigation (C), low water layer tailwater recharge (CDC-L), and high water layer tailwater recharge (CDC-H). High-throughput sequencing and the molybdenum-antimony colorimetric method were used to analyze the dynamics of rhizosphere fungal communities and to reveal the coupled responses among phosphorus fractions in surface water, shallow soil water (0–20 cm), and rhizosphere fungi. The results showed that: (1) Compared with CK, the phosphorus activation coefficient (PAC) in surface water under CDC-L and CDC-H decreased by 35.1% and 33.6% in 2024, and by 4.5% and 18.4% in 2025, respectively. The proportion of particulate phosphorus (PP) increased by 67.5% and 66.1% in 2024, and by 5.1% and 21.2% in 2025, respectively. The ratio of dissolved phosphate (DP) to PP decreased by 77.3% and 79.2% in 2024, and by 37.6% and 49.8% in 2025, respectively. (2) Water management significantly reshaped the rhizosphere fungal community structure, with regulation effects showing significant stage-specificity.Tailwater recharge increased fungal OTU richness at the tillering stage. In 2024, richness at tillering was 23.8% and 14.3% higher than the value at the heading and milk stages, respectively; in 2025, the corresponding increases were 14.2% and 5.9%. respectively. (3) Controlled irrigation and tailwater recharge enriched Basidiomycota, which reduced surface water DP through biological immobilization and promotion of particulate phosphorus sedimentation. Tailwater recharge also induced the enrichment of Mortierellomycota, which increased total phosphorus (TP) and DP in soil water by activating insoluble phosphorus. Although exogenous phosphorus input at the tillering stage caused a TP peak, the wet-dry alternation effectively inhibited the transformation of phosphorus into dissolved forms. In conclusion, the CDC-H treatment enabled the resource recovery of dryland tailwater while mitigating agricultural non-point source phosphorus pollution. These synergistic outcomes demonstrate that CDC-H is more than a technical fix—it is a coupled water-food-environment solution. This approach offers an optimized management model for water conservation and pollution reduction at the Erhai Lake Basin and similar regions.This study elucidates the phosphorus migration and transformation mechanisms in tailwater-recharged paddies from the perspective of rhizosphere fungi, providing theoretical support and a practical paradigm for the green development of agriculture in plateau lake basins.
Keywords:
Erhai Lake Basin
; tailwater recharge
; rice rhizosphere fungi
; water management
; phosphorus
1. Introduction
As a typical agricultural area in a plateau lake basin [1], the Erhai Lake Basin suffers from agricultural non-point source pollution. In particular, the migration and loss of phosphorus (P) are among the key factors leading to lake eutrophication [2]. The risk of P runoff and leaching associated with conventional flooding irrigation seriously threatens water environment safety [3,4] and poses a potential threat to the aquatic environment of Erhai Lake. The dryland tailwater recharge mode involves recharging tailwater from upstream dryland areas into paddy fields, which can realize the recycling of upstream water resources and the uptake of nitrogen and phosphorus. Due to the topography of the Erhai Lake Basin—with the elevated Cangshan Mountains to the west and the lower Erhai Lake to the east—the landscape transitions from slopes to drylands to paddy fields from east to west. Previously, dryland tailwater was typically discharged directly into Erhai Lake during rainfall events. Currently, this upstream dryland tailwater is recharged into paddy fields, which not only mitigates flood peaks and reduces irrigation water extraction but also absorbs nutrients from the tailwater. Therefore, developing water-saving irrigation technologies that can ensure rice production, effectively intercept nutrients, and reduce non-point source pollution [6] is of great significance for agricultural sustainable development and water environment protection in the Erhai Lake Basin [5,6].
As a model for agricultural water resource recycling, dryland tailwater recharge diverts nutrient-laden water from upstream drylands into paddy fields, aiming to achieve efficient utilization of water and fertilizers [7]. Meanwhile, as an artificial wetland system [8,9,10], paddy fields possess a certain capacity to intercept and purify nutrients from tailwater [11,12]. Rice rhizosphere fungal communities, as an important component of the soil ecosystem, profoundly affect the transformation of phosphorus in paddy soil water [13]. Numerous studies have shown that rice rhizosphere fungal communities play a crucial role in promoting soil nutrient cycling, especially in the processes of phosphorus activation and immobilization [14]. For example, arbuscular mycorrhizal fungi (AMF) can activate insoluble phosphorus in the soil by secreting organic acids and phosphatases, thereby affecting phosphorus immobilization and availability [15,16].
Different water management practices alter the conditions of water, air, and temperature in the soil, and significantly change the soil redox potential, water movement pathways, and the forms and availability of nutrients [17,18]. These changes collectively affect the rice rhizosphere microenvironment, thereby influencing the structure and function of the rhizosphere fungal community [19]. However, in the agricultural ecosystem of the Erhai Lake Basin, how the agronomic practice of dryland tailwater recharge combines with different irrigation modes, and how it affects the dynamic changes and interception efficiency of phosphorus concentration in shallow soil water by regulating the rhizosphere fungal community, remain poorly understood. The intrinsic mechanisms by which the regulation of rhizosphere fungal communities affects the forms and migration patterns of phosphorus in surface water and soil water currently lack systematic investigation. In particular, which key fungal taxa play a dominant role in this process remains unclear. For instance, whether Basidiomycota and Mortierellomycota play key roles in phosphorus interception and activation has not been investigated within the specific context of "dryland tailwater recharge". Clarifying this "irrigation method–rhizosphere fungi–phosphorus migration" coupling relationship is crucial for evaluating and optimizing water-saving and emission-reduction technologies.
Given that soil microbial communities serve as a critical link between agricultural management practices and ecosystem functions [20], and that field-controlled experiments combined with high-throughput sequencing and environmental factor correlation analysis have become mainstream approaches to decipher such complex interactions [21], a field experiment was conducted in the rice planting area of Gusheng Village, Wanqiao Town, Dali Bai Autonomous Prefecture. Four treatments were established: conventional flooding (CK), controlled irrigation (C), low water layer tailwater recharge (CDC-L), and high water layer tailwater recharge (CDC-H). By analyzing the dynamic changes in the composition and diversity (alpha and beta diversity) of rice rhizosphere fungal communities under different treatments, and combining this with the monitoring of total phosphorus (TP) and dissolved phosphorus (DP) concentrations in soil water, this study aimed to: (1) elucidate the stage-specific patterns of rhizosphere fungal community succession driven by water management; (2) reveal the linkage mechanism among "irrigation method–rhizosphere fungi–phosphorus fraction transformation"; and (3) evaluate the application potential of the tailwater recharge mode in synergistically achieving water conservation, tailwater resource utilization, and phosphorus pollution mitigation, thereby providing a theoretical basis from a microbial perspective for the control of non-point source pollution in paddy fields in the Erhai Lake Basin.
2. Materials and Methods
2.1. Description of Experiment Area
The experiment was conducted at the Agricultural Reclamation Planting Base in Gusheng Village, Wanqiao Town, Dali City, Yunnan Province (100°08′25″ E, 25°48′58″ N), located on the western shore of Erhai Lake. The region has a plateau monsoon climate transitioning from mid-subtropical to north-subtropical zones, with a mean annual temperature of approximately 15.5 °C, a mean temperature of the hottest month of 20.1 °C, and a mean temperature of the coldest month of 8.7 °C. The mean annual precipitation is about 1080 mm, with approximately 95% of rainfall concentrated from May to October. The temporal and spatial distribution of rainfall within the year is uneven, with abundant sunshine and a large diurnal temperature difference. The light and heat resources are suitable for the growth of crops such as rice and rapeseed. The dominant cropping system in this area is a "rapeseed–rice" rotation. The surface soil is sandy loam, with a relatively high organic matter content of 68.09 g·kg⁻1, total nitrogen content of 4.32 g·kg⁻1, available phosphorus content of 68.30 mg·kg⁻1, available potassium content of 57.54 mg·kg⁻1, and soil pH of 6.7.
2.2. Experimental Design
A field experiment was conducted in Gusheng Village from May to October in both 2024 and 2025. Four irrigation treatments were established: conventional flooding (CK), controlled irrigation (C), low water layer tailwater recharge (CDC-L), and high water layer tailwater recharge (CDC-H), with three replicates for each treatment. The plot areas for CK, C, CDC-L, and CDC-H were 1133 m2, 1217 m2, 1108 m2, and 1258 m2, respectively. To prevent water interference between different treatments, plastic film buried to a depth of 80 cm was installed between the four plots as a hydraulic isolation barrier. The water regulation indicators for each treatment are presented in Table 1.
The tested rice variety was "Yunjing 37", which was transplanted on 26 May 2024 and 11 June 2025, respectively. The cultivation method was machine transplanting, with a row spacing of 25 cm and a plant spacing of 15 cm. The rice growth periods were from 30 May to 12 October 2024 and from 11 June to 16 October 2025, with total growth durations of 140 and 128 days, respectively. All plots adopted the same fertilization scheme. The base fertilizer consisted of green intelligent rice special fertilizer (N–P₂O₅–K₂O = 15%–11%–14%) at a rate of 600 kg·ha⁻1 and Yuanwo biological bacterial fertilizer (N–P₂O₅–K₂O = 3.22%–3.67%–3.67%) at a rate of 600 kg·ha⁻1.
2.3. Sampling and Measurements
- (1)
- Meteorological data
Daily meteorological data were obtained from a weather station, including daily rainfall, air temperature, atmospheric pressure, relative humidity, solar radiation, wind speed, and wind direction.
- (2)
- Water layer
The "S" point sampling method was used for the surface water layer and soil moisture content. Three fixed points within the same plot were measured regularly with a ruler to determine the water layer depth. Soil moisture content at the three fixed points was determined using Time Domain Reflectometry (TDR) or the oven-drying method. A PVC observation well for groundwater level was installed in each plot for groundwater level monitoring.
- (3)
- Phosphorus concentration in water samples
Water samples were collected from each plot on the day before fertilization and on the 1st, 3rd, 7th, 11th, 15th, and 20th days after fertilization. Each time, two types of water samples—mixed surface water and shallow soil water—were collected from each plot. Surface water samples were directly collected using a 100 mL medical syringe via the "S" shaped mixed sampling method (without disturbing the soil layer). Shallow soil water was collected using a negative pressure porous cup (tension lysimeter) installed in the shallow soil layer beneath the ground surface of each experimental plot. The water quality indicators were total phosphorus (TP) and dissolved phosphate (DP), which were determined using the molybdenum-antimony colorimetric method according to the Water and Wastewater Monitoring Analysis Method (4th edition) [22]. Based on these, the phosphorus activation coefficient (AC = DP/TP) and particulate phosphorus percentage (PP% = (1 − DP/TP) × 100%) were calculated to characterize the phosphorus form distribution.
- (4)
- Rhizosphere soil microorganisms
Rhizosphere soil samples were collected once at the tillering, heading, and milk-ripe stages for analysis. During each sampling, three plants with representative growth were randomly selected from each treatment. The surface soil (0–0.5 cm) was removed, and rice roots were excavated from the 0.5–20 cm soil layer. Approximately 50 g of rhizosphere soil from rice seedlings was collected, impurities were removed, and the samples were used for soil microbial analysis. The testing was commissioned to Guangzhou Aozhi Biotechnology Co., Ltd. The detection process involved extracting genomic DNA from the samples, followed by amplification of the ITS1 and ITS2 regions of rDNA using specific primers with barcodes. The primer names were ITS3_KYO2ITS4 and ITS1_F_KYO2ITS86R, with sequences of GATGAAGAACGYAGYRAATCCTCCGCTTATTTGATATGC and TAGAGGAAGTAAAAGTCGTAATTCAAAGATTCGATGATTCAC, respectively. Then, the PCR amplification products were recovered from the gel, and the concentration was quantified using a QuantiFluor™ fluorometer. The purified products were mixed in equal amounts, sequencing adapters were ligated, a sequencing library was constructed, and sequencing was performed on an Illumina PE250 platform. The main tests included alpha diversity, beta diversity, and species diversity analyses.
3. Results
3.1. Effects of Irrigation Treatments on Phosphorus Activation and Form Distribution
The phosphorus activation coefficient (AC) is a key indicator for characterizing phosphorus bioavailability and loss risk. Based on observational data from 2024 to 2025, different irrigation treatments significantly regulated phosphorus form distribution in surface water and shallow soil water.
In surface water, the dynamics of AC values reflected the activation degree of exogenous phosphorus input. Data from 2024 showed that AC values across treatments ranged from 0.196 to 0.450 at the early tillering stage, with the CDC-H treatment having the highest value (0.450), possibly due to the rapid release of exogenous phosphorus introduced by high water layer tailwater recharge. Subsequently, AC values fluctuated. By the end of the growth period, the AC values for CK, C, CDC-L, and CDC-H were 0.641, 0.969, 0.439, and 0.512, respectively, indicating that CDC-L significantly inhibited further phosphorus activation. Changes in DP/PP also revealed that on June 10, the DP/PP ratio in CK was as high as 9.554, indicating that phosphorus almost entirely existed in dissolved form under conventional flooding, posing a great loss risk. In contrast, the DP/PP in CDC-H was only 1.465 during the same period, with PP% (particulate phosphorus percentage) reaching 0.301, significantly higher than 0.049 in CK, demonstrating that tailwater recharge promoted the formation and sedimentation of particulate phosphorus. Notably, the AC value in the C treatment reached 0.969 at the end of the growth period, and DP/PP rose to 11.293, the highest observed value over the two years. This suggests that controlled irrigation alone, without the particulate adsorption interface provided by tailwater recharge, may lead to a high enrichment of dissolved phosphorus in surface water. In 2025, AC values in surface water showed an overall fluctuating trend, ranging from 0.138 to 0.705 across treatments. The AC value in CDC-H dropped to 0.138 on June 24, the lowest observed value over the two years, while PP% reached 0.862 during the same period. This indicates that high water layer tailwater recharge greatly promoted the particulate fixation of phosphorus during the mid-growth stage, effectively reducing the bioavailability and loss potential of dissolved phosphorus.

Table 2.
AC, PP%, and DP/PP in paddy surface water, 2024–2025.
| AC(2024) | AC(2025) | |||||||||||||
|---|---|---|---|---|---|---|---|---|---|---|---|---|---|---|
| Treatment/Date | 6.8 | 6.10 | 6.12 | 6.16 | 6.20 | 6.24 | 6.29 | 6.20 | 6.22 | 6.24 | 6.28 | 7.2 | 7.6 | 7.11 |
| CK | 0.196 | 0.951 | 0.728 | 0.561 | 0.962 | 0.629 | 0.641 | 0.508 | 0.613 | 0.632 | 0.697 | 0.432 | 0.279 | 0.583 |
| C | 0.256 | 1.428 | 0.774 | 0.563 | 0.912 | 0.429 | 0.969 | 0.330 | 0.500 | 0.477 | 0.522 | 0.705 | 0.462 | 0.463 |
| CDC-L | 0.322 | 0.782 | 0.338 | 0.223 | 0.514 | 0.411 | 0.439 | 0.458 | 0.544 | 0.649 | 0.315 | 0.501 | 0.551 | 0.559 |
| CDC-H | 0.45 | 0.699 | 0.306 | 0.144 | 0.573 | 0.416 | 0.512 | 0.473 | 0.432 | 0.138 | 0.337 | 0.477 | 0.626 | 0.572 |
| PP%(2024) | PP(2025) | |||||||||||||
| Treatment/Date | 6.8 | 6.10 | 6.12 | 6.16 | 6.20 | 6.24 | 6.29 | 6.20 | 6.22 | 6.24 | 6.28 | 7.2 | 7.6 | 7.11 |
| CK | 0.804 | 0.049 | 0.272 | 0.439 | 0.038 | 0.371 | 0.359 | 0.492 | 0.387 | 0.368 | 0.303 | 0.568 | 0.721 | 0.417 |
| C | 0.744 | 0.226 | 0.226 | 0.438 | 0.088 | 0.571 | 0.031 | 0.670 | 0.500 | 0.523 | 0.448 | 0.295 | 0.538 | 0.537 |
| CDC-L | 0.678 | 0.218 | 0.662 | 0.778 | 0.486 | 0.589 | 0.561 | 0.542 | 0.456 | 0.351 | 0.685 | 0.499 | 0.449 | 0.441 |
| CDC-H | 0.550 | 0.301 | 0.694 | 0.856 | 0.427 | 0.584 | 0.488 | 0.527 | 0.568 | 0.862 | 0.663 | 0.523 | 0.374 | 0.428 |
| DP/PP(2024) | DP/PP(2025) | |||||||||||||
| Treatment/Date | 6.8 | 6.10 | 6.12 | 6.16 | 6.20 | 6.24 | 6.29 | 6.20 | 6.22 | 6.24 | 6.28 | 7.2 | 7.6 | 7.11 |
| CK | 0.121 | 9.554 | 2.600 | 0.168 | 8.161 | 1.373 | 1.363 | 0.722 | 0.566 | 0.888 | 2.588 | 0.712 | 0.240 | 0.939 |
| C | 0.089 | 2.244 | 2.870 | 0.123 | 2.020 | 0.296 | 11.293 | 0.212 | 0.201 | 0.615 | 1.288 | 0.913 | 0.562 | 0.441 |
| CDC-L | 0.472 | 2.145 | 0.956 | 0.211 | 0.852 | 0.406 | 0.246 | 0.556 | 0.311 | 1.032 | 0.635 | 0.360 | 0.610 | 0.648 |
| CDC-H | 0.384 | 1.465 | 0.596 | 0.182 | 0.788 | 0.481 | 0.560 | 0.232 | 0.135 | 0.066 | 0.644 | 0.571 | 0.967 | 0.726 |
In shallow soil water, the dynamics of AC values revealed the transformation mechanisms of phosphorus in the soil profile. At the early tillering stage in 2024, the DP/PP ratio in CK was exceptionally high at 6.835, with an AC value of 0.899, indicating that dissolved phosphorus dominated the soil water, particulate phosphorus was minimal, and the leaching risk was extremely high. In contrast, the DP/PP ratios in CDC-L and CDC-H were only 0.145 and 0.333, with PP% reaching 0.551 and 0.673, respectively. This demonstrates that tailwater recharge induced the transformation of phosphorus into particulate form and enhanced phosphorus interception capacity in the soil profile. As the growth stage progressed, AC values across all treatments showed an overall declining trend, with CDC-H exhibiting the most stable control over soil water AC. In 2025, AC values in shallow soil water remained generally low, and DP/PP ratios were universally low. Notably, the PP% in CDC-L reached 0.890 on June 24, the highest value among all treatments over the two years, indicating that phosphorus predominantly existed in particulate form in the soil water under this treatment, resulting in a very low leaching risk.
Synthesizing the two-year data, tailwater recharge (CDC-L and CDC-H) significantly reduced AC values and increased PP% in both surface water and shallow soil water. This shift in phosphorus form distribution is highly consistent with the succession patterns of the rhizosphere fungal community: the Mortierellomycota enriched in the early stage may have been involved in the initial phosphorus activation (transient AC increase), while the Basidiomycota enriched in the mid-to-late stage likely reduced AC values through biological immobilization or by promoting the formation of particulate phosphorus. This indicates that appropriate irrigation modes effectively drive the transformation of phosphorus from "highly active dissolved form" to "relatively stable particulate form" by regulating fungal community structure, representing an important microbiological mechanism for phosphorus pollution mitigation and efficiency improvement.
Table 3.
AC, PP%, and DP/PP in paddy soil water , 2024–2025.
| AC(2024) | AC(2025) | |||||||||||||||
|---|---|---|---|---|---|---|---|---|---|---|---|---|---|---|---|---|
| Treatment/Date | 6.8 | 6.10 | 6.12 | 6.16 | 6.20 | 6.24 | 6.29 | 6.20 | 6.22 | 6.24 | 6.28 | 7.2 | 7.6 | 7.11 | ||
| CK | 0.899 | 0.920 | 0.142 | 0.113 | 0.974 | 0.480 | 0.178 | 0.506 | 0.632 | 0.604 | 0.550 | 0.282 | 0.247 | 0.284 | ||
| C | 0.765 | 0.783 | 0.086 | 0.179 | 0.202 | 0.607 | 0.014 | 0.424 | 0.375 | 0.342 | 0.230 | 0.181 | 0.348 | 0.324 | ||
| CDC-L | 0.449 | 0.418 | 0.392 | 0.272 | 0.364 | 0.126 | 0.149 | 0.325 | 0.409 | 0.110 | 0.158 | 0.407 | 0.545 | 0.351 | ||
| CDC-H | 0.327 | 0.393 | 0.228 | 0.640 | 0.430 | 0.122 | 0.171 | 0.289 | 0.459 | 0.445 | 0.178 | 0.475 | 0.457 | 0.346 | ||
| PP%(2024) | PP(2025) | |||||||||||||||
| Treatment/Date | 6.8 | 6.10 | 6.12 | 6.16 | 6.20 | 6.24 | 6.29 | 6.20 | 6.22 | 6.24 | 6.28 | 7.2 | 7.6 | 7.11 | ||
| CK | 0.101 | 0.080 | 0.858 | 0.887 | 0.026 | 0.520 | 0.822 | 0.494 | 0.368 | 0.396 | 0.450 | 0.718 | 0.753 | 0.716 | ||
| C | 0.234 | 0.217 | 0.914 | 0.821 | 0.798 | 0.393 | 0.986 | 0.576 | 0.625 | 0.658 | 0.770 | 0.819 | 0.652 | 0.676 | ||
| CDC-L | 0.551 | 0.582 | 0.608 | 0.728 | 0.636 | 0.874 | 0.851 | 0.675 | 0.591 | 0.890 | 0.842 | 0.593 | 0.455 | 0.649 | ||
| CDC-H | 0.673 | 0.607 | 0.772 | 0.360 | 0.570 | 0.878 | 0.829 | 0.711 | 0.541 | 0.555 | 0.822 | 0.525 | 0.543 | 0.654 | ||
| DP/PP(2024) | DP/PP(2025) | |||||||||||||||
| Treatment/Date | 6.8 | 6.10 | 6.12 | 6.16 | 6.20 | 6.24 | 6.29 | 6.20 | 6.22 | 6.24 | 6.28 | 7.2 | 7.6 | 7.11 | ||
| CK | 6.835 | 3.845 | 0.049 | 0.034 | 2.812 | 0.210 | 0.041 | 0.158 | 0.761 | 0.367 | 0.333 | 0.074 | 0.033 | 0.058 | ||
| C | 1.231 | 0.785 | 0.015 | 0.032 | 0.028 | 0.209 | 0.002 | 0.062 | 0.265 | 0.044 | 0.028 | 0.019 | 0.079 | 0.044 | ||
| CDC-L | 0.145 | 0.421 | 0.171 | 0.092 | 0.069 | 0.062 | 0.058 | 0.046 | 0.270 | 0.010 | 0.029 | 0.070 | 0.157 | 0.090 | ||
| CDC-H | 0.333 | 0.706 | 0.162 | 0.781 | 0.214 | 0.071 | 0.055 | 0.051 | 0.477 | 0.085 | 0.021 | 0.271 | 0.191 | 0.121 | ||
3.2. Effects of Irrigation Treatments on Rice Rhizosphere Fungal Communities
3.2.1. Rhizosphere Fungal Structures Under Different Treatments
In the 2024–2025 experiment, Principal Component Analysis (PCA) was used to systematically analyze the beta diversity dynamics of rice rhizosphere fungal communities under four water management treatments at three critical growth stages: tillering, heading, and milk-ripe (Figure 1). A greater distance between sample points in the ordination space indicates a larger difference in fungal community structure.
At the tillering stage (a), the cumulative explained variance of the first two PCA axes was 69.93% and 34.98% in 2024 and 2025, respectively. In both years, sample points from all treatments were concentrated near the origin of the ordination space, with minimal inter-group and intra-group differences. This indicates that in the early rice growth stage, different water management practices had not yet caused significant differentiation of the rhizosphere fungal community, and the overall community structure exhibited high similarity.
At the heading stage (b), the cumulative explained variance of the first two axes reached 61.83% and 24.19% in the two years, respectively, indicating that this stage was a critical period for water management to shape community structure. In 2024, the CDC-L treatment showed a tendency to deviate from the core cluster along PC1, suggesting that this treatment had begun to drive community variation. In 2025, clear clustering and separation patterns were further observed: the CK treatment was solely clustered in the positive direction of PC1, showing significant differentiation from the three water-regulated treatments (C, CDC-L, and CDC-H), while the samples within the C, CDC-L, and CDC-H treatments were compactly distributed with small differences.
At the milk-ripe stage (c), the cumulative explained variance of the first two axes decreased to 42.74% and 15.13% in the two years, respectively, and the overall community tended toward homogenization, with most samples re-clustering in the origin area. However, outlier samples from specific treatments were observed in both years: in 2024, individual samples from the controlled irrigation (C) treatment shifted; in 2025, one sample from the low water layer tailwater recharge (CDC-L) treatment significantly deviated from the overall cluster along PC1. This suggests that different water regulation measures may induce occasional and local intense community variations during the late growth stage.
In summary, the two-year continuous observations jointly verify that water management measures such as controlled irrigation and tailwater recharge can significantly regulate the beta diversity of rice rhizosphere fungi, and this regulatory effect exhibits obvious stage-specific dynamic characteristics, with the most prominent effect at the heading stage.
3.2.2. Effects of Different Treatments on the Species Composition of Rice Rhizosphere Fungi
Based on the experimental results from 2024 to 2025, the changes in the number of soil fungal OTUs at the tillering, heading, and milk-ripe stages under four water treatments (CK, C, CDC-L, and CDC-H) were systematically analyzed to reveal the stage-specificity and inter-annual stability of water management effects on the fungal community structure in paddy soil (Figure 2). The two-year results showed that different water treatments significantly altered the fungal OTU richness in paddy soil, and this effect varied considerably with the rice growth stage and experimental year. Overall, the soil fungal OTU richness in 2025 was significantly higher than that in 2024, and the consistency and differences in treatment effects across growth stages and years were notable.
Over the two years, a total of 4776 soil fungal OTUs were detected across all treatments and growth stages in 2024, and this number increased to 6162 in 2025, indicating a significantly higher overall fungal community richness. At the tillering stage, both years consistently showed that tailwater recharge treatments increased soil fungal OUT richness. In 2024, the total number of soil fungal OTUs at tillering was 1780, with 394 OTUs shared among the four treatments (22.1%). Among them, CDC-H had the highest number of unique OTUs (285), while C had the lowest (139). The total OUT numbers in CDC-L and CDC-H were significantly higher than those in CK and C. In 2025, the fungal community richness at tillering further increased, with a total of 2185 OTUs and 526 shared OTUs (24.1%). In this period, there was no significant difference in the number of unique OTUs among treatments, and the tailwater recharge treatments maintained a higher OUT richness. This confirms that the effect of tailwater recharge in promoting fungal community enrichment at the tillering stage is stable across years and less affected by inter-annual environmental differences.
At the heading stage, the response of the soil fungal community to water treatments showed significant inter-annual variation, with completely opposite treatment effects between the two years. In 2024, the total OUT number at heading was 1438, with 335 shared OTUs (23.3%). CK had the highest number of unique OTUs (264), while CDC-L had the lowest (133). The total OUT numbers under C and CDC-L were lower than that under CK, and CDC-H showed a more pronounced suppressive effect on the fungal community, indicating that controlled irrigation and tailwater recharge reduced fungal OUT richness at the heading stage in 2024. In contrast, in 2025, the treatment effect shifted markedly: the total OUT number was 1914, with 395 shared OTUs (20.6%). The OUT richness under all water-saving treatments was significantly higher than that under CK, with CDC-L having the highest number of unique OTUs (301) and CK the lowest (186). This indicates that controlled irrigation and tailwater recharge effectively enhanced fungal community richness at the heading stage in 2025, demonstrating that inter-annual differences in climate and water-fertilizer conditions significantly altered the response pattern.
At the milk-ripe stage, the regulatory effect of water treatments on the soil fungal community was highly consistent across the two years, both showing that high water layer tailwater recharge (CDC-H) significantly enriched the soil fungal community. In 2024, the total OUT number was 1558, with 343 shared OTUs (22.0%). CDC-H had the highest number of unique OTUs (261), while C had the lowest (159). The OUT richness under C and CDC-L was relatively low, and only CDC-H achieved significant fungal community enrichment. In 2025, the differences became even more pronounced, with a total of 2063 OTUs and 371 shared OTUs (18.0%). CDC-H again had the highest number of unique OTUs (501), and CK the lowest (164). The OUT richness across treatments ranked as CDC-H > CDC-L > C > CK, further verifying the proliferative effect of high water layer tailwater recharge on the fungal community at the milk-ripe stage.
From the perspective of annual cumulative OUT numbers, the overall community patterns differed significantly between the two years. In 2024, the cumulative total OUT numbers across all growth stages ranked as CK (2606) > CDC-H (2562) > CDC-L (2388) > C (2287), indicating that conventional flooding maintained the highest overall fungal richness, which was consistent with the milk-ripe stage pattern. In 2025, the cumulative total OUT numbers increased significantly, and the overall pattern shifted to CDC-H (3436) > CDC-L (3228) > C (3116) > CK (2825), highlighting the advantage of tailwater recharge, especially high water layer tailwater recharge, in enhancing fungal community richness. The annual effect was also highly consistent with the milk-ripe stage pattern.
In summary, water treatments exerted stage-specific and inter-annually heterogeneous regulatory effects on the rhizosphere soil fungal OUT community. Among these, the promoting effects of tailwater recharge at the tillering stage and high water layer tailwater recharge at the milk-ripe stage were stable and less disturbed by inter-annual environmental changes. In contrast, the fungal community at the heading stage was highly sensitive to water regulation, and its treatment effect reversed significantly between years, making it a key growth stage for inter-annual variation. The two-year results collectively indicate that high water layer tailwater recharge can effectively enhance the soil fungal community richness in paddy fields, representing an optimal water management strategy, and this positive regulatory effect is more pronounced in the late growth stages of rice.
A total of eight fungal phyla were identified across the four treatments during the 2024–2025 experiment: Ascomycota, Basidiomycota, Chlorophyta, Mortierellomycota, Ciliophora, Mucormycota, Rozellomycota, and Chytridiomycota (Figure 3). The two-year results showed that Ascomycota was the absolutely dominant phylum throughout the entire rice growth period. Overall, Basidiomycota and Mortierellomycota maintained relatively high abundances and served as the core community constituents, while Mucormycota, Rozellomycota, and Chytridiomycota were low-abundance rare taxa. The community structure remained generally stable, yet exhibited distinct stage-specific and inter-annual response patterns.
At the tillering stage, the patterns across the two years were largely consistent: compared with CK, the C, CDC-L, and CDC-H treatments all increased the relative abundance of Basidiomycota and significantly reduced that of Chlorophyta. Ascomycota was enriched under all three water-regulated treatments, with relative abundances higher than that of CK. The main inter-annual difference lay in the response of Mortierellomycota: in 2024, only the C treatment showed a decrease in Mortierellomycota abundance, whereas in 2025, both C and CDC-L had lower Mortierellomycota abundances than CK, and only CDC-H promoted its enrichment.
At the heading stage, all water-regulated treatments consistently and significantly reduced the relative abundance of Chlorophyta in both years. The response of Ascomycota showed a clear inter-annual difference: in 2024, Ascomycota abundance increased under C but decreased slightly and non-significantly under CDC-L and CDC-H; in 2025, Ascomycota was continuously enriched across all treatments, with abundances generally higher than CK. Meanwhile, at the heading stage in 2025, Mortierellomycota abundance increased only under CDC-H, while C and CDC-L showed decreased abundances. Basidiomycota was less affected by the water-regulated treatments, showing only a slight upward trend.
At the milk-ripe stage, all water-regulated treatments effectively enhanced the relative abundance of Basidiomycota, with consistent patterns across both years. The response of Ascomycota showed inter-annual divergence: in 2024, Ascomycota abundances under all water-regulated treatments were lower than that of CK, whereas in 2025, they remained higher than CK. Both years exhibited a consistent response pattern for Mortierellomycota: at the milk-ripe stage, C and CDC-H promoted Mortierellomycota enrichment, while CDC-L suppressed its growth. Concurrently, the relative abundance of Chlorophyta in all treatment groups remained lower than that of CK during the same period.
3.2.3. Alpha Diversity of Rhizosphere Fungi under Different Treatments
The alpha diversity indices of the fungal community in paddy soil water under different treatments are shown in Table 4. The Shannon index reflects species complexity, the Simpson index measures the degree of dominance by dominant species, ACE estimates the total number of species actually present in the community, Chao1 predicts the total number of potential species, Coverage represents the observed species coverage, and PD represents phylogenetic diversity.
Based on the two-year (2024–2025) monitoring data in Table 4, the sequencing coverage for all samples was higher than 99.8%, indicating that the current sequencing depth was sufficient to cover the vast majority of species in the rhizosphere community and demonstrating strong data reliability. The alpha diversity analysis revealed significant inter-annual differences and seasonal succession patterns. Compared with 2024, the rice rhizosphere fungal community in 2025 showed significant species enrichment at the tillering stage, with ACE reaching up to 1071.70. The dynamic trajectories of ACE and Chao1 both exhibited a typical “unimodal” curve, peaking at the tillering stage and significantly declining at the heading stage, suggesting a pulse supply effect of resource availability on the species pool during the early rice growth stage.
In terms of community assembly mechanisms, the Shannon index showed an obvious diversity collapse at the heading stage in 2024 (e.g., the CDC-H treatment decreased to 4.68), while the diversity remained high during the same period in 2025. This indicates that differences in climate fluctuations between years significantly altered the community’s ability to resist environmental disturbances and maintain its original structure. Notably, the Simpson index remained stable in the high range of 0.94–0.97 across all treatments in both years, confirming that the rice rhizosphere fungal community was consistently highly dominated by a few dominant lineages. Furthermore, the PD index was significantly coupled with species richness. The CDC-H treatment exhibited higher phylogenetic dispersion in multiple periods in 2024, suggesting that this treatment may have promoted community functional redundancy and stress resistance by maintaining broader niche differentiation.
3.3. Correlation Analysis Between Rhizosphere Fungi and Phosphorus Concentrations in Shallow Soil Water
To clarify the intrinsic associations between rhizosphere fungal community characteristics and phosphorus migration and transformation in soil water, Pearson correlation analysis and Spearman correlation analysis combined with heatmap visualization were used to systematically investigate the correlations of rhizosphere fungal alpha diversity indices and the relative abundances of dominant phyla at the phylum level with TP and DP concentrations in surface water and shallow soil water (0–20 cm) across different growth stages.
3.3.1. Correlation Between Fungal Alpha Diversity and Phosphorus Concentrations
The Pearson correlation analysis results from 2024 and 2025 revealed inter-annual differences in the relationships between fungal alpha diversity indices and different phosphorus forms at different depths (Table 5). In terms of diversity and evenness, the Shannon and Simpson indices exhibited highly consistent response patterns. In 2024, both showed significant positive correlations with TP and DP in surface water (r = 0.709–0.853) and only weak positive correlations with phosphorus in shallow soil water (r = 0.260–0.460). However, in 2025, these relationships reversed: the correlations between the two indices and phosphorus in surface water weakened (r = 0.158–0.527), while they showed negative correlations with TP and DP in shallow soil water (r = −0.226 to −0.094), suggesting that the driving effect of the phosphorus environment on fungal community diversity and evenness exhibited significant temporal dynamics. In terms of species richness, ACE and Chao1 exhibited similar response patterns. Data from both years showed that these two indices had moderate to extremely strong positive correlations with phosphorus in shallow soil water (2024: r = 0.711–0.849; 2025: r = 0.816–0.921), but weak negative or nearly no correlations with phosphorus in surface water, indicating that phosphorus in shallow soil water is a key stabilizing factor for maintaining fungal community richness. In terms of phylogenetic diversity, the PD index showed a particularly close coupling with phosphorus in shallow soil water. In 2024, PD had significant positive correlations with TP and DP in shallow soil water (r = 0.955 and 0.994, p < 0.05 and p < 0.01, respectively). This strong correlation pattern persisted in 2025 (r = 0.912 and 0.971, p < 0.05), while the correlations with phosphorus in surface water were negligible. In summary, compared with phosphorus in surface water, phosphorus in shallow soil water had a more stable and significant promoting effect on fungal community richness and phylogenetic diversity, whereas the effect of shallow soil water phosphorus on diversity and evenness was more strongly influenced by inter-annual environmental fluctuations.
3.3.2. Correlation Between Dominant Fungi at the Phylum Level and Phosphorus Concentrations
The Spearman rank correlation analysis (2024–2025) showed that the associations between dominant rhizosphere fungal taxa and phosphorus forms exhibited highly reproducible, niche-specific coupling (Figure 5), and this coupling pattern was significantly responsive to irrigation regulation. Overall, the responses of different fungal phyla to phosphorus at the soil–water interface could be categorized into three functional groups:
(1) Soil available phosphorus indicators and interface migration group. Ascomycota and Rozellomycota both showed extremely significant and strong positive correlations with total phosphorus (SS-TP) and dissolved phosphorus (SS-DP) in shallow soil water in both years (2025: ρ = 1.000, p < 0.01; 2024: ρ = −0.949, p < 0.01 for Rozellomycota), indicating that their abundance dynamics were closely synchronized with soil available phosphorus levels, and they could serve as robust bioindicators of high-phosphorus environments. Notably, Chytridiomycota in 2025 showed strong positive correlations with both SS-TP and SS-DP (ρ = 0.800) and FW-DP (ρ = 0.800), suggesting its potential role in mediating cross-medium phosphorus migration at the soil–water interface. Meanwhile, Chlorophyta and Anthophyta both showed moderate positive correlations with FW-TP/FW-DP in 2024 (ρ = 0.800), further supporting the driving effect of aqueous phosphorus on photoautotrophic organisms.
(2) Aqueous phosphorus regulation and interception group. Basidiomycota exhibited a consistent “soil increase–water decrease” antagonistic pattern across years: in 2025, it showed a significant negative correlation with FW-TP (ρ = −0.800) and a positive correlation with SS-TP (ρ = 0.600); in 2024, this pattern was even more extreme, with a perfect negative correlation with FW-DP (ρ = −1.000, p < 0.01). This stability strongly suggests that Basidiomycota may play a key ecological role in intercepting phosphorus loss to water by promoting soil phosphorus immobilization or biological uptake. In contrast, the functional positioning of Mortierellomycota varied between years: in 2024, it showed perfect positive correlations with SS-TP/SS-DP (ρ = 1.000, p < 0.01), implying a soil phosphorus activation potential; whereas in 2025, it shifted to specifically responding to surface water phosphorus (FW-TP: ρ = 0.800; FW-DP: ρ = 1.000, p < 0.01) with no significant association with soil phosphorus. This shift may reflect an adaptive response to changing hydrological conditions or indicate a medium switch in its dominant role in phosphorus cycling across different years.
(3) Phosphorus-insensitive group. Mucoromycota showed no significant correlations with any phosphorus forms in 2025 (|ρ| ≤ 0.400, p > 0.05), but exhibited moderate positive correlations with soil water TP/DP in 2024 (ρ = 0.800). This inter-annual instability suggests that its community dynamics may be driven by non-phosphorus factors such as carbon sources or pH, or that its response to phosphorus is threshold-dependent.
In summary, the modulating effects of irrigation strategies on the above functional modules exhibited significant inter-annual dependence and environmental condition specificity. Controlled irrigation consistently enhanced the “soil immobilization–water interception” pathway by stably enriching Basidiomycota over the two years, while its regulatory effect on Mortierellomycota underwent a functional shift depending on the hydrological year type: in 2024, its suppression as a soil phosphorus activator may have helped reduce endogenous phosphorus release, whereas in 2025, its shift to a surface water phosphorus responder weakened the specificity strength of the native fungal–phosphorus coupling in both years. This indicates that the microbial regulation of phosphorus cycling in the rice rhizosphere by irrigation modes is not a static linear process, but rather requires dynamic evaluation in conjunction with the hydrological and phosphorus input backgrounds of specific years.
4. Discussion
4.1. Stage-Specific Responses of the Rhizosphere Fungal Community Driven by Water Management
Two-year field observations confirmed that water management reshapes the rice rhizosphere fungal community through a process of “stage-specific filtering,” imposed by altering the physicochemical gradients of the rhizosphere microenvironment. During the tillering stage, the fungal community structures were highly similar across all treatments (Figure 1). This homogeneity is primarily attributed to the lower flux of root exudates and the underdeveloped rhizosphere effect in the early growth stage [23]; Furthermore, Brief flooding episodes are temporally insufficient to drive a sharp restructuring of dominant rhizosphere functional assemblages [24].However, as the growth stage progressed, the selective pressure from water management intensified, making the heading stage a critical turning point for community divergence. The PCA results from 2025 showed significant spatial separation between the CK treatment and the C, CDC-L, and CDC-H treatments, indicating that continuous flooding and alternating wet-dry conditions shape distinctly different fungal assembly patterns. Notably, the significantly reduced Shannon diversity in the CDC-H treatment during the 2024 heading stage (Table 4) was not a negative effect, but rather a typical outcome of environmental filtering: the pulsed input of exogenous tailwater provided abundant substrates, while intense redox fluctuations imposed strong selective pressure [25]. This led to the expansion of only a few tolerant functional groups (represented in this study by the Basidiomycota) to become dominant species, thereby reducing community evenness. This pattern of “environmental filtering driving community reorganization” aligns with observations in aridified wetlands, where microbial assembly shifts from neutral to partially deterministic processes with significantly enhanced heterogeneous selection [26]. By the milk-ripening stage, although the overall community tended toward homogenization, the CDC-H treatment maintained the highest OUT richness (Figure 2), suggesting that this mode is conducive to maintaining the functional redundancy of the rhizosphere ecosystem.
At the phylum level, the fungal community’s response to water management exhibited a pattern of “conservation and variability coexisting.” Ascomycota, a widespread group, maintained absolute dominance over the two years. However, its abundance was suppressed by controlled irrigation in the 2024 milk-ripening stage but generally increased in 2025. This interannual reversal may stem from differences in soil aeration caused by the spatiotemporal distribution of precipitation. In contrast, the response of Basidiomycota was more stable, with its abundance generally higher in the C, CDC-L, and CDC-H treatments than in CK. Given that Basidiomycota predominantly comprises lignin-degrading and saprotrophic fungi, its enrichment is usually associated with aerobic environments and accelerated organic matter turnover [27]. This indicates that the alternating wet-dry environment created by the tailwater recycling mode effectively suppressed strictly anaerobic groups and promoted the establishment of aerobic and facultative anaerobic fungi, laying the community foundation for subsequent phosphorus biological immobilization.
4.2. The Fungal-Mediated “Interception–Activation” Coupling Mechanism of Phosphorus
The core finding of this study is the revelation of the microbial mechanisms by which different functional fungal groups drive the bidirectional transformation of phosphorus within the “surface water-shallow soil water” system. Correlation analysis (Figure 4, Table 5) clarified the niche differentiation of two key fungal groups and their regulatory effects on phosphorus migration.
Basidiomycota is a key functional group for phosphorus retention in surface water. Data from this study showed a highly significant negative correlation between Basidiomycota abundance and surface water DP (ρ = −1.000, p < 0.01). We speculate that under controlled irrigation and tailwater recycling, Basidiomycota reduces phosphorus loss risk through two pathways: first, the physical entanglement of hyphal networks and bioflocculation [28]promote the aggregation and sedimentation of colloidal particles, thereby increasing the proportion of particulate phosphorus (PP%); second, the active uptake and assimilation of dissolved phosphorus by hyphae stores phosphorus in biomass as polyphosphate, achieving biological immobilization of phosphorus [30]. This antagonistic pattern of "increased soil retention and decreased water concentration" explains why the CDC-H treatment reduced the surface water phosphorus activation coefficient (AC) to 0.138, significantly mitigating the risk of runoff eutrophication.
Mortierellomycota is a potential driving force for the activation of the soil phosphorus pool, but its functional expression is regulated by hydrological year types. In 2024, Mortierellomycota showed a perfect positive correlation with shallow soil water TP and DP (ρ = 1.000, p < 0.01), indicating that the organic acids and phosphatases it secretes effectively dissolve insoluble soil phosphorus [30,31], thereby increasing the supply of phosphorus in the soil solution. However, in 2025, this phylum shifted to a specific response to surface water DP (ρ = 1.000, p < 0.01), decoupling from soil phosphorus. This interannual functional shift may originate from differences in moisture conditions: 2024 was relatively humid with long soil saturation periods, favoring the phosphorus-solubilizing function of Mortierellomycota within the soil matrix; in 2025, greater water fluctuations and alternating wet-dry cycles accelerated macropore flow, potentially leaching the phosphorus activated by Mortierellomycota into surface water or deep soil. This finding suggests that the role of Mortierellomycota in the phosphorus cycle is not merely that of a phosphate-solubilizing fungus, but rather it dynamically switches between "soil phosphorus activation" and "water phosphorus response" depending on hydrological conditions.
Furthermore, the significant negative correlation between Rozellomycota and soil water phosphorus suggests that it may serve as a potential responder to phosphorus environmental stress, although its specific physiological and ecological mechanisms require further study. Combined with the stable association between specific groups within Ascomycota and phosphorus availability, this study preliminarily proposes a conceptual framework for a phosphorus biological early-warning system based on key fungal groups (e.g., Basidiomycota, Mortierellomycota, and Rozellomycota), providing new insights for biological monitoring in paddy tailwater management.
4.3. Comparison with Existing Studies
The findings of this study regarding the coupling relationship between rice rhizosphere fungi and phosphorus under tailwater recycling in the Erhai Lake basin both confirm previous general principles on water management and microbial phosphorus cycling, and expand upon them with new insights specific to the agricultural settings of plateau lake regions.
First, regarding the reshaping effect of water management on the rhizosphere fungal community, our results are highly consistent with existing literature but reveal stronger stage-specificity. Alternating wet-dry environments can significantly alter soil fungal community structure and promote the enrichment of aerobic groups (such as Basidiomycota) [32]. The stable enrichment of Basidiomycota under controlled irrigation and tailwater recycling in this study (Figure 3) further validates this conclusion. However, unlike previous studies that mostly focused on a single growth stage or the average effect across the entire growth period, this study found that the selective pressure of water regulation exhibits significant stage-specific characteristics: community homogenization was high during the tillering stage, while the heading stage was the critical turning point for community divergence (Figure 1). This "stage-specific filtering" phenomenon may be related to the dynamic changes in rice root exudate flux [33]superimposed with the pulsed disturbance of tailwater input [34], providing new evidence for understanding the temporal dynamics of microbial assembly in agroecosystems.
Second, in terms of the functional mechanisms of rhizosphere fungi mediating phosphorus transformation, this study refined the niche differentiation of different phyla and supplemented the microbiological explanation for the "soil-water interface" bidirectional regulation. Previous studies have shown that arbuscular mycorrhizal fungi can activate insoluble soil phosphorus by secreting organic acids [16,17], and Mortierella also possesses the capacity to secrete various organic acids and phosphatases for phosphorus solubilization [30,31]. The highly significant positive correlation between Mortierellomycota and soil water TP/DP in 2024 (ρ = 1.000, p < 0.01) suggests that it may be involved in the activation of the soil phosphorus pool. Concurrently, saprotrophic fungi (mostly Basidiomycota) possess efficient biological immobilization capabilities [30]. This study found a perfect negative correlation between Basidiomycota and surface water DP (ρ = −1.000, p < 0.01), and the proportion of particulate phosphorus significantly increased under CDC-H treatment (Table 2). This not only supports the aforementioned theories but also demonstrates for the first time that in tailwater-recycled paddies, Basidiomycota primarily blocks phosphorus migration to water bodies through a dual pathway of "bioflocculation-promoted sedimentation" and "assimilation-immobilization"[28,29], achieving a transition from"qualitative description" to "quantification of interfacial processes."
Finally, regarding the environmental effects of the tailwater recycling mode, this study differs from traditional water-saving irrigation research by emphasizing the synergistic adaptation mechanism between exogenous nutrient input and the indigenous microbial community. Traditional controlled irrigation studies have mostly focused on the physicochemical processes of water-saving and emission-reduction [3,4,18], often overlooking the "pulsed replenishment" effect of suspended particles and organic substrates carried by exogenous tailwater on the rhizosphere micro-ecosystem. This study found that although the CDC-H treatment introduced an exogenous phosphorus load, fungal OTU richness in the tillering stage increased by 14.2%–23.8% compared to CK (Figure 2), and did not lead to an increased risk of phosphorus loss in the later growth stages. This indicates that the paddy rhizosphere microbial community possesses a strong buffering and transforming capacity against exogenous nutrient inputs. Existing research indicates that rice rhizosphere microbes are the engine driving soil carbon, nitrogen, and phosphorus cycles, and their processes are significantly regulated by exogenous organic matter inputs (such as straw incorporation and organic fertilizers) and soil phosphorus content [35]; rhizosphere phosphorus-solubilizing microorganisms (including fungal groups like Aspergillus) can promote soil phosphorus dissolution and improve phosphorus availability [35], which aligns with the regulatory effects of Mortierellomycota and Basidiomycota on phosphorus transformation observed in this study. It also verifies the biological basis of paddies serving as "constructed wetlands" for tailwater purification. Compared to the potential exacerbation of soil phosphorus fixation caused by simple controlled irrigation [36], the CDC-H mode achieves multi-objective synergy of "water resource utilization-phosphorus retention-soil fertility maintenance" by maintaining the functional complementarity of Mortierellomycota and Basidiomycota, representing an important supplement to the theory of agricultural non-point source pollution prevention and control in plateau lake basins.
5. Conclusions
Controlled irrigation creates a wet–dry alternation rhizosphere environment, which screens out fungal groups adapted to fluctuating conditions and capable of phosphorus immobilization (e.g., Basidiomycota), while suppressing groups adapted to stable flooding and associated with phosphorus activation (e.g., Mortierellomycota). This shifts the phosphorus migration process from a purely passive physical adsorption and precipitation process to an active microbial regulation process that directs the cultivation of specific functional fungal groups through water management, thereby achieving a dual mechanism of "water interception and soil activation." Consequently, it reshapes the microbially driven process of phosphorus migration and transformation and reduces the risk of phosphorus loss.
The high water layer tailwater recharge (CDC-H) mode breaks the traditional stable flooding environment to create a wet–dry alternation rhizosphere environment, directionally screening out fluctuation-tolerant groups such as Basidiomycota and Mortierellomycota. This drives the evolution of the rhizosphere fungal community from a "flooding-type" to a "wet–dry alternation-type," thereby restructuring the rhizosphere fungal community. This achieves the simultaneous utilization of tailwater resources and significant reduction in phosphorus concentrations in surface runoff and shallow soil water, representing the optimal mode that balances tailwater resource utilization and non-point source pollution prevention and control.
Author Contributions
Conceptualization:J.L.,N.H. and S.Q.; methodology:J.L.,N.H. and S.Q.; formal analysis:J.L.; investigation:J.L.,N.H. and S.Q.; resources:Y.W. and L.C.; data curation:J.L.,N.H. and S.Q.; writing—original draft preparation:J.L.; writing—review and editing :Z.L.,N.H.,S.Q.,Y.S.,Z.Z.,Y.W. and L.C.;supervision :Y.W. and L.C.;funding acquisition:Y.W. and L.C.; All authors have read and agreed to the published version of the manuscript.
Funding
Yunnan Provincial Agricultural Joint Fund (202401BD070001-062); Xingdian Talent Support Program (XDYC-QNRC-2022-0107); Special Project for Building a Science and Technology Innovation Center Facing South Asia and Southeast Asia, "Yunnan Provincial Smart Environment International Joint Research and Development Center" (202303AP140013).
Data Availability Statement
Data will be made available on request.
Acknowledgments
We would like to thank all the members who participated in this experiment,and we appreciate the resources provided by our teachers.
Conflicts of Interest
The authors declare on conflicts of interest.
References
- Xiang, S.; Wu, Y.; Lyu, X.J.; Gao, S.J.; Chu, Z.S.; Pang, Y. Spatial Distribution Characteristics and Classified Control Strategies of Agricultural Non-Point Source Pollution in Erhai Lake Basin. Res. Environ. Sci. (In Chinese) 2020, 33, 2474–2483. [Google Scholar]
- Zou, T.T.; Meng, F.L.; Zhou, J.C.; Ying, H.; Liu, X.J.; Hou, Y.; Zhao, Z.X.; Zhang, F.S.; Xu, W. Quantifying nitrogen and phosphorus losses from crop and livestock production and mitigation potentials in Erhai Lake Basin, China. Agric. Syst. 2023, 204, 103550. [Google Scholar] [CrossRef]
- Shao, D.G.; Qiao, X.; Liu, H.H.; Chai, M.Z.; Wang, J.Z. Water and Fertilizer Loss Patterns under Different Irrigation and Drainage Regulation Modes. Eng. J. Wuhan Univ. (In Chinese) 2010, 43, 409–413+418. [Google Scholar]
- Liu, L.H.; Liu, S.R.; Wang, G.S.; Ju, X.T. Effects of Different Water and Fertilizer Management Practices on Nitrogen and Phosphorus Losses in Tropical Paddy Fields. J. Agro-Environ. Sci. (In Chinese) 2025, 44, 2605–2616. [Google Scholar]
- Peng, X.L.; Dong, Q.; Zhang, C.; Li, P.F.; Li, B.L.; Liu, Z.L.; Yu, C.L. Effects of Straw Returning Amounts on Soil Reducing Substances and Rice Growth under Different Soil Conditions. Chin. J. Rice Sci. (In Chinese) 2024, 38, 198–210. [Google Scholar]
- Xu, Y.F. Study on the Impact of Agricultural Non-Point Source Pollution on Watershed Water Quality and Countermeasures for Water Resource Protection. J. Agric. Disaster Res. (In Chinese) 2025, 15, 154–156. [Google Scholar]
- Hu, X.F.; Wang, W.; Zeng, Y.L.; Ju, Y.Y.; Hou, M.M.; Zhai, Y.M. Study on Efficient Utilization of Water Resources in Paddy Fields in Eastern China: Based on Different Water-Saving Irrigation Modes. China Resour. Compr. Util. (In Chinese) 2022, 40, 76–80. [Google Scholar]
- Tao, L.; Peng, G.G.; Chen, S.Y.; Hao, L.L.; Dai, L.L.; Peng, L.; Li, G. Effectiveness of Paddy Field Wetland in Recycling Pond Aquaculture Tailwater. Acta Hydrobiol. Sin. (In Chinese) 2022, 46, 1466–1474. [Google Scholar]
- Mowjood, M.I.M.; Jinadasa, K.B.S.N.; Basnayake, B.F.A. Paddy Field and Constructed Wetland: The Equivalencies. In Agricultural Research for Sustainable Food Systems in Sri Lanka; Springer: Singapore, 2020; pp. 199–212. [Google Scholar]
- Yang, X.; Huang, X.T.; Wang, C.; Wang, X.T.; Yin, X.L.; Lin, S.Y.; Wang, W.Q. Comparison of Fungal Community Structure and Diversity in Typical Paddy Soils. China Environ. Sci. (In Chinese) 2020, 40, 4549–4556. [Google Scholar]
- Chen, S.Y.; Tao, L.; Peng, L.; Dai, L.L.; Peng, G.G.; Hao, L.L.; Li, G.; Zhang, H. Synergistic Purification Effect of Paddy Field–Ditch System on Pond Aquaculture Tailwater. Freshw. Fish. (In Chinese) 2024, 54, 85–96. [Google Scholar]
- Zhang, Y.Y.; Wang, Y.; Niu, C.H.; Jiang, Z.H.; Guo, W.J.; Liu, H.Q.; Zhang, Z.Y. Purification Efficiency and Configuration Scale Analysis of Ecological Ditch-Pond System for Paddy Field Drainage Pollutants. J. Environ. Eng. Technol. (In Chinese) 2025, 15, 1646–1654. [Google Scholar]
- Luo, X.; Zhang, H.Y.; Liu, M.Y.; Shao, B. Research Progress on Microbial Community Diversity in Paddy Soils. Anhui Agric. Sci. (In Chinese) 2018, 46, 42–43, 47. [Google Scholar]
- Gong, J.; Zhang, X.L. Contribution and Driving Mechanisms of Microorganisms in Coastal Nitrogen Cycling Processes. Microbiol. China (In Chinese) 2013, 40, 44–58. [Google Scholar]
- Xue, Y.L.; Li, C.Y.; Wang, C.R.; Wang, Y.; Liu, J.; Chang, S.; Miao, Y.; Dang, T.H. Mechanisms of Arbuscular Mycorrhizal Fungi in Promoting Plant Phosphorus Uptake from Soil. J. Soil Water Conserv. (In Chinese) 2019, 33, 10–20. [Google Scholar]
- Ji, B.; Cheng, H.G.; Han, S.M.; Xing, D.; Wu, Z.B.; Zhang, J.L.; Liu, F.; Zhu, Y.; Deng, L.R.; Zhang, X.S. Research Progress on the Effects of Biochar and Arbuscular Mycorrhizal Fungi on Soil Phosphorus Supply. Ecol. Environ. Sci. (In Chinese) 2025, 34, 1812–1826. [Google Scholar]
- Pang, Z.; Wang, Q.L. Effects of Different Irrigation Amounts on Soil Physicochemical Properties and Rice Growth. J. Irrig. Drain. (In Chinese) 2019, 38(S2), 37–41. [Google Scholar]
- Tian, C.; Yu, Y.J.; Wu, L.L.; Zhang, L.; Huang, J.; Zhu, L.F.; Zhang, J.H.; Zhu, C.Q.; Kong, Y.L.; Wu, M.Y.; Cao, X.C.; Jin, Q.Y. Effects of Different Irrigation and Fertilization Modes on Phosphorus Transformation and Availability in Paddy Soil. Trans. Chin. Soc. Agric. Eng. (In Chinese) 2021, 37, 112–122. [Google Scholar]
- Gao, X.Y.; Li, D.D.; Li, Z.X.; Li, J.H.; Cai, Z.J.; Xu, M.G. Diversity Differences and Community Reconstruction of Bacteria and Fungi Under Soil Acidification Stress. Environ. Sci. (In Chinese) 2026, 47, 2701–2712. [Google Scholar] [CrossRef] [PubMed]
- Tsiafouli, M.A.; Thébault, E.; Sgardelis, S.P.; de Vries, F.T.; van der Putten, W.H.; Birkhofer, K.; Hemerik, L.; de Ruiter, P.C.; Schouten, A.J.; Wolters, V.; Bardgett, R.D.; Hedlund, K. Intensive agriculture reduces soil biodiversity across Europe. Glob. Change Biol. 2015, 21, 973–985. [Google Scholar] [CrossRef] [PubMed]
- Lin, Y.B.; Yu, L.F.; Li, G.Y. Effects of Different Irrigation Methods on Soil Fungal Communities in Cultivated Land. Environ. Sci. Technol. 2025, 48, 1–12. [Google Scholar]
- State Environmental Protection Administration of China. Water and Wastewater Monitoring and Analysis Methods, 4th ed.; China, State Environmental Protection Administration of, Ed.; China Environmental Science Press: Beijing, China, 2002; pp. 243–248. [Google Scholar]
- Zhang, Y.; Li, J.; Zhang, W. Research Progress on Rice Root Exudates. J. Plant Nutr. Fert. (In Chinese) 2024, 30, 1987–1999. [Google Scholar]
- Wu, N.; Shao, J.W.; Sheng, R.; Tang, Y.F.; Zhang, W.Z.; Wei, W.X. Variation of Community Structure and Function of Rhizospheric Denitrifiers at Tillering and Booting Stages of Rice. Chin. J. Appl. Ecol. (In Chinese) 2019, 30, 1344–1350. [Google Scholar]
- Kögel-Knabner, I.; Amelung, W.; Cao, Z.H.; Fiedler, S.; Frenzel, P.; Jahn, R.; Kalbitz, K.; Kölbl, A.; Schloter, M. Biogeochemistry of Paddy Soils. Geoderma 2010, 157, 1–14. [Google Scholar] [CrossRef]
- Kang, D.; Chen, Y.Y.; Feng, S.S.; Liu, Q.M.; Zou, S.Z. Microbial Community Diversity and Assembly Processes in the Aridification of Wetlands on the Qinghai-Tibet Plateau. iScience 2025, 28, 112494. [Google Scholar] [CrossRef] [PubMed]
- Valášková, V.; Šnajdr, J.; Bittner, B.; Cajthaml, T.; Merhautová, V.; Hofrichter, M.; Baldrian, P. Production of lignocellulose-degrading enzymes and degradation of leaf litter by saprotrophic basidiomycetes isolated from a Quercus petraea forest. Soil Biol. Biochem. 2007, 39, 2651–2660. [Google Scholar] [CrossRef]
- Wells, J.M.; Harris, M.J.; Boddy, L. Temporary Phosphorus Partitioning in Mycelial Systems of the Cord-Forming Basidiomycete Phanerochaete velutina. New Phytol. 1998, 138, 469–481. [Google Scholar] [CrossRef] [PubMed]
- Chiu, C.H.; Paszkowski, U. Mechanisms and Impact of Symbiotic Phosphate Acquisition. Cold Spring Harb. Perspect. Biol. 2019, 11, a034603. [Google Scholar] [CrossRef] [PubMed]
- Ye, T.E.; Lin, M.F.; Yu, C.F.; Xiao, Y.J.; Cheng, L.W.; Zheng, Y.; Wang, W.Q. Diversity and Functional Characteristics of Fungal Communities and Influencing Factors in Typical Paddy Fields of China. Environ. Sci. 2024, 45, 6068–6076. [Google Scholar] [CrossRef] [PubMed]
- Sang, Y.; Jin, L.; Zhu, R.; Yu, X.-Y.; Hu, S.; Wang, B.-T.; Ruan, H.-H.; Jin, F.-J.; Lee, H.-G. Phosphorus-Solubilizing Capacity of Mortierella Species Isolated from Rhizosphere Soil of a Poplar Plantation. Microorganisms 2022, 10, 2361. [Google Scholar] [CrossRef] [PubMed]
- Zhu, K.; Jia, W.; Mei, Y.; Wu, S.; Huang, P. Shift from Flooding to Drying Enhances the Respiration of Soil Aggregates by Changing Microbial Community Composition and Keystone Taxa. Front. Microbiol. 2023, 14, 1167353. [Google Scholar] [CrossRef] [PubMed]
- Yuan, H.; Zhu, Z.; Liu, S.; Ge, T.; Jing, H.; Li, B.; Liu, Q.; Lynn, T.M.; Wu, J.; Kuzyakov, Y. Microbial Utilization of Rice Root Exudates: 13C Labeling and PLFA Composition. Biol. Fertil. Soils 2016, 52, 615–627. [Google Scholar] [CrossRef]
- Song, K.; Lee, S.-H.; Mitsch, W.J.; Kang, H. Different Responses of Denitrification Rates and Denitrifying Bacterial Communities to Hydrologic Pulsing in Created Wetlands. Soil Biol. Biochem. 2010, 42, 1721–1727. [Google Scholar] [CrossRef]
- Yin, D.; Zhu, Y.W.; Hu, M.; Xu, L.; Yu, H.Y. Rice Rhizosphere Microbiomes and Their Driving Cycling of Soil Carbon, Nitrogen, and Phosphorus. J. Plant Nutr. Fertil. 2024, 30, 2207–2220. [Google Scholar]
- Kong, F.; Zhang, X.; Zhu, Y.; Yang, H.; Li, F. Alternate Wetting and Drying Irrigation Reduces P Availability in Paddy Soil Irrespective of Straw Incorporation. Agronomy 2022, 12, 1718. [Google Scholar] [CrossRef]
Figure 1.
Principal Component Analysis (PCA) plots for 2024 and 2025.
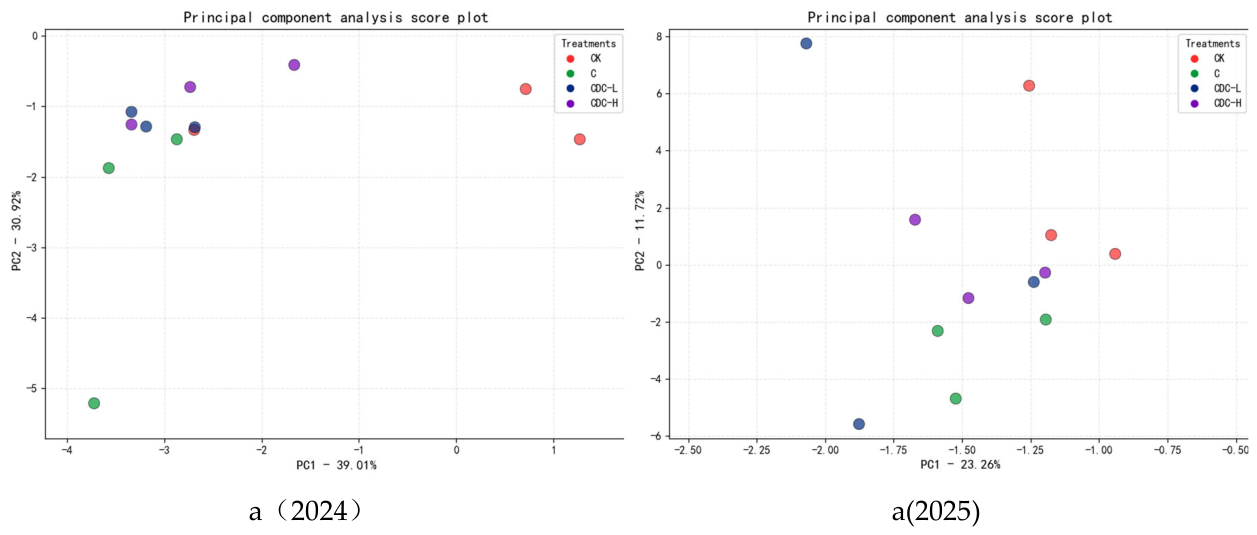
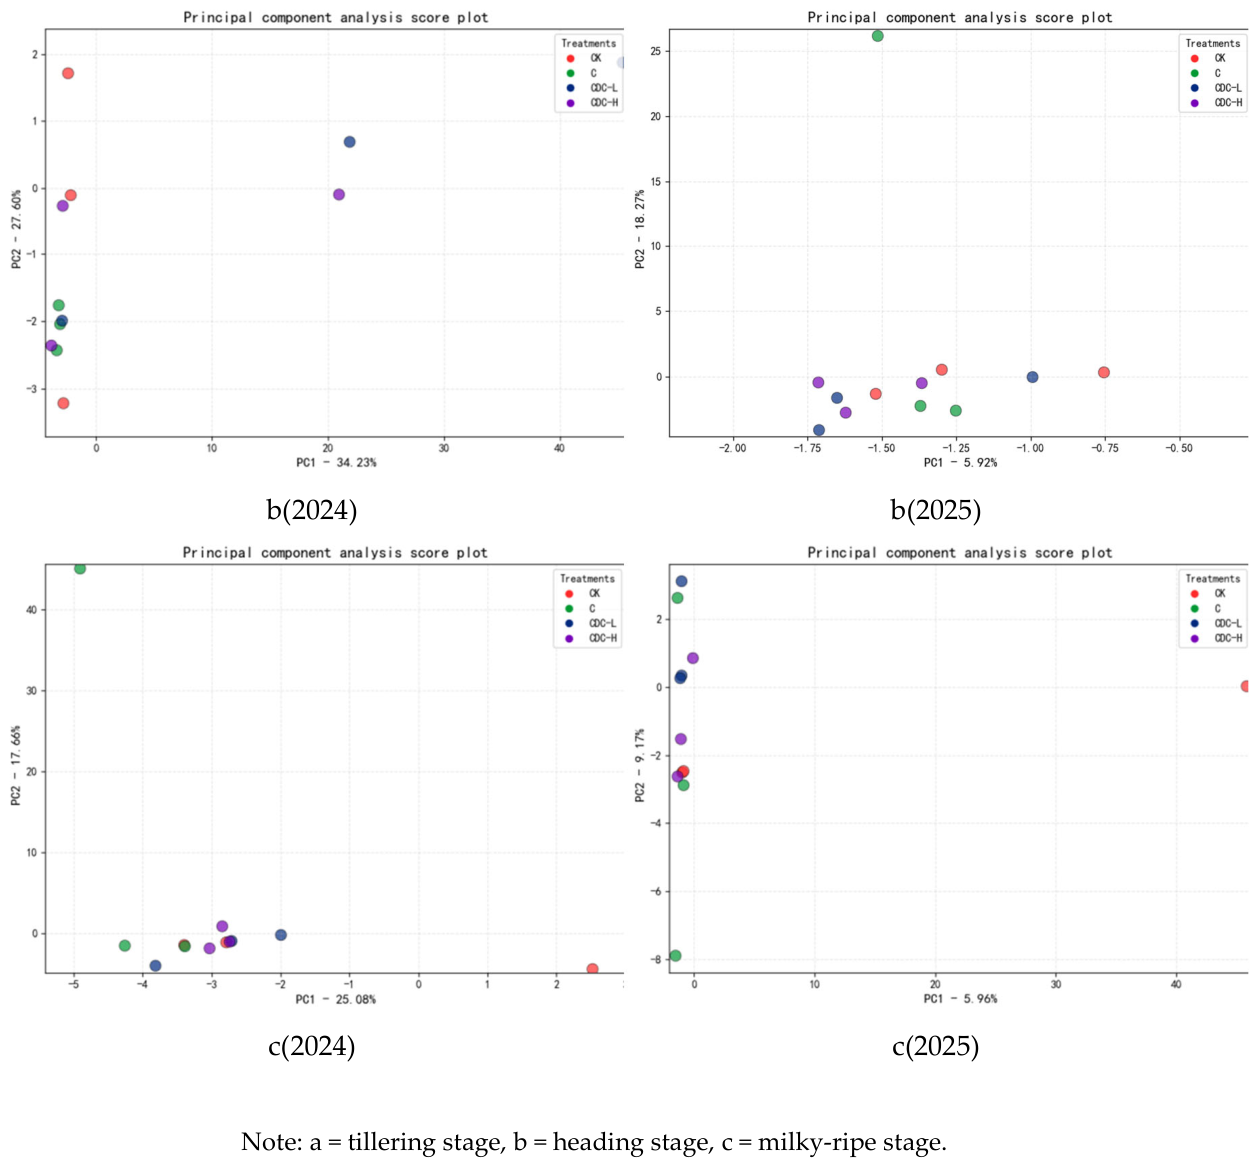
Figure 2.
Venn diagram of soil fungal communities under different treatment methods at different periods.
Figure 2.
Venn diagram of soil fungal communities under different treatment methods at different periods.
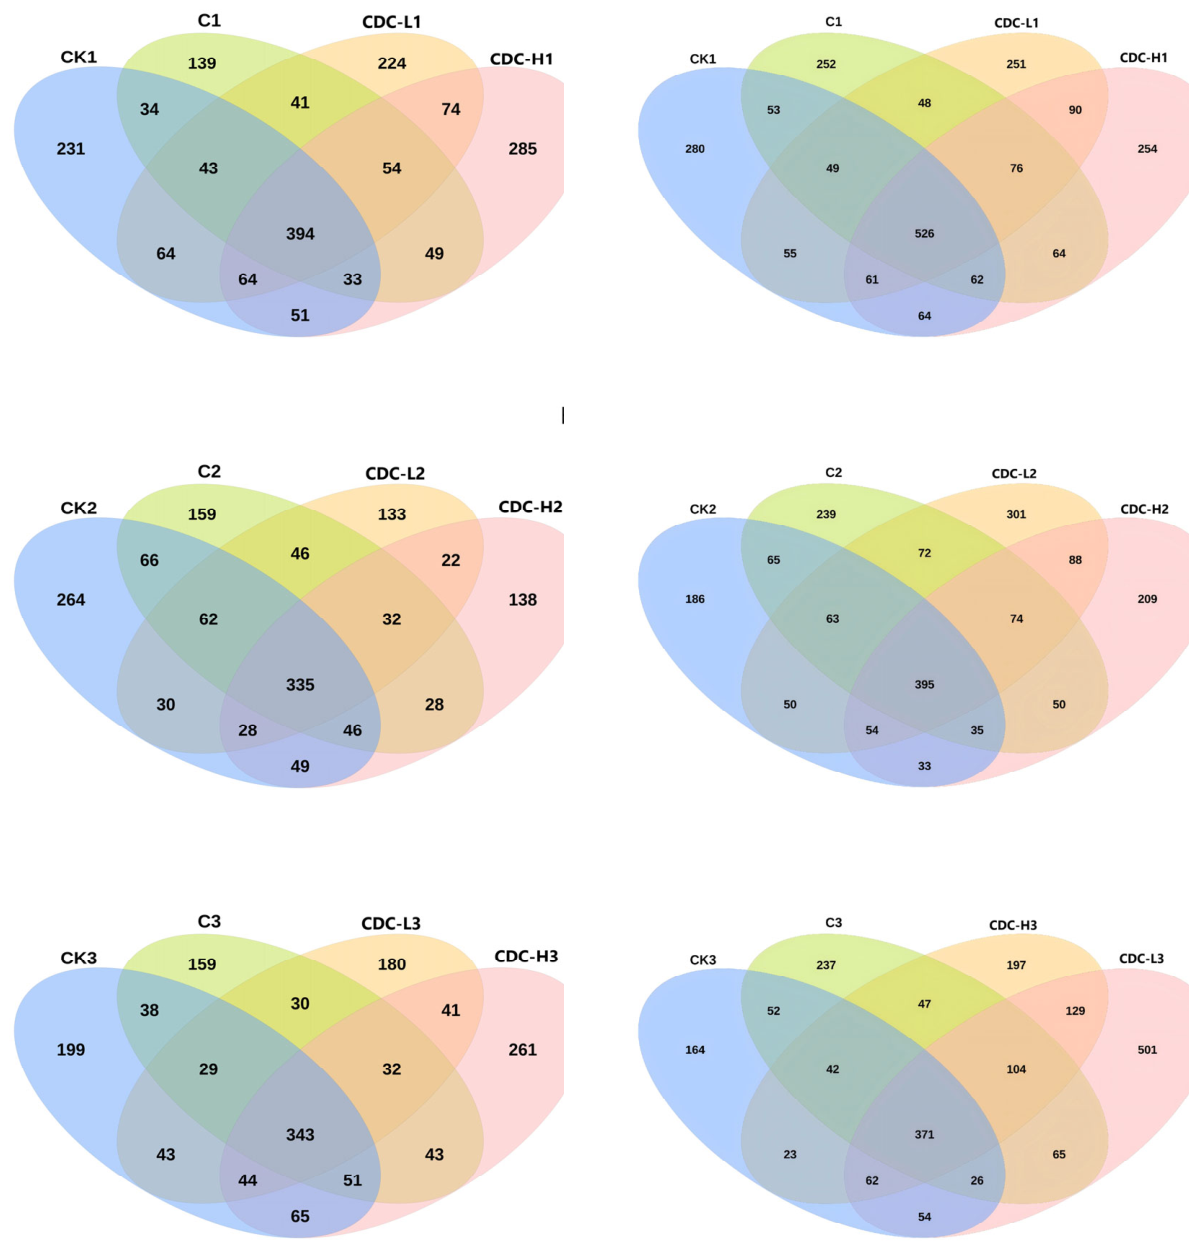
Figure 3.
Phylum-level Community Composition of Soil Fungi Under Different Treatments Across Various Growth Stages.
Figure 3.
Phylum-level Community Composition of Soil Fungi Under Different Treatments Across Various Growth Stages.
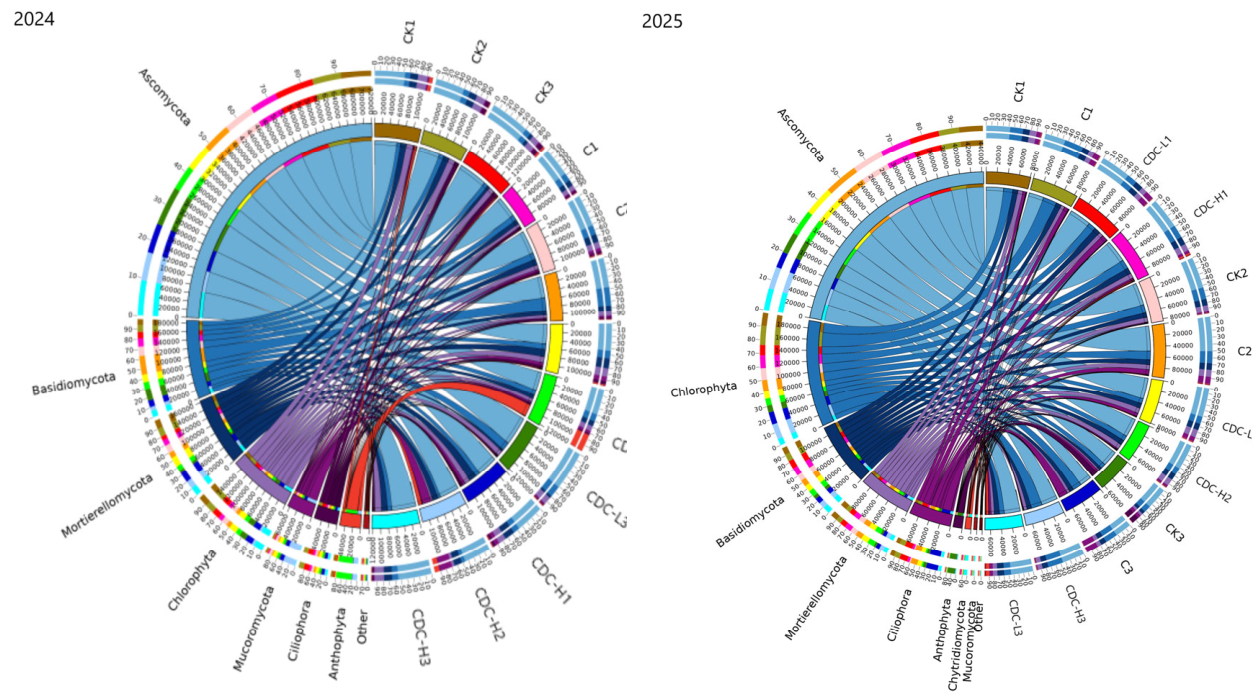
Figure 4.
Spearman correlation heatmap between dominant fungal phyla and phosphorus concentrations.
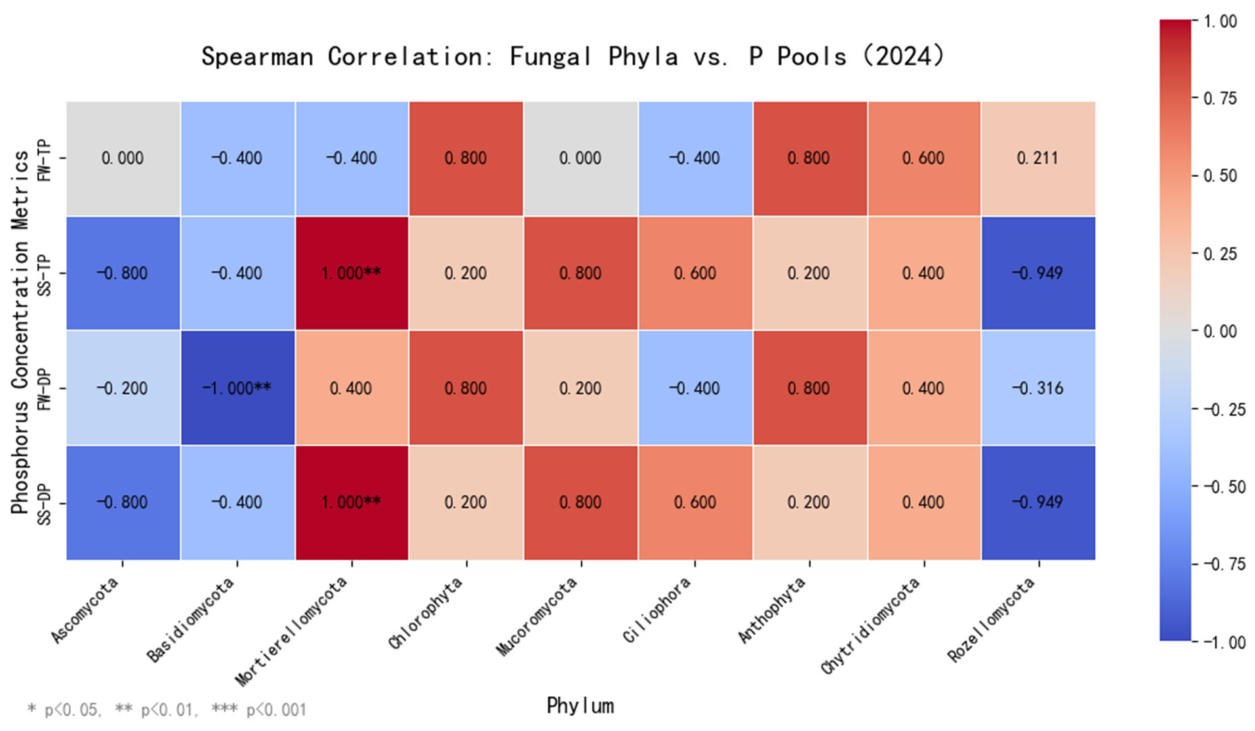
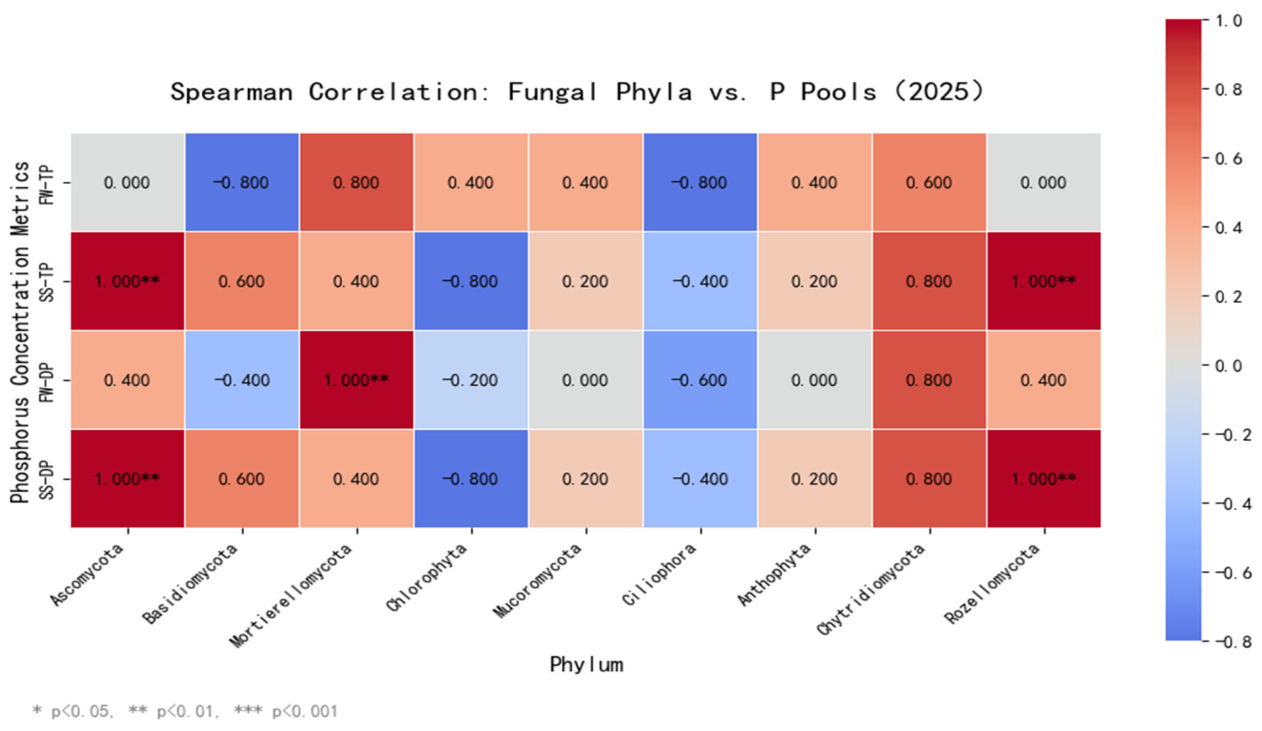
Table 1.
Control Standards of Paddy Field Water Layer Under Different Irrigation Modes.
| Treatment | Depth of Water(mm) | Recovery Stage | Pre- Tillering Stage |
Mid- Tillering Stage |
Post-Tillering Stage | Panicle Initiation Stage | Heading and Flowering Stage | Milk-Ripe Stage | Ripening Stage |
|---|---|---|---|---|---|---|---|---|---|
| CK | Upper irrigation limit | 25 | 50 | 50 | 50 | 50 | 50 | 50 | Natural drying |
| Lower irrigation limit | 5 | 100%θs | 100%θs | 100%θs | 100%θs | 100%θs | 100%θs | ||
| Water storage depth | 25 | 50 | 50 | 50 | 50 | 50 | 50 | ||
| C | Upper irrigation limit | 25 | 100%θs | 100%θs | 100%θs | 100%θs | 100%θs | 100%θs | |
| Lower irrigation limit | 5 | 80%θs | 70%θs | 65%θs | 80%θs | 85%θs | 75%θs | ||
| Water storage depth | 25 | 50 | 50 | 50 | 50 | 50 | 50 | ||
| CDC-L | Upper irrigation limit | 25 | 50 | 50 | 50 | 50 | 50 | 50 | |
| Lower irrigation limit | 5 | 100%θs | 100%θs | 100%θs | 100%θs | 100%θs | 100%θs | ||
| Water storage depth | 25 | 1/4H | 1/4H | 50 | 1/4H | 1/4H | 1/4H | ||
| CDC-H | Upper irrigation limit | 25 | 100%θs | 100%θs | 100%θs | 100%θs | 100%θs | 100%θs | |
| Lower irrigation limit | 5 | 80%θs | 70%θs | 65%θs | 80%θs | 85%θs | 75%θs | ||
| Water storage depth | 25 | 1/3H | 1/3H | 50 | 1/3H | 1/3H | 1/3H | ||
| Root zone observation depth(CM) | 0–20 | 0–20 | 0–20 | 0–30 | 0–40 | 0–40 | |||
Notes: ① "θs" indicates the saturated soil moisture content. ② H stands for rice plant height (mm). 1/4H and 1/3H indicate that when drainage occurs from upstream drylands, tailwater is recharged into the paddy field, with irrigation depths equal to 1/4 and 1/3 of the rice plant height (H), respectively.
Table 4.
The Alpha diversities of soil aquatic fungal communities among different treatments.
| 2024 | |||||||
| stage | Treatment | Shannon | Simpson | ACE | Chao1 | Coverage | PD |
| Tillering Stage | CK | 6.283 ± 0.179a | 0.966 ± 0.005a | 726.653 ± 53.722a | 745.749 ± 59.381a | 0.999 ± 0 | 178.054 ± 24.070ab |
| C | 5.851 ± 0.296a | 0.951 ± 0.019a | 690.812 ± 70.446a | 687.538 ± 76.361a | 0.999 ± 0 | 149.607 ± 28.164b | |
| CDC-L | 6.106 ± 0.541a | 0.964 ± 0.012a | 802.442 ± 45.307a | 815.395 ± 61.427a | 0.999 ± 0 | 186.456 ± 20.012ab | |
| CDC-H | 5.931 ± 0.793a | 0.953 ± 0.033a | 773.775 ± 31.796a | 777.455 ± 60.736a | 0.999 ± 0 | 206.799 ± 31.902a | |
| Heading and Flowering Stage | CK | 6.197 ± 0.427a | 0.962 ± 0.015a | 752.517 ± 37.859a | 759.292 ± 28.937a | 0.999 ± 0 | 175.188 ± 21.224a |
| C | 5.887 ± 0.149a | 0.956 ± 0.005a | 696.931 ± 12.572ab | 697.582 ± 17.952ab | 0.999 ± 0 | 166.754 ± 23.530a | |
| CDC-L | 5.177 ± 0.913ab | 0.880 ± 0.104a | 645.385 ± 26.581b | 658.151 ± 17.391b | 0.999 ± 0 | 148.159 ± 16.271a | |
| CDC-H | 4.684 ± 0.781b | 0.908 ± 0.014a | 686.981 ± 66.548ab | 693.841 ± 64.597ab | 0.999 ± 0 | 157.819 ± 11.050a | |
| Milk- Ripestage |
CK | 5.905 ± 0.512a | 0.952 ± 0.022a | 663.514 ± 104.397a | 670.797 ± 101.767a | 0.999 ± 0 | 164.561 ± 29.334a |
| C | 5.089 ± 1.02a | 0.893 ± 0.098a | 652.969 ± 156.121a | 656.062 ± 163.026a | 0.999 ± 0 | 153.410 ± 32.859a | |
| CDC-L | 5.774 ± 0.429a | 0.946 ± 0.019a | 604.912 ± 117.319a | 619.392 ± 109.507a | 0.999 ± 0 | 142.946 ± 21.094a | |
| CDC-H | 5.972 ± 0.511a | 0.953 ± 0.023a | 695.110 ± 103.488a | 706.495 ± 102.630a | 0.999 ± 0 | 171.582 ± 30.893a | |
| 2025 | |||||||
| stage | Treatment | Shannon | Simpson | ACE | Chao1 | Coverage | PD |
| Tillering Stage | CK | 6.832 ± 0.244a | 0.974 ± 0.004a | 1000.746 ± 42.134a | 991.292 ± 35.323a | 0.998 ± 0 | 247.068 ± 3.016a |
| C | 6.775 ± 0.278a | 0.975 ± 0.005a | 968.305 ± 90.007a | 962.726 ± 101.730a | 0.999 ± 0 | 245.046 ± 23.555a | |
| CDC-L | 6.384 ± 0.434a | 0.960 ± 0.012a | 1071.695 ± 37.918a | 1072.926 ± 54.805a | 0.998 ± 0 | 260.823 ± 4.885a | |
| CDC-H | 6.784 ± 0.272a | 0.975 ± 0.007a | 1072.354 ± 68.848a | 1058.690 ± 83.641a | 0.998 ± 0 | 266.146 ± 24.423a | |
| Heading and Flowering Stage | CK | 6.571 ± 0.324a | 0.971 ± 0.131a | 843.243 ± 4.906b | 824.728 ± 21.976b | 0.998 ± 0 | 210.242 ± 13.285c |
| C | 6.233 ± 0.913a | 0.952 ± 0.044a | 943.356 ± 45.045a | 930.936 ± 43.997a | 0.999 ± 0 | 243.482 ± 17.589ab | |
| CDC-L | 6.294 ± 0.158a | 0.962 ± 0.008a | 958.554 ± 44.630a | 965.572 ± 57.854a | 0.998 ± 0 | 250.990 ± 21.307a | |
| CDC-H | 6.605 ± 0.176a | 0.974 ± 0.004a | 839.820 ± 16.028b | 833.492 ± 26.493b | 0.998 ± 0 | 217.622 ± 11.815bc | |
| Milk- Ripestage |
CK | 5.748 ± 0.959a | 0.905 ± 0.111a | 772.142 ± 36.000b | 750.704 ± 37.679b | 0.998 ± 0 | 195.392 ± 8.647a |
| C | 6.088 ± 0.443a | 0.957 ± 0.014a | 818.569 ± 76.430b | 811.974 ± 80.178b | 0.998 ± 0 | 215.823 ± 14.802a | |
| CDC-L | 6.627 ± 0.374a | 0.974 ± 0.006a | 1074.246 ± 177.676a | 1056.079 ± 204.599a | 0.998 ± 0 | 246.818 ± 44.449a | |
| CDC-H | 6.423 ± 0.600a | 0.952 ± 0.042a | 886.468 ± 68.230ab | 858.253 ± 82.384a | 0.998 ± 0 | 227.198 ± 21.781a | |
Note: Different lowercase letters in the same column indicate significant differences (p < 0.05).
Table 5.
Correlation Coefficients Between Fungal Alpha Diversity Indices and Soil Water- phosphorus Concentrations at Different Growth Stages.
Table 5.
Correlation Coefficients Between Fungal Alpha Diversity Indices and Soil Water- phosphorus Concentrations at Different Growth Stages.
| Pearson Analysis (2024) | |||||
|---|---|---|---|---|---|
| Shannon | Simpson | ACE | Chao1 | PD | |
| Floodwater TP | 0.852 | 0.709 | −0.275 | −0.113 | −0.073 |
| Shallow soil water TP | 0.460 | 0.386 | 0.711 | 0.754 | 0.955* |
| Floodwater DP | 0.853 | 0.699 | −0.233 | −0.073 | 0.006 |
| Shallow soil water DP | 0.279 | 0.260 | 0.845 | 0.849 | 0.994** |
| Pearson Analysis (2025) | |||||
| Shannon | Simpson | ACE | Chao1 | PD | |
| Floodwater TP | 0.527 | 0.380 | −0.250 | −0.299 | −0.366 |
| Shallow soil water TP | −0.094 | −0.136 | 0.879 | 0.816 | 0.912 |
| Floodwater DP | 0.320 | 0.158 | 0.111 | 0.060 | −0.027 |
| Shallow soil water DP | −0.212 | −0.226 | 0.921 | 0.870 | 0.971* |
Note:*p < 0.05 **p < 0.01.
Disclaimer/Publisher’s Note: The statements, opinions and data contained in all publications are solely those of the individual author(s) and contributor(s) and not of MDPI and/or the editor(s). MDPI and/or the editor(s) disclaim responsibility for any injury to people or property resulting from any ideas, methods, instructions or products referred to in the content. |
© 2026 by the authors. Licensee MDPI, Basel, Switzerland. This article is an open access article distributed under the terms and conditions of the Creative Commons Attribution (CC BY) license (http://creativecommons.org/licenses/by/4.0/).
Copyright: This open access article is published under a Creative Commons CC BY 4.0 license, which permit the free download, distribution, and reuse, provided that the author and preprint are cited in any reuse.