

Submitted:
30 August 2026
Posted:
31 August 2026
You are already at the latest version
Abstract
We developed a 7-item measure of sense of humor by extracting items from McGhee’s 24-item Sense of Humor Scale (McGhee, 1999). Internal reliability, item discrimination and item difficulty, and construct validity of the brief measure were examined. Participants were 1,031 undergraduates. Criterion variables were Big Five personality, personality dysfunction, depression, anxiety, hostility, and life satisfaction. Overall, our short humor measure showed acceptable psychometric properties and a pattern of validity coefficients suggesting that the humor measure is associated with healthy personality and life satisfaction, but uncorrelated with measures of emotional disturbance. We propose that our short humor measure is useful for decreasing participant burden during long surveys, progress monitoring in humor intervention studies, and when researchers want to include humor as a covariate in data analyses.
Keywords:
humor
; sense of humor
; scale development
; personality
; life satisfaction
; depression
; anxiety
; hostility
; personality dysfunction
1. Introduction
Psychological research on humor has increasingly attracted attention as researchers explore its psychological and health benefits (Martin et al., 2003; Martin & Ford, 2018; Ruch & Hoffman, 2017; Svebak, 2010). Humor interventions have been developed and tested to ascertain the degree to which humor can be increased through training (McGhee, 2010; Ruch, Hofmann, Rusch, & Stoltz, 2018). Research on any psychological construct requires that it be measured reliably and that the validation data are consistent with its evolving nomological network. In the case of humor, several measures already exist (e.g., Martin et al., 2003; Martin & Lefcourt, 1983; Svebak, 1996; Thorson & Powell, 1993). One of those existing measures is the Sense of Humor Scale (SHS; McGhee, 1999), an abbreviation of which is the focus of this study.
Early versions of the SHS (ranging in length from 24 to 48 items) have been the focus of several research studies demonstrating its reliability, and construct validation studies have obtained consistent patterns of association with personality, emotional disturbance, and life satisfaction (Heintz et al., 2022; Lydon & McDermut, 2021; Proyer et al., 2010; Ruch & Heintz, 2018). These studies have typically found that the SHS has good reliability and correlates with personality and life satisfaction as predicted.
McGhee’s SHS is the companion assessment method for McGhee’s (2010) 7 Humor Habits Program, and measures facets of humor as conceptualized by McGhee (1999). McGhee conceptualizes humor as multi-faceted and composed of playfulness, positive mood, and the six humor skills: Enjoyment of Humor, Laughter, Verbal Humor, Humor in Everyday Life, Laughing at Yourself, and Humor Under Stress.
The purpose of the present study is to describe the development and preliminary psychometric investigation of a seven-item version of McGhee’s SHS. Our resulting scale includes items corresponding to the six humor habits targeted by McGhee’s humor intervention program. We believe there is a need for short measures of humor for three reasons. First, shorter measures will decrease participant burden and increase motivation to complete surveys, especially in research studies that utilize many lengthy or tedious self-administered questionnaires (Svebak, 1996, 2010). Second humor intervention studies that have regular, recurring humor assessments could streamline the assessment process by using short humor measures. We propose that short measures supplement rather than replace longer versions. For example, longer versions of the assessment could be used at pre-test, post-test, and follow-up, while a short version could be administered for recurring weekly assessments. Lastly, we suggest that short humor measures could be used for statistical analyses when the researchers want to control for humor. Researchers have noted theoretical reasons to control for humor under certain conditions (Heintz et al., 2020).
1.1. Research Aims
The aims of this paper are to examine the psychometric properties of the seven-item SHS which we developed and tested to ensure its adequacy for use in future humor research.
Research Aim 1. Create a short version of the SHS containing content aligned with the six humor skills measured by parent versions of the SHS that are targets of McGhee’s humor intervention (2010).
Research Aim 2. Evaluate the scale’s reliability and internal consistency.
Research Aim 3. Examine the pattern of associations with dimensions of personality, emotional disturbance, and life satisfaction. Based on prior empirical research we anticipated that the scale would be positively correlated with the Big Five traits of extraversion and openness to experience (e.g., Lydon & McDermut, 2021; Martin et al. 2003). Past research shows significant associations with depression, anxiety, and anger; these associations are strongest in the case of positive associations with aggressive and self-defeating humor and negative associations with coping humor (Cann & Collette, 2014; Martin et al. 2003; Martin & Lefcourt, 1983; Svebak 2010; Thorson et al.,1997). Our measure did not have any item content related to aggressive or self-defeating humor, and only one item related to coping, so we did not anticipate strong correlations with measures of emotional disturbance. Finally, based on prior research findings, we expected our humor measure to be positively correlated with life satisfaction (Cann & Collette, 2014; Proyer et al., 2010; Ruch et al., 2022)
Research Aim 4. To extend prior humor research by examining the pattern of associations with dimensions of personality dysfunction outlined by the DSM-5-TR’s Alternative Model of Personality Disorders (American Psychiatric Association, 2022). While developing specific hypotheses based on limited prior research was difficult, we anticipated a general tendency for higher levels of humor to be associated with lower levels of personality dysfunction.
2. Materials and Method
2.1. Participants
Participants were 1,031 undergraduates attending St. John’s University in Queens, NY. The mean age was 19.25 (SD = 1.37); the minimum age reported was 17, and the maximum was 28. Age data was missing for four participants. Most participants were women (n = 783, 75.9%), and there were 226 men (21.9%). Gender data were missing for 22 participants. The three largest racial/ethnic groups represented were non-Hispanic White (39.6%), Hispanic/Latino (17.6%), and Black/African American (10.0%). The percentage of participants in each of the other race/ethnic groups are as follows: Black/Caribbean, 7.9%, South Asian, 7.3%, Biracial or multiracial, 6.9%, East Asian, 4.8%, “Other”, 3.5%, Middle Eastern, 1.5%, Pacific Islander, 0.5%, and American Indian/Alaska Native, 0.4%. Two people did not report race/ethnicity data.
2.2. Procedure
The present study was conducted under St. John’s University Institutional Review Board approval (protocol #IRB-FY2021_208, 11/10/2020) and was conducted in accordance with the Declaration of Helsinki. Participants were recruited via undergraduate psychology classes at St. John’s University. Participants voluntarily registered through the Department of Psychology SONA research participation sign-up system, an online university-based system used for study sign-ups, administration, and compensation. Once participants agreed to participate in the present study, SONA directed them through a link to a Qualtrics survey via a link. Participants were awarded course credit as compensation for participation in the study. After providing informed consent, participants remotely completed self-report measures of demographic data, personality traits, maladaptive personality traits, depression, anxiety, anger, and satisfaction with life. Participants completed several other measures that are not relevant to the current study and will not be discussed further in this manuscript. Data collection took place from January 2021 to May 2024.
2.3. Measures
2.3.1. Sense of Humor
Seven humor items were extracted from the 24-item SHS (SHS-24; McGhee, 1999). The playfulness and mood items from the original 40-item parent version of the SHS were not examined in this study, because the focus was on the items from the six humor skills targeted by McGhee’s (2010) humor intervention. The SHS-24 has six four-item subscales (Enjoyment of Humor; Laughter; Verbal Humor; Finding Humor in Everyday Life; Laughing at Yourself, and Humor Under Stress). Based on a rational analysis of the SHS-24, items were selected to maximize content validity and consonance with the six SHS-24 sub-scales. The scale we developed had at least one item to measure each SHS-24 subscale. Finding Humor in Everyday Life was represented by two items from the SHS-24. Item selection decisions were supplemented by examining corrected item-total correlations for SHS-24 items and their corresponding subscales in a sample of 315 participants from a prior study of the psychometric properties of the 24-item SHS (Lydon & McDermut, 2021). Like the SHS-24, items are rated on a 7-point Likert scale ranging from “never” to “all the time.” To best capture the content of the original SHS, some items were re-written to simplify wording, and some were combined. The scale we created is henceforth referred to as the SHS-7, and McGhee’s original scale (1999) as the SHS-24.
Item 1 (It is important for me to have a lot of humor in my life) on the SHS-7 was selected to represent the Enjoyment of humor subscale. This item had a corrected item-total correlation of .402 with the Enjoyment of humor subscale in 315 participants in a previously published report (Lydon & McDermut, 2021).
The second item on the SHS-7 (I laugh a lot) is a rewritten and simplified version of item 5 on the SHS-24 (I have a good belly laugh many times each day). This item is intended to represent the SHS-24’s Laughter subscale. Item 5 from the SHS-24 had a corrected item-total correlation of .610 with the Laughter subscale (Lydon & McDermut, 2021).
Item 3 on the SHS-7 (I often tell jokes or funny stories) is a combination of SHS-24 items 9 (I often tell jokes) and item 10 (I often tell funny stories). SHS-7 item 3 is meant to represent the Verbal humor sub-scale of the SHS-24. The original items had corrected item subscale total correlations with the Verbal Humor subscale of the SHS-24 of .732 and .778, respectively.
Item 4 on the SHS-7 (I often share with others funny things I observe or that happen to me) was intended to represent the Finding Humor in Everyday Life subscale of the SHS-24. Lydon and McDermut (2021) found that this item was correlated with the Finding Humor in Everyday Life subscale at .740.
SHS-7 item 5 (I often find humor in things that happen at work or at home) is also intended to represent the Finding Humor in Everyday Life subscale from the SHS-24. Item 5 is a combination of the SHS-24 items 13 (I often find humor in things that happen at work) and 14 (I often find humor in things that happen at home) which had correlations with its corresponding subscale of .717 and .799, respectively, in the Lydon and McDermut (2021) sample.
Item 6 (I often find humor in my own embarrassing incidents or personal blunders) was selected to represent the Laughing at Yourself subscale of the SHS-24. In the Lydon and McDermut (2021) sample this item correlated with its corresponding subscale at .804.
Item 7 (My sense of humor is one of my most effective tools for coping with life stress) was selected because the content was a good reflection of the SHS-24’s Humor Under Stress subscale. In the Lydon and McDermut (2021) sample, this item correlated with its designated subscale at .831.
In sum, the SHS-7 includes items that represent the six subscales of the SHS-24. Consistent with McGhee (1999), the SHS-7 conceptualizes the sense of humor as a multidimensional construct comprising affective, behavioral, cognitive, and social aspects of humor, with higher scores reflecting greater humor. While the scope is broad, on its face, it does not embody all theoretically relevant aspects of humor. For example, there is no explicit content regarding the use of sarcasm, self-disparagement, sensitivity to humorous cues, or a liking for humorous people.
The internal consistency for the seven-item humor scale was alpha = .909. The scale was unidimensional. A principal component analysis yielded only one component with an eigenvalue over 1.0 (i.e., 4.595), and the second component extracted had an eigenvalue of only .616, indicating that there was no substantial evidence of multiple subfactors. Four participants (0.38%) were missing data for the SHS-7, with no clear pattern of missingness.
2.3.2. Personality
The Ten Item Personality Inventory (TIPI) is a brief tool used to assess the Big Five personality traits: Openness to Experience, Conscientiousness, Extraversion, Agreeableness, and Emotional Stability (Gosling et al., 2003). The TIPI supplies the sentence stem “I see myself as…” followed by ten pairs of traits and asks respondents to rate the extent to which they agree or disagree with each statement. The Likert-style options are “Disagree strongly,” “Disagree moderately,” “Disagree a little,” “Neither agree nor disagree,” “Agree a little,” “Agree moderately,” and “Agree strongly.” Numerical values for each item range from 1 to 7. The TIPI measures each Big Five personality dimension with two items. Scores range from 2 to 14 on each personality dimension, where higher scores signify a stronger tendency toward that personality trait, and lower scores signify a weaker tendency toward that trait. Despite the TIPI’s brevity, prior research demonstrated acceptable test-retest reliability and moderate convergent validity with more extensive measures of the Big Five personality traits (Gosling et al., 2003). In our data, Cronbach’s alphas for the five two-item TIPI scales were as follows: Extraversion (.603), Emotional Stability (.600), Conscientiousness (.470), Openness (.342), and Agreeableness (.182). Coefficient alphas below .50 are considered inadequate (Ponterotto, & Ruckdeschel, 2007). TIPI data was missing for four participants (0.39% of the total sample), with no clear pattern of missingness.
2.3.3. Personality Dysfunction
The Personality Inventory for the Diagnostic and Statistical Manual of Mental Disorders, Fifth Edition – Brief Form (PID-5-BF) is used to assess self-rated personality dysfunction in five personality trait domains including Detachment, Antagonism, Negative Affectivity, Disinhibition, and Psychoticism (Krueger et al., 2012). The PID-5-BF is a shorter, 25-item version of the Personality Inventory for DSM-5, which is 200 items (Krueger et al., 2012). For the present study we used 10 items from the 25-item brief form. The PID-5-BF asks participants to rate the extent to which each of a series of statements describes how much they were bothered by a particular problem during the past week. The Likert-style options are “Very False or Often False,” “Sometimes or Somewhat False,” “Sometimes or Somewhat True,” and “Very True or Often True.” Numerical values for each item range from 0 to 3. Total possible scores for each subscale range from 0 to 6, where greater scores signify more personality dysfunction. The PID-5-BF demonstrates good test-retest reliability and adequate convergent validity with other measures of personality traits (Barchi-Ferreira & Osório, 2024). In our data, Cronbach’s alphas were as follows: Antagonism (.845), Negative Affectivity (.771), Disinhibition (.763), Psychoticism (.762), and Detachment (.680). Personality dysfunction data were missing for five participants (0.48% of the total sample), with no clear pattern of missingness.
2.3.4. Depressive Symptoms
The Patient Health Questionnaire (PHQ-9) is a brief, self-administered tool used to assess depression severity (Kroenke et al., 2001). The PHQ-9 asks participants to rate the extent to which a series of statements describes how often they have been bothered by certain symptoms. The Likert-style options are “Not at all,” “Several days,” “More than half the days,” and “Nearly every day.” Numerical values for each item range from 0 to 3. Total possible scores could range from 0 to 27, with higher scores indicating more severe depression. The PHQ-9 demonstrates good criterion validity, and excellent internal reliability and test-retest reliability (Kroenke et al., 2001). In our data, Cronbach’s alpha was 0.913 for the PHQ-9, representing good internal reliability. Data for the scale were missing for 5 participants (0.48% of the total sample), with no clear pattern of missingness.
2.3.5. Anxiety
The Generalized Anxiety Disorder 7-item Scale (GAD-7) is used to assess anxiety symptoms (Spitzer et al., 2006). The GAD-7 asks participants to rate the extent to which they have been bothered by a series of problems over the past two weeks, by presenting them with statements reflecting anxiety and worry and asking them to choose one of four response options. The Likert style options are “Not at all,” “Several days,” “Over half the days,” and “Nearly every day.” Numerical values for each item ranged from 0 to 3. Total possible scores range from 0 to 21 on the GAD-7, with higher scores signifying more severe anxiety. The GAD-7 demonstrates good reliability and construct, criterion, factorial, and procedural validity (Spitzer et al., 2006). In our data, Cronbach’s alpha was 0.933 for the GAD-7, representing good internal reliability. Data for the scale was missing for three participants (0.29% of the total sample), with no clear pattern of missingness.
2.3.6. Hostility
The SCL-90-R Hostility Scale is a subscale of the Symptom Checklist-90-Revised (Derogatis, 1994). It consists of six items measuring anger, irritability, resentment, and aggression. Participants rate each item based on how much the symptom has bothered them in the past week, on a 5-point scale, ranging from 0 (Not at all) to 4 (Extremely). Scores are then averaged to indicate the overall severity of anger and hostility. It demonstrates good validity and test-retest reliability and has been widely used in clinical and research settings. Cronbach’s alpha for the six Hostility items in this dataset was 0.868. Hostility data were missing for five participants (0.48%) with no clear pattern of missingness.
2.3.7. Life Satisfaction
The Satisfaction with Life Scale (SWLS) was used to assess life satisfaction and psychological well-being (Diener et al., 1985). The SWLS asks participants to rate the extent to which they agree or disagree with a series of five statements. The Likert-style options are “Disagree Strongly,” “Disagree,” “Slightly disagree,” “Neither agree nor disagree,” “Slightly agree,” “Agree,” and “Strongly agree.” Numerical values for each item range from 1 to 7. Total possible scores range from 5 to 35 on the SWLS, where higher scores indicate greater life satisfaction. The SWLS demonstrates acceptable test-retest reliability and strong convergent validity with other measures of subjective well-being (Diener et al., 1985). In our data, Cronbach’s alpha was 0.877 for the SWLS, representing good internal reliability. Data for the scale was missing for five participants (0.48% of the total sample), with no clear pattern of missingness.
2.4. Data Preparation and Data Analytic Plan
Results of Little’s MCAR indicated that the data were missing completely at random (χ2(119) = 36.53, p = 1.000). The negligible amount of missing data was not replaced or imputed.
Gender was coded as 0 for female and 1 for male. Gender data was missing for twenty-two participants. The participants without gender data were included in all analyses except the independent samples t-test comparing mean humor scores between men and women. Data cleaning was conducted using SPSS (IBM Corp., 2024), version 31.0. Descriptive statistics, independent samples t-tests, and bivariate Spearman correlations were conducted using JASP Version 0.19.3 (JASP Team, 2025).
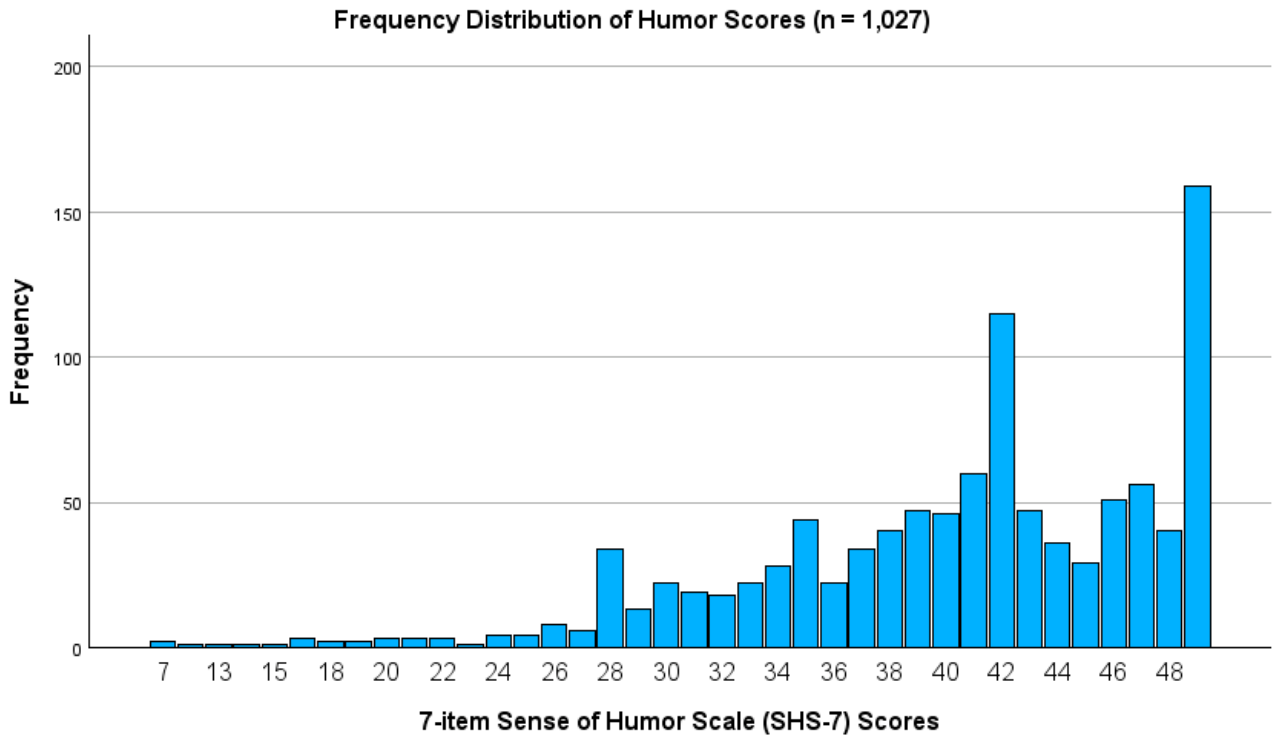
Descriptive statistics and histograms of variable distributions were checked for normality and outliers. The distribution of SHS-7 scores was slightly negatively skewed (-0.99). This value falls below the threshold of 1.0, which is usually used to determine whether or not a variable is too skewed to be analyzed with parametric statistics (e.g., Pearson correlation). However, visual inspection of the distribution of SHS-7 scores was not a Gaussian normal distribution, i.e., the shape of the distribution below the mean was not a mirror image of the distribution above the mean due to slight negative skew and the fact that the median was higher than the mean, and the mode was higher than the median (See Appendix AFigure A1). Therefore, we conducted Spearman correlations (see Table 2) which do not assume normality of variable distributions. We used a p-value of 0.05 (two-tailed) for analyses.
Item Response Theory analyses were conducted using MPlus 9 (Muthen & Muthen, 2025). These analyses were used to generate item discrimination values (a parameter), and item difficulty (b parameter) values for the seven humor items (see Table 1). To improve interpretability of IRT analyses, responses to humor items were dichotomized, responses of 1 (strongly disagree), 2 (disagree), 3 (mildly disagree), and 4 (neither agree nor disagree) were recoded as 0. Responses of 5 (mildly agree), 6 (agree), and 7 (strongly agree) were recoded as 1. In IRT, the discrimination parameter reflects the item’s ability to discriminate between respondents with different levels of the underlying latent trait (i.e., sense of humor). Discrimination parameters greater than 1.0 differentiate between high humor respondents and low humor respondents. Item difficulty denotes the specific level of the latent ability (humor) needed for the respondent to have a 50% chance of endorsing the item. Item difficulties are expressed in standard deviation units. A higher difficulty score indicates that the respondent must exhibit a higher level of humor in order to endorse the item.
The study was not pre-registered. The data are publicly available at Mendeley Data (McDermut, Wilson (2026), “Humor Data McDermut [Public] 7.30.26”, Mendeley Data, V1) and can be found here: doi: 10.17632/zspwdstdwf.1.
3. Results
Women (M = 40.60, SD = 7.00) obtained a slightly higher mean humor score than men (M = 39.58, SD = 8.12), but this difference was not statistically significant, t(1003) = 1.85, p = .065, Cohen’s d = .14. SHS-7 scores were not correlated with age.
Total scores on the SHS-7 ranged from 7 to 49 with a mean score of 40.38 (SD = 7.26). The median was 42 and the mode was 49. The highest possible score of 49 was achieved by 159 participants (15.5%).
The internal reliability (as indexed by Cronbach’s α) for the seven-item humor scale was .909. No single item increased α above .909 when deleted, indicating that each of the seven items contributed to internal consistency. Frequency distributions for item responses were negatively skewed and non-normally distributed (see Appendix A Figure A1). Inter-item Spearman correlations ranged from 0.504 to 0.756 (Mdn = .619). As shown in Table 1, corrected item-total correlations for the seven humor items ranged from .675 to .765, with a mean of .727. Item discrimination values ranged from 2.34 to 4.02 (M = 3.06).

Table 1.
Psychometric Properties of the Humor Items.
| Humor Item | Corrected item-total correlation | α if item deleted |
a parameter |
b parameter |
% endorsement |
| Important | 0.70 | .899 | 2.85 | -1.41 | 88.6 |
| Laugh | 0.75 | .894 | 3.28 | -1.29 | 87.8 |
| Jokes | 0.76 | .892 | 2.93 | -1.07 | 82.3 |
| Share | 0.79 | .890 | 4.02 | -1.37 | 89.7 |
| Work/Home | 0.76 | .892 | 3.57 | -1.15 | 85.2 |
| Personal | 0.68 | .902 | 2.34 | -1.01 | 79.3 |
| Coping | 0.69 | .902 | 2.45 | -0.99 | 79.2 |
Note. Corrected item-total correlation is the correlation of each humor item with the other six items. α = Cronbach’s alpha. a parameter = item discrimination. b parameter = item difficulty. % endorsement represents the proportion of respondents who answered 5 (mildly agree), 6 (agree), or 7 (strongly agree).
Item difficulty values ranged from -1.41 to -0.99, indicating respondents start endorsing the items when their humor levels are at 1.4 to about 1.0 standard deviation below the mean level of sense of humor. In other words, high levels of sense of humor are not required for respondents to endorse the items, resulting in endorsement rates ranging from 79.2% (Item 7) to 89.7% (Item 4), as shown in Table 1.
Table 2.
Spearman correlations between Total Humor Score and Big Five Personality, Personality Dysfunction, Emotional Dysfunction, and Satisfaction with Life.
Table 2.
Spearman correlations between Total Humor Score and Big Five Personality, Personality Dysfunction, Emotional Dysfunction, and Satisfaction with Life.
| Outcome variable | rho | p < |
| Extraversion | .31 | .001 |
| Agreeableness | .11 | .001 |
| Openness | .34 | .001 |
| Conscientiousness | .13 | .001 |
| Emotional Stability | .02 | .450 |
| Detachment | -.20 | .001 |
| Antagonism | -.09 | .003 |
| Psychoticism | .01 | .745 |
| Disinhibition | -.00 | .908 |
| Negative Affectivity | .03 | .298 |
| Depression | -.04 | .160 |
| Anxiety | -.02 | .590 |
| Hostility | -.08 | .012 |
| Satisfaction with Life | .14 | .001 |
Note. Rho = Spearman correlation coefficient. Spearman correlation with Disinhibition is -.004, but reported as -.00, due to rounding.
Spearman correlations with the criterion variables are shown in Table 2. The SHS-7 had its highest positive correlations with Openness (.33) and Extraversion (.29). The SHS-7 had small but statistically significant positive correlations with Agreeableness and Conscientiousness and was uncorrelated with Emotional Stability (.01). The SHS-7 was negatively correlated with Detachment and Antagonism and uncorrelated with Psychoticism, Disinhibition, and Negative Affectivity.
With respect to emotional disturbance, SHS-7 was uncorrelated with depressive symptoms and symptoms of anxiety and had a small negative correlation with anger. Life satisfaction showed a small positive correlation with the SHS-7.
4. Discussion
Overall, our short humor measure showed acceptable psychometric properties and a pattern of validity coefficients suggesting that the SHS-7 is associated with healthy personality and life satisfaction but is uncorrelated or inversely correlated with measures of personality dysfunction and psychological problems.
Psychometric properties were generally very good, with high internal consistency and strong corrected item-total correlations. Internal reliability (α = .909) was quite high for a short scale, though other studies reported higher Cronbach’s alpha values for the SHS-24 (e.g., .94, Lydon & McDermut, 2021) and (0.92, Ruch & Heintz, 2018). Item discrimination parameters indicated that all items were effective at differentiating between respondents with a high sense of humor and those with a low sense of humor. Negative skewness and low item difficulty (i.e., high levels of item endorsement) indicate that most people are endorsing the items, and thus the self-reported humor of most respondents clustered toward the maximum attainable score (i.e., 49). About 15% of respondents obtained the maximum possible score, thus these individuals may be bumping up against a ceiling that fails to differentiate their “true” levels of self-reported humor.
The pattern of correlations between the SHS-7 and dimensions of Big Five personality was consistent with prior research. Using the 24-tem SHS, Lydon and McDermut (2021) also found that the total SHS scores were positively correlated with extraversion and openness to experience, but uncorrelated with neuroticism, agreeableness, and conscientiousness.
The positive correlation between Sense of Humor and extraversion has been consistently reported by several research groups for several decades. Using another multi-faceted humor measure, the Multidimensional Sense of Humor Scale (MSHS; Thorson et al., 1997). Thorson et al. (1997) found that MSHS scores correlated positively with the Extraversion Scale of the NEO PI-R (Costa & McCrae) at 0.59, a moderately strong association. Similarly, Ruch (1994) found that extraversion was positively associated with several diverse markers of sense of humor (laughter frequency, laughter intensity, humor appreciation, humor creativity, humor coping).
As noted previously, we found small magnitude associations between the SHS-7 and agreeableness and conscientiousness, and no association with emotional stability. We are not aware of any other studies that obtained similar results using a multidimensional measure of humor. One possible explanation is that our study was overpowered, and the small correlations between the SHS-7 and agreeableness and conscientiousness are trivial and have no real-world implications. However, there are studies using narrow-band measures of humor that are correlated with agreeableness, conscientiousness, and emotional stability (Martin et al., 2003). The Humor Styles Questionnaire (HSQ; Martin et al., 2003) was developed to measure individual differences in the way humor is used. The HSQ assesses four distinct humor “styles”: Affiliative, Self-Enhancing, Aggressive, and Self-Defeating. Affiliative humor is used to facilitate relationships and reduce interpersonal tension. Self-Enhancing humor involves maintaining a humorous perspective on life to regulate emotions and cope with adversity. The Self-Enhancing scale of the HSQ has similarities to the Coping Humor Scale (Martin & Lefcourt, 1983). The Aggressive humor scale of the HSQ measures the use of disparagement and put-down humor. Finally, the Self-Defeating style measures the use of excessive self-ridicule. The Affiliative and Self-Enhancing styles are conceptualized as adaptive, while the Aggressive and Self-Defeating styles are maladaptive.
Empirical research using the HSQ shows that the four styles have distinct patterns of association with all the Big Five Dimensions (Martin et al., 2003). Martin et al. (2003) found that the Affiliative Style was most like the SHS-7 examined here, with significant positive correlations with extraversion and openness to experience. The Self-Enhancing style was inversely correlated with neuroticism, and positively correlated with extraversion, openness, and agreeableness. The Aggressive and Self-Defeating styles showed an unhealthy pattern with positive correlations with neuroticism, and negative correlations with agreeableness and conscientiousness. Thus, all Big Five dimensions of personality are associated with humor, but the patterns obtained depend on how humor is conceptualized and measured. However, in this dataset, the SHS-7 has a moderate correlation with openness, a small correlation with extraversion, and very small correlations with agreeableness and conscientiousness, a pattern roughly consistent with other similar measures.
Many studies have examined the association of humor and life satisfaction. Analyses in this study revealed a small positive correlation with life satisfaction, a pattern that has also been reported several times in the empirical humor literature. Using the 24-item parent version of the humor measure employed in this study, Proyer et al. (2010) found that humor was positively correlated with well-being in a sample of mostly older adults aged 18 to 74. Ruch et al. (2022) examined the psychometric properties of a 48-item SHS and a 29-item SHS in an English-speaking Canadian sample, and German-speaking German and Swiss samples. In both samples, five of six of the SHS subscales were significantly positively correlated with satisfaction with life (rs ranging from .09 to.31). Ruch and Heintz (2018) found that the total SHS score of two parallel versions of the 24-item SHS, when combined, correlated with life satisfaction at 0.30. In a longitudinal study, Cann and Collette (2014) found that humor, particularly coping humor, was associated with psychological well-being. This relationship was mediated by positive affect. And though Thorson et al. (1997) did not measure life satisfaction, they found that MSHS scores were associated with optimism and lower negative self-esteem, two variables known to correlate with life satisfaction (Caprara et al., 2025).
Our criterion variables representing emotional disturbance showed little to no association with the SHS-7. Measures of depressive and anxious symptoms showed no correlation, and hostility showed a weak negative relationship with humor. Broadly speaking, our findings are inconsistent with prior research. Several prior studies have reported that various measures of humor show inverse associations with depressive symptoms (Martin et al., 2003; Svebak 2010; Thorson et al.,1997) and negative affect (Cann & Collette, 2014). Martin et al. (2003) found that Affiliative humor style and the Self-Enhancing humor style were inversely associated with depressive symptoms. In contrast depressive symptoms were positively correlated with the Self-Defeating humor style.
There is little empirical evidence examining the association between anxiety and broad-based humor measures, but Martin et al. (2003) found the same pattern for anxiety that they did for depression, i.e., a negative correlation of anxiety with Affiliative and Self-Enhancing Humor, and a positive correlation with Self-Defeating humor style. Thorson et al. (1997) reported that lower death anxiety was associated with the use of coping humor. There is little empirical research on hostility and humor, but Thorson et al. (1997) found that the MSHS was inversely correlated with hostility, and Martin et al. (2003) found that hostility and aggression were positively correlated with Aggressive and Self-Defeating humor styles. In sum, while the SHS-7 was not strongly correlated with emotional disturbance, this is likely due to content difference: the SHS-7 does not assess aggressive or self-disparaging humor and coping humor is also underrepresented. However, when coping, aggressive, or self-defeating humor is measured, a clearer pattern of associations with emotional disturbances begins to emerge (Martin and Lefcourt, 1983; Martin et al., 2003).
The final set of criterion variables studied comprised the five dimensions of personality dysfunction corresponding to the those included in the DSM-5-TR Alternative Model of Personality Disorder (APA, 2022). The SHS-7 showed no association with Disinhibition, Psychoticism, and Negative Affectivity. Humor was inversely associated with Antagonism (-.13) and Detachment (-.21). These results suggest that higher levels of humor are associated with lower levels of antagonism and detachment. This finding is not surprising given that our measure of detachment assesses engagement and enthusiasm, which are theoretically inversely related to humor which requires hedonic capacity. The relation between humor and hedonic capacity might support the idea that humor is a psychosocial fitness indicator (Horigan & MacDonald, 2008). The lack of an association between humor and negative affect also parallels our other finding of no association between Big Five neuroticism and humor. To our knowledge, this is the only study to explore the connections between personality dysfunction and humor, and it should be replicated before definitive conclusions are drawn.
4.1. Limitations and Future Directions.
As the purpose of this study is scale development the cross-sectional design is less of a flaw than when the study’s purpose is to draw conclusions about cause and effect. The narrow demographic sample is a limitation, as it was a convenience sample of mostly female undergraduates with an average age of 19. This narrow demographic sample can’t be assumed to generalize to other adult populations, especially given the evidence of possible cohort effects (Proyer et. al., 2010; Svebak, 2010). Another aspect of the methodology that is vulnerable to criticism is the item selection method. Item selection was conducted by the lead author without establishing inter-rater reliability. Items were extracted from McGhee’s SHS-24. Based on item content, the lead author selected items judged to match the corresponding subscale on which each item loads. Some items were re-written to simplify the wording. While the scale is intended to be multidimensional, it lacks content on the use of aggressive or self-defeating humor, as well as other facets of humor such as appreciation of humorous people. Another limitation is that three of our criterion variables (Agreeableness, Openness, Conscientiousness) were measured using scales comprising only two items and had inadequate internal consistency coefficients (< 0.50). The correlations with unreliable criterion measures warrant replication with personality measures that have demonstrated acceptable internal reliability. Finally, the test-retest reliability of the SHS-7 needs to be examined.
Two very short humor measures have already been developed by Sven Svebak since creating a 21-item Sense of Humor Questionnaire (Svebak. 1974). In 1996, Svebak published reliability and validity data for a six-item version, and in 2010, for a three-item version (Svebak, 2010). One could argue that since short humor measures already exist, it is not an efficient use of time and resources to develop yet another short humor measure. However, due to differences in content, the SHQ-6/SHQ-3 and the SHS-7 are not redundant. The SHQ-6 is made up of items that tap three content areas related to awareness to humor cues, liking humorous situations, and mirthful expressiveness. The SHQ-3 has one item tapping each of the three dimensions. The SHS-7 on the other hand was designed to measure each of McGhee’s six humor skills (Enjoyment of humor, Laughter, Verbal humor, Humor in everyday life, Laughing at oneself, and Humor under Stress). Therefore, assuming equivalent psychometric properties, the choice of a short measure will depend on the researcher’s theoretical conceptualization of the humor construct.
Future research should recruit more diverse samples, such as community samples, or general population samples. Future research should also examine the convergent validity of the SHS-7 with other frequently used humor measures and examine content and empirical differences. In future studies of humor and personality, researchers may want to consider using measures of Big Five personality with adequate internal reliability. Researchers should attempt to replicate our findings about the association between humor and personality dysfunction. From the standpoint of extending and strengthening the nomological network surrounding the construct of humor, future research should continue to examine the associations between humor and other important affective, cognitive, personality, and motivational variables.
5. Conclusions
We abbreviated McGhee’s 24-item SHS and reduced it to seven items. In a sample of approximately 1,000 undergraduates, our results showed that the SHS-7 is internally reliable and replicated research on the positive associations between humor and extraversion, openness to experience, and life satisfaction. We did not find support for an association between humor and emotional disturbance as has been reported by several other researchers. We extended prior research by determining that humor is inversely associated with two dimensions of personality dysfunction (detachment and antagonism). Although there are at least three good parent versions of McGhee’s SHS ranging in length from 24 to 48 items, we suggest that a very short seven-item version could be useful in research for weekly progress monitoring and when the data analyst wants to employ humor as a covariate in studies of associated personality and psychological variables.
Author Contributions
Conceptualization, W.M.; methodology, W.M.; formal analysis, W.M., P.D., J.S., C.G., G.S.J., J.C.; investigation, W.M., GSJ; resources, W.M.; data curation, W.M., P.D., J.S., C.G.; writing—original draft preparation, W.M., P.D.; writing—review and editing, W.M., P.D., J.S., C.G., G.S.J., J.C.; su-pervision, W.M.; project administration, W.M., P.D., J.S., C.G. All authors have read and agreed to the published version of the manuscript.
Funding
This research received no external funding.
Institutional Review Board Statement
The study was conducted in accordance with the Declaration of Helsinki and was approved by the Institutional Review Board of St. John’s University (protocol code #IRB-FY2021_208; date of ap-proval: November 10, 2020).
Informed Consent Statement
Informed consent was obtained from all subjects involved in the study.
Data Availability Statement
The data are publicly available at Mendeley Data (McDermut, Wilson (2026), “Humor Data McDermut [Public] 7.30.26”, Mendeley Data, V1) and can be found here: doi: 10.17632/zspwdstdwf.
Conflicts of Interest
The authors declare no conflicts of interest.
Abbreviations
The following abbreviations are used in this manuscript:
| DSM-5-T | Diagnostic and Statistical Manual, fifth edition, text revision |
| SHS-24 | McGhee’s (1999) 24-item Sense of Humor Scale |
| SHS-7 | 7-item sense of Humor Scale |
| MSHS | Multidimensional Sense of Humor Scale |
| NEO-PI-R | NEO Personality Inventory Revised |
| SHQ | Sense of Humor Questionnaire |
Appendix A
Figure A1.
Frequency Distribution of scores on SHS-7.
References
- American Psychiatric Association. (2022). Diagnostic and statistical manual of mental disorders (5th ed., text rev.). [CrossRef]
- Barchi-Ferreira, A. M., & Osório, F. L. (2024). The Personality Inventory for DSM-5-Brief Form (PID-5-BF): Psychometric indicators in a Brazilian community sample. International Journal of Personality Psychology, 10, 32-40. [CrossRef]
- Cann, A., & Collette, C. (2014). Sense of humor, stable affect, and psychological well-being. Europe’s Journal of Psychology, 10(3), 464–479. [CrossRef]
- Caprara, G. V., Corbelli, G., Caprara, M., Contreras, A., Paciello, M., & Zuffianò, A. (2025). Phenomenology of positivity: Understanding the joint dynamics of self-esteem, life satisfaction, and optimism. Journal of Happiness Studies, 26, Article 149. [CrossRef]
- Cohen, J. (1992). A power primer. Psychological Bulletin, 112(1), 155–159.10.1037/0033-2909.112.1.155Costa, P. T., Jr., & McCrae, R. R. (1992). Revised NEO personality inventory (NEO-PI-R) and NEO five-factor inventory (NEO-FFI) professional manual. Psychological Assessment Resources.
- Derogatis, L. R. (1994). SCL-90-R: Administration, scoring and procedures manual (2nd ed.). Clinical Psychometric Research.
- Diener, E. D., Emmons, R. A., Larsen, R. J., & Griffin, S. (1985). The satisfaction with life scale. Journal of personality assessment, 49(1), 71-75. [CrossRef]
- Gosling, S. D., Rentfrow, P. J., & Swann, W. B., Jr. (2003). A very brief measure of the Big-Five personality domains. Journal of Research in Personality, 37(6), 504–528. [CrossRef]
- Heintz, S. et al. (2020). Benevolent and Corrective Humor, Life Satisfaction, and Broad Humor Dimensions: Extending the Nomological Network of the BenCor Across 25 Countries. Journal of Happiness Studies, 21(7), 2473-2492. doi: 10.1007/s10902-019-00185-9.
- Heintz, S., Ruch, W., Lau, C., Saklofske, D. H., & McGhee, P. (2022). Development and validation of the short version of the Sense of Humor Scale (SHS-S): Paving the way for assessment of humor skills training. European Journal of Psychological Assessment, 38(4), 320. [CrossRef]
- Howrigan, D. P., & MacDonald, K. B. (2008). Humor as a mental fitness indicator. Evolutionary Psychology, 6(4), 625–666. [CrossRef]
- IBM Corp. (2024). IBM SPSS Statistics for Windows (Version 31.0.0.0) [Computer software]. https://www.ibm.com.
- JASP Team. (2025). JASP (Version 0.19.3) [Computer software]. https://jasp-stats.org/.
- Kroenke, K., Spitzer, R. L., & Williams, J. B. (2001). The PHQ-9: validity of a brief depression severity measure. Journal of general internal medicine, 16(9), 606-613. [CrossRef]
- Krueger, R. F., Derringer, J., Markon, K. E., Watson, D., & Skodol, A. E. (2012). Initial construction of a maladaptive personality trait model and inventory for DSM-5. Psychological medicine, 42(9), 1879-1890. [CrossRef]
- Lydon, D., & McDermut, W. (2022). Reliability and validity of the sense of humor scale. Humor, 35(1), 93-111. [CrossRef]
- Martin, R. A., & Ford, T. (2018). The psychology of humor: An integrative approach (2nd ed.). Elsevier Academic Press.
- Martin, R. A., & Lefcourt, H. M. (1983). Sense of humor as a moderator of the relation between stressors and moods. Journal of Personality and Social Psychology, 45(6), 1313–1324. [CrossRef]
- Martin, R. A., Puhlik-Doris, P., Larsen, G., Gray, J., & Weir, K. (2003). Individual differences in uses of humor and their relation to psychological well-being: Development of the Humor Styles Questionnaire. Journal of Research in Personality, 37(1), 48–75. [CrossRef]
- McGhee, P. E. (1999). Health, healing and the amuse system: Humor as survival training (3rd ed.). Kendall Hunt Publishing.
- McGhee, P. E. (2010). Humor as survival training for a stressed-out world: The seven humor habits program. AuthorHouse.
- Muthén, L. K., & Muthén, B. O. (2025). Mplus user’s guide (9th ed.). Muthén & Muthén.
- Ponterotto, J. G., & Ruckdeschel, D. E. (2007). An overview of coefficient alpha and a reliability matrix for estimating adequacy of internal consistency coefficients with psychological research measures. Perceptual and Motor Skills, 105(3), 997–1014. [CrossRef]
- Proyer, R. T., Ruch, W., & Müller, L. (2010). Sense of humor among the elderly. Zeitschrift für Gerontologie und Geriatrie, 43(1), 19-24. [CrossRef]
- Ruch, W. (1994). Temperament, Eysenck’s PEN system, and humor-related traits. Humor, 7(3), 209-244. [CrossRef]
- Ruch, W., & Heintz, S. (2016). The German version of the Humor Styles Questionnaire: Psychometric properties and overlap with other styles of humor. Europe’s Journal of Psychology, 12(3), 434–455. [CrossRef]
- Ruch, W., & Hofmann, J. (2012). A temperament approach to humor. In P. Gremigni (Ed.), Humor and health promotion (pp. 79–112). Nova Biomedical Books.
- Ruch, W., & Hofmann, J. (2017). Fostering humor. In C. Proctor (Ed.), Positive psychology interventions in practice (pp. 65–80). Springer.
- Ruch, W. F., Hofmann, J., Rusch, S., & Stolz, H. (2018). Training the sense of humor with the 7 Humor Habits Program and satisfaction with life. Humor, 31(2), 287-309. [CrossRef]
- Spitzer, R. L., Kroenke, K., Williams, J. B. W., & Löwe, B. (2006). A brief measure for assessing generalized anxiety disorder: The GAD-7. Archives of Internal Medicine, 166(10), 1092–1097. [CrossRef]
- Svebak, S. (1974). Revised questionnaire on the sense of humor. Scandinavian Journal of Psychology, 15(4), 328–331. [CrossRef]
- Svebak, S. (1996). The development of the sense of humor questionnaire: From SHQ to SHQ-6. HUMOR: International Journal of Humor Research, 9(3–4), 341–361. [CrossRef]
- Svebak, S. (2010). The sense of humor questionnaire: Conceptualization and review of 40 years of findings in empirical research. Europe’s Journal of Psychology, 6(3), Article e218. [CrossRef]
- Thorson, J. A., & Powell, F. C. (1993). Development and validation of a multidimensional sense of humor scale. Journal of clinical psychology, 49(1), 13-23. [CrossRef]
- Thorson, J. A., Powell, F. C., Sarmany-Schuller, I., & Hampes, W. P. (1997). Psychological health and sense of humor. Journal of clinical psychology, 53(6), 605-619. [CrossRef]
Disclaimer/Publisher’s Note: The statements, opinions and data contained in all publications are solely those of the individual author(s) and contributor(s) and not of MDPI and/or the editor(s). MDPI and/or the editor(s) disclaim responsibility for any injury to people or property resulting from any ideas, methods, instructions or products referred to in the content. |
© 2026 by the authors. Licensee MDPI, Basel, Switzerland. This article is an open access article distributed under the terms and conditions of the Creative Commons Attribution (CC BY) license (http://creativecommons.org/licenses/by/4.0/).
Copyright: This open access article is published under a Creative Commons CC BY 4.0 license, which permit the free download, distribution, and reuse, provided that the author and preprint are cited in any reuse.