

Submitted:
28 August 2026
Posted:
31 August 2026
You are already at the latest version
Abstract
The cement industry’s shift toward carbon neutrality is expanding the use of alternative fuels such as waste synthetic resin (WSR). Because WSR particles are approximately 500 times larger than pulverized coal, their thermal inertia delays devolatilization and repositions heat release relative to the sintering zone. Using three-dimensional steady-state RANS CFD at approximately 21% thermal substitution, we use the devolatilization-completion distance (xdev) as a primary diagnostic proxy for sintering-zone heat-release confinement. The particle-size effect was decomposed into a single-diameter axis (SD: 5–25 mm)andanoversize-tail axis (Rosin–Rammler distributions, PSD: upper limits 20–35 mm). Across these cases, D90, the 90th-percentile diameter of the fed distribution, acts as a first-order coarse-tail scale for organizing xdev, while the upper-tail shape and the population of the largest particles provide secondary corrections. Under the present modeled conditions, xdev generally falls within the sintering zone or near its rear boundary (within the 0.5 m post-processing resolution) when D90 is near or below approximately 20 mm, placing this value as a boundary-sensitive coarse-tail scale rather than a sharp confinement threshold; the centerline CO-rich region can persist downstream, further reducing the rear margin at the 20 mm level, with the SD single-diameter baseline at d = 15 mm (SD3) providing the safer mechanistic reference condition. The double-peak flame structure observed in monodisperse (SD) cases reflects the single-diameter idealization: for the studied dm = 15 mm PSD conditions it is smoothed into a single broad peak, with SD3 showing an approximately 86 °C higher peak than PSD1. These results indicate that managing coarse-tail metrics such as D90, rather than relying only on nominal upper-limit or arithmetic-mean diameters, is more directly connected to sintering-zone heat-release localization.
Keywords:
cement kiln main burner
; waste synthetic resin (WSR)
; co-firing
; particle size distribution
; D90
; devolatilization-completion length
; flame structure
; sintering zone
; thermal confinement
; computational fluid dynamics (CFD)
1. Introduction
The cement industry accounts for roughly 7–8% of global anthropogenic CO2 emissions, making it one of the largest single industrial sources. The most direct route to decarbonizing clinker production is to replace the fossil fuels used in clinker burning with waste-derived alternative fuels (AF), thereby raising the overall thermal substitution rate (TSR) of the process [1,2,3,4,5]. Fuel is introduced at two locations in a cement kiln, the calciner and the rotary-kiln main burner, and the plant-level TSR is the sum of the substitution rates achieved at these two points. Of the two, the calciner offers a long residence time and a relatively low required combustion temperature, so it can accommodate comparatively large AF particles and has therefore carried a high substitution rate from an early stage [6]. Raising the plant-level TSR further thus requires increasing AF use at the main burner, where substitution has so far been limited, and it is precisely here that the principal combustion-engineering challenge arises [7].
Substitution at the main burner is difficult because the high temperature of the sintering zone must be secured within a short flame. Formation of the clinker mineral phases requires that a temperature of about 2000 °C be maintained in the sintering zone [8], and at the main burner this heat release must be concentrated within the sintering zone during a short flame residence time and then transferred to the clinker bed. The requirement placed on a main-burner fuel is therefore not merely complete combustion but confinement of the heat release so that it occurs within the sintering zone before leaving it. In this work we refer to this spatial constraint on heat release as thermal confinement. If combustion is slow and the heat-release region shifts downstream of the sintering zone, the same energy content no longer contributes to clinker sintering and is effectively lost; consequently, particle burning rate, which is not a concern in the calciner, becomes a constraint that governs whether substitution is feasible at the main burner. In Korea as well, AF adoption has proceeded first around the calciner while extension to the main burner remains an open task, and the accompanying need to develop supporting standards has also been noted [9].
The degree to which heat release remains within the sintering zone at the main burner is set jointly by burner operating conditions—such as oxygen enrichment, combustion-air staging, and co-firing ratio—and by fuel properties. Among fuel properties, composition and density are largely fixed by the feedstock, whereas particle size is a preparation variable that can be adjusted in practice through grinding and screening, and it is a fuel variable that must be re-examined at the main burner because conditions there differ from those in the calciner. Candidate main-burner AFs include RDF and SRF, but waste synthetic resin (WSR) accounts for about 91% of the alternative fuel used in Korean cement plants, so WSR is the practical target for main-burner extension [9]. Korean WSR is not a single polymer but a waste-derived fuel that blends waste plastics, film and packaging materials, waste paper and woody components, and composite materials, and its composition varies with the supply source and screening conditions. The proximate and ultimate analyses of the WSR used in this study (Table 2) reflect this heterogeneous character, showing a composition with appreciable oxygen content and fixed carbon. WSR is an attractive candidate owing to its high calorific value and low moisture, but the particles that are actually fed are hundreds of times larger than pulverized coal. Its composition is also non-uniform and may contain contaminants such as metal and glass, which makes fine and uniform grinding difficult and raises grinding costs [10]. In particular, the thermoplastic fraction not only hinders attainment of a uniform particle size during grinding and screening but can also soften and melt prior to pyrolysis, increasing the uncertainty of the actual particle behavior through deformation, agglomeration, and wall deposition.
Particle size simultaneously governs specific surface area, particle heating time, devolatilization rate, and the location where subsequent char reaction proceeds; it is therefore a key fuel variable that influences the location of heat release and whether thermal confinement within the sintering zone is achieved at the main burner. Larger particles require more time for heating and pyrolysis, so ignition is delayed and the heat-release region moves downstream; consistent with this, flame measurements have reported that the ignition location under SRF co-firing tends to shift downstream relative to the reference fuel [11]. Furthermore, if particles larger than the specified upper limit fail to complete combustion within the short flame region, they may fall onto the clinker bed while still unburned, creating a locally reducing atmosphere and quality defects such as brown clinker [10].
The influence of alternative-fuel particle size has been addressed in several numerical studies. Ariyaratne et al. [12] showed in CFD of meat and bone meal (MBM) that a larger mean particle diameter delays devolatilization and char burnout, and Kroumian et al. [13] confirmed a reduction in flame intensity for SRF-type fuels using both experiment and CFD. Haas and Weber [14] predicted that the slow combustion of RDF shifts the flame region downstream and lowers the mean flame temperature, and Pieper et al. [15] used three-dimensional CFD coupled with a one-dimensional clinker-bed model to quantify how delayed combustion of large RDF particles can lead to a lower sintering-zone temperature and to unburned particles entering the bed. In addition, rotary-kiln modeling studies have treated the cement kiln as a high-temperature thermal process combining internal radiative and momentum transfer [16] with process-level energy recovery [17]. These studies, however, have generally focused on the calciner, been limited to MBM, RDF, or SRF, or treated particle-size effects only under low-resolution conditions, and thus have not resolved the particle-size problem for WSR at the main burner [7,18].
Current specifications also manage this problem through a single maximum allowable particle size. The European standard EN ISO 21640 [19] defines particle size as a property to be declared but does not impose an upper limit for any specific combustion device; the size limit for a given installation is set by process-engineering requirements rather than by the standard. The calciner, with its long residence time, can accommodate particles as large as 100 mm [10], whereas the main burner, with its short flame residence time, requires a smaller particle size whose quantitative limit has not yet been sufficiently established. In practice, a case has been reported in which SRF was ground to a cumulative 50% diameter (D50) of about 6.8 mm to achieve stable co-firing [20]. Because that case differs from the present WSR conditions in fuel composition (SRF), oxygen-enrichment level, and burner operating conditions, we interpret it as a practical reference range for the degree of grinding rather than as a direct comparison; these differences are also part of the rationale for adopting 15 mm as a conservative reference condition in this study.
Moreover, particle size is not a variable for which smaller is always better. If the mean particle diameter is too large, heat release moves outside the sintering zone; conversely, if it is too small, heat release may be completed upstream before reaching the sintering zone, so both excessively large and excessively small particles can weaken the localization of heat release within the sintering zone. This two-sided behavior implies that an appropriate particle size has not only an upper bound but also a lower bound, which suggests that it should be specified by a particle-size distribution rather than by a single representative diameter.
For the same Korean cement kiln considered here, field demonstrations and numerical studies of extending WSR application from the calciner to the main burner have accumulated in a complementary manner. Choi et al. [21] demonstrated that feeding WSR crushed to below 50 mm into a calciner with multi-stage combustion raised the TSR from 24.0% to 43.3% while reducing NOx by 17.4%, thereby indicating the potential for a stepwise extension from the calciner to the main burner. For the same main-burner geometry, Kim et al. [22] reported, using multivariate CFD together with a Meta-model of Optimal Prognosis (MOP) sensitivity analysis, that particle size explains about 30% of the variance in CO emissions; however, the particle-size axis was limited to three points (5, 15, and 25 mm), leaving finer response resolution and the effects of the distribution and oversize fraction to future work.
The mean flame temperature is useful for confirming whether the sintering zone is overall sufficiently hot, but because it reduces the entire cross-section to a single value, it does not directly reveal how far the heat release of coarse particles has shifted downstream. Assessing thermal confinement under changes in WSR particle size therefore requires a metric that can directly connect the completion location of devolatilization and the axial shift of the heat-release region to the sintering-zone boundary. Accordingly, as the evaluation metric for thermal confinement, this study adopts not the flame temperature but the axial location at which pyrolysis (devolatilization) is completed, , and analyzes the devolatilization behavior, changes in flame structure, and the shift of the heat-release region with WSR particle size relative to the sintering-zone boundary. Because assigns an axial coordinate to the point where devolatilization—the precursor stage of heat release—ends, it can directly indicate whether that point has crossed the downstream boundary of the sintering zone or how much margin remains at completion. The quantitative definition of is given in Section 2.6.4.
On this basis, this study decomposes the particle-size effect into two distinct cases. The first is a single-diameter case (SD case) in which all WSR particles are assumed to have the same diameter, and the second is an oversize-tail case (PSD case) in which the characteristic diameter of the distribution is held fixed while only the upper limit is increased to add a group of coarser particles. The single-diameter case is an idealization in which the diameter d of all WSR particles varies together, whereas the oversize-tail case represents varying the upper limit and the coarse upper-tail particle group while holding the Rosin–Rammler characteristic diameter fixed. Because the truncated arithmetic mean also changes with the upper limit, the PSD case is interpreted as a fixed-characteristic-diameter () condition rather than a fixed-mean-diameter condition. The two cases are simplifications of the different modes of particle-size variation that can arise during actual grinding and screening. The size criterion should therefore be specified not by a single nominal upper limit but by a distribution-based indicator, such as , that can represent the coarse-particle group. From this perspective, the objective of this study is not to propose a universally applicable nominal upper-limit value but to identify the particle-size indicator that should be prioritized in a main-burner WSR size specification.
2. Numerical Method
2.1. Burner Configuration
The system analyzed in this study is the main burner of a cement kiln, which has a multi-channel configuration designed to feed pulverized coal and WSR simultaneously. As shown in Figure 1, the burner tip is arranged concentrically, from the outermost channel inward, into an axial primary-air channel, a swirl primary-air channel, a pulverized-coal channel, a WSR channel, and an oxygen (O2, 99.9%) channel; each stream is supplied through an independent flow path that remains separated up to the burner-tip discharge plane. The swirl primary-air passage generates a strong rotating flow at the burner exit that produces a recirculation zone at the flame base, thereby promoting fuel–oxidizer mixing and flame attachment. Supplying pulverized coal and WSR through separate passages allows the heating, devolatilization, and combustion of each fuel to be distinguished by channel position, and the oxygen is modeled as a separate port so that local variations in oxidizer concentration are represented directly.
2.2. Computational Domain and Boundary Conditions
To simulate the flow and combustion behavior inside the kiln, a cylindrical domain with an inner diameter of 4.58 m and a length of 50 m was adopted as the computational domain (Figure 2). This type of rotary-kiln CFD approach has been widely used to analyze the internal flow, heat transfer, and reaction behavior of kilns [18,23,24,25]. To reflect realistic operating conditions, a rotational speed of 4 rpm and a no-slip condition were applied to the kiln wall, and the external heat loss was modeled with a heat-transfer coefficient of . A pressure-outlet boundary condition was imposed at the rear of the kiln to simplify the coupling with downstream equipment, which reproduces the inflow and exhaust driven by the pressure difference relative to the ambient. The secondary air, which is high-temperature air recovered from the clinker cooler, was introduced axially into the domain around the main burner through the kiln hood; this configuration reflects the heat-recovery flow of an actual cement kiln. The primary air was split between the axial and swirl passages at a mass ratio of 65:35 and held identical across all cases.
The present model resolves the gas phase and the dispersed fuel particles; the reactive solid clinker charge is not included directly and is accounted for only indirectly through the rotating-wall and external-heat-loss conditions.
In this study, the axial distance is measured from the burner tip taken as the origin (0 m) toward the kiln inlet. Because the clinker charge moves from the kiln inlet toward the discharge (burner) end, whereas the gas-phase combustion and heat release addressed here develop downstream from the burner tip, all subsequent axial profiles are presented with the burner tip placed at the right-hand origin.
The boundary conditions applied in the simulation were derived from the burner design specifications and field operating data, and the main input values are summarized in Table 1. These boundary conditions reflect the normal operating range of a Korean cement-kiln main burner and serve as the basis for the simulation to reproduce field conditions reliably.

Table 1.
Summary of boundary conditions for the CFD simulation.
| Category | Boundary condition | Unit | Value |
| Primary air | Axial mass flow rate | kg/s | 1.62 |
| Swirl mass flow rate | kg/s | 0.87 | |
| Inlet temperature | °C | 25 | |
| Secondary air | Mass flow rate | kg/s | 16.35 |
| Inlet temperature | °C | 900 | |
| Waste synthetic resin (WSR) | Reference particle size | mm | 15 (baseline) |
| Carrier-air velocity | m/s | 25 | |
| Inlet temperature | °C | 25 | |
| Oxygen (O2, 99.9%) | Mass flow rate | kg/s | 0.48 |
| Inlet temperature | °C | 25 | |
| Kiln wall | Rotational speed | rpm | 4 |
| Convective heat-loss coefficient | W/m²K | 15 |
2.3. Mesh Generation
The computational grid was generated using hexahedral elements as shown in Figure 3, and a grid-independence test was carried out to assess the sensitivity of the numerical solution to mesh resolution. The test was performed for three conditions centered on the reference grid (7,476,652 cells): a coarser grid with about 20% fewer cells (5,985,644) and a finer grid with about 50% more cells (11,245,902). The difference in the mass-flow-weighted average outlet temperature (, mass-flow-weighted average temperature) between the reference grid and the finest grid (about 11.2 million cells) was only about 1.9 °C (0.16%), which is negligible. Because this indicates that the solution converges within an engineering tolerance, the grid of 7,476,652 cells was selected as the final analysis model, balancing computational efficiency and accuracy.
It should be noted, however, that this grid-independence check was based on the mass-flow-weighted average temperature at the kiln outlet. Because and , which are used in the conclusions of this study, can be affected by the local grid distribution and the post-processing criterion, they are interpreted as case-to-case relative-comparison metrics obtained under the same grid and the same post-processing criterion rather than as absolute coordinate values. In an additional temperature-field comparison, the peak differences in the mass-flow-weighted and arithmetic mean temperatures between the medium and fine grids remained at about 0.33% and 1.3%, respectively, indicating that the temperature-field solution on the selected reference grid is sufficiently stable for engineering purposes.
2.4. Governing Equations and Physical Models
The CFD analysis was performed using the commercial code ANSYS Fluent (Release 2024) under a steady-state RANS (Reynolds-Averaged Navier–Stokes) framework [26]. The gas phase is treated with an Eulerian approach that solves the conservation equations within control volumes, while the WSR and pulverized-coal particles are tracked with a Discrete Phase Model (DPM) under Euler–Lagrange coupling, explicitly capturing the particle–fluid interaction and the heating, devolatilization, and char combustion of individual particles.
The gas-phase conservation equations are expressed in the form of mass (Eq. (1)), momentum (Eq. (2)), energy (Eq. (3)), and chemical species (Eq. (4)).
Here is the gas density, is the velocity vector, p is the pressure, is the viscous stress tensor, h is the specific enthalpy, is the effective thermal conductivity, is the diffusion flux of species j, is the mass fraction, and is the net production/consumption term due to chemical reaction. The terms , , , and are, respectively, the mass, momentum, energy, and species source terms transferred to the gas phase from the DPM particle interaction.
Turbulence was modeled with the Realizable k– model [27]. Unlike the standard k– model, this model treats not as a fixed constant but as a value that varies with the local flow field, and the coefficient in the equation is also computed dynamically from the local strain-rate and rotation-rate fields. Because of these features, it has been reported to provide superior predictive performance for strongly swirling and streamline-curvature flows compared with the standard model [28], making it suitable for the multi-channel swirl-burner environment considered here. The transport equations for k and follow the standard realizable-model form of the ANSYS Fluent Theory Guide [26], and the default model constants , , and were applied.
Because radiative heat transfer dominates the total heat transfer in high-temperature combustion environments, it was modeled separately using the Discrete Ordinates (DO) model [29]. As shown in Eq. (5), the DO model directly solves the transport equation for the radiation intensity along an arbitrary direction for a finite number of discrete directions.
Here a is the absorption coefficient, is the scattering coefficient, n is the refractive index, is the Stefan–Boltzmann constant, and is the phase function. The gas-phase absorption coefficient was evaluated using the weighted-sum-of-gray-gases (WSGG) model proposed by Smith et al. [30], and particle-phase radiation interaction was activated for the DPM particles so that absorption and emission at the particle surfaces are directly accounted for.
The fuel particle phase was tracked in the Lagrangian DPM framework through the equation of motion in Eq. (6).
Here is the particle velocity, is the particle density, is the particle diameter, is the gas viscosity, is the drag coefficient, is the particle Reynolds number, and denotes additional forces (virtual mass, Saffman lift, etc.). In this study the spherical drag law was adopted, evaluating as a function of [31]. Particle dispersion in the turbulent flow was modeled with the Discrete Random Walk (DRW) model. Although actual crushed WSR fragments are closer to angular than spherical, no reliable shape factor is available for crushed WSR, and because this assumption is applied consistently across all cases, the spherical drag law was retained here as a standard first-order approximation.
Particle heating proceeds through the energy balance of Eq. (7) under a lumped-capacitance assumption, and devolatilization begins once the particle temperature reaches the devolatilization onset temperature.
Here is the particle mass, is the specific heat, is the particle temperature, is the convective heat-transfer coefficient, is the particle surface area, is the radiation temperature, is the particle emissivity, and is the latent heat of devolatilization; because is the rate of change of particle mass (a signed rate that is negative during mass loss by devolatilization), the latent-heat term acts as an endothermic sink. Because this lumped formulation does not directly compute the internal temperature gradient of the particle, its accuracy decreases for large particles whose Biot number is not sufficiently small. Since larger particles actually develop steeper internal temperature gradients, this assumption tends to underestimate the devolatilization delay of large particles. Consequently, the obtained for large-particle conditions may predict the internal thermal resistance and devolatilization delay somewhat optimistically, and near-boundary size classifications should be interpreted within this model limitation.
Devolatilization was modeled with a single-kinetic-rate model, expressed by the first-order rate equation in Eq. (8) [32,33].
Here V is the cumulative amount of volatiles released, is the volatile yield potential, and A and E are the pre-exponential factor and the activation energy, respectively. This study applied to WSR the same single-kinetic-rate model constants widely used for coal devolatilization [32,33]. Specifically, the pre-exponential factor and the activation energy —values averaged by Torresi et al. [33] from the weakly swelling coal data of Badzioch and Hawksley [32]—were used. The volatile yield potentials were set from the proximate-analysis values in Table 2 to for pulverized coal and for WSR. Because actual WSR is a mixed-waste-derived fuel, its devolatilization kinetic constants may vary with the source and composition, and this single-rate expression cannot resolve the detailed devolatilization process specific to WSR. Since a change in the kinetic constants can also change the absolute position of and the near-boundary classification, the size limits proposed in this study should be interpreted not as universally validated absolute criteria but as conditional screening results obtained under the present kinetic assumptions. Nevertheless, because the same kinetic assumptions are applied consistently across all cases, they can be used for relative comparison of the effect of particle-size variation.
Table 2.
Proximate analysis, ultimate analysis, HHV, and reference particle size of pulverized coal and WSR.
Table 2.
Proximate analysis, ultimate analysis, HHV, and reference particle size of pulverized coal and WSR.
| Parameter | Pulverized coal | WSR |
| Proximate analysis (ad, wt fraction) | ||
| Moisture | 0.0156 | 0.010 |
| Ash | 0.2280 | 0.015 |
| Volatile matter | 0.2531 | 0.5500 |
| Fixed carbon | 0.5033 | 0.4250 |
| Ultimate analysis (daf, wt fraction) | ||
| C | 0.6517 | 0.6107 |
| H | 0.0484 | 0.0706 |
| O | 0.2946 | 0.3014 |
| N | 0.0032 | 0.0053 |
| S | 0.0021 | 0.0120 |
| Heating value & particle size | ||
| HHV | 6259.7 kcal/kg (26.2 MJ/kg) | 5412.0 kcal/kg (22.7 MJ/kg) |
| Reference particle size | 30 m | 15 mm |
Char combustion after devolatilization was treated with a kinetic/diffusion-limited surface-reaction model, in which the smaller of the surface chemical-reaction rate and the oxidizer surface-diffusion rate governs the combustion rate. Meanwhile, because the present DPM assumes WSR to be a non-melting solid particle (spherical drag), the phase-change effects associated with the thermoplastic softening and melting described in the Introduction lie outside the model scope. If softening, coalescence, deformation, or wall deposition alters the actual particle behavior, this non-melting model may predict quantitatively different rear-zone persistence and thermal-conversion locations for the largest particle group. The upper size limits derived from this model should therefore be interpreted as conditional numerical criteria jointly defined by the kinetic constants, the non-melting DPM assumption, and the simulated operating conditions.
Gas-phase combustion reactions were treated with the Finite-Rate/Eddy-Dissipation (FR/ED) model. As in Eq. (9), the FR/ED model adopts the smaller of the Arrhenius-based chemical-reaction rate and the eddy-dissipation rate of Magnussen and Hjertager [34], thereby reasonably representing the turbulence–chemistry interaction.
2.5. Numerical Solution and Convergence
The governing equations were solved with the pressure-based steady-state solver of ANSYS Fluent, and the SIMPLE algorithm was applied for pressure–velocity coupling. The convective terms were discretized with a second-order upwind scheme, and the angular discretization of the DO radiation model was set to 5×5. A standard wall function was applied for the near-wall turbulence treatment; the maximum at the kiln wall on the present grid was about 297, within the recommended range (30–300) for standard wall functions. Convergence required, first, that the scaled residuals of all governing equations stabilize below for continuity, momentum, turbulence, and species, and below for energy. In addition, key physical quantities—such as the area-weighted average outlet temperature and the mass-flow-weighted average temperature inside the kiln—had to reach a quasi-steady state without long-term drift over the iterations. Convergence was judged to be achieved when both of these conditions were satisfied.
2.6. Fuel Properties and Case Setup
2.6.1. Fuel Characterization
The proximate analysis (air-dried basis, ad), ultimate analysis (dry ash-free basis, daf), and higher heating value (HHV) of the pulverized coal and WSR used in this study are summarized in Table 2. The proximate analysis gives the wt% distribution of moisture, volatile matter, fixed carbon, and ash, while the ultimate analysis gives the C, H, N, S, and O composition of the combustible fraction excluding moisture and ash. The compositions of the two fuels listed in the table reflect the average characteristics of each source and may vary with the actual source and processing conditions. The HHV is 6259.7 kcal/kg (26.2 MJ/kg) for the pulverized coal and 5412.0 kcal/kg (22.7 MJ/kg) for the WSR, and the reference particle sizes were defined as a representative pulverized-coal diameter and a single WSR diameter . Compared with the pulverized coal, the WSR shows lower moisture and ash, higher volatile matter, and higher oxygen and fixed-carbon contents, characteristic of a mixed waste-synthetic-resin fuel. These compositional differences reflect that WSR is not a single polymer but a waste-derived fuel in which various waste plastics and organic components are mixed.
The gas-phase oxidation reactions derived by entering the compositions of Table 2 into the ANSYS Fluent Coal Calculator module are summarized in Table 3. The volatiles are partially oxidized in a first reaction to produce CO and H2O, and the CO formed is further oxidized to CO2 by combining with residual oxygen in a second reaction. This two-step formulation represents, more reasonably than a single-step reduction, the flame structure in which CO temporarily accumulates in the locally oxygen-deficient environment of the main-burner flame region and is then further oxidized in the downstream oxidation zone.
Table 3.
Stoichiometric combustion reactions for pulverized coal and waste synthetic resin (WSR) derived from the Coal Calculator output.
Table 3.
Stoichiometric combustion reactions for pulverized coal and waste synthetic resin (WSR) derived from the Coal Calculator output.
| Fuel | Reaction |
| Pulverized coal | Coal + 0.55 O2 → 0.76 CO + 1.43 H2O + 0.0068 N2 + 0.0039 SO2 |
| Waste synthetic resin | WSR + 0.97 O2 → 1.34 CO + 1.24 H2O + 0.0067 N2 + 0.0132 SO2 |
| CO oxidation | CO + 0.5 O2 → CO2 |
2.6.2. Heat-Based Substitution and Case Matrix
The fuel-feeding conditions of this study were defined on the basis of the equivalent heat input relative to the coal-only operating condition. The total heat input , computed from the pulverized-coal mass flow rate confirmed from the field operating data, was kept identical under the WSR co-firing conditions, and the heat corresponding to the reduced pulverized coal is supplied by WSR. This equivalent-heat-input condition allows only the combustion behavior associated with the change in fuel composition to be isolated and evaluated under the same thermal load. The mass flow rates of pulverized coal and WSR are determined from the following energy-conservation relation.
Here and are the higher heating values of each fuel, is the mass flow rate of each fuel, and the subscript 0 denotes the coal-only condition.
This study set the analysis target to the actual field operating point at which the pulverized-coal mass flow rate is reduced to 7.5 t/h, at which the WSR thermal substitution rate (TSR) is ≈21%. This operating point lies within the 10–30% range reported as the early-stage application range for alternative-fuel co-firing in Korea and internationally, making it suitable for quantitatively analyzing the effect of alternative-fuel application while minimizing variation in clinker burning quality and thermal load. In other words, this analysis is designed on the basis of the actual operating point of a demonstration facility rather than an idealized assumption. Because WSR has a lower higher heating value than pulverized coal, the total fuel mass flow rate required to satisfy the equivalent-heat-input condition increases by about 3.3% relative to the coal-only condition. The fuel feed rates for each condition are summarized in Table 4.
Table 4.
Fuel mass flow rates for coal-only and WSR co-firing at equivalent heat input.
| Condition | (kg/s) | (kg/s) | Total fuel flow (kg/s) |
| Coal only( t/h) | 2.6389 | 0 | 2.6389 |
| WSR co-firing(≈21% thermal substitution) | 2.0833 | 0.6426 | 2.7259 |
The particle-size effect in this study is evaluated by two methods: a single-diameter (SD) condition and a particle-size-distribution (PSD) condition. In the SD condition, all WSR particles are assumed to have the same diameter, and the single diameter is varied over five levels of 5, 10, 15, 20, and 25 mm to resolve the combustion response curve to particle-size variation in detail. In the PSD condition, the characteristic diameter is held fixed while the upper size limit is varied to 20, 25, 30, and 35 mm to evaluate the effect of the oversize limit on the devolatilization-completion location and the thermal confinement within the sintering zone. The cumulative undersize fraction of the Rosin–Rammler distribution is expressed by Eq. (11).
Here d is the particle diameter, is the characteristic diameter of the Rosin–Rammler distribution (the 63.2% cumulative passing diameter), and n is the spread parameter representing the uniformity of the distribution. A larger n gives a narrower, more uniform distribution, whereas a smaller n increases the fraction of coarse particles. In this study the ANSYS Fluent DPM injection was set with a characteristic diameter and a spread parameter , and this Rosin–Rammler distribution was discretized into 15 diameter intervals for injection. By keeping these reference parameters (characteristic diameter, spread parameter, and number of discretization intervals) identical across the PSD series (PSD1–PSD4), the effect of extending the upper cutoff alone was isolated while the characteristic diameter and spread parameter were held fixed. The upper size limits of the PSD cases were set to 20, 25, 30, and 35 mm (Table 5), and the DPM injection was constructed from the Rosin–Rammler distribution using the same discretization criterion. That is, in the reference PSD series the characteristic diameter, spread parameter, and number of discretization intervals are kept identical and only the upper cutoff is varied. The conditions of the five single-diameter cases (SD1–SD5), the eight main particle-size-distribution cases (PSD1–PSD8), and the two shifted-distribution check cases (PSD9–PSD10) used to confirm a whole-distribution shift are summarized in Table 5, and all cases commonly maintain the TSR ≈21% condition. PSD1–PSD4 use a broad distribution () and PSD5–PSD8 a narrow distribution (), so that the sensitivity to distribution shape is also examined. Because pulverized coal is not a particle-size variable in this study, its size distribution was not computed individually; a single representative diameter , corresponding to the mean of the distribution, was applied as a constant and kept identical across all cases. The Rosin–Rammler size-distribution curves of the four PSD cases are presented in Figure 4.
Table 5.
Particle size case matrix for SD and PSD analyses at ≈21% thermal substitution.
| Case ID | Distribution type | Size param. (mm) | Spread parameter n | (mm) | Arithmetic mean (mm) | (mm) |
| SD1 | Single diameter | 5 | — | — | 5 | 5 |
| SD2 | Single diameter | 10 | — | — | 10 | 10 |
| SD3 | Single diameter | 15 | — | — | 15 | 15 |
| SD4 | Single diameter | 20 | — | — | 20 | 20 |
| SD5 | Single diameter | 25 | — | — | 25 | 25 |
| PSD1 | Rosin–Rammler | 15 | 1.2 | 20 | 11.4 | 17.7 |
| PSD2 | Rosin–Rammler | 15 | 1.2 | 25 | 13.0 | 21.3 |
| PSD3 | Rosin–Rammler | 15 | 1.2 | 30 | 14.2 | 24.4 |
| PSD4 | Rosin–Rammler | 15 | 1.2 | 35 | 15.2 | 26.9 |
| PSD5 | Rosin–Rammler | 15 | 3.0 | 20 | 12.8 | 17.9 |
| PSD6 | Rosin–Rammler | 15 | 3.0 | 25 | 13.6 | 19.7 |
| PSD7 | Rosin–Rammler | 15 | 3.0 | 30 | 13.8 | 19.9 |
| PSD8 | Rosin–Rammler | 15 | 3.0 | 35 | 13.8 | 19.9 |
| Shifted-distribution check cases | ||||||
| PSD9 | Rosin–Rammler, shifted check | 10 | 1.2 | 13 | 8.5 | 11.9 |
| PSD10 | Rosin–Rammler, shifted check | 20 | 1.2 | 27 | 14.3 | 23.5 |
The main size-related terms used in Table 5 are defined as follows and applied consistently across all subsequent cases. Single diameter d: the diameter assigned identically to all WSR particles in the SD cases. Characteristic diameter : the 63.2% cumulative passing diameter of the Rosin–Rammler distribution (the ANSYS Fluent input value). Truncated arithmetic mean: the mass-mean diameter of the distribution truncated and renormalized over () (the arithmetic-mean column of Table 5). Upper limit : the upper diameter of the truncation interval. Coarse-particle diameter : the 90th-percentile diameter of the injected distribution (the last column of Table 5). These terms are not used interchangeably.
The 15 mm of the PSD cases is the Rosin–Rammler characteristic diameter entered into Fluent (63.2% cumulative undersize) and is distinguished from the actual arithmetic-mean diameter in the last column of the table. The arithmetic mean was computed from the distribution truncated and normalized over – (), which coincides with the DPM injection lower bound applied in all CFD cases. PSD9 and PSD10 are not simple extensions of the existing PSD matrix; they are shifted-distribution check cases in which the broad-distribution shape (, ) is retained while is shifted to 10 mm and 20 mm.
2.6.3. Sectional Averaging and Sintering-Zone Definition
In the CFD results, the temperature distribution over an axial kiln cross-section is difficult to reduce to a single representative value, because regions of distinct physical character—such as the high-velocity main flow, the recirculation zone, and the local high-temperature core near the burner—coexist within a section. To enable a quantitative comparison of the results, this study used three averaging methods in parallel, each reflecting different physical information.
The mass-flow-weighted average temperature , given by Eq. (12), is weighted by the mass flow rate passing through the section and reflects the thermal energy actually transported by the combustion gas.
The area-weighted average temperature , given by Eq. (13), is weighted by the cell area and evaluates the spatial temperature uniformity of the whole section independently of the velocity distribution.
The arithmetic mean temperature , given by Eq. (14), is the simple average of the grid-cell values and sensitively reflects changes in the local high-temperature region within the section.
Here is the density at grid face i [kg/m³], is the face-normal velocity [m/s], is the cell area [m²], is the grid-cell temperature [K], and N is the total number of grid cells in the section. In this study, was used as a macroscopic indicator of the overall gas-phase thermal level in the sintering zone, while the devolatilization-based thermal confinement was evaluated primarily using . was used as an auxiliary indicator of sectional spatial uniformity, and as an auxiliary indicator of the change in local thermal intensity of the flame core. However, because averages each cell with equal weight regardless of volume or transported mass flow, it relatively emphasizes the dense high-temperature cells near the burner and the local flame core and can be sensitive to the grid distribution. Therefore, it is not used here as a sole indicator of the heat actually transported by the gas or of the absolute heat balance; instead, under the same grid and post-processing criteria for all cases, it is limited to reading the relative changes in the position, intensity, and spatial sharpness of the local flame core.
The sintering zone is the high-temperature interval where the mineral-forming reactions of the cement clinker proceed and is the most important region in evaluating the kiln thermal process. The interior of the kiln is divided into the calcination zone (~900 °C), the transition zone (900–1250 °C), and the sintering zone (1250–1450 °C) [10]; for successful clinkerization, the solid feed temperature must reach 1250–1450 °C, which is known to require a maximum flame temperature of about 2000 °C or higher [8,14]. In this study, the interval 5–20 m from the burner tip was fixed as the sintering-zone evaluation interval, consistent with the sintering-zone mean-temperature evaluation interval used in a prior CFD study of the same kiln [22]. The baseline gas-temperature results (Figure 5, Table 6) are presented in Section 3.1.
Table 6.
Coal-only cross-sectional gas temperatures over the 5–20 m sintering-zone segment.
| Indicator | Temperature (°C) | Contextual reference range |
| (mass-flow-weighted) | 1784 | ≥1250 [10] |
| (arithmetic, peak) | 2330 | ≥2000 [8,14] |
| (area-weighted) | 1584 | – |
This interval was fixed in advance as the reference region for judging whether the devolatilization-completion location remains within the sintering zone. If devolatilization is completed before entering the sintering zone (5 m), it is classified as Front-shifted; if completed within the sintering zone (5–20 m), as Complete; and if it exceeds the rear boundary (20 m), as Incomplete. Here Complete/Incomplete does not denote char burnout or overall combustion completion but is a classification name indicating whether the devolatilization-completion location of Eq. (15) is confined within the sintering zone. Among the Complete conditions, cases with a small margin to the rear boundary are noted separately in the text because they provide insufficient buffering against distribution deviation and oversize contamination.
(sectional spatial uniformity) and (local flame core) are applied consistently as auxiliary indicators in the subsequent case comparisons (see Section 3.1 and Table 6 for values).
2.6.4. Devolatilization-Completion Indicators
To quantitatively track the active devolatilization region, the ignition location and the devolatilization-completion location are defined based on the cross-section-integrated volatile-release rate as in Eq. (15).
Here is the threshold ratio for judging ignition and completion, set to (5%) in this study. This 5% threshold is a post-processing criterion to avoid over-interpreting a residual numerical tail as the completion location, and it was applied identically to all cases. The absolute position of and near-boundary classifications are therefore conditional on this threshold and are interpreted as relative-comparison metrics with the same applied to all cases. Because and are evaluated in axial grid increments of 0.5 m, differences smaller than this are regarded as within the resolution limit. This criterion is a post-processing metric for the relative comparison of devolatilization-release locations between cases and does not imply complete combustion or an emission standard.
To represent the coarse-particle characteristic of the injected distribution as a single scalar, the 90th-percentile diameter is used. is computed analytically from the truncated and renormalized Rosin–Rammler distribution and is the diameter below which 90% of the mass of the injected distribution lies. The values for each case are summarized as an additional column in Table 5 (for the SD cases, because they are single-diameter).
3. Results and Discussion
3.1. Effect of WSR Co-Firing on Combustion Characteristics: Baseline Comparison
Before analyzing the WSR particle-size effect, this section compares the coal-only combustion condition (baseline, WSR 0%) with a condition in which WSR of a single diameter is co-fired at TSR ≈21%, in order to establish the reference change in flame structure and temperature distribution caused by introducing WSR. This baseline comparison serves as the reference for distinguishing the particle-size effect from the effect of co-firing itself in the parametric analysis of the following sections.
The higher heating value (HHV) of WSR is about 13.5% lower than that of pulverized coal (Table 2), and its applied particle size is about 500 times larger than that of pulverized coal. In particular, the large particle size increases the particle heating time and the devolatilization delay, acting as the main cause of changes in flame shape and temperature distribution.
For the coal-only combustion condition (baseline, WSR 0%), the axial gas-temperature distribution over the sintering-zone segment (5–20 m) is shown in Figure 5, and the representative temperatures for the segment are given in Table 6. The mass-flow-weighted average temperature and the sectional arithmetic-mean peak temperature are qualitatively consistent with the high-temperature flame level reported in the literature for clinker sintering. Because the present model does not directly include the clinker bed, however, this gas-phase temperature is not interpreted directly as the clinker solid temperature or as a quality indicator.
Figure 6 compares the axial kiln temperature distribution under the coal-only combustion condition (baseline, WSR 0%) and the WSR co-firing condition (≈21% thermal substitution, ) using two averaging methods. The mass-flow-weighted average temperature (Figure 6(a)), which reflects the actual heat distribution of the main flow, and the arithmetic mean temperature (Figure 6(b)), which is sensitive to changes in the local high-temperature region within a section, were computed together so that the macroscopic heat distribution and the local flame structure could be examined side by side.
In terms of (Figure 6(a)), the coal-only condition reaches a single maximum temperature of about 1860 °C over the interval about 12–14 m from the burner tip and shows a relatively flat high-temperature distribution within the sintering zone (5–20 m). This suggests that the rapid devolatilization and volatile combustion enabled by the small particle size of pulverized coal () proceed efficiently within the main flow. Under the WSR co-firing condition, the peak location is almost unchanged while the maximum temperature decreases slightly by about 20 °C, and the gap relative to the coal-only case widens progressively from the rear of the sintering zone (15–20 m) to the rear end (50 m), reaching about 220 °C at 50 m. This indicates that the relatively large thermal inertia of the 15 mm single-diameter WSR particles (a slow thermal response due to the reduced surface-to-volume ratio) spatially disperses the heat-release density within a unit cross-section of the main flow and delays part of the heat release toward the rear of the sintering zone.
In terms of (Figure 6(b)), the difference between the two conditions is more pronounced. The coal-only condition forms a single maximum temperature of about 2330 °C over about 6–8 m from the burner tip and maintains a relatively flat high temperature over 5–15 m. In contrast, the WSR co-firing condition shows a dual peak split into a first peak (about 2230 °C) at about 6.5 m and a second peak (about 2120 °C) at about 13 m. The first peak is mainly the front high-temperature region created by the rapid combustion of pulverized-coal volatiles; at the same time, the particle heat absorption during the heating and devolatilization of the WSR particles acts to lower the maximum temperature relative to the coal-only condition. The second peak is the delayed heat release created by the devolatilization and char combustion of the large WSR particles, which becomes significant only downstream because of their slow heating. This dual peak is a characteristic behavior that appears under the monodisperse (SD) idealization in which all WSR particles are treated as a single 15 mm diameter; when an actual size distribution is applied, the heat release of the small and large particles overlaps spatially, so the dual peak is alleviated and the flame-core maximum temperature changes. This behavior under PSD conditions is analyzed in Section 3.3.
The primary cause of the axial separation of the dual peak is not the volatile-matter content but the devolatilization delay due to the slow heating of large particles. Whereas pulverized coal heats and devolatilizes rapidly, large WSR particles undergo delayed devolatilization and volatile release downstream because of their large thermal inertia [35]. To this is added the sequential heat-release behavior of the char reaction after volatile combustion, which is commonly observed in solid-fuel combustion [36,37]. Therefore, the volatile-matter content is interpreted not as a direct cause of the axial separation of the dual peak but as a factor that adjusts the relative magnitude of the front volatile-driven peak. Table 7 shows that even though the WSR VM content is identical across all cases, the second-peak location shifts rearward in step with the increase in , confirming that the cause of the dual-peak separation is not the VM content.
Table 7.
Ignition locations and dual-peak positions for the five SD cases.
| (mm) | VM (wt%, daf) | (m) | 1st peak (m) | 1st peak (°C) | 2nd peak (m) | 2nd peak (°C) |
| 5 | 55.0 | 2.0 | 3.0 | ~2050 | 10.5 | ~2180 |
| 10 | 55.0 | 5.0 | 5.5 | ~2170 | 11.5 | ~2160 |
| 15 | 55.0 | 7.0 | 6.5 | ~2230 | 13.0 | ~2120 |
| 20 | 55.0 | 10.5 | 10.0 | ~2260 | 17.0 | ~1830 |
| 25 | 55.0 | 18.5 | 10.5 | ~2260 | >20a | —a |
a The 2nd peak for the 25 mm case forms outside the sintering zone (rear boundary 20 m).
This dual peak, meanwhile, is distinct in the arithmetic mean but does not appear in the mass-flow-weighted mean . In computing , a relatively low mass-flow weight is assigned to the flame core, which is hot, of low density (), and of small cross-sectional area. Therefore, even if the location of the local high-temperature core shifts, represents the bulk temperature of the dense, wide-area main flow and does not change greatly (the definitions of the averaging methods are given in Section 2.6.3). In contrast, averages all grid cells with equal weight and is therefore sensitive to changes in the location and intensity of the local high-temperature core. Accordingly, the change in the heat-release structure of WSR co-firing is fully revealed only when the macroscopic heat distribution () and the local flame structure () are examined together.
Figure 7 compares the axial-plane temperature isotherm distributions of the two conditions. Under the coal-only condition (Figure 7, top), the high-temperature core above 2000 °C (red shading) forms a single continuous region over about 3–17 m from the burner tip, surrounded by several lower-temperature isotherms to constitute one cohesive flame core. This is because the pulverized-coal particles devolatilize and burn rapidly just after the burner tip, so the heat release is concentrated in a single continuous interval.
In contrast, under the WSR co-firing condition (Figure 7, bottom), the maximum temperature is somewhat lower while the connectivity of the high-temperature core defined by changes markedly. Over about 9–11 m between the front core near the burner (about 3–9 m) and the rear core downstream (about 11–15 m), the region above 2000 °C is disconnected, so a dual structure appears. The front core and the rear core are interpreted as the spatial separation of the coal-driven front heat release and the WSR delayed heat release discussed above. The isotherm comparison of Figure 7 is therefore interpreted not as a mean-temperature judgment but as a qualitative flame-structure indicator that shows the connection/disconnection locations of the high-temperature core above 2000 °C. To provide an auxiliary quantification of this behavior, the axial high-temperature-core segments with were defined as and the total length of these segments as . Each boundary was determined by extracting, at the post-processing resolution, the front and rear axial coordinates over which the high-temperature region exists in the axial-plane isotherms of Figure 7. Therefore, is not a mean-temperature-based heat metric but an auxiliary morphological indicator representing the axial connection length of the high-temperature core above 2000 °C. Under the coal-only condition, appeared as a single continuous region of about 3–17 m, giving . In contrast, under the WSR co-firing condition, the high-temperature core split into two segments of about 3–9 m and 11–15 m, reducing the total to . This corresponds to a reduction of about 29% in the high-temperature-core length and shows that WSR co-firing induced not a simple flame elongation but an axial separation of the high-temperature core and a reduction of its connection length.
The features shared with prior RDF/SRF co-firing studies are a reduction in mean flame temperature and a weakening of flame intensity. Haas and Weber [14] reported that with RDF co-firing the flame zone shifts downstream and the mean flame temperature decreases, and Kroumian et al. [13] observed a decrease in flame intensity with the coarsening of SRF particles. However, under the main-burner conditions of this study, the high-temperature core is not simply expanded or lengthened; rather, it separates into a coal-driven front core and a rear core due to the WSR delayed heat release, so that the effective high-temperature-core length instead decreases. The distinguishing point of this study is therefore that, on top of the common trend of flame weakening with alternative-fuel co-firing, it additionally presents the qualitative structural change of the axial separation of the high-temperature core above 2000 °C and the reduction of its connection length. However, like the dual peak mentioned above, this high-temperature-core separation has the character of the SD monodisperse idealization and can be alleviated for an actual grinder-outlet size distribution, as shown in Section 3.3.
The primary cause of these changes is the thermal inertia arising from the WSR particles being about 500 times larger than the pulverized coal, and the resulting devolatilization delay. The next section examines the changes in flame structure and temperature distribution through a parametric analysis with WSR particle size as the independent variable.
3.2. Effect of WSR Particle Size on Combustion Characteristics
Because particle size simultaneously governs the specific surface area, the particle heating time, the volatile-release rate, and the location at which the char reaction follows, elucidating how it reorganizes the flame structure and where it shifts the heat-release region is key to understanding and controlling the main-burner temperature field in WSR co-firing. This section sets the WSR single diameter as the independent variable and, with the same TSR condition and the pulverized-coal reference diameter () held fixed, quantitatively compares and analyzes the effect of particle-size variation on the temperature distribution, volatile-release behavior, and centerline CO reaction progress over the interval from the main burner to the sintering zone (SD cases, Table 5).
Figure 8 compares the axial kiln temperature distribution of the five cases SD1–SD5 using the two averaging methods (, ).
In terms of (Figure 8(a)), the three cases in the range – converge to similar maximum temperatures (about 1820–1840 °C) and peak locations (about 11–13 m from the burner tip). This suggests that the WSR particles in this range all complete their main heat release within the sintering zone, so the main-flow mean heat distribution itself is not very sensitive to particle-size variation. In the condition, the peak temperature and location are similar to the 5–15 mm range, but the residual temperature near the sintering-zone rear boundary (20 m) is about 1581 °C, about 75 °C higher than the 1501–1507 °C of the 5–15 mm cases. In the condition, the peak location does not differ greatly from the other cases (about 11.5 m), but the gap widens further beyond the sintering-zone boundary, with about 1458 °C observed at 25 m. This residual temperature rise is therefore interpreted as an auxiliary observation showing that the temperature-distribution characteristics of the sintering-zone rear change under large-particle conditions; the size suitability or the thermal confinement within the sintering zone is not judged by mean temperature alone. In this study, the judgment was made using both the devolatilization-completion location described below and the downstream persistence location of the centerline CO-rich region.
In terms of (Figure 8(b)), differences in local flame structure clearly appear even among the 5–15 mm cases that had converged in . In particular, in the and conditions, a dual-peak pattern consisting of a first and a second peak clearly forms within the sintering zone (10 mm: first peak about 2170 °C at 5.5 m, second peak about 2160 °C at 11.5 m, minimum between the two peaks about 1910 °C; 15 mm: first peak about 2230 °C at 6.5 m, second peak about 2120 °C at 13 m, minimum between the two peaks about 1870 °C). This is the result of the monodisperse-idealization dual-peak behavior confirmed earlier in Figure 6(b) varying with particle size. Even when both peaks are located within the sintering zone, the amplitude of the dual peak is most pronounced in the 15 mm condition, with a gap of about 360 °C between the first peak and the minimum, and within the 5–15 mm range the absolute temperature of the first peak is also highest in the 15 mm condition. Even in the 5 mm condition a first peak (about 2050 °C at 3 m) and a second peak (about 2180 °C at 10.5 m) form, but because the first peak is located before the sintering-zone entrance (5 m), part of the effective heat release within the sintering zone is lost.
The relatively low first-peak temperature (about 2050 °C) in the 5 mm condition is explained by endothermic interference from WSR devolatilization. In the 5 mm condition, and , so WSR devolatilization is completed over 2–4.5 m just after the burner tip. Because this interval overlaps spatially with the first peak (about 3 m) driven by pulverized-coal volatile combustion, the endothermic devolatilization of the WSR particles acts to lower the local gas temperature and suppresses the first-peak temperature. In the 10 mm condition, WSR devolatilization shifts to 5–7.5 m, partially overlapping the first peak (about 5.5 m); the endothermic interference decreases, and the first-peak temperature rises to about 2170 °C.
In the 15 mm condition, the WSR ignition location shifts to , downstream of the first peak (6.5 m), so that WSR devolatilization endothermy is almost uninvolved at the time of first-peak formation. As a result, the first-peak temperature is about 2230 °C, the highest among the SD cases. In the 20–25 mm conditions, WSR ignition is delayed to 10.5 m and 18.5 m, respectively, so the endothermic interference at the first-peak location (about 10–11 m) effectively disappears, and the first-peak temperature converges to about 2260–2265 °C. That is, the gradual rise of the first-peak temperature arises because the WSR devolatilization region retreats downstream of the first peak with increasing diameter, reducing the endothermic interference.
In the and conditions, the first peak at about 10–11 m (about 2260 and 2265 °C, respectively) is dominant, and the second peak weakens markedly, shifting toward the sintering-zone rear so that its boundary with the first peak blurs. Because the internal devolatilization of the WSR particles is not completed near the first peak but continues downstream, the second peak that would otherwise form overlaps the first peak or is dispersed toward the sintering-zone rear. In the 20 mm condition, a weak secondary heat-release recovery of about 1820 °C is observed near about 17 m in the rear of the sintering zone, and in the 25 mm condition a secondary peak of about 1550 °C forms at about 24–25 m, beyond the sintering-zone rear. The latter is the result of the WSR-related rear heat release continuing past the sintering-zone boundary and is spatially consistent with the devolatilization-completion distance () described below.
To identify the direct cause of the flame-structure change at the particle level, the spatial distribution of the per-particle volatile-release rate of the DPM particles was analyzed. Figure 9 compares the axial spatial distribution over which volatile release (active pyrolysis) occurs for three representative conditions (, 15, ). In the 5 mm condition, pyrolysis is concentrated in a narrow interval just after the burner tip; in the 15 mm condition, the active-pyrolysis interval forms in the front half of the sintering zone; and in the 25 mm condition, the active-pyrolysis interval clearly extends rearward beyond the sintering-zone boundary.
To convert this qualitative observation into a quantitative indicator, the ignition location and the devolatilization-completion location defined in Section 2.6.4 (Eq. (15), ) were applied to all cases with the same criterion. Because and are evaluated in axial grid increments of 0.5 m, location differences within 0.5 m are within the spatial-resolution limit and are interpreted as identical, and overshoots or shortfalls on the order of 0.5 m near the boundary (20 m) are not regarded as significant differences.
Table 8 summarizes , , the devolatilization span, the overshoot beyond the sintering-zone rear boundary (20 m), and the overall assessment for all of SD1–SD5. Completion here means not absolute combustion completion (complete combustion including char burnout) but whether volatile release (devolatilization) is completed within the sintering-zone rear boundary (20 m); depending on the relation between and the sintering-zone boundary, it is classified as Front-shifted if devolatilization ends before entering the sintering zone (5 m), Complete if completed within the sintering zone (5–20 m), and Incomplete if it exceeds the rear boundary (20 m). Among the Complete conditions, cases with a small rear margin (e.g., 20 mm, margin 3.5 m) provide insufficient buffering against oversize deviation and are noted separately in the text. The limitation of temperature indicators for judging confinement based on the devolatilization-completion location is treated quantitatively in Section 3.3.
Table 8.
Ignition and devolatilization-completion locations for the five SD cases at ≈21% thermal substitution. The sintering zone is defined as 5–20 m from the burner tip (Section 2.6.3).
Table 8.
Ignition and devolatilization-completion locations for the five SD cases at ≈21% thermal substitution. The sintering zone is defined as 5–20 m from the burner tip (Section 2.6.3).
| (mm) | (m) | (m) | Dev. span (m) | Overshoot (m) | Assessment |
| 5 | 2.0 | 4.5 | 2.5 | 0.0 | Front-shifted |
| 10 | 5.0 | 7.5 | 2.5 | 0.0 | Complete |
| 15 | 7.0 | 10.5 | 3.5 | 0.0 | Complete |
| 20 | 10.5 | 16.5 | 6.0 | 0.0 | Complete |
| 25 | 18.5 | 22.0 | 3.5 | 2.0 | Incomplete |
In the range –, both and are located within the sintering zone (5–20 m), so devolatilization is completed within the sintering zone. In contrast, the 5 mm condition, with and , is a front-shifted case in which devolatilization ends before the start of the sintering zone (5 m); it has no rear overshoot but is distinguished from the 10–15 mm cases in that the heat release is biased ahead of the sintering-zone entrance. As the diameter increases, both and shift rearward, which is a direct result of the increase in heating and devolatilization time due to the decreased specific surface area; the larger the particle, the more the devolatilization and combustion reactions move beyond the sintering-zone rear, lowering the effective heat input within the sintering zone. In the 20 mm condition, remains within the sintering zone, but the margin to the rear boundary (20 m) is only 3.5 m. Therefore, in field application, could exceed the sintering zone depending on the deviation of the grinder-outlet size distribution, so it is assessed as a Complete but small-rear-margin condition. In the 25 mm condition, exceeds the sintering-zone boundary by 2.0 m, meaning that volatile release continues beyond the sintering-zone rear defined in this study. The devolatilization span, however, decreases from 6.0 m for 20 mm to 3.5 m for 25 mm; this is because ignition itself is delayed to a more rearward high-temperature region () in the 25 mm condition, so the surrounding temperature at ignition is high and devolatilization concentrates within a short interval. The conversion rate did not increase; rather, the starting point moved rearward, and still exceeds the sintering-zone boundary.
The five conditions of Table 8 are divided into three devolatilization-completion categories (front-shifted, complete, incomplete) according to the relation between and the sintering-zone rear boundary (20 m), and the representative behavior of each category is presented schematically in Figure 10.
Figure 11 compares the CO mass-fraction contours of three representative conditions (, 15, ). As the diameter increases, the CO high-concentration region shifts rearward (consistent with the temperature distribution of Figure 8 and the trend of Table 8), and in the 25 mm condition the CO high-concentration region exceeds the sintering-zone rear (20 m) and persists to about 24 m. This shows that not only devolatilization but also volatile oxidation is pushed outside the sintering zone.
Figure 11.
CO mass fraction contours along the kiln axis at ≈21% thermal substitution for three discrete WSR particle diameters: mm (top), 15 mm (middle), and 25 mm (bottom). Distance is measured in meters from the burner tip; CO mass fraction (–) is given by the common colorbar.
Figure 11.
CO mass fraction contours along the kiln axis at ≈21% thermal substitution for three discrete WSR particle diameters: mm (top), 15 mm (middle), and 25 mm (bottom). Distance is measured in meters from the burner tip; CO mass fraction (–) is given by the common colorbar.
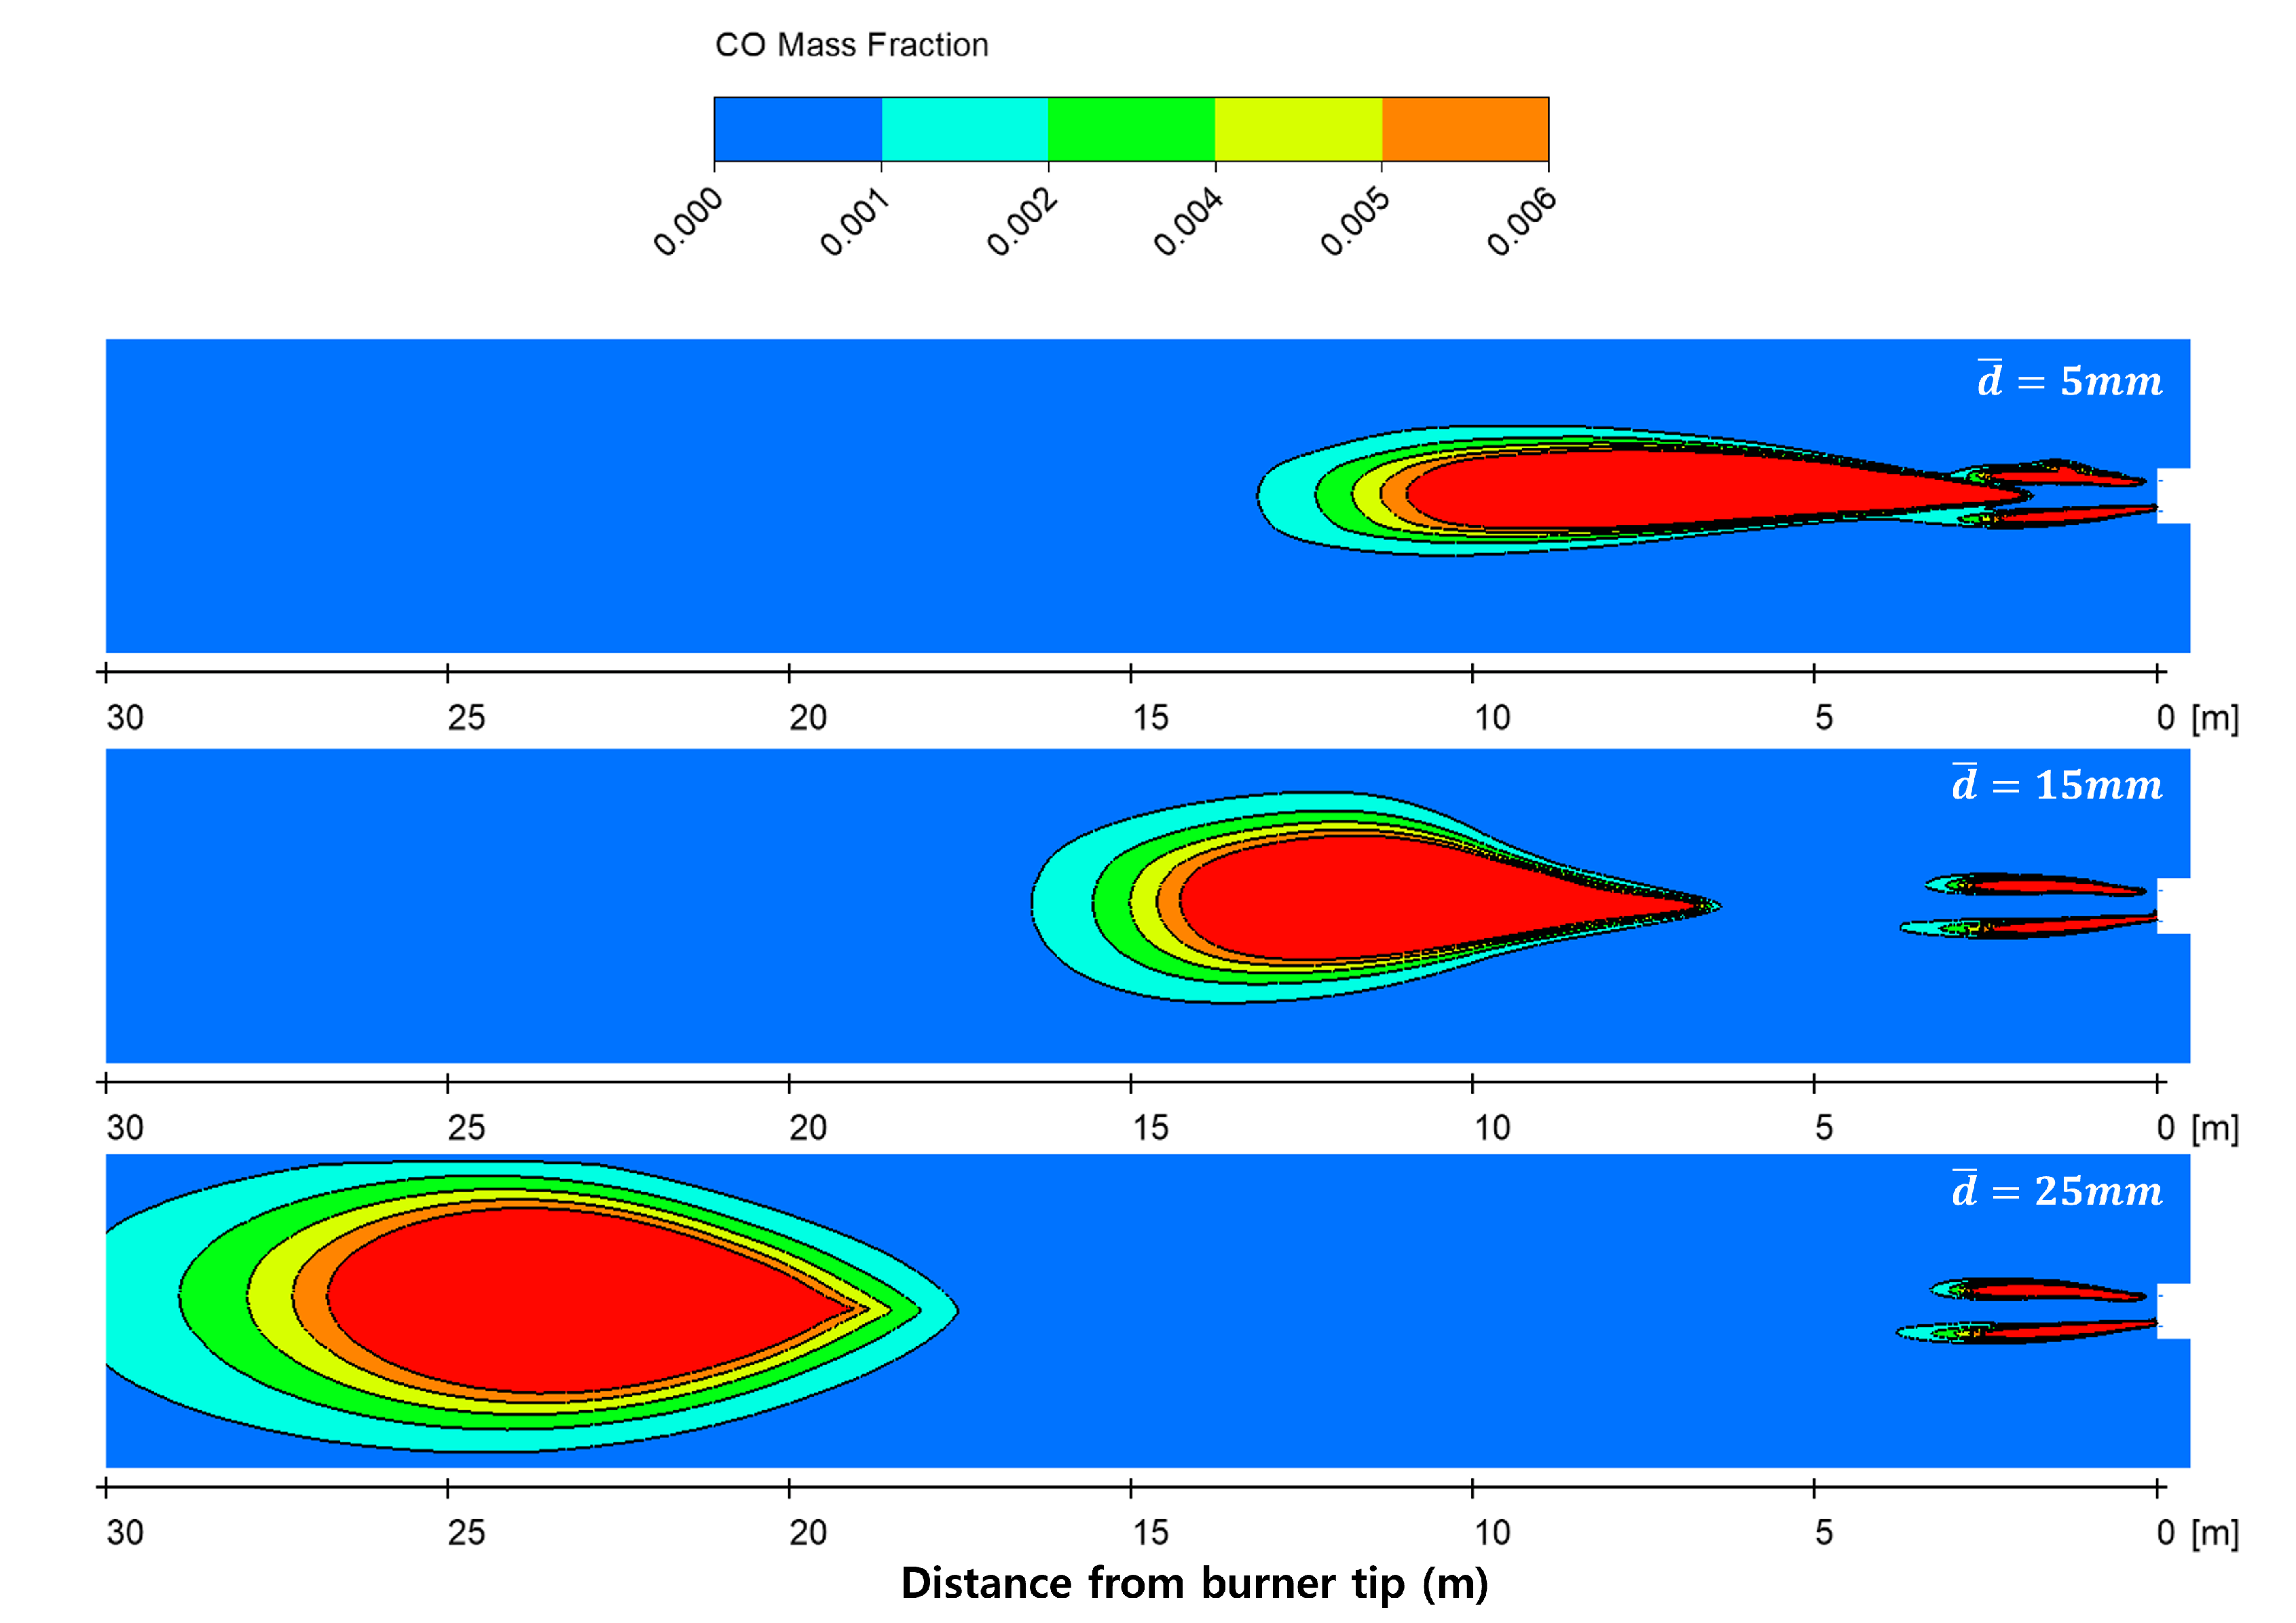
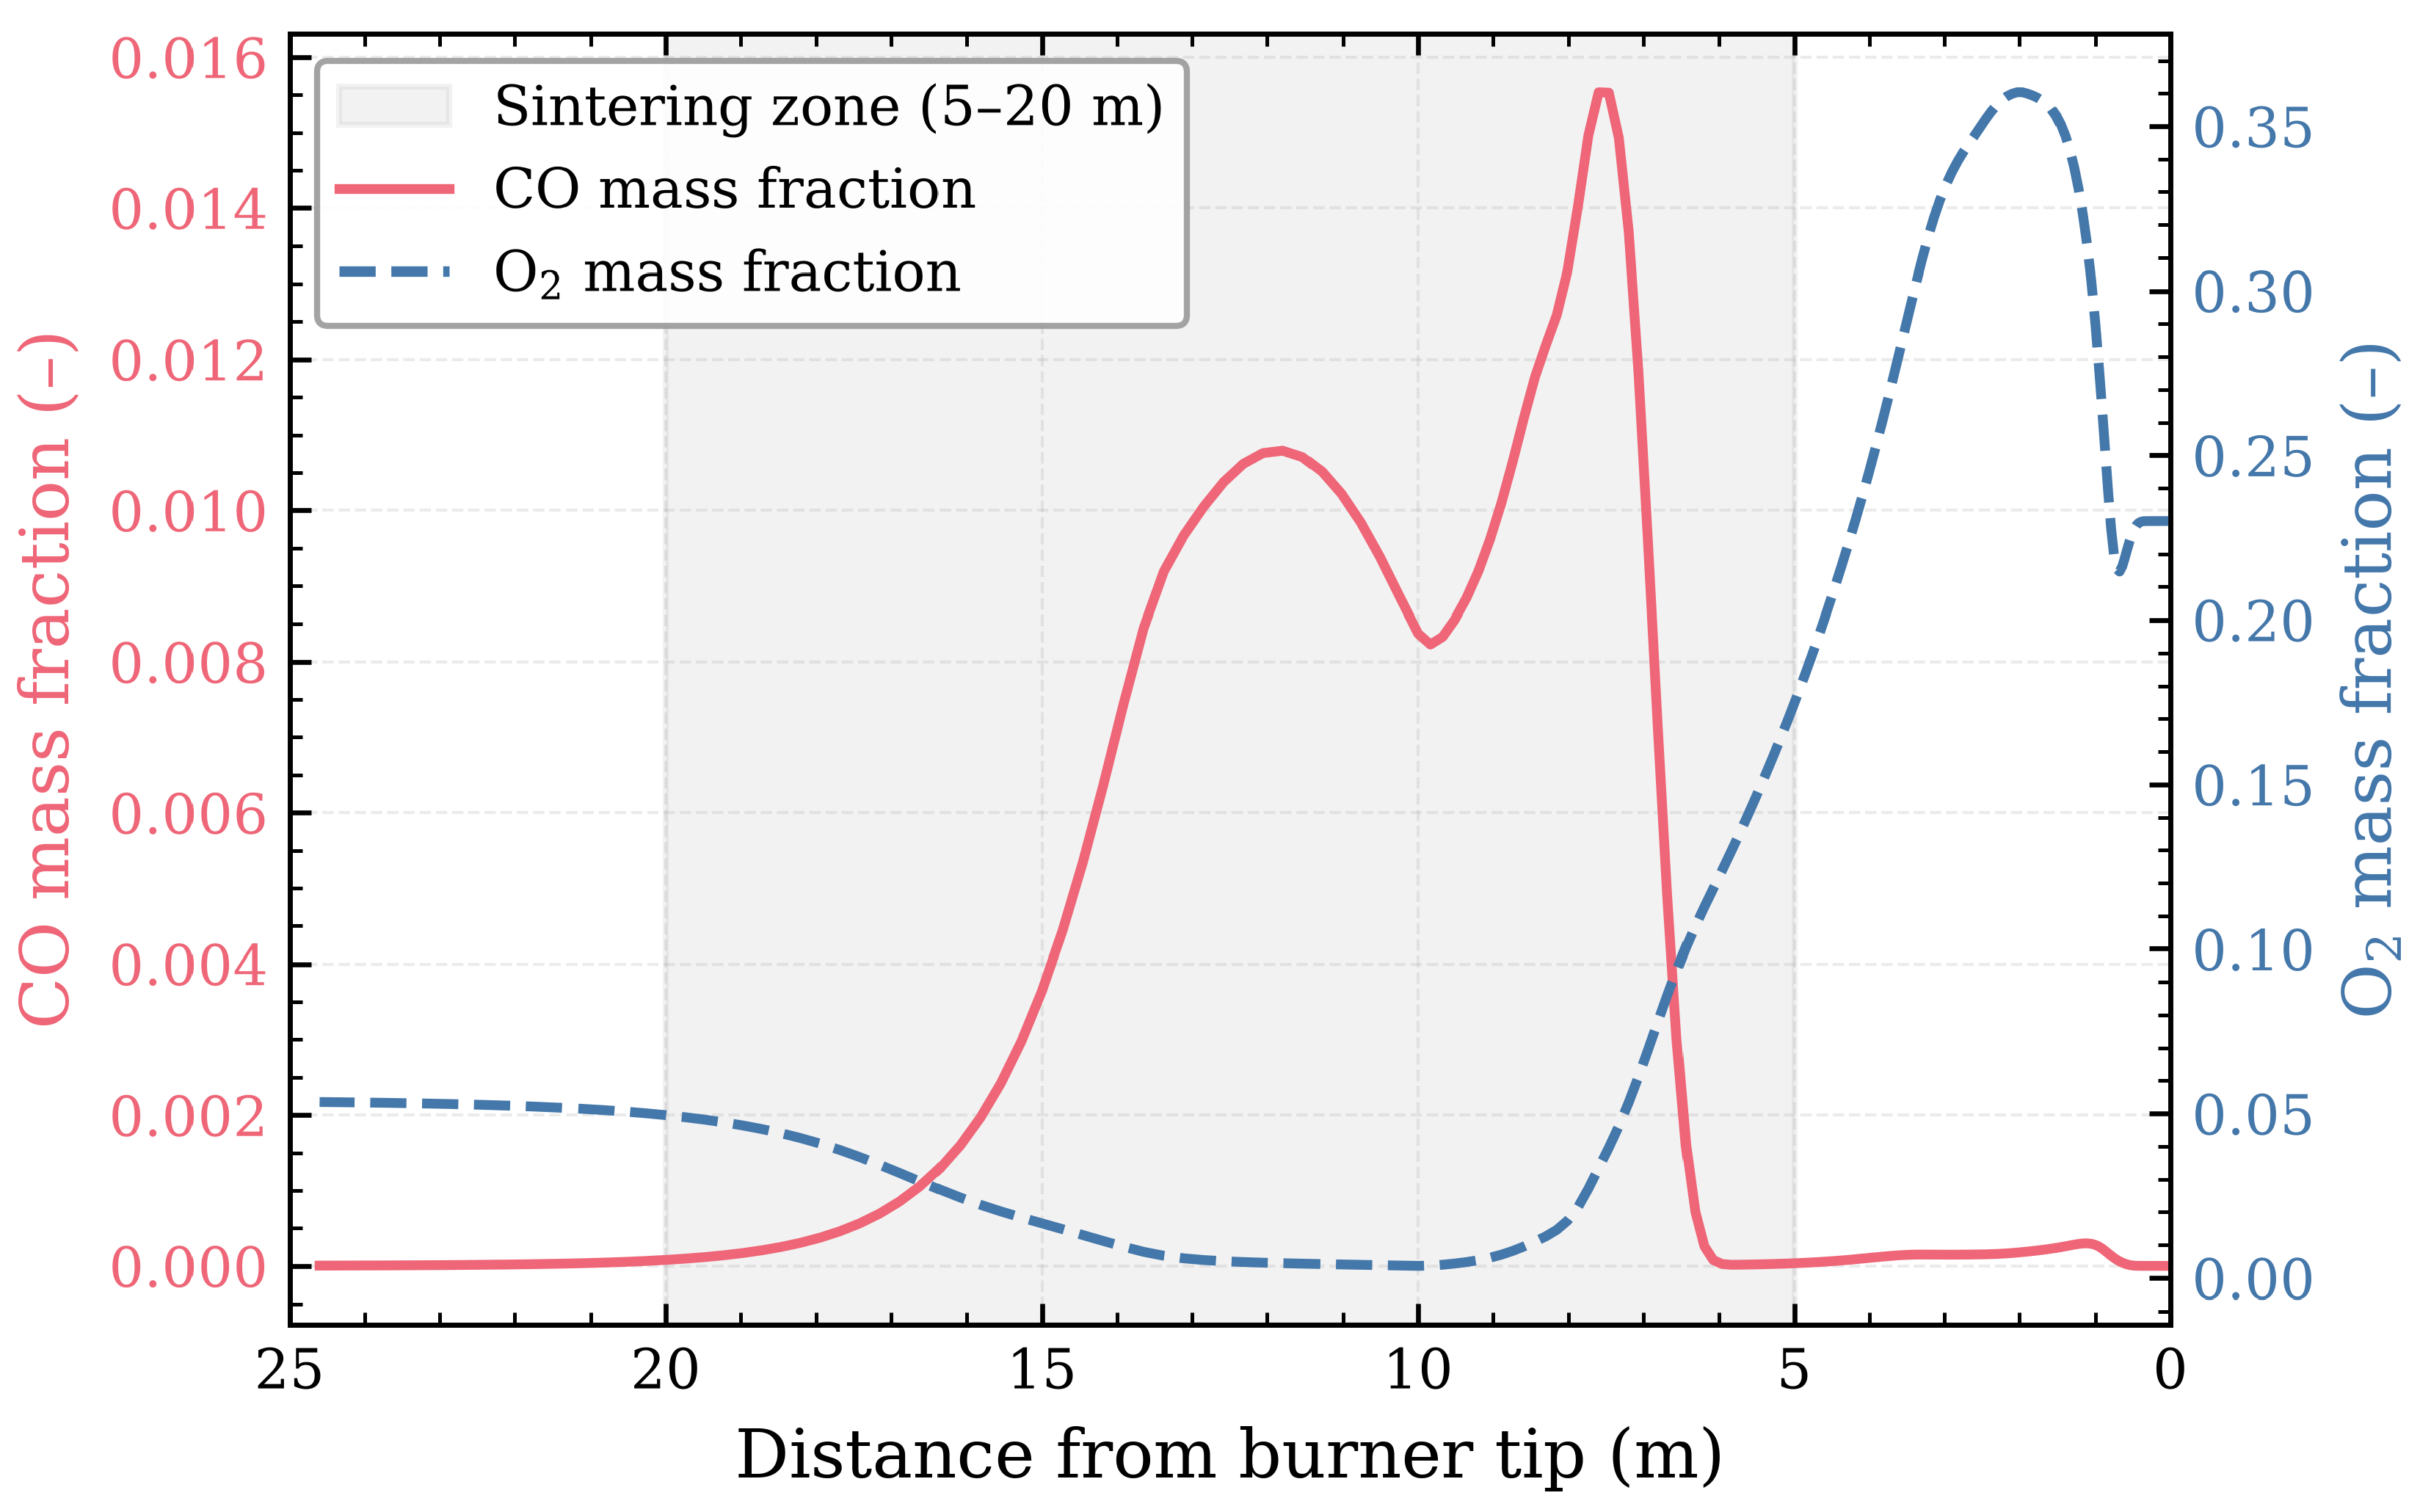
Figure 12 shows the centerline axial profiles of CO and O2 at the reference analysis condition . The centerline profile is the local concentration extracted along the geometric center axis of the kiln; it represents neither the concentration distribution over the whole cross-section nor the exhaust-gas composition, but is interpreted as an auxiliary spatial indicator that identifies the reaction-progress location along the main flame axis. The CO mass fraction forms a small initial peak (about 3.0 × 10⁻⁴) at about 1.1 m just after the burner tip due to the first oxidation of pulverized-coal volatiles, then temporarily decreases, and increases again within the sintering zone to reach a dominant peak of about 1.55 × 10⁻² at about 7.6 m. This interval is a region where the late char combustion of pulverized coal and the full-scale oxidation of WSR volatiles proceed simultaneously. The CO mass fraction decreases sharply after 7.6 m and drops to a background level of less than 1% of the local peak just before the sintering-zone rear (20 m). O2 rises just after the burner tip and is then almost locally depleted along the centerline over 8–14 m; its spatial overlap with the CO-rich region is consistent with this interval being an oxygen-limited local reaction-progress region. The recovery of O2 downstream (after about 15 m, to a level of about 0.050) is the result of the CO oxidation reaction being completed at this location so that the local centerline O2 sink disappears and the outer secondary air is mixed and transported to the centerline. This is spatially consistent with the for the same condition (Table 8) and with the result that the dual peak of is located within the sintering zone (Figure 8(b)). The spatial overlap of the centerline O2-depletion interval (8–14 m) with the CO peak (7.6 m) directly support that CO oxidation and O2 consumption proceed at the same location and are consistent with the two-step reaction structure prescribed in Table 3.
Figure 12.
Centerline axial profiles of CO and O2 mass fractions for mm at ≈21% thermal substitution.
Figure 12.
Centerline axial profiles of CO and O2 mass fractions for mm at ≈21% thermal substitution.
Synthesizing the above temperature distribution (Figure 8), volatile-release distance (Figure 9, Table 8), and centerline CO reaction progress (Figure 11–12), the combustion behavior by diameter is as follows. The range – shares the features that the main-flow heat distribution converges and does not exceed the sintering-zone rear boundary (20 m), but the heat-release location diverges even within this range. The 10–15 mm conditions are Complete within the sintering zone, and among these the 15 mm condition satisfies the completeness criterion while showing the most pronounced dual-peak amplitude of the flame core among the SD cases. In contrast, in the 5 mm condition, volatile devolatilization ends before the sintering-zone entrance (about 2.0–4.5 m), and the resulting centerline CO-rich region also drops to background level in the front half of the sintering zone (about 6–13 m), so the heat release and local oxidation progress are generally biased toward the front of the sintering zone (front-shifted). As a result, the effective heat-release contribution to the middle and rear of the sintering zone is relatively small, so it is classified in the Front-shifted category distinct from the Complete of 10–15 mm. The 20 mm condition is a Complete condition in which extends to near the sintering-zone rear boundary, but it lacks the margin to buffer the risk of the sintering zone being exceeded by oversize particles in field application. In the 25 mm condition, exceeds the sintering zone by 2.0 m, and both the centerline CO-rich region and the residual high-temperature region form beyond the sintering-zone rear. This suggests that within the modeled gas-phase region the volatile release and local oxidation progress are delayed rearward, and that the possibility increases of unconverted fuel persisting toward the clinker bed beyond the sintering zone. The 25 mm condition is therefore assessed as an Incomplete condition.
The present finding that and shift rearward with increasing diameter is consistent with prior studies. Ariyaratne et al. [12] reported that the larger the representative particle size, the more the volatile release and char combustion completion are delayed, and Pedersen et al. [11] confirmed by flame measurement that the ignition location shifts downstream relative to the reference fuel with SRF co-firing. In particular, the behavior in the 25 mm condition, where heat release and CO oxidation exceed the sintering-zone boundary, agrees in trend with the results of Pieper et al. [15], who quantified that the delayed combustion of large RDF particles can lead to a decrease in sintering-zone gas and clinker temperatures and to unburned particles entering the clinker bed. However, this study is distinguished in that it decomposes this by diameter under main-burner conditions and shows that the oversize tail () of the size distribution acts as a coarse-particle size scale that aligns to first order, with the upper-tail particle group and the distribution shape correcting the residual differences. In summary, , where the main factors of the second term are the actual sizes of the particles exceeding and their mass fraction.
Under the present modeling conditions, the monodisperse upper diameter at which is confined within the sintering zone (5–20 m) is estimated to be up to about 20 mm. This 20 mm is not a universal operating criterion or an actual grinding specification but a modeled marginal scale at which approaches the sintering-zone rear (20 m) in the SD analysis. When the front shift of the 5 mm condition (front-shifted: devolatilization completed before entering the sintering zone) is also considered, the SD-based reference range of 15–20 mm can be regarded as the effective size range observed under the present modeling conditions. However, once the downstream persistence of the centerline CO-rich region is also considered, 20 mm is a marginal upper bound with almost no rear margin, so a more conservative model reference condition is judged to be 15 mm. Because the SD analysis in this section is based on the idealization that all WSR particles have the same size, the arithmetic mean, characteristic diameter, , and upper diameter should be distinguished when interpreting an actual PSD application.
3.3. Effect of WSR Particle Size Distribution on Combustion Characteristics
Not only the single-diameter effect but also the coarse (oversize) tail of the distribution governs the devolatilization-completion location. This section addresses the PSD cases of Table 5, and the definitions of the distribution and the meaning of the truncated arithmetic mean follow the criteria given in Section 2.6.2. The results of this section are therefore interpreted as the effect of varying the upper limit (oversize tail) and the distribution shape at the same characteristic diameter .
The effect of the upper size limit in a PSD is much clearer in the devolatilization-completion location than in the mean temperature. To confirm this quantitatively, and defined in Section 2.6.4 were applied to the PSDs with the same threshold () (Table 9). is similar for all four cases at about 2.0–2.5 m, because all PSDs apply the same Rosin–Rammler characteristic diameter and discretization criterion, so the fine-diameter interval that triggers initial devolatilization forms similarly. In contrast, increases consistently to 17.5, 23.0, 31.0, and 40.0 m as the upper limit increases, because the coarsest particles in the distribution require a longer time for heating and devolatilization, so their devolatilization-completion location is delayed downstream accordingly as the upper limit increases.
Table 9.
Ignition and devolatilization-completion locations for PSD and shifted-distribution cases.
| Diameter setting (mm) | (m) | (m) | Dev. span (m) | Overshoot (m) | Assessment |
| PSD1 (, ) | 2.5 | 17.5 | 15.0 | 0.0 | Complete |
| PSD2 (, ) | 2.0 | 23.0 | 21.0 | 3.0 | Incomplete |
| PSD3 (, ) | 2.0 | 31.0 | 29.0 | 11.0 | Incomplete |
| PSD4 (, ) | 2.0 | 40.0 | 38.0 | 20.0 | Incomplete |
| PSD5 (, ) | 2.5 | 17.0 | 14.5 | 0.0 | Complete |
| PSD6 (, ) | 2.5 | 19.5 | 17.0 | 0.0 | Boundary-sensitive (≈20 m) |
| PSD7 (, ) | 3.0 | 20.5 | 17.5 | 0.5 | Boundary-sensitive (≈20 m) |
| PSD8 (, ) | 3.0 | 19.5 | 16.5 | 0.0 | Boundary-sensitive (≈20 m) |
| Shifted-distribution check cases | |||||
| PSD9 (, , ) | 2.5 | 9.5 | 7.0 | 0.0 | Complete |
| PSD10 (, , ) | 2.0 | 26.0 | 24.0 | 6.0 | Incomplete |
Only PSD1 (), with , remains within the sintering zone among the cases. However, because the margin to the rear boundary (20 m) is only 2.5 m, it is classified as a Complete but small-margin condition. Compared with SD3 of the same central diameter (15 mm) (, Table 8), has shifted 7.0 m rearward because of the oversize tail near the upper limit. The upper limit of PSD1 () is identical to the monodisperse diameter of SD4 (20 mm), and the actual values of PSD1 (17.5 m) and SD4 (16.5 m) are also close, differing by about 1 m. This shows that, despite different distribution forms (monodisperse vs. broad Rosin–Rammler), can lie in a similar range when the coarse-particle group of the injected distribution is similar, supporting that a coarse-particle size scale acts as the first-order scale that aligns devolatilization completeness for both the SD and PSD analysis axes.
PSD2–PSD4 exceed the sintering-zone rear more and more as the upper limit increases (Table 9), so the devolatilization of the oversize particles continues to a location where it cannot be used for clinker sintering.
Because is evaluated in axial grid increments (0.5 m), differences within 0.5 m are not significant. For the narrow distribution (), no longer moves beyond about 20 m even if the upper limit is increased above 25 mm ( series: m, a rear-boundary saturation band), because almost no mass remains above the upper limit; the case-to-case differences of 0.5–1.0 m in this interval are within the grid resolution and are not read as individual judgments.
Considering that is a post-processing indicator dependent on the relative threshold ratio of the cross-section-integrated volatile-release rate, its spatial consistency with an auxiliary chemical indicator was cross-checked. For the main 13 cases (SD1–SD5, PSD1–PSD8) and the two shifted-distribution check cases (PSD9–PSD10), the location at which the centerline axial CO mass fraction reaches a background level () was extracted and compared with and (Table 10).
Table 10.
Cross-indicator comparison of , , and for all analyzed cases.
| Case | (m) | (m) | Status | (m) |
| SD1 | 2.0 | 4.5 | Front-shifted | 14.2 |
| SD2 | 5.0 | 7.5 | Complete | 16.4 |
| SD3 | 7.0 | 10.5 | Complete | 19.2 |
| SD4 | 10.5 | 16.5 | Complete | 24.6 |
| SD5 | 18.5 | 22.0 | Incomplete | 35.8 |
| PSD1 | 2.5 | 17.5 | Complete | 20.3 |
| PSD2 | 2.0 | 23.0 | Incomplete | 26.1 |
| PSD3 | 2.0 | 31.0 | Incomplete | 35.0 |
| PSD4 | 2.0 | 40.0 | Incomplete | 45.7 |
| PSD5 | 2.5 | 17.0 | Complete | 20.5 |
| PSD6 | 2.5 | 19.5‡ | Boundary-sensitive | 25.1 |
| PSD7 | 3.0 | 20.5‡ | Boundary-sensitive | 26.7 |
| PSD8 | 3.0 | 19.5‡ | Boundary-sensitive | 26.7 |
| PSD9 | 2.5 | 9.5 | Complete | ≈15.3 |
| PSD10 | 2.0 | 26.0 | Incomplete | ≈30.0 |
For SD1–SD5, both and shift rearward in the same direction with increasing diameter, with located 8–14 m downstream of . That this rearward offset is larger than for the PSD cases (3–6 m) may be related to the tendency that, in the monodisperse condition, all particles are equally large so that the char reaction and the local CO-reduction interval after devolatilization completion extend over a wider axial range. For the series (PSD1–PSD4) as well, shifts rearward in the same direction as , showing a rearward offset of 3–6 m relative to . This offset is physically consistent with the reaction-progress sequence in which the char reaction and local CO reduction can continue over several meters even after devolatilization completion. For the series (PSD5–PSD8), saturates at about 20 m, whereas continues to diverge to 20.5–26.7 m. This shows that in the series volatile-release completion and the subsequent local CO reduction represent different reaction stages, and that uncertainty due to the 0.5 m spatial resolution remains in the near-rear-boundary judgment of the narrow-distribution series.
These differences in , meanwhile, appear relatively weak in the mean-temperature indicators. Figure 13 compares the axial temperature distribution of the SD baseline () and PSD1–PSD4 using the two averaging methods. In (Figure 13(a)), all four PSD cases show a peak of 1792–1798 °C at about 12 m, with a case-to-case difference within 6 °C. At the sintering-zone rear (20 m) as well, the SD baseline is 1507 °C and the PSD cases are 1511–1521 °C, close to each other. This shows that while the main-flow mean temperature is useful for indicating the overall temperature level, it has limitations for directly discriminating the local devolatilization delay and completion location of oversize particles (Figure 13(a)). In this study, therefore, the two mean-temperature indicators were used to grasp the mean temperature level within the sintering zone, and the confinement assessment based on the devolatilization-completion location was performed centered on .
Meanwhile, if the PSD series is ordered by the arithmetic mean diameter alone, varies greatly even at similar mean diameters (Figure 15(a)), so the mean diameter is unsuitable for representing the oversize-tail effect.
In (Figure 13(b)), the distribution effect appears somewhat more distinctly. The dual peak observed at SD 15 mm (first peak about 2230 °C at 6.5 m, minimum about 1870 °C at 10 m, second peak about 2120 °C at 13 m) changes to a single gentle peak spanning about 6–11 m under the PSD conditions. This is because the front (near-burner) heat release of the fine particles and the rear (downstream) heat release of the coarse particles in the distribution overlap spatially, so the heat-release gap that existed between the two peaks in the SD condition is alleviated. The peak-temperature difference among the four PSD cases was within 18 °C (2144–2162 °C), and the first peak of SD3 (about 2230 °C) was about 86 °C higher than the single peak of PSD1 (about 2144 °C). Therefore, the dual peak and high peak temperature observed in the SD condition are interpreted as effects of the monodisperse idealization that can be alleviated when an actual size distribution is applied. The dual peak of the SD condition is useful for independently analyzing the particle-size effect but should not be interpreted as directly representing the flame structure of an actual grinder-outlet size distribution.
In the PSD analysis as well, the upper limit at which the devolatilization criterion does not exceed the sintering-zone rear was only around 20 mm (PSD1). However, because PSD1 also has a margin of only 2.5 m, it is appropriate to regard 20 mm as a marginal upper limit that is Complete but lacks margin. This thermal-confinement limit is a numerical reference to consult when examining the grinder-outlet size. In PSD2–PSD4 (, upper limit 25 mm or more), exceeds the boundary more and more, so the devolatilization-completion location moves to the rear and the possibility increases that unconverted fuel persists beyond the sintering zone. In particular, PSD4 () exceeds the boundary by as much as 20 m, so the oversize-tail heat release lies far outside the range usable for clinker formation.
The present PSD analysis isolates the effect of the upper-limit change alone by applying the distribution index set in Section 2.6.2 identically to the reference PSD series (PSD1–PSD4).
So far it has been confirmed that at , shifts downstream as the upper limit increases. To confirm whether this trend is independent of the distribution shape, four additional cases (PSD5–PSD8, , 25, 30, ) were analyzed, keeping the characteristic diameter and the upper limit the same while raising only the distribution index to to narrow the distribution (Table 9, Figure 14).
Figure 14.
Devolatilization-completion location versus PSD upper limit for two values of the distribution-shape parameter (, broad; , narrow) at ≈21% thermal substitution and mm. The shaded band ( m) denotes devolatilization completion within the sintering zone; the dashed line marks its rear boundary (20 m).
Figure 14.
Devolatilization-completion location versus PSD upper limit for two values of the distribution-shape parameter (, broad; , narrow) at ≈21% thermal substitution and mm. The shaded band ( m) denotes devolatilization completion within the sintering zone; the dashed line marks its rear boundary (20 m).
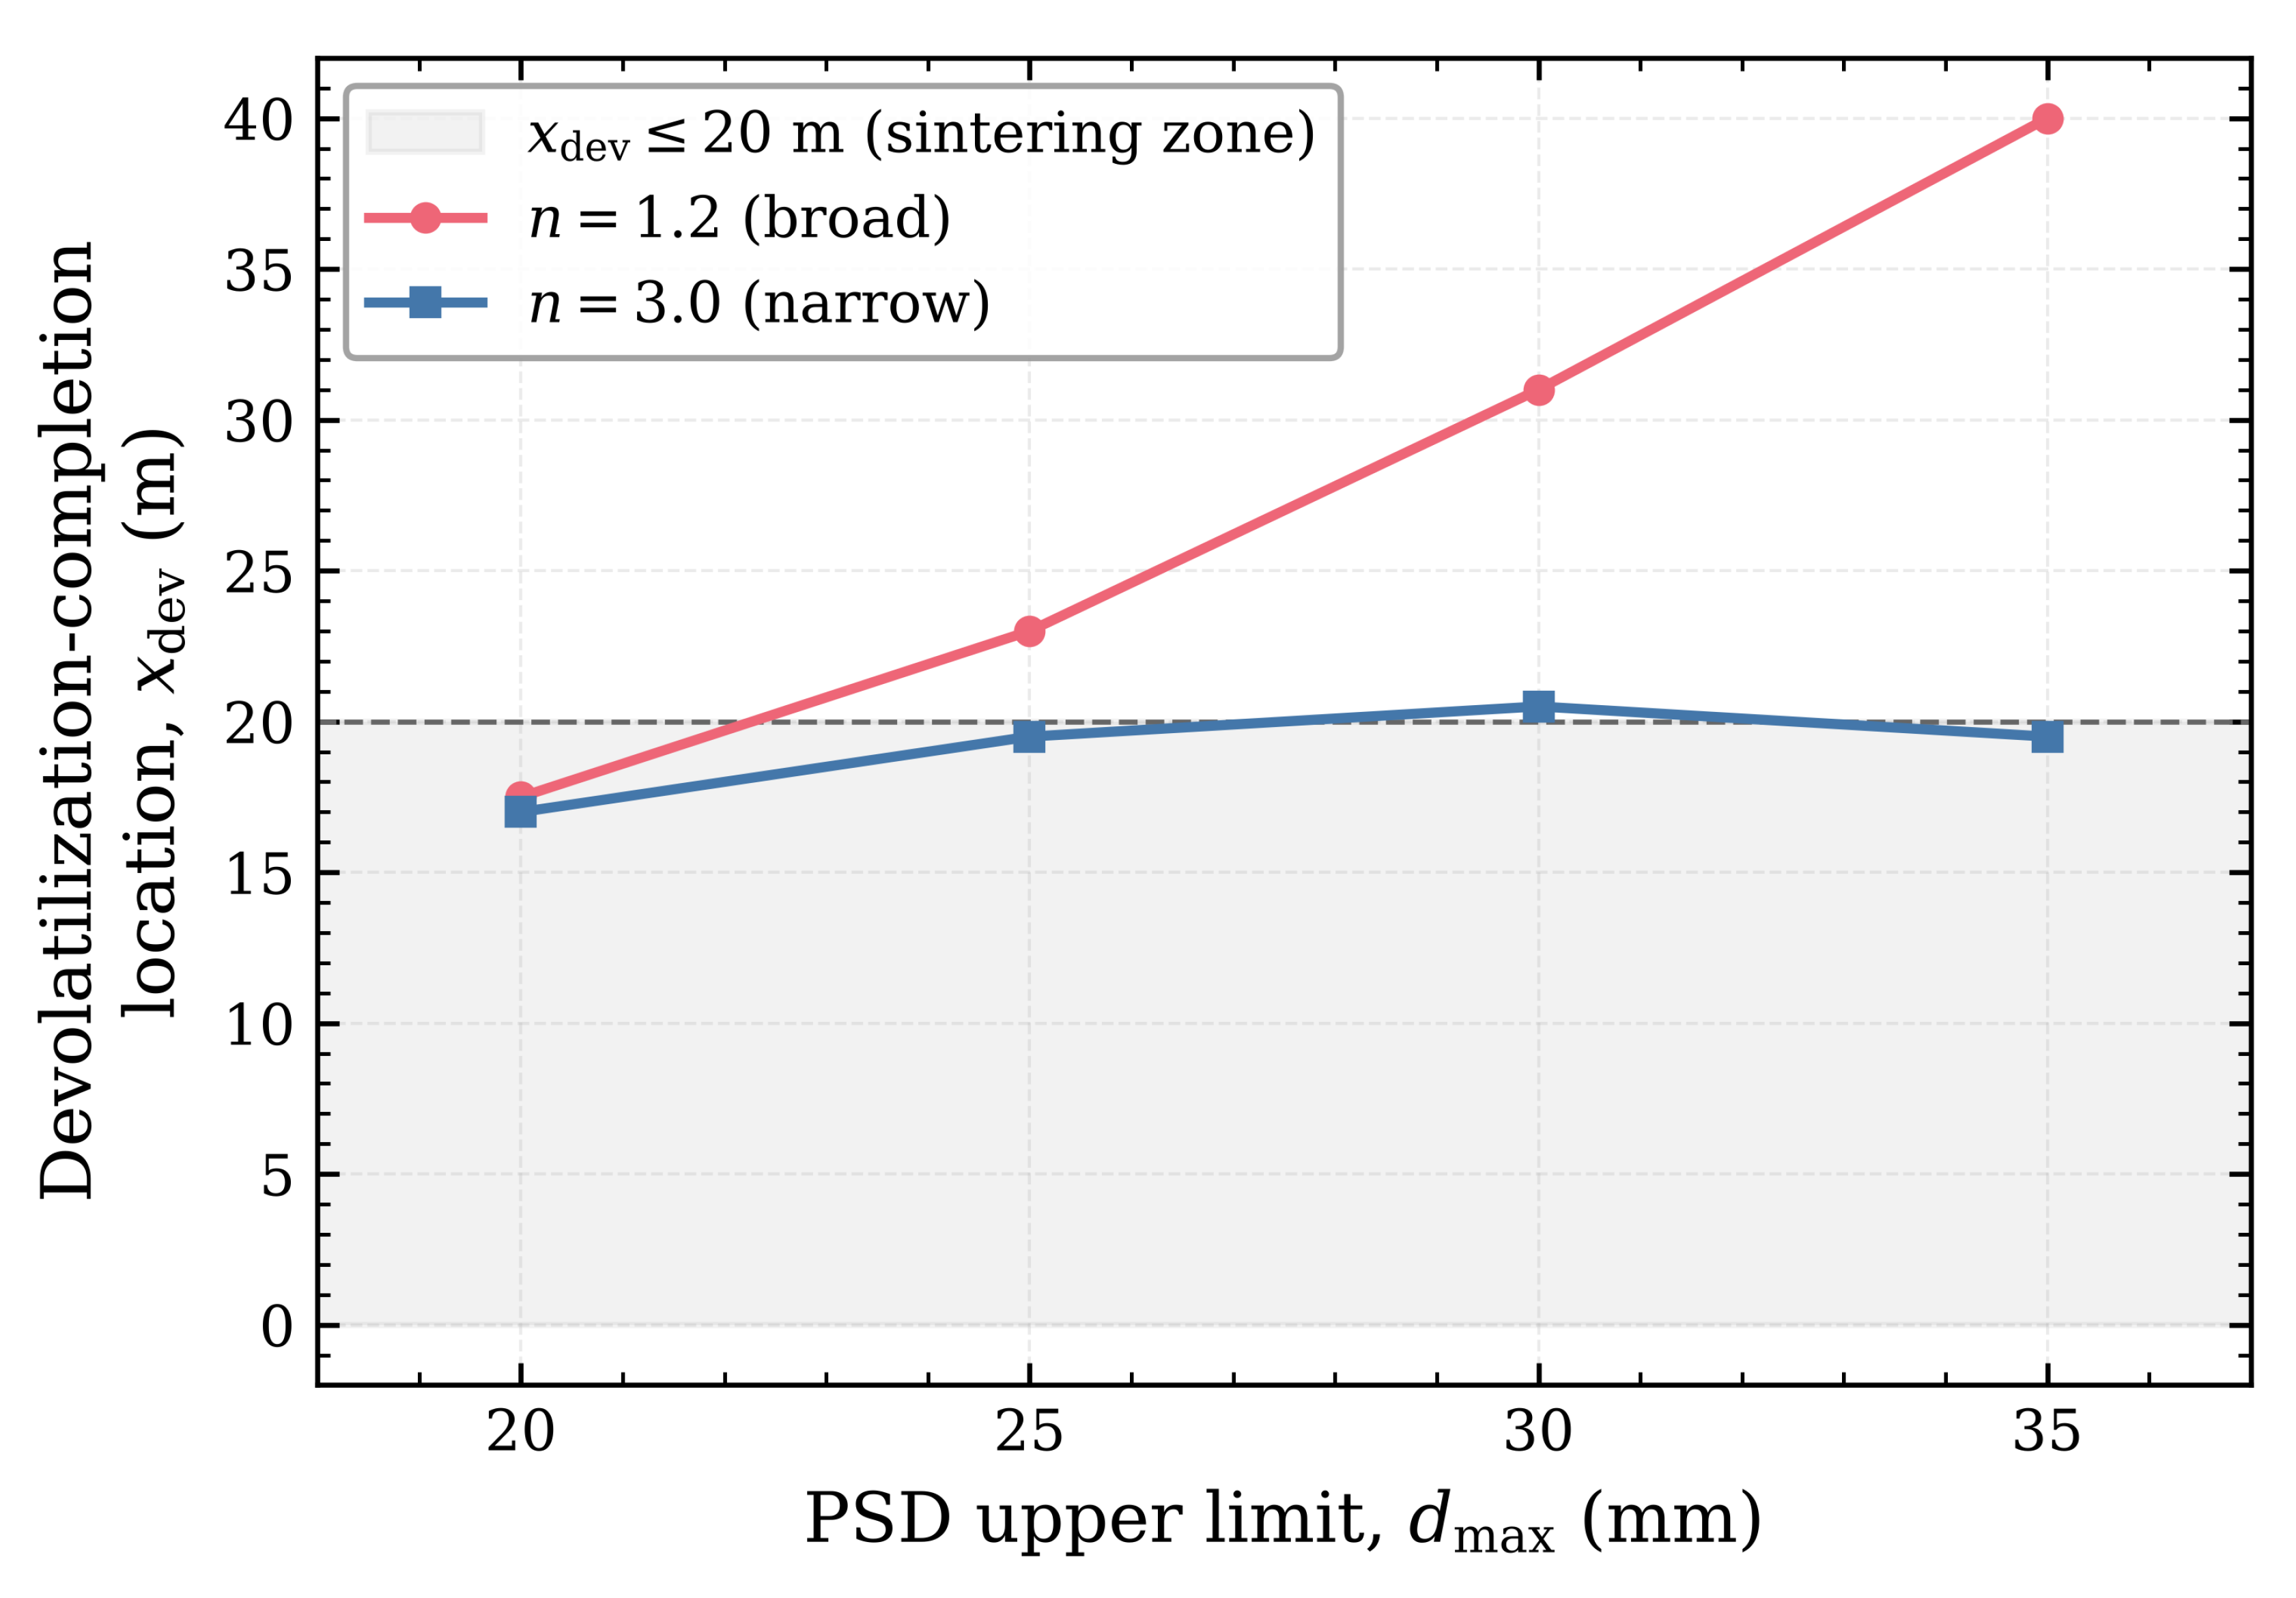
Because the temperature field of the narrow-distribution () condition is also almost identical to that of the broad distribution () (with the peak within a few tens of °C), whether the devolatilization-completion location is confined depending on the distribution shape was judged by whether remains within the sintering-zone rear (20 m).
responded sensitively to the distribution width. In the narrow distribution, the coarse particles remaining above the upper limit already account for less than 1% of the total (e.g., about 0.03% above 30 mm), so even increasing the upper limit provides limited fuel mass to induce rear heat release. Accordingly, saturated near the sintering-zone boundary (about 20 m). Indeed, the of is 17.0, 19.5, 20.5, and 19.5 m at , 25, 30, , all remaining near 20 m (the fluctuation of about 0.5 m is meaningless because it is within the 0.5 m grid interval). Even at the same , the 23.0 m of is pulled to 19.5 m at , moving into the boundary-sensitive region near the sintering-zone rear boundary, and at the two distributions are effectively the same at 17.5 m and 17.0 m.
Even at the same , if the distribution is narrow and the coarse-particle mass is small, devolatilization ends within the sintering zone. When the distribution is narrowed (i.e., by increasing n) in the condition, the arithmetic mean of the truncated distribution increases slightly from about 13.0 mm to 13.6 mm, but is shortened from 23.0 m to 19.5 m. This means that returning into the sintering zone is more directly related to the reduction of the coarse-particle mass near the upper limit than to the mean diameter. Therefore, the main-burner WSR size criterion cannot be set by the upper-limit value alone but must consider the distribution shape together. At , the fine fraction decreases so that the ignition location is slightly delayed from 2.0–2.5 m () to 2.5–3.0 m, but the effect on , which indicates the devolatilization-completion location, is small.
The representative coarse-particle size scale that aligns is not the upper limit or the distribution index n itself but a value that reflects the coarse-particle diameter of the actually injected distribution. This is expressed as a single value by (the 90th-percentile diameter) defined in Section 2.6.4, and the case-by-case values are summarized in Table 5. If the eight PSD cases are arranged by the arithmetic mean diameter, varies greatly even at similar mean diameters, giving low correlation (Figure 15(a)). In contrast, arranging by in the present PSD conditions, the and series generally follow an increasing trend (Figure 15(b)). That is, n and are different paths that change , and tends to shift rearward primarily with increasing . This is also why the narrow distribution () does not move further rearward above mm: almost no mass remains above the upper limit, so stops at about 20 mm (about 19.9 mm for both and 35 mm, based on ). However, even at a similar level, the series shows a residual gap because the actual size and distribution shape of the upper-tail particle group differ. Therefore, is a first-order scale that aligns , and the size and distribution shape of the upper-tail coarse particles are interpreted as secondary factors that explain the residual deviation.
Figure 15.
Devolatilization-completion location plotted against (a) the truncated arithmetic mean diameter and (b) the coarse-tail diameter of the feed distribution, for the PSD series ( and ), shifted-distribution check cases, and SD single-diameter cases (SD1–SD5; ) at ≈21% thermal substitution. PSD arithmetic mean and values are computed from distributions truncated and renormalized over . The shifted-distribution check path follows the sequence PSD9–PSD1–PSD10, with PSD1 serving as the intermediate reference for the same broad-distribution shape. Plotting against the arithmetic mean produces widely scattered SD and PSD data with no clear alignment, whereas ordering by generally provides a clearer first-order monotonic ordering across input types. Residual offsets at comparable reflect upper-tail shape differences, so is a first-order scale rather than a sole predictor. Dashed and dotted horizontal lines mark the sintering-zone rear (20 m) and front (5 m) boundaries, respectively.
Figure 15.
Devolatilization-completion location plotted against (a) the truncated arithmetic mean diameter and (b) the coarse-tail diameter of the feed distribution, for the PSD series ( and ), shifted-distribution check cases, and SD single-diameter cases (SD1–SD5; ) at ≈21% thermal substitution. PSD arithmetic mean and values are computed from distributions truncated and renormalized over . The shifted-distribution check path follows the sequence PSD9–PSD1–PSD10, with PSD1 serving as the intermediate reference for the same broad-distribution shape. Plotting against the arithmetic mean produces widely scattered SD and PSD data with no clear alignment, whereas ordering by generally provides a clearer first-order monotonic ordering across input types. Residual offsets at comparable reflect upper-tail shape differences, so is a first-order scale rather than a sole predictor. Dashed and dotted horizontal lines mark the sintering-zone rear (20 m) and front (5 m) boundaries, respectively.
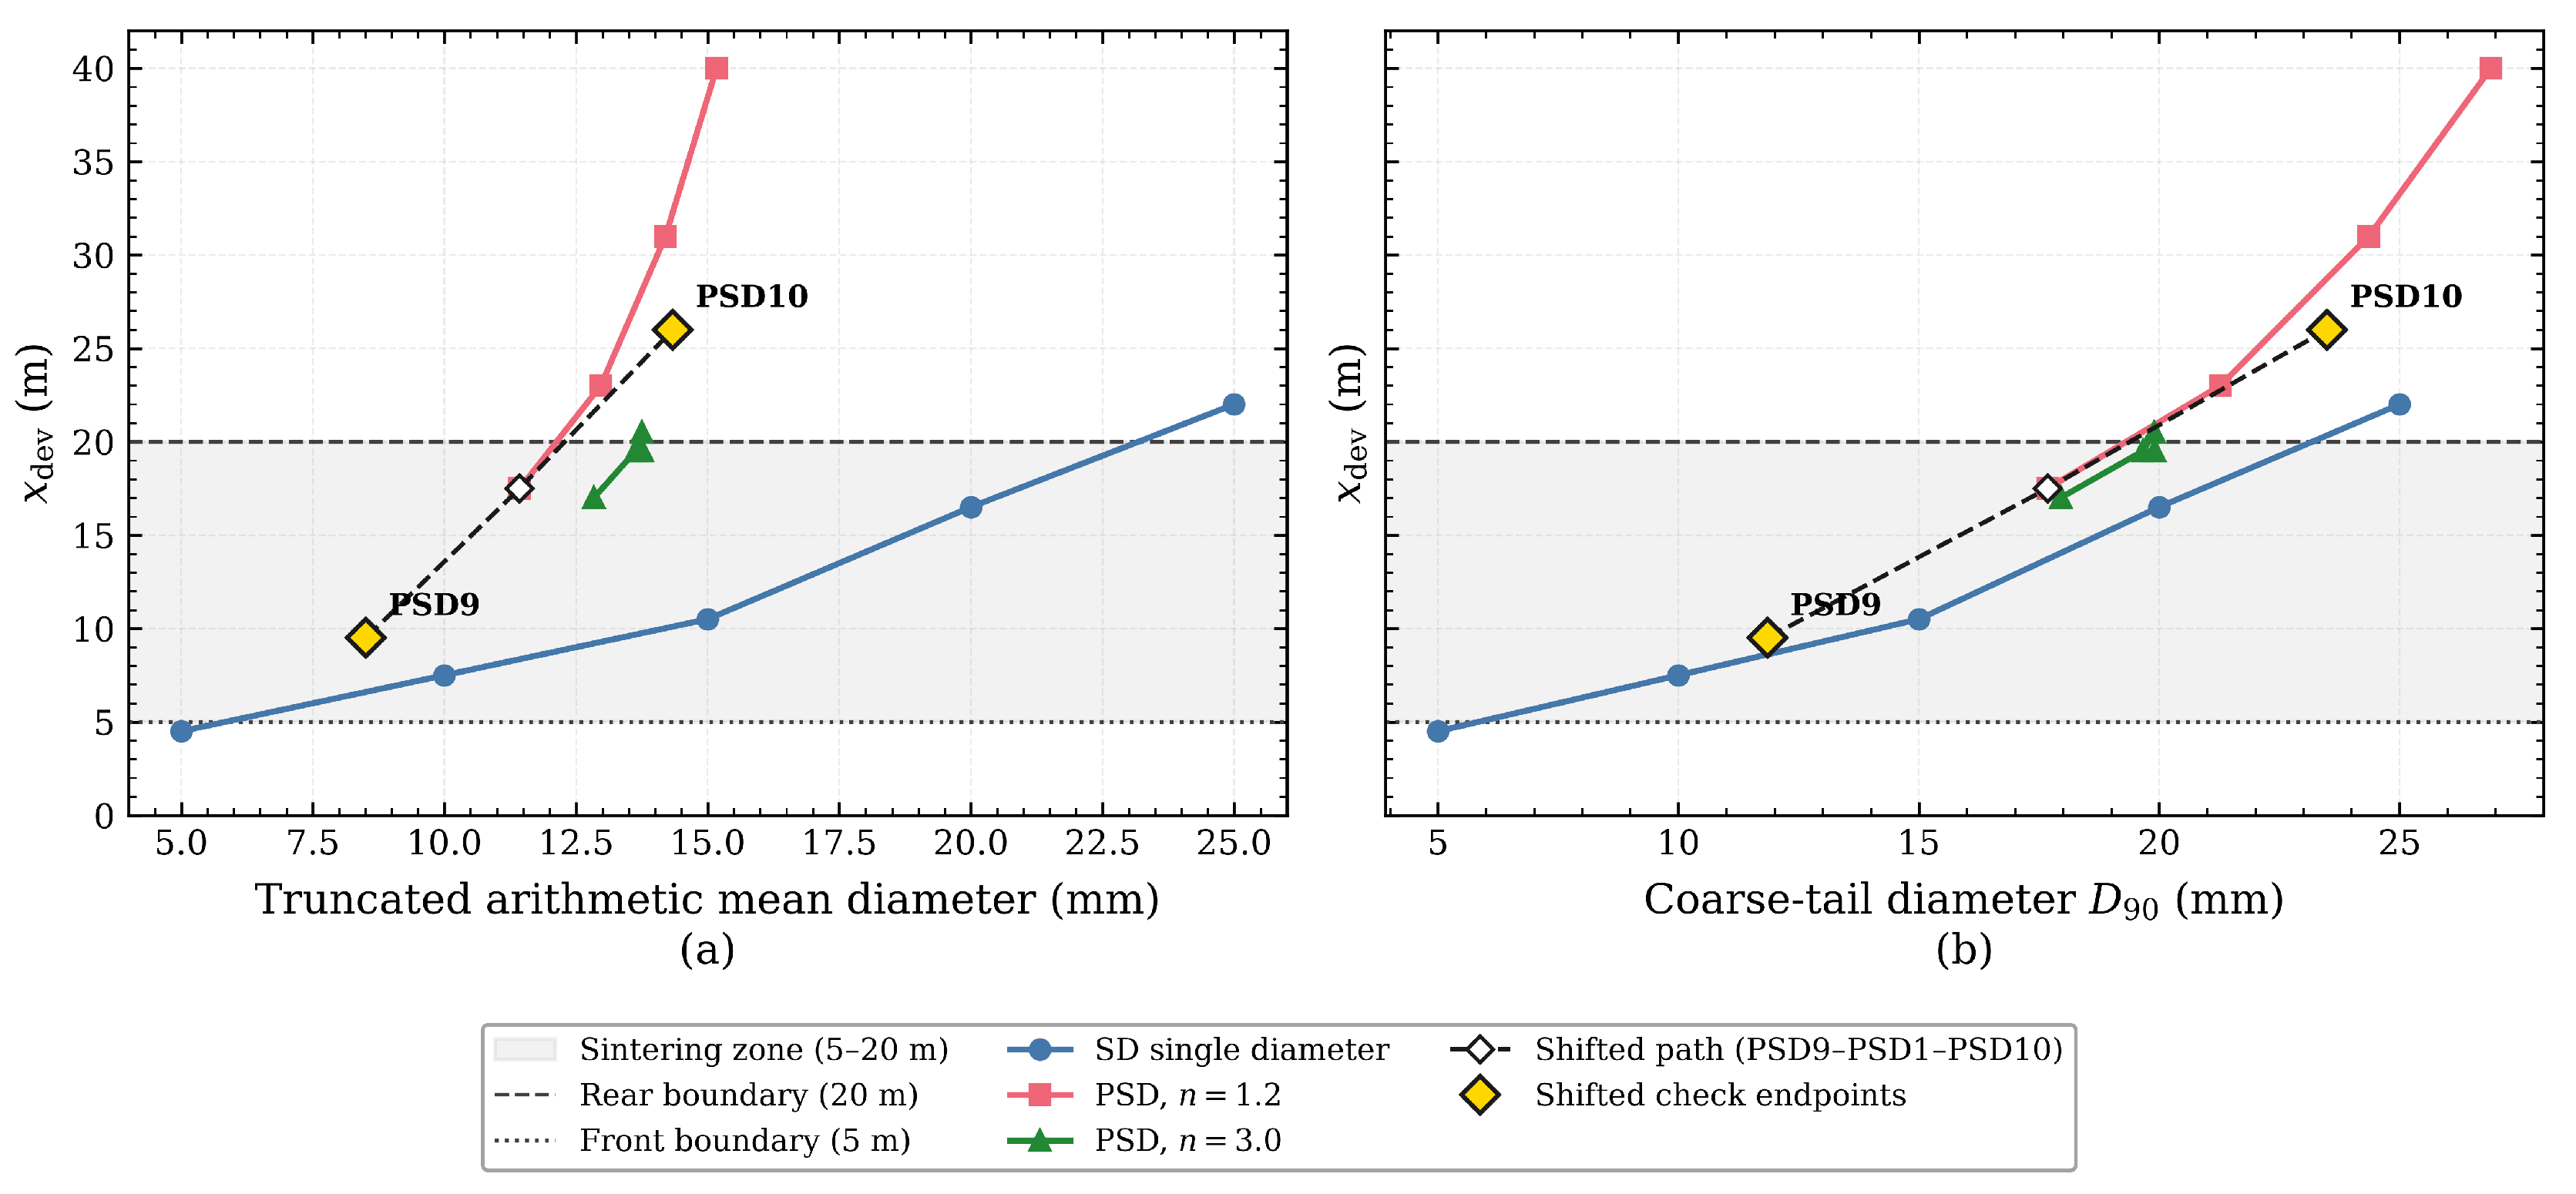
To check the sensitivity of the choice, , , , , and were computed from the truncated Rosin–Rammler distributions of Table 5 without additional CFD calculations, and their alignment with was compared as an auxiliary. On a simple linear-alignment basis for all cases, the RMSE decreased from 3.61 m for to 2.84–2.60 m for –, but the higher percentiles were more sensitive to the very small mass fraction near the upper limit and to the truncation criterion. In this study, therefore, is used not as an optimized single predictor but as a practically interpretable first-order coarse-tail indicator. Because a residual gap remains depending on the actual size and distribution shape of the upper-tail particles, is interpreted as a first-order alignment scale rather than a sole predictor.
To further confirm the whole-distribution shift effect, PSD9 and PSD10 were analyzed by shifting the characteristic diameter to 10 mm and 20 mm while maintaining a broad-distribution shape similar to PSD1 (, ). When truncated and renormalized based on , increased to 9.5, 17.5, and 26.0 m for PSD9 (, , ), PSD1 (, , ), and PSD10 (, , ), respectively. This shows that the devolatilization-completion location shifts downstream with increasing coarse-particle diameter even on the whole-distribution shift path not covered by the existing PSD matrix.
Meanwhile, that the of PSD10 is located downstream of the monodisperse SD5 (, ) is not a failure of the scale but an example showing that is not a sole predictor. PSD10 is a broad distribution () whose is smaller than that of SD5, but its upper-limit diameter is larger than the 25 mm of SD5. Therefore, acts as a coarse-particle size scale that aligns to first order, and the size and distribution shape of the upper-tail particle group are interpreted as secondary factors that create the residual deviation between series.
The centerline-CO-based auxiliary indicator showed the same directionality. was about 15.3 m and 30.0 m for PSD9 and PSD10, respectively, so both cases reached the background level downstream of . This is spatially consistent with the interpretation of Table 10 that a local CO-reduction process can continue even after volatile-release completion. However, this centerline CO indicator is an auxiliary indicator of the local reaction-progress location and should not be interpreted as the cross-section mean concentration or the stack CO emission.
3.4. Mechanistic Synthesis: How Particle Size Shapes the Main-Burner Thermal Field
Even though the particle size was varied in two different ways, the limit at which heat release remains within the sintering zone appeared at a similar coarse-particle size level. Behind this is a common physical mechanism by which the WSR particle size affects the formation of the main-burner temperature field. Because WSR particles are about 500 times larger than pulverized-coal particles, they have a low specific surface area and large thermal inertia, which lengthens the particle heating time and the devolatilization time. The per-particle devolatilization region (Figure 9) and the rearward shift of the ignition location and the devolatilization-completion location with increasing diameter (Table 8) directly show this delay.
This devolatilization delay induces the flame-structure transition observed in the arithmetic mean temperature (Figure 8(b)). At the intermediate diameters of 10–15 mm, the rapid front combustion of pulverized-coal volatiles and the delayed release due to the slow heating of WSR are spatially separated, forming the most pronounced dual peak at 15 mm. In contrast, at 20–25 mm, the secondary release is not completed near the first peak but shifts rearward, so its separation from the first peak gradually becomes unclear. The same delay shifts the heat-release region and the centerline CO-rich region rearward (Figure 11), so whether heat release is confined based on the devolatilization-completion location was evaluated by whether remains within the sintering-zone rear boundary of 20 m rather than by the mean temperature.
When a PSD that simplifies the grinder-outlet size distribution is introduced (Figure 13, Table 9), the dual peak converts to a single gentle peak by distribution averaging in the condition analyzed in this study. responds sensitively to the effective oversize-particle group near the upper limit of the distribution, so that, at the same distribution shape (), shifted steadily rearward as increased. Even at the same upper limit, narrowing the distribution shortens this value (Figure 14).
These results show that the SD 20 mm single-diameter condition and the PSD condition both point to a near-boundary coarse-particle effect under the present modeling conditions. However, this is interpreted not as proof that the two cases are the same universal scale but as the result of the common physical mechanism of intra-particle heating and devolatilization delay acting in a similar direction on the two analysis axes.
Limited to the present burner geometry, fuel properties, and about 21% thermal substitution condition, the main volatile-release region is confined within the sintering zone over a range in which the SD single diameter is around 15 mm and the coarse (oversize) tail of the PSD remains within about 20 mm. However, once the downstream persistence of the centerline CO-rich region is also considered, the 20 mm condition has a small rear margin, so this value should be regarded not as a universal specification but as a marginal upper bound, and the 15 mm reference condition remains a more conservative model reference condition. Meanwhile, if the single diameter is too small, as in the 5 mm condition, devolatilization ends before entering the sintering zone (5 m) so that the heat release is biased forward (front-shifted); the effective size range of the present modeling conditions is therefore judged to have not only an upper bound but also a lower bound.
4. Limitations
As a pre-demonstration numerical study, this work has the following limitations, and its results should be interpreted primarily in terms of relative trends with particle size rather than absolute values.
The present model resolves the gas phase and the dispersed fuel particles and does not directly include the reactive solid clinker charge, the clinker-formation reactions, or the bed heat-absorption term. The predicted gas-phase temperature should therefore not be interpreted directly as the clinker temperature and may differ quantitatively from the predictions of a fully coupled gas–bed model. In addition, WSR was treated as non-melting spherical DPM particles. Although this simplification was applied consistently to all cases, the possibility that the magnitude of the error varies with particle size cannot be excluded. The relative trends of the flame structure and the devolatilization-completion location with particle size were therefore also interpreted within the scope of these model assumptions. A coupled gas–bed approach that directly links the delayed conversion of large particles to the clinker bed, such as that of Pieper et al. [15], remains an appropriate direction for future work aimed at predicting absolute clinker temperatures.
The main-burner WSR co-firing addressed here is still at a pre-commercial demonstration stage, and because direct field-measurement data of the temperature field and exhaust gas under the same conditions were not available, experiment-based validation could not be performed. Instead, (a) numerical convergence was confirmed through a grid-independence test, and (b) qualitative consistency was confirmed in that the baseline maximum flame temperature meets the sintering-zone flame temperature level required in the literature (≈2000 °C or higher). Furthermore, the results of a prior CFD analysis using the same main-burner configuration and the same class of numerical models [22] agreed at the level of internal consistency; this is not independent, experiment-based validation and does not guarantee absolute accuracy against measurements. Direct experimental validation under main-burner conditions remains a task for a subsequent demonstration stage.
The present results are a screening-level estimate; because the TSR was fixed at ≈21%, the thresholds derived here may shift in the high-substitution regime of 30–40% owing to the increased WSR heat-release fraction. Moreover, the conclusions are limited to the spatial confinement of volatile-release completion and heat release, evaluated by over the main-burner–sintering-zone interval, and an integrated assessment including the quantitative emission of clinker quality (free-CaO), NOx, and unburned CO remains a future task. In particular, the axial CO field of this study is not a direct prediction of stack CO emission but a spatial indicator of where the locally oxygen-deficient, reducing region persists relative to the sintering zone. Considering the observation of Pieper et al. [15] that the escape of oversize particles from the sintering zone can lead to unburned particles entering the clinker bed, quantitatively linking the -based size criterion to clinker-quality indicators such as free-CaO is a priority follow-up task.
5. Conclusions
The core result of this study is not a specific nominal upper limit but the finding that —which represents the coarse (oversize) tail of the injected size distribution—acts as a first-order scale that aligns the WSR devolatilization-completion location () with whether heat release is thermally confined within the sintering zone. Three-dimensional steady RANS CFD analyses of WSR co-firing in a cement-kiln main burner were performed under a ≈21% TSR condition, and the particle-size effect was analyzed by two methods. First, the idealized flame response was resolved in detail using five single-diameter levels (SD1–SD5) of SD 5–25 mm, in which all particles are assumed to have the same diameter. Then, fixing the characteristic diameter , the effect of the grinder-outlet distribution and the sensitivity to distribution shape were separately evaluated using a PSD set of eight cases: four broad-distribution cases (PSD1–PSD4) with a Rosin–Rammler upper limit varied over 20–35 mm () and four narrow-distribution cases (PSD5–PSD8) with the same upper limits but a narrowed distribution (). In addition, PSD9 and PSD10 were used to confirm the whole-distribution shift path.
A parallel analysis of and showed that the single diameters of 5–15 mm converge in , whereas in a dual peak forms owing to the monodisperse idealization, with the amplitude most pronounced at the 15 mm condition. This dual peak is interpreted as an effect of the monodisperse idealization that is alleviated when an actual size distribution is applied. As the diameter increases, the ignition and devolatilization-completion locations shift rearward, so that 20 mm was assessed as a Complete case with a small margin and 25 mm as Incomplete. Conversely, the 5 mm condition showed a front-shift in which devolatilization is completed before entering the sintering zone. Therefore, under the present modeling conditions, WSR size management is interpreted not as a one-way problem in which smaller is always better but as a two-sided constraint problem in which both a front shift ahead of the sintering zone and an overrun beyond its rear must be avoided. is strongly dependent on the upper limit of the distribution, so that only PSD1 () is contained within the sintering zone but with an insufficient rear-margin distance (Complete, limited margin), while PSD2–PSD4 () overrun the rear boundary (Incomplete).
Whether heat release is confined within the sintering zone, judged by the devolatilization-completion location, is more directly related to whether remains within the sintering-zone rear boundary (20 m) than to the mean temperature. The core contribution of this study is to decompose the WSR particle-size effect into the two engineering variables of single diameter (SD) and oversize tail (PSD) and to suggest that both variables relate to the 90th-percentile diameter of the injected distribution and can produce a first-order alignment of . The single diameter (SD) and the distribution upper limit (PSD) are two different paths that change , and Figure 15 shows that acts as a first-order scale that aligns . Under the present conditions, when was about 20 mm or below, was generally located within the sintering zone or near the rear boundary within the 0.5 m post-processing resolution. Therefore, about 20 mm is not a sharp Complete/Incomplete separation value but a marginal coarse-particle scale, and once the downstream persistence of the centerline CO-rich region is also considered, the rear margin becomes even smaller. A more conservative model reference condition is the single diameter mm of SD3, which is not the 15 mm specification of an actual grinder-outlet PSD but a mechanistic reference value that secures a rear margin in the present model.
Moreover, because a residual gap remains depending on the size and shape of the upper-tail coarse particles even at a similar level, is a first-order coarse-particle size scale, and the tail shape should be considered together as a secondary factor. This result suggests that, in setting a practical size criterion, managing together with the upper-tail shape—rather than a nominal upper limit or an arithmetic mean—can be more directly connected to the volatile-release-completion location and the thermal-confinement assessment within the sintering zone. Therefore, the practical interpretation of this study is not to propose a single allowable upper limit but that, under the present main-burner conditions, should be used as a first-order coarse-particle scale while the upper-tail shape and the sintering-zone rear margin are checked together. A more conservative model reference condition, obtained when the downstream persistence of the centerline CO-rich region (not the stack emission) is also considered, is 15 mm. The dual peak and high peak temperature observed in the SD conditions can be alleviated when an actual size distribution is applied, and the difference of about 86 °C between SD3 and PSD1 shows that reflecting the size distribution is important for assessing flame thermal intensity. This 15 mm reference condition is not a universal grinding specification but a numerically derived reference value obtained under the SD monodisperse idealization and the present modeling conditions, which may be referred to when setting the grinder-outlet size target.
In addition, in PSD9 and PSD10, which shift the whole distribution, and also increased together in the order PSD9–PSD1–PSD10, confirming that the -based first-order alignment is maintained even on the shifted-distribution path outside the main PSD matrix. However, as seen in the comparison of PSD10 and SD5, the upper-limit diameter and the upper-tail distribution shape can produce a residual gap in even at the same level, so should be interpreted not as a sole predictor but as a first-order alignment scale for coarse-particle size.
Following Kim et al. [22], who addressed the same main-burner configuration with multivariate CFD and MOP sensitivity analysis, the present study is distinguished in that it resolves the particle size into five SD levels, eight main PSD cases, and two shifted-distribution check cases, decomposing it into the three paths of single diameter, oversize tail, and whole-distribution shift. Furthermore, it provides screening-level numerical information for extending the multistage-combustion operational stability demonstrated in the field at the calciner stage [21] to the main-burner region.
Accordingly, the results of this study are better interpreted as screening-level numerical results that present the relative trends with particle-size variation—based on the grid-independence test and the trend agreement with a prior CFD study [22]—rather than as absolute predictions independently validated by field-measurement data under the same conditions. Here, the trend agreement with the prior CFD reinforces the numerical internal consistency but does not replace independent experimental validation.
Author Contributions: Kyungmi Kim
Investigation, Data curation, Writing – original draft, Writing – review & editing, Visualization. Chanho Kim: Investigation, Data curation, Writing – review & editing. Gyosoon Kim: Conceptualization, Methodology, Writing – review & editing, Funding acquisition. Junemo Koo: Conceptualization, Supervision, Writing – review & editing.
Data Availability Statement
The CFD boundary conditions and fuel property data used in this study are derived in part from operational test data provided by Asia Cement Co., Ltd. under a confidential industrial partnership agreement. These data are not publicly available due to confidentiality constraints. The simulation methodology, governing equations, and model parameters are described in Section 2, to the extent permitted by the confidentiality constraints, to support reproducibility. Researchers seeking further information may contact the corresponding authors.
Acknowledgments
This study was supported by the Ministry of Trade, Industry and Energy (MOTIE) and the Korea Evaluation Institute of Industrial Technology (KEIT) under the Industrial Strategic Technology Development Program, grant number RS-2023-00261157, Republic of Korea.
Conflicts of Interest
The authors declare the following competing interest: this study used operational test data provided by Asia Cement Co., Ltd. under an industrial partnership agreement. The company had no role in the study design, analysis, interpretation of results, or the decision to publish. The authors have no other competing financial interests or personal relationships that could have influenced the work reported in this paper.
References
- International Energy Agency. Cement. IEA, Paris, 2024.
- European Cement Research Academy (ECRA). 2017. Development of state of the art techniques in cement manufacturing: trying to look ahead. CSI/ECRA Technology Papers 2017, Report No. A-2016/2305, ECRA. Düsseldorf, Germany. [Google Scholar]
- Rahman, A.; Rasul, M.G.; Khan, M.M.K.; Sharma, S. Recent development on the uses of alternative fuels in cement manufacturing process. Fuel 2015, 145, 84–99. [Google Scholar] [CrossRef]
- Käntee, U.; Zevenhoven, R.; Backman, R.; Hupa, M. Cement manufacturing using alternative fuels and the advantages of process modelling. Fuel Process. Technol. 2004, 85, 293–301. [Google Scholar] [CrossRef]
- Mikulčić, H.; Klemeš, J.J.; Vujanović, M.; Urbaniec, K.; Duić, N. Reducing greenhouse gasses emissions by fostering the deployment of alternative raw materials and energy sources in the cleaner cement manufacturing process. J. Clean. Prod. 2016, 136, 119–132. [Google Scholar] [CrossRef]
- CEMBUREAU. Activity Report 2023; Technical report; European Cement Association: Brussels, Belgium, 2023. [Google Scholar]
- Mateus, M.M.; Neuparth, T.; Cecílio, D.M. Modern Kiln Burner Technology in the Current Energy Climate: Pushing the Limits of Alternative Fuel Substitution. Fire 2023, 6, 74. [Google Scholar] [CrossRef]
- John, P.P. Parametric studies of cement production processes. J. Energy 2020, 2020, 4289043. [Google Scholar] [CrossRef]
- Jo, J.H.; Yun, S.I.; Lee, S.J.; Choi, J.H.; Kim, E.C. Study on the utilization of waste plastic in the Korea cement industry and the revision of KS standards for increasing fuel substitution rates. J. Recycl. Constr. Resour. 2024, 12, 306–313. [Google Scholar] [CrossRef]
- Pedersen, M.N. Co-firing of Alternative Fuels in Cement Kiln Burners. Ph.d. thesis, Technical University of Denmark, Kgs. Lyngby, Denmark, 2018; p. 283 p. [Google Scholar]
- Pedersen, M.N.; Nielsen, M.; Clausen, S.; Jensen, P.A.; Jensen, L.S.; Dam-Johansen, K. Imaging of flames in cement kilns to study the influence of different fuel types. Energy Fuels 2017, 31, 11424–11438. [Google Scholar] [CrossRef]
- Ariyaratne, W.K.H.; Malagalage, A.; Melaaen, M.C.; Tokheim, L.A. CFD modelling of meat and bone meal combustion in a cement rotary kiln — Investigation of fuel particle size and fuel feeding position impacts. Chem. Eng. Sci. 2015, 123, 596–608. [Google Scholar] [CrossRef]
- Kroumian, C.; Maier, J.; Peloriadi, K.; Scheffknecht, G.; Grammelis, P. Evaluation of 100% alternative fuel combustion under oxyfuel conditions in a pilot-scale burner for application in retrofit oxyfuel cement kiln. Fuel 2025, 381, 133697. [Google Scholar] [CrossRef]
- Haas, J.; Weber, R. Co-firing of refuse derived fuels with coals in cement kilns: combustion conditions for stable sintering. J. Energy Inst. 2010, 83, 225–234. [Google Scholar] [CrossRef]
- Pieper, C.; Liedmann, B.; Wirtz, S.; Scherer, V.; Bodendiek, N.; Schaefer, S. Interaction of the combustion of refuse derived fuel with the clinker bed in rotary cement kilns: A numerical study. Fuel 2020, 266, 117048. [Google Scholar] [CrossRef]
- Wirtz, S.; Pieper, C.; Buss, F.; Schiemann, M.; Schaefer, S.; Scherer, V. Impact of coating layers in rotary cement kilns: Numerical investigation with a blocked-off region approach for radiation and momentum. Therm. Sci. Eng. Prog. 2020, 15, 100429. [Google Scholar] [CrossRef]
- Poggianti, B.; Palazzolo, R.; Moliner, C. Rotary kiln simulation for energy recovery: The precalciner cement kiln case. Therm. Sci. Eng. Prog. 2024, 54, 102806. [Google Scholar] [CrossRef]
- Hercog, J.; Lewtak, R.; Glot, B.; Jóźwiak, P.; Nehring, G.; Tavares, V.D. Pilot testing and numerical simulations of the multifuel burner for the cement kiln. Fuel 2023, 342, 127801. [Google Scholar] [CrossRef]
- European Committee for Standardization. EN ISO 21640:2021; Solid Recovered Fuels — Specifications and Classes. CEN: Brussels, 2021.
- Ting, Z.J.; Meng, X.; Zhu, Y.; Jiskani, S.A.; Hu, L.; Dong, W.; Zhao, M. Solid recovered fuel (SRF): A comprehensive review of its origins, production, and industrial utilization. Energy Fuels 2025, 39, 9726–9761. [Google Scholar] [CrossRef]
- Choi, J.W.; Back, J.I.; Kim, J.J.; Won, P.S. Case study on NOx emissions from cement kiln before and after applying multi-stage combustion technology. J. Recycl. Constr. Resour. 2023, 11, 267–275. [Google Scholar] [CrossRef]
- Kim, K.M.; Ahn, H.S.; Kim, G.S. Combustion stability and emissions characteristics of a cement kiln main burner with waste-synthetic resin as an alternative fuel: A CFD parametric study. J. Recycl. Constr. Resour. 2025, 13, 534–543. [Google Scholar] [CrossRef]
- Mujumdar, K.S.; Ranade, V.V. CFD modeling of rotary cement kilns. Asia-Pac. J. Chem. Eng. 2008, 3, 106–118. [Google Scholar] [CrossRef]
- Mikulčić, H.; Vujanović, M.; Fidaros, D.K.; Priesching, P.; Minić, I.; Tatschl, R. The application of CFD modelling to support the reduction of CO2 emissions in cement industry. Energy 2012, 45, 464–473. [Google Scholar] [CrossRef]
- Cecílio, D.M.; Mateus, M.; Ferreiro, A.I. Industrial Rotary Kiln Burner Performance with 3D CFD Modeling. Fuels 2023, 4, 454–468. [Google Scholar] [CrossRef]
- ANSYS Inc. ANSYS Fluent Theory Guide, Release 2024 R1; ANSYS Inc.: Canonsburg, PA, 2024. [Google Scholar]
- Shih, T.H.; Liou, W.W.; Shabbir, A.; Yang, Z.; Zhu, J. A new k–ε eddy viscosity model for high Reynolds number turbulent flows. Comput. Fluids 1995, 24, 227–238. [Google Scholar] [CrossRef]
- Ngadi, Z.; Lahlaouti, M.L. CFD modeling of petcoke co-combustion in a real cement kiln: the effect of the turbulence-chemistry interaction model applied with k–ε variations. Int. Rev. Appl. Sci. Eng. 2022, 13, 148–163. [Google Scholar] [CrossRef]
- Chui, E.H.; Raithby, G.D. Computation of radiant heat transfer on a non-orthogonal mesh using the finite-volume method. Numer. Heat Transf. Part B Fundam. 1993, 23, 269–288. [Google Scholar] [CrossRef]
- Smith, T.F.; Shen, Z.F.; Friedman, J.N. Evaluation of coefficients for the weighted sum of gray gases model. J. Heat Transf. 1982, 104, 602–608. [Google Scholar] [CrossRef]
- Morsi, S.A.; Alexander, A.J. An investigation of particle trajectories in two-phase flow systems. J. Fluid Mech. 1972, 55, 193–208. [Google Scholar] [CrossRef]
- Badzioch, S.; Hawksley, P.G.W. Kinetics of thermal decomposition of pulverized coal particles. Ind. Eng. Chem. Process Des. Dev. 1970, 9, 521–530. [Google Scholar] [CrossRef]
- Torresi, M.; Fornarelli, F.; Fortunato, B.; Camporeale, S.M.; Saponaro, A. Assessment against Experiments of Devolatilization and Char Burnout Models for the Simulation of an Aerodynamically Staged Swirled Low-NOx Pulverized Coal Burner. Energies 2017, 10, 66. [Google Scholar] [CrossRef]
- Magnussen, B.F.; Hjertager, B.H. On mathematical modeling of turbulent combustion with special emphasis on soot formation and combustion. Symposium (International) Combust. 1977, 16, 719–729. [Google Scholar] [CrossRef]
- Han, F.y.; Wang, M.; Ma, X.b.; Yin, L.j.; Chen, D.z.; Liu, Z.q.; Zhang, R.n. Numerical simulation of heat transfer properties of large-sized biomass particles during pyrolysis process. Heliyon 2023, 9, e21255. [Google Scholar] [CrossRef]
- Magalhães, D.; Panahi, A.; Kazanç, F.; Levendis, Y.A. Comparison of single particle combustion behaviours of raw and torrefied biomass with Turkish lignites. Fuel 2019, 241, 1085–1094. [Google Scholar] [CrossRef]
- Mohanna, H.; Commandré, J.M.; Piriou, B.; Vaitilingom, G.; Taupin, B.; Honoré, D. Shadowgraphy investigation of the combustion of raw and pre-treated single biomass particles: Influence of particle size and volatile content. Fuel 2019, 258, 116113. [Google Scholar] [CrossRef]
Figure 1.
Multi-channel main burner geometry and channel arrangement (axial primary air, swirl primary air, pulverized coal, WSR, and oxygen).
Figure 1.
Multi-channel main burner geometry and channel arrangement (axial primary air, swirl primary air, pulverized coal, WSR, and oxygen).
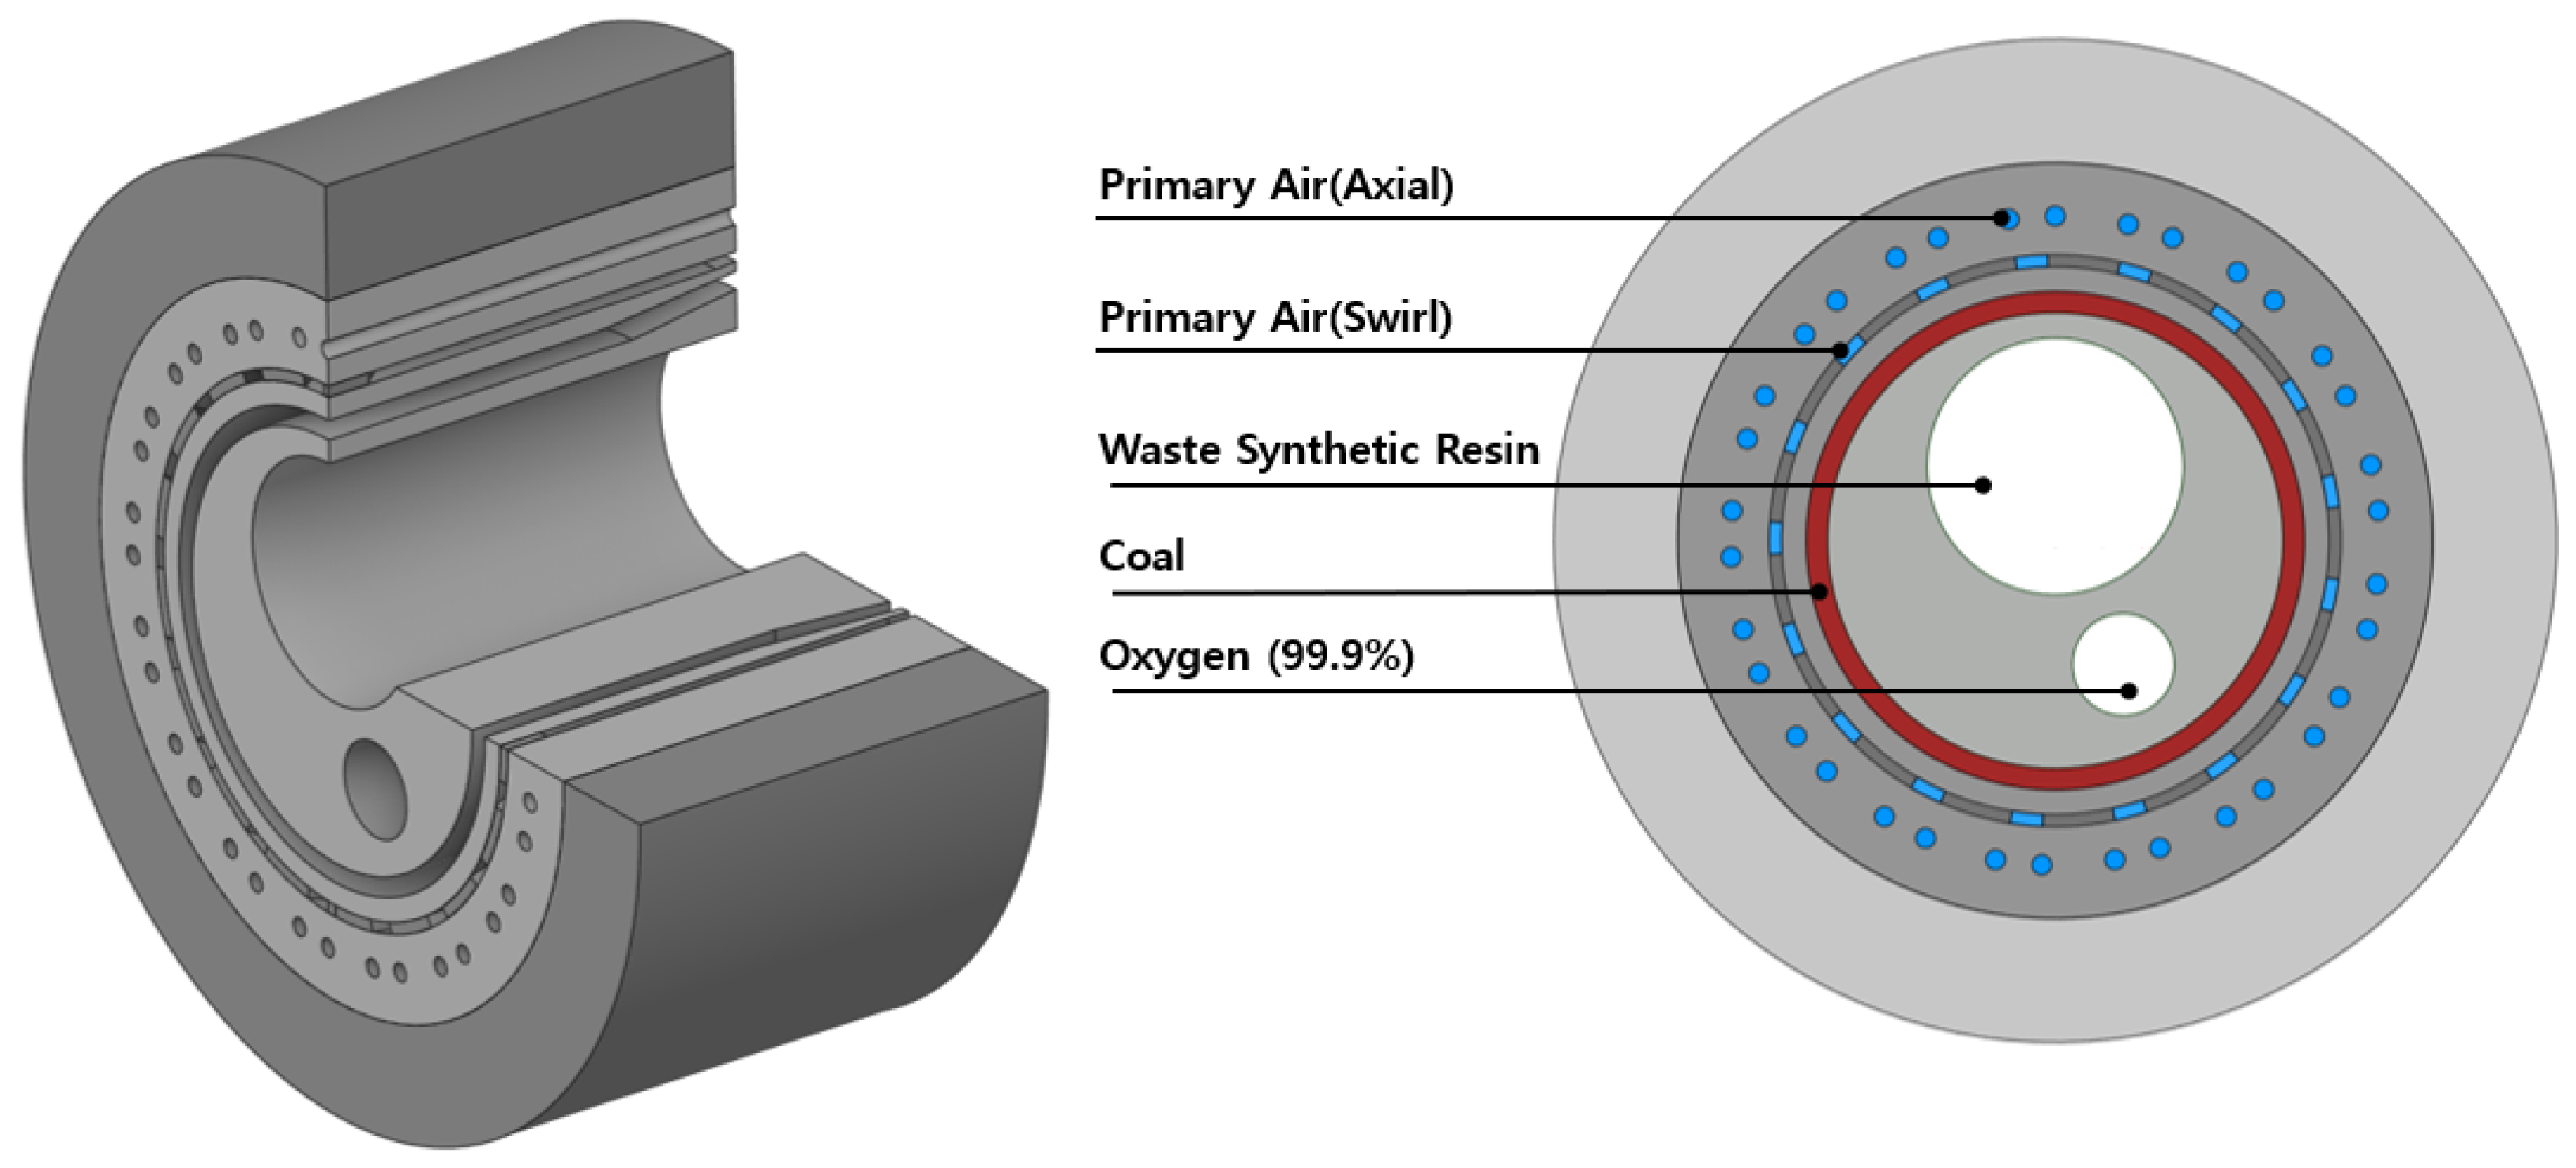
Figure 2.
Computational domain of the rotary cement kiln (4.58 m inner diameter × 50 m length) with the assigned boundary conditions: rotating no-slip wall, secondary-air inlet at the kiln hood, and pressure outlet at the kiln inlet.
Figure 2.
Computational domain of the rotary cement kiln (4.58 m inner diameter × 50 m length) with the assigned boundary conditions: rotating no-slip wall, secondary-air inlet at the kiln hood, and pressure outlet at the kiln inlet.
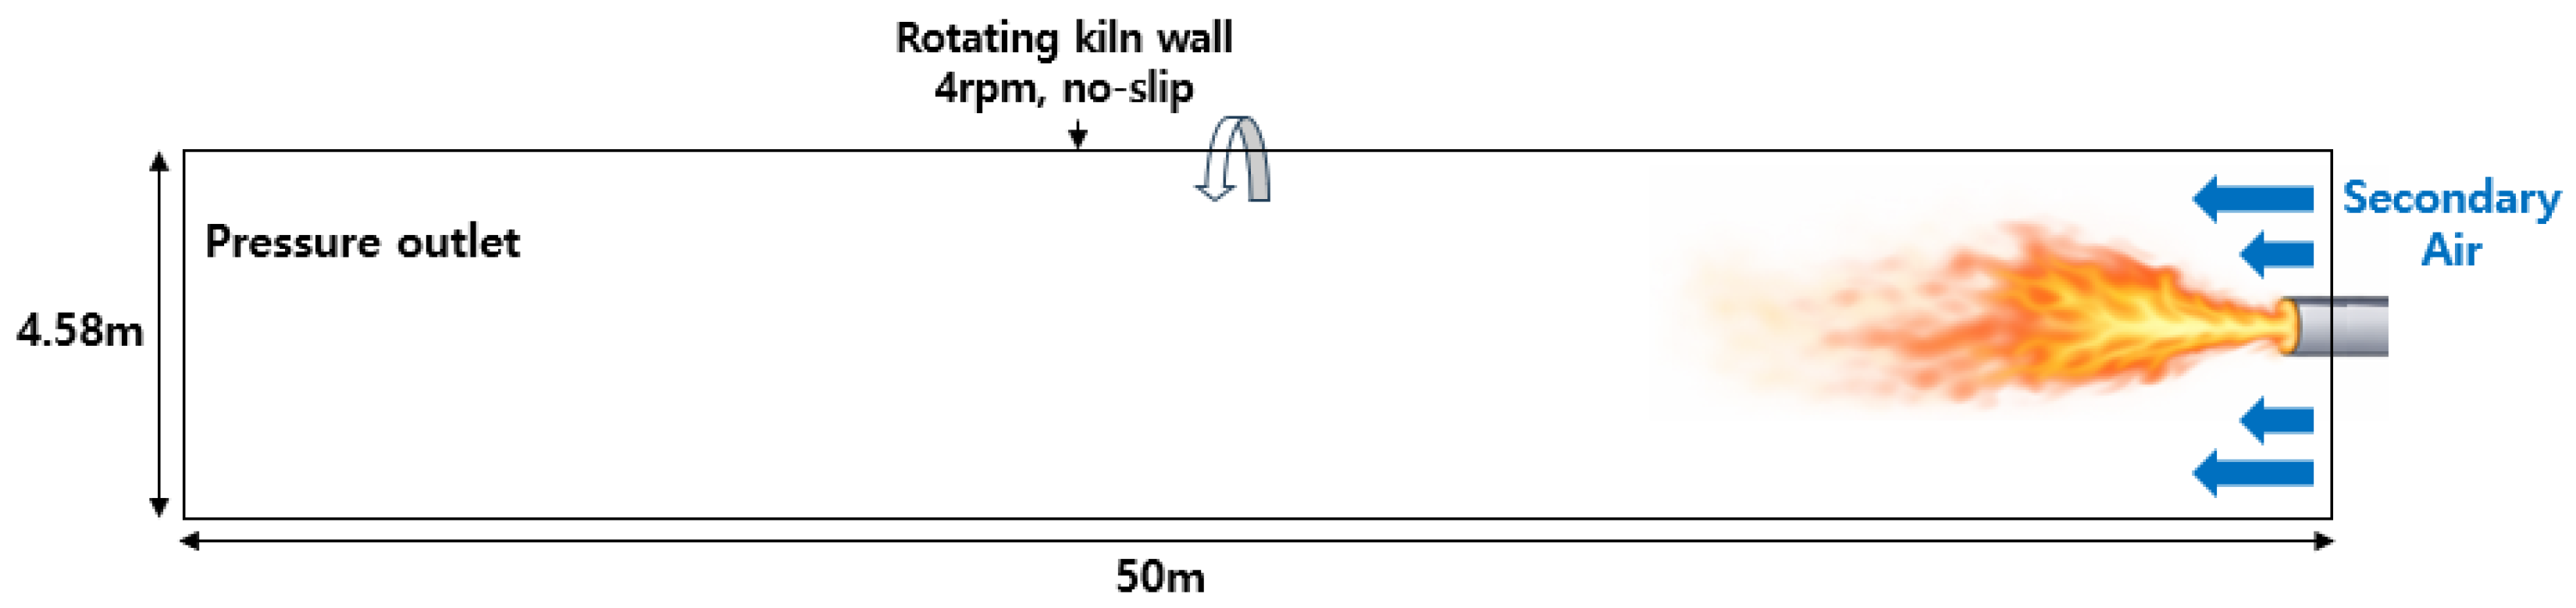
Figure 3.
Computational mesh overview and local refinement near the multi-channel burner tip.
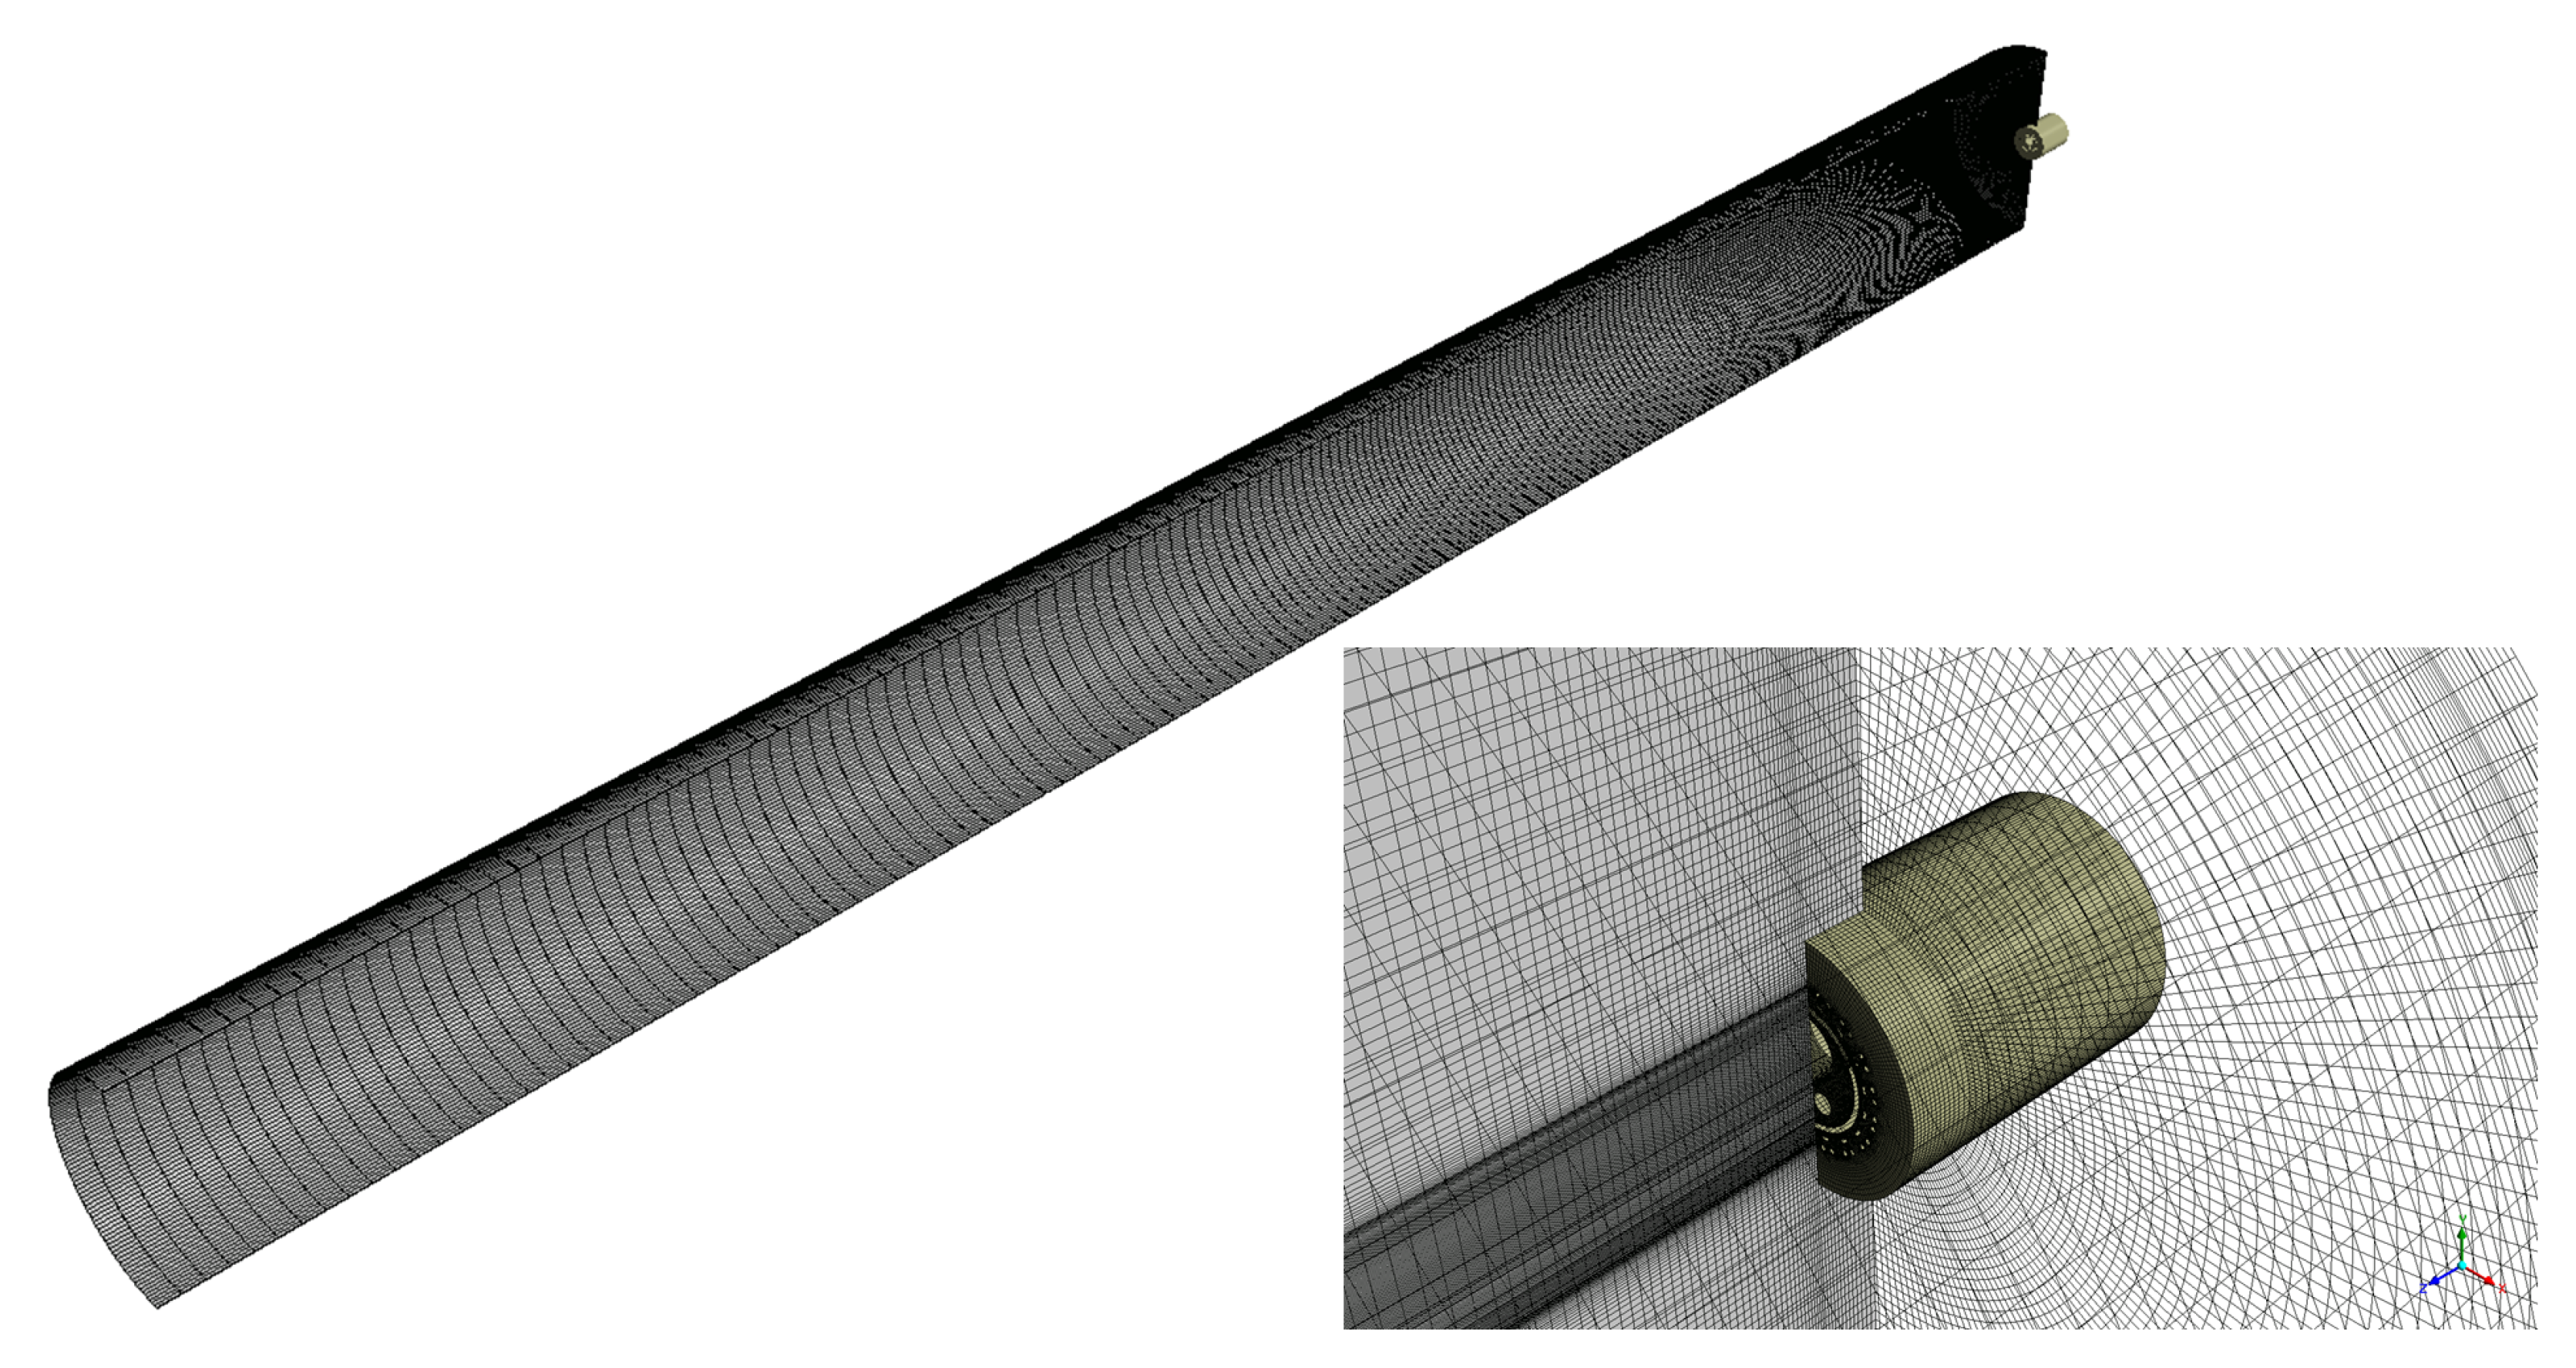
Figure 4.
Rosin–Rammler particle size distributions of the four broad-distribution PSD cases (PSD1–PSD4; ). The characteristic diameter ( mm) and spread parameter () are held fixed while the upper cutoff is set to 20, 25, 30, or 35 mm; each distribution is truncated and renormalized over with mm, consistent with the DPM injection lower bound used in all CFD cases. (a) Cumulative undersize ; (b) differential (mass) density . The dashed vertical line marks the Rosin–Rammler input characteristic diameter ( mm) before truncation; it is not the 63.2% quantile of the truncated distribution. The truncated arithmetic means (11.4, 13.0, 14.2, 15.2 mm) coincide with the values reported in Table 5. The narrow-distribution cases (PSD5–PSD8, ) are not shown here; their size distributions and truncated means are reported in Section 3.3.
Figure 4.
Rosin–Rammler particle size distributions of the four broad-distribution PSD cases (PSD1–PSD4; ). The characteristic diameter ( mm) and spread parameter () are held fixed while the upper cutoff is set to 20, 25, 30, or 35 mm; each distribution is truncated and renormalized over with mm, consistent with the DPM injection lower bound used in all CFD cases. (a) Cumulative undersize ; (b) differential (mass) density . The dashed vertical line marks the Rosin–Rammler input characteristic diameter ( mm) before truncation; it is not the 63.2% quantile of the truncated distribution. The truncated arithmetic means (11.4, 13.0, 14.2, 15.2 mm) coincide with the values reported in Table 5. The narrow-distribution cases (PSD5–PSD8, ) are not shown here; their size distributions and truncated means are reported in Section 3.3.
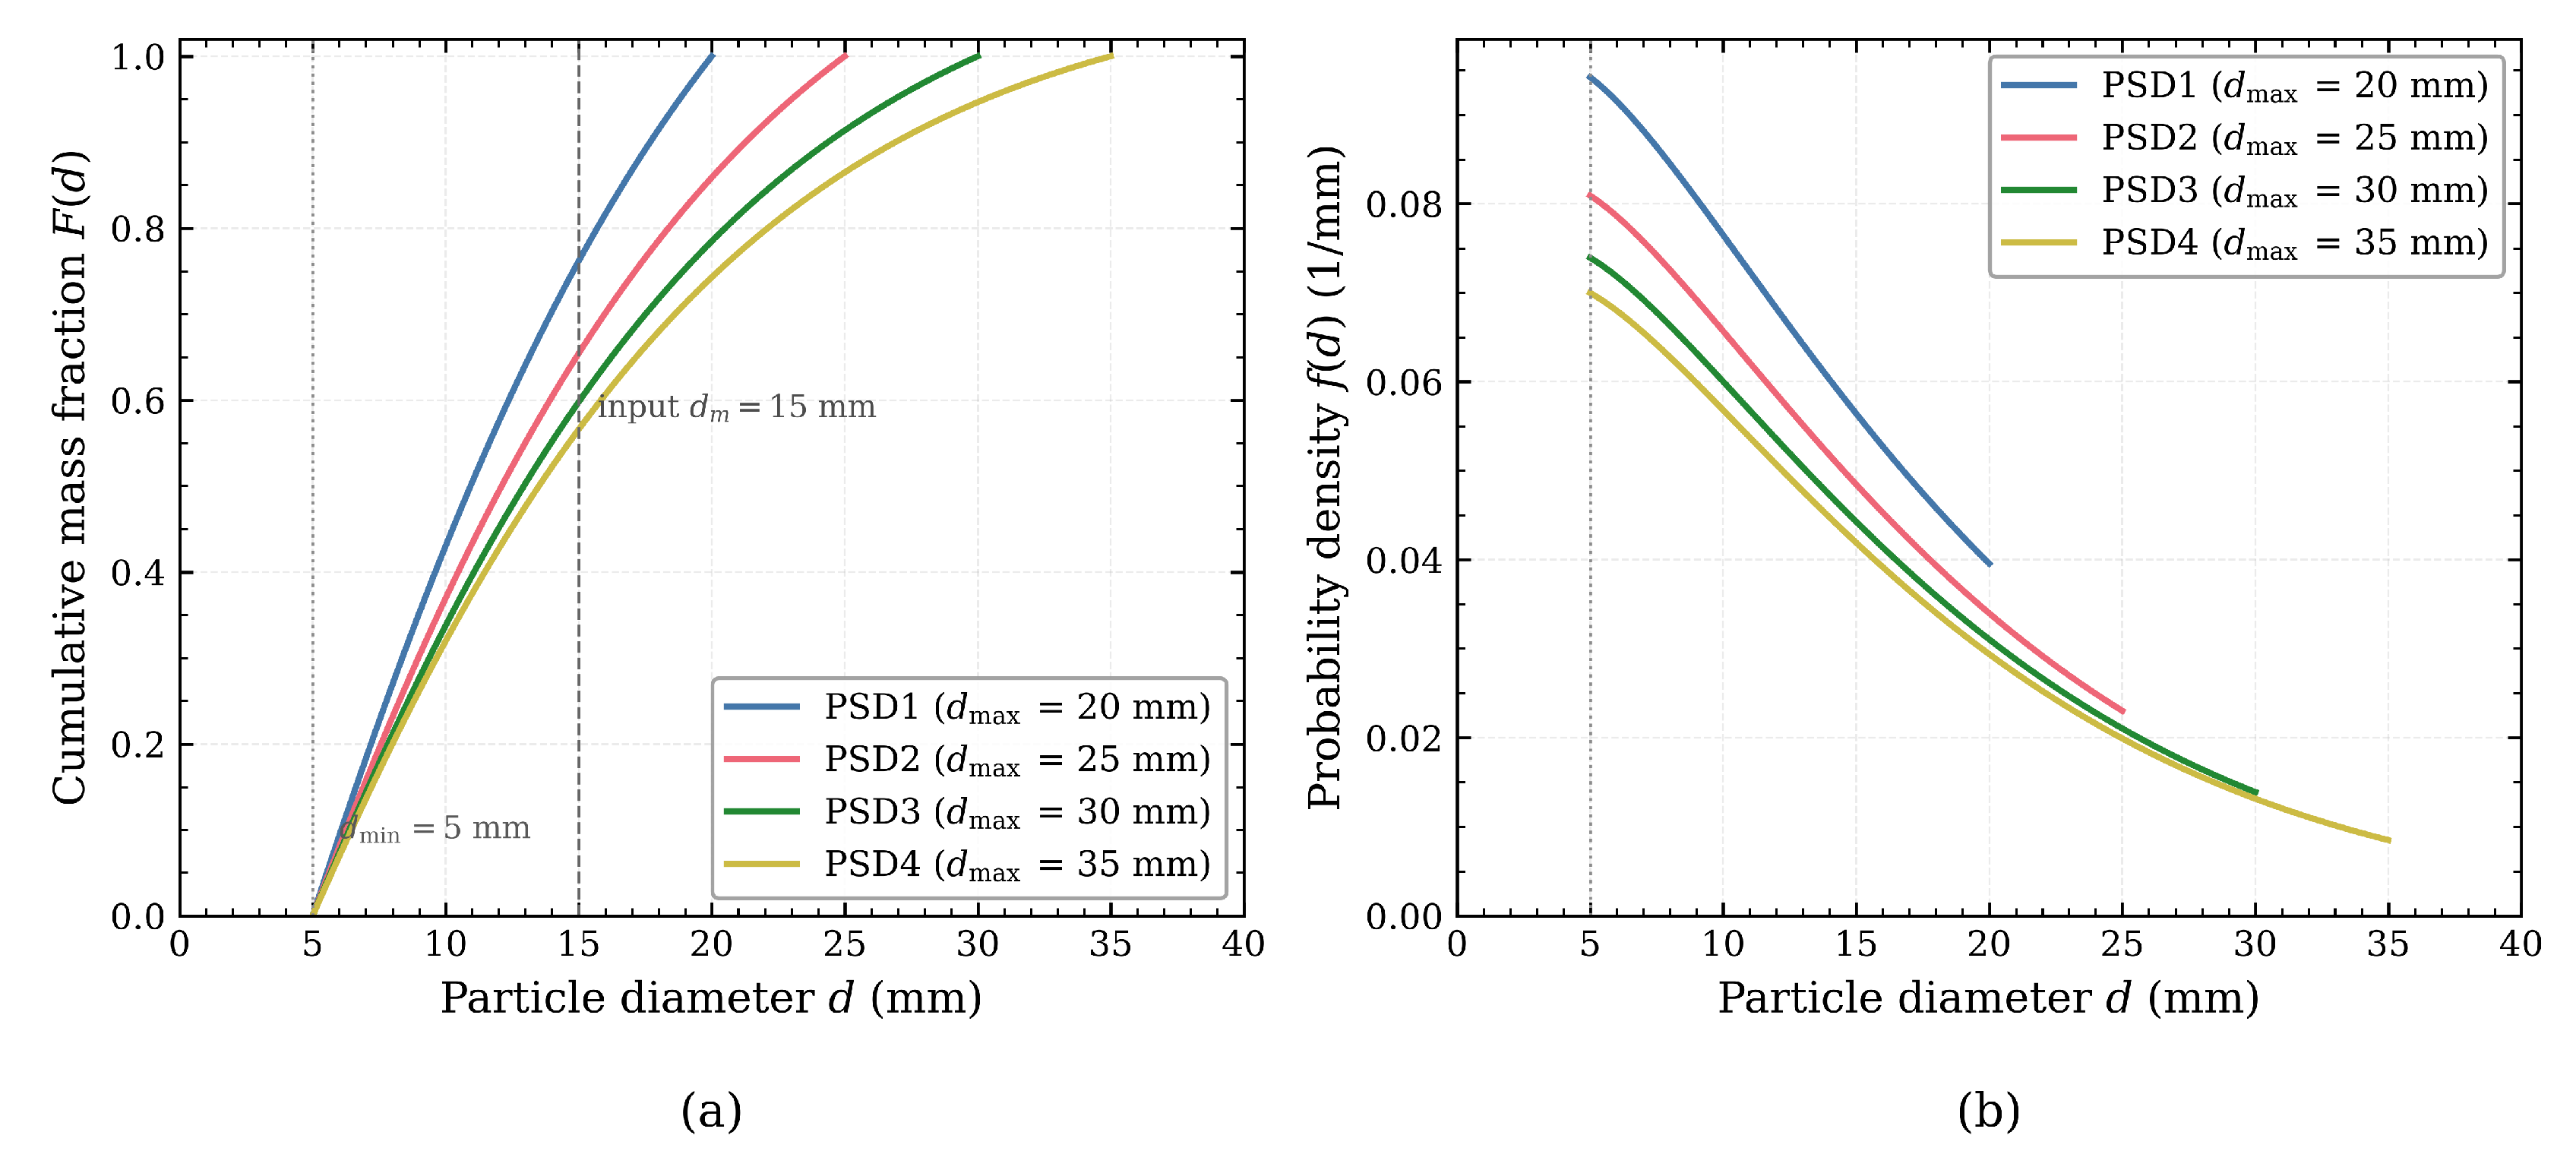
Figure 5.
Axial gas temperature profile under the coal-only baseline condition (WSR 0%). The x-axis denotes the distance measured from the burner tip toward the kiln inlet; the shaded segment (5–20 m) corresponds to the sintering zone defined in this study.
Figure 5.
Axial gas temperature profile under the coal-only baseline condition (WSR 0%). The x-axis denotes the distance measured from the burner tip toward the kiln inlet; the shaded segment (5–20 m) corresponds to the sintering zone defined in this study.
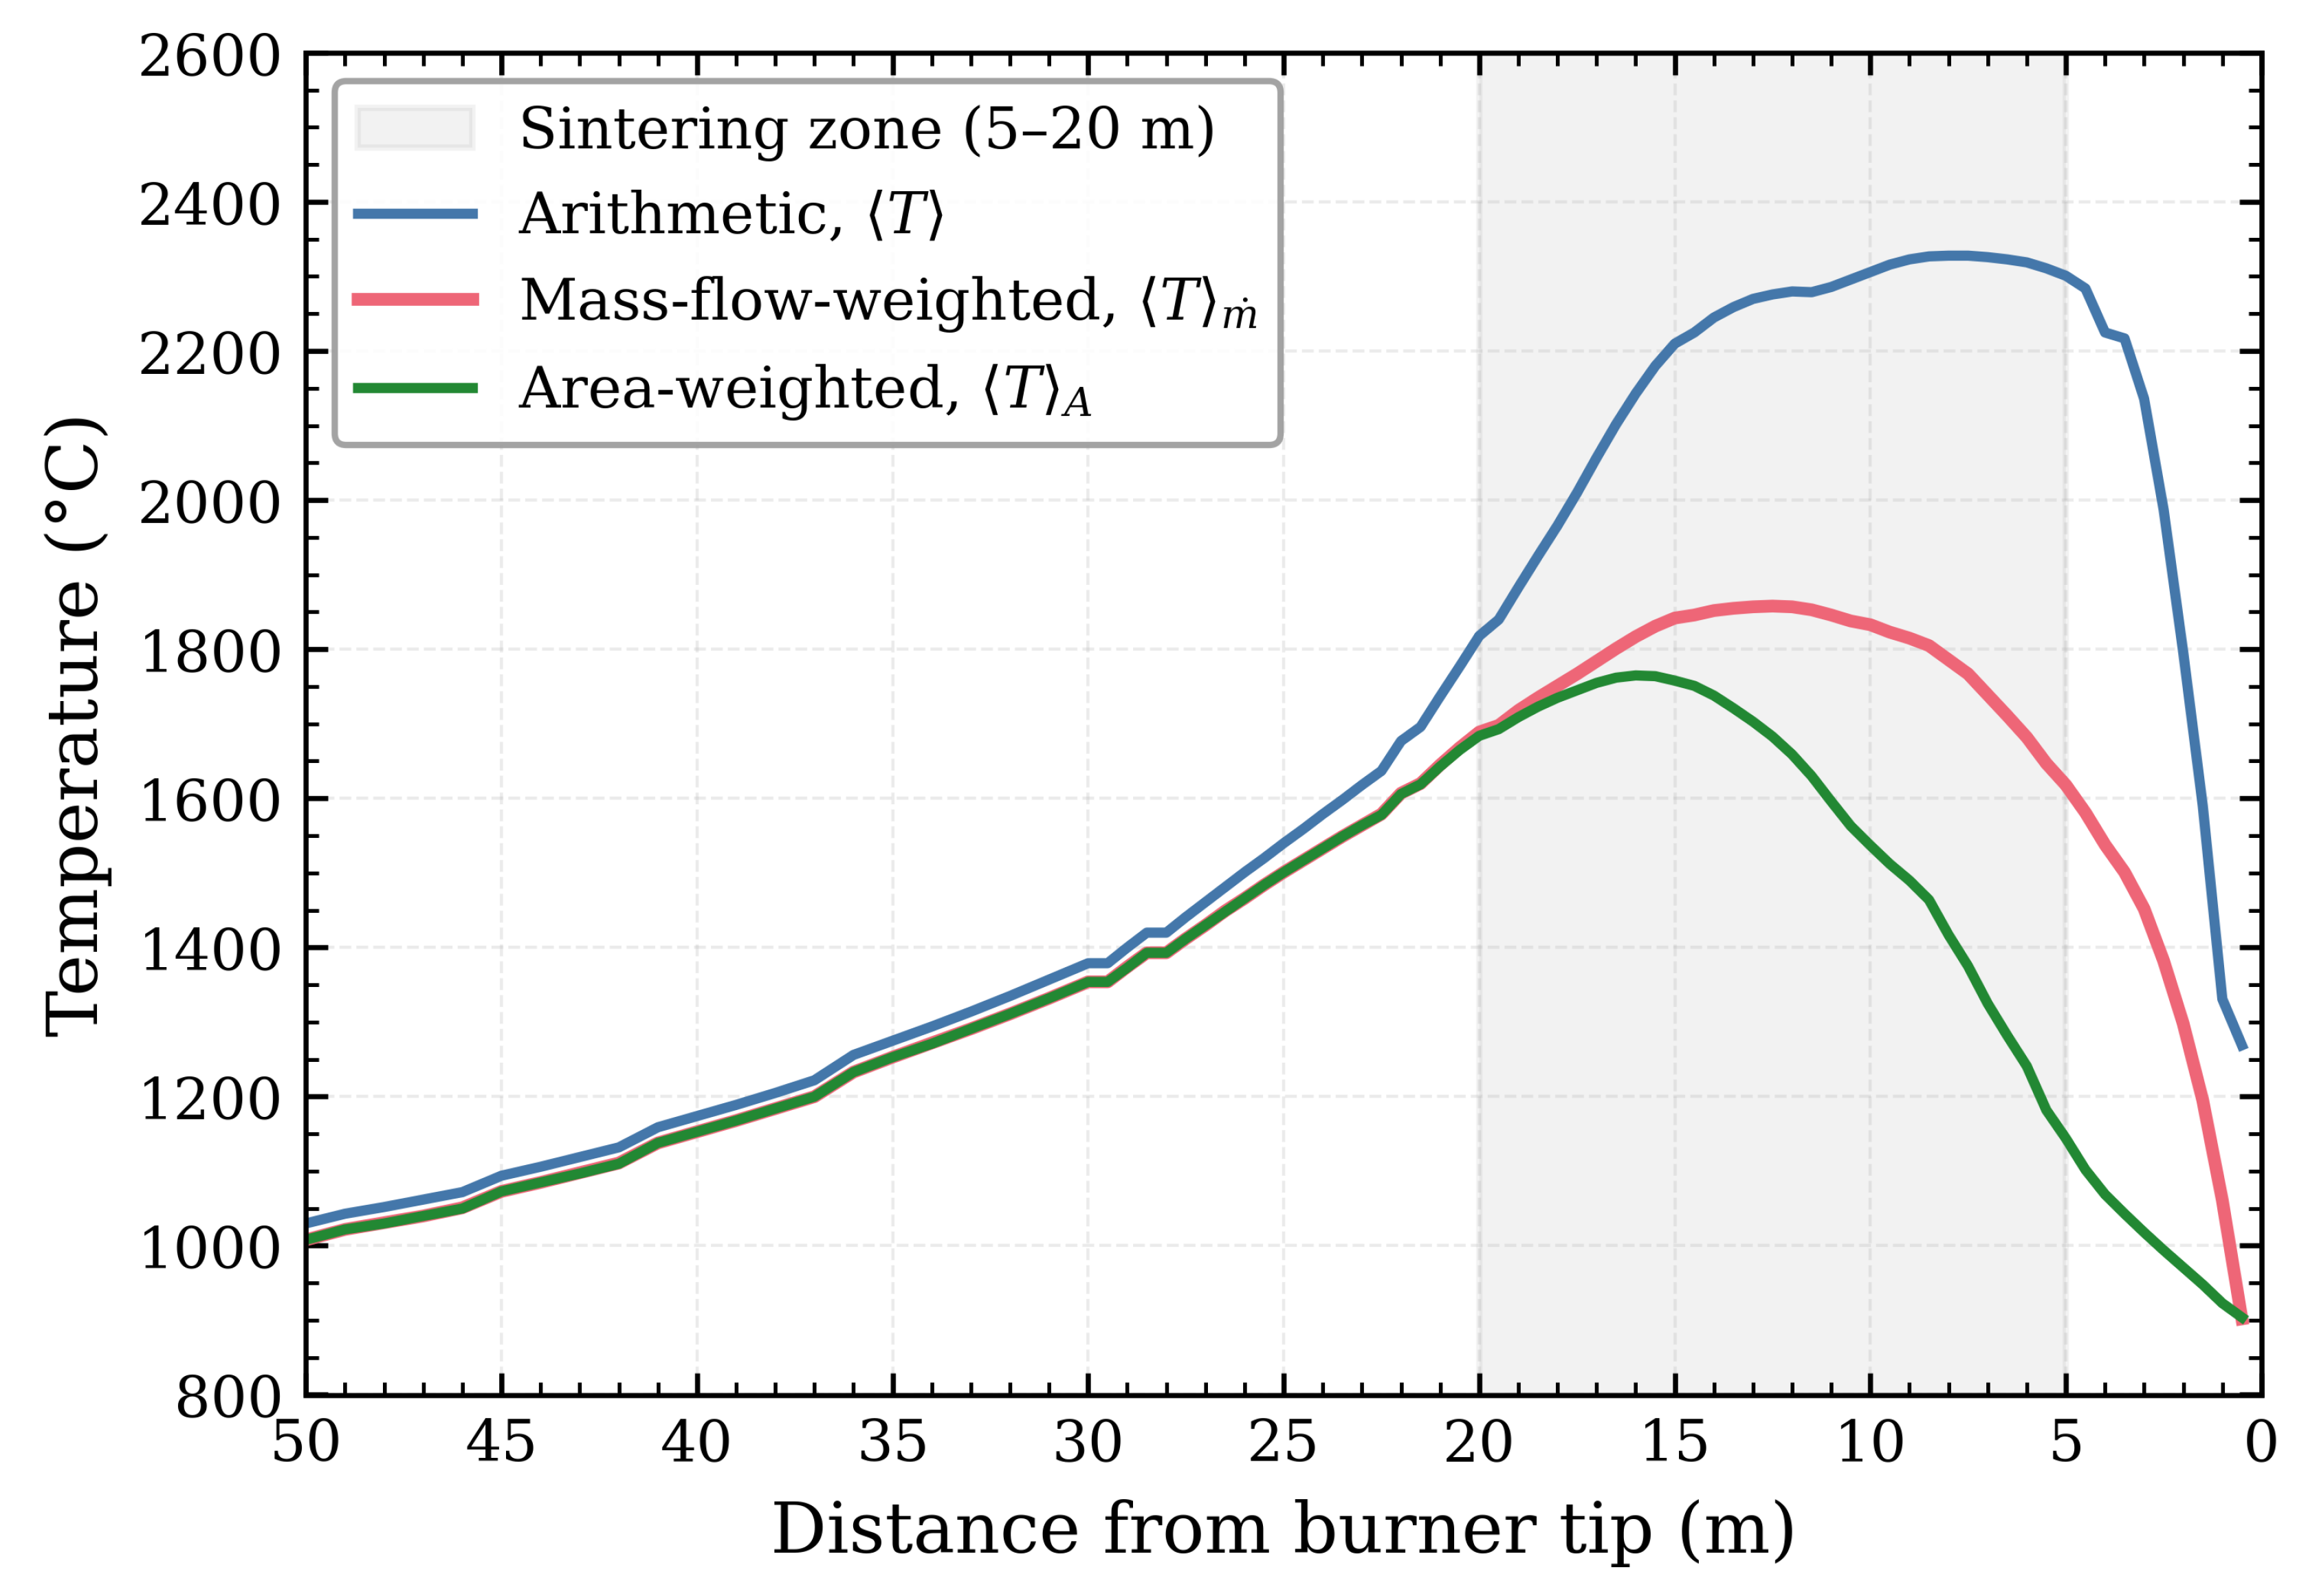
Figure 6.
Axial temperature distribution under the coal-only baseline (WSR 0%) and WSR co-firing (≈21% thermal substitution, mm) conditions: (a) mass-flow-weighted mean temperature, ; (b) arithmetic mean temperature, . The shaded segment (5–20 m) corresponds to the sintering zone.
Figure 6.
Axial temperature distribution under the coal-only baseline (WSR 0%) and WSR co-firing (≈21% thermal substitution, mm) conditions: (a) mass-flow-weighted mean temperature, ; (b) arithmetic mean temperature, . The shaded segment (5–20 m) corresponds to the sintering zone.
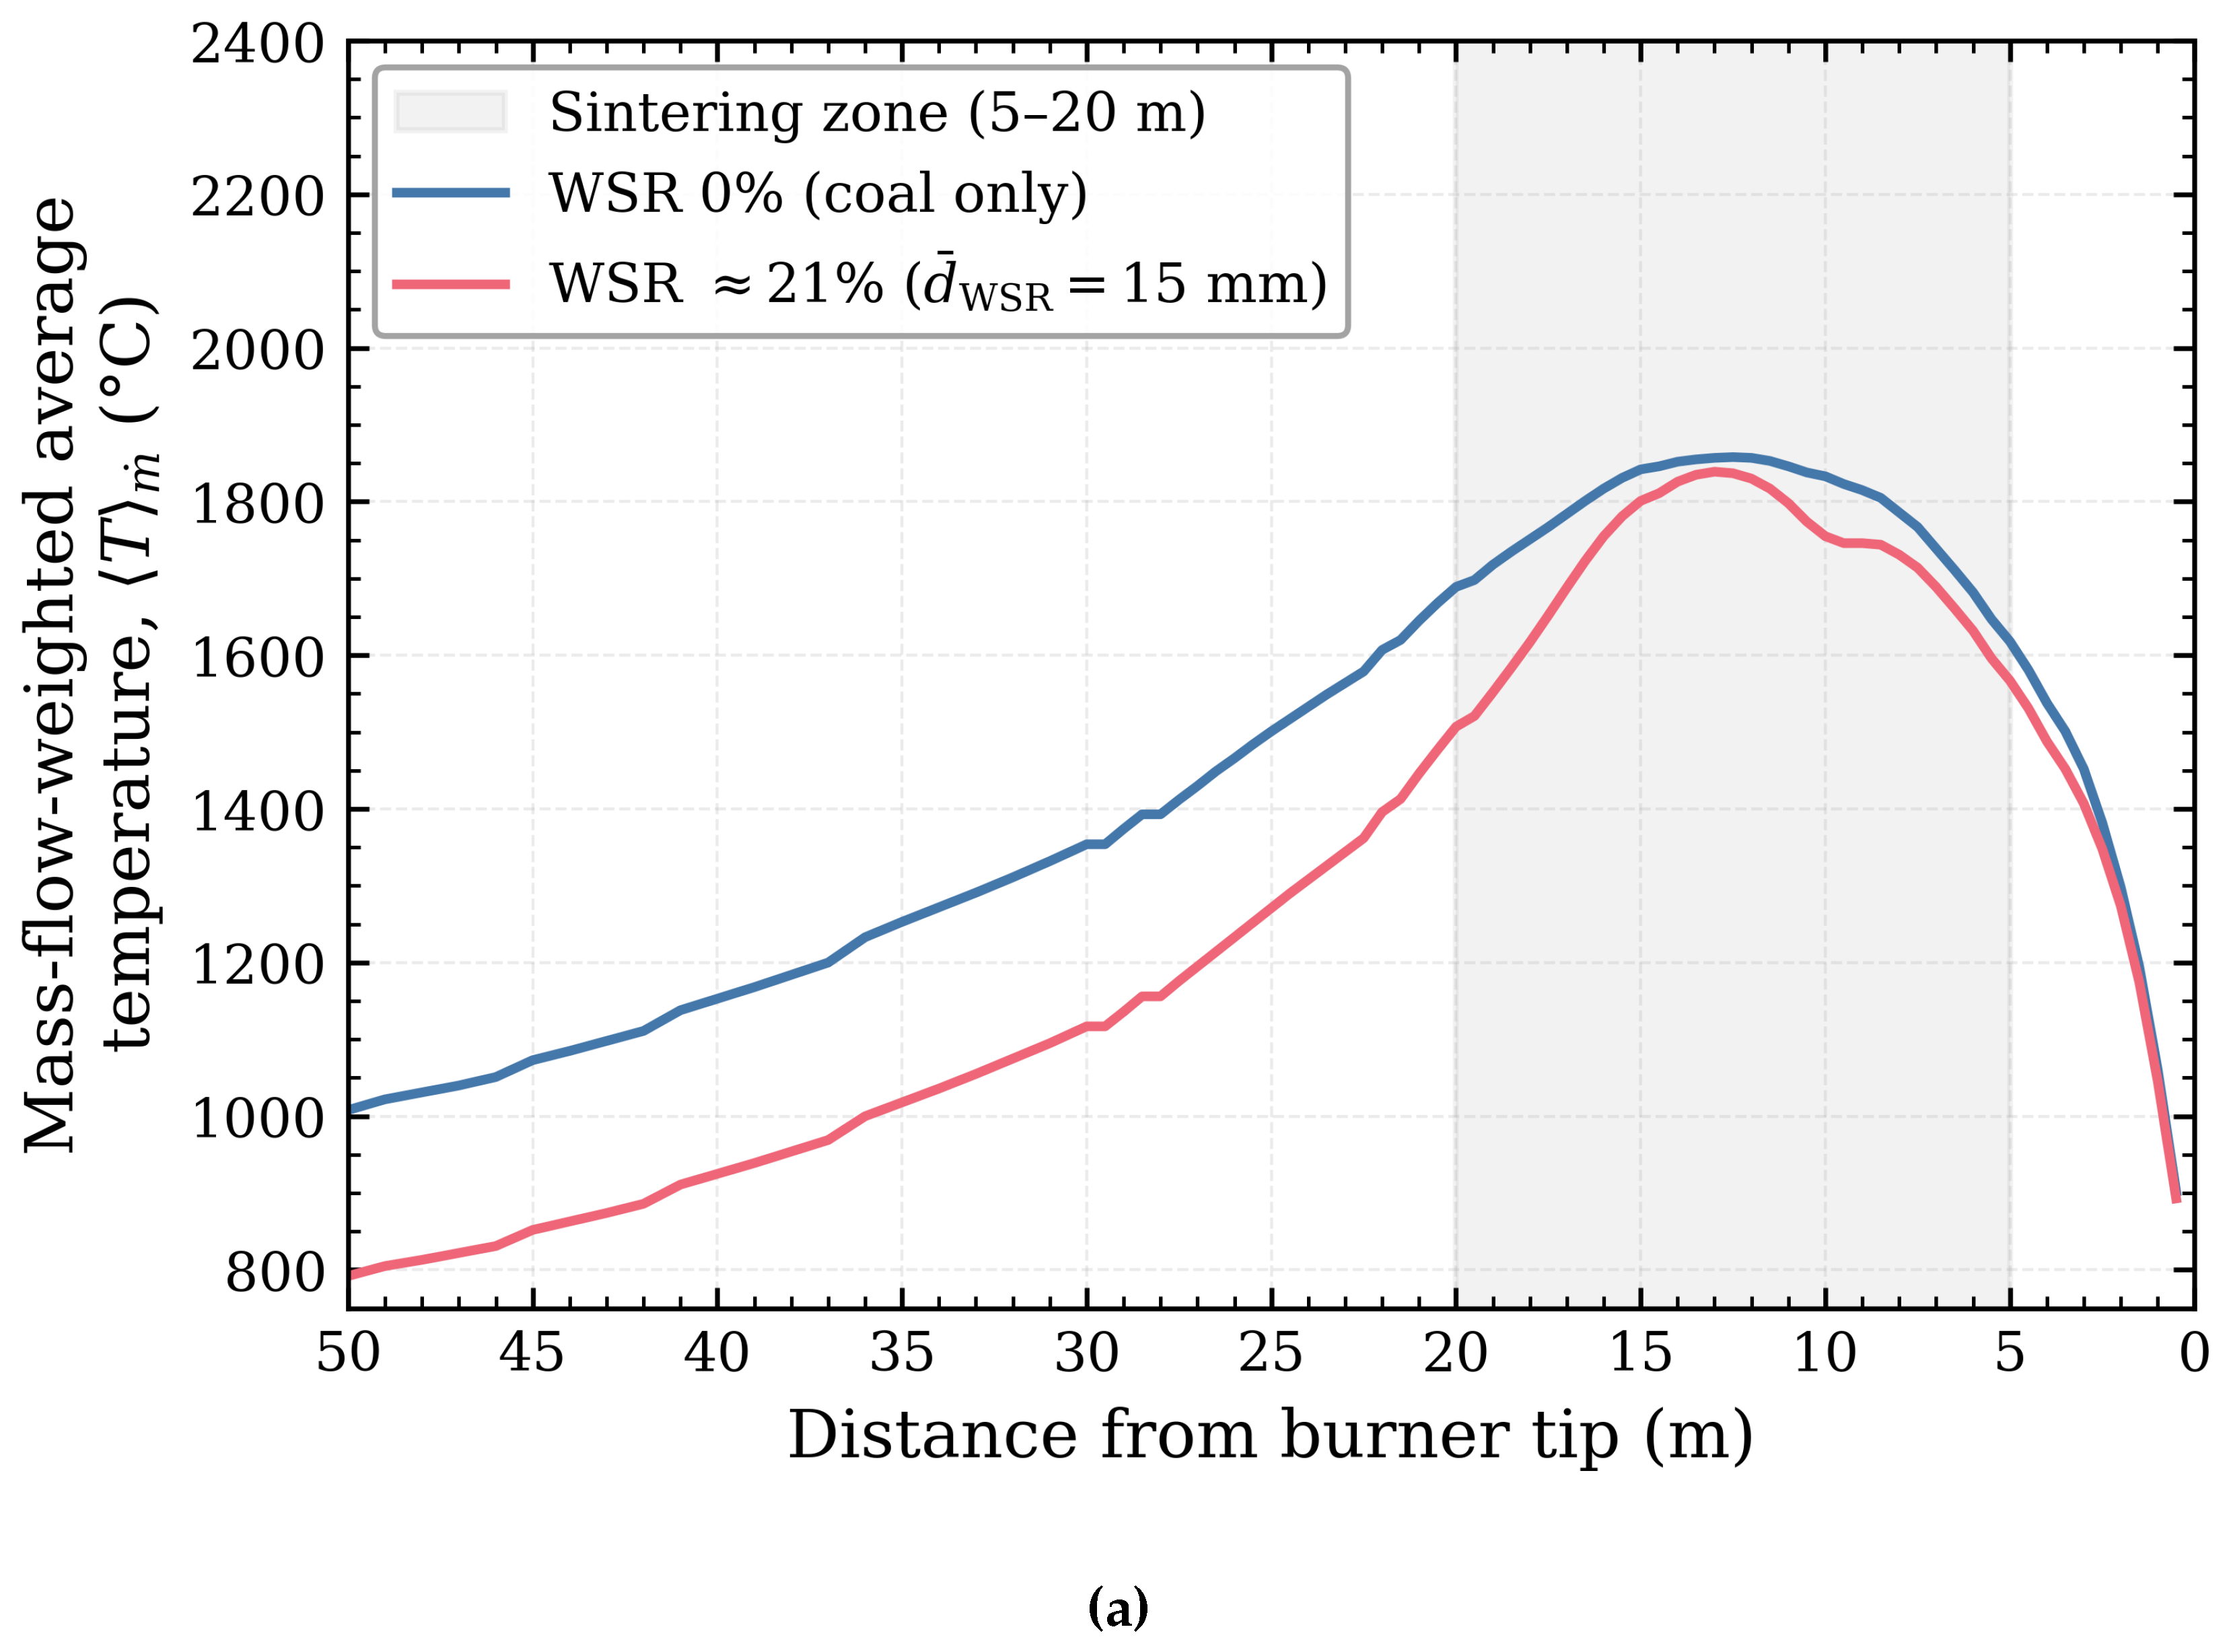
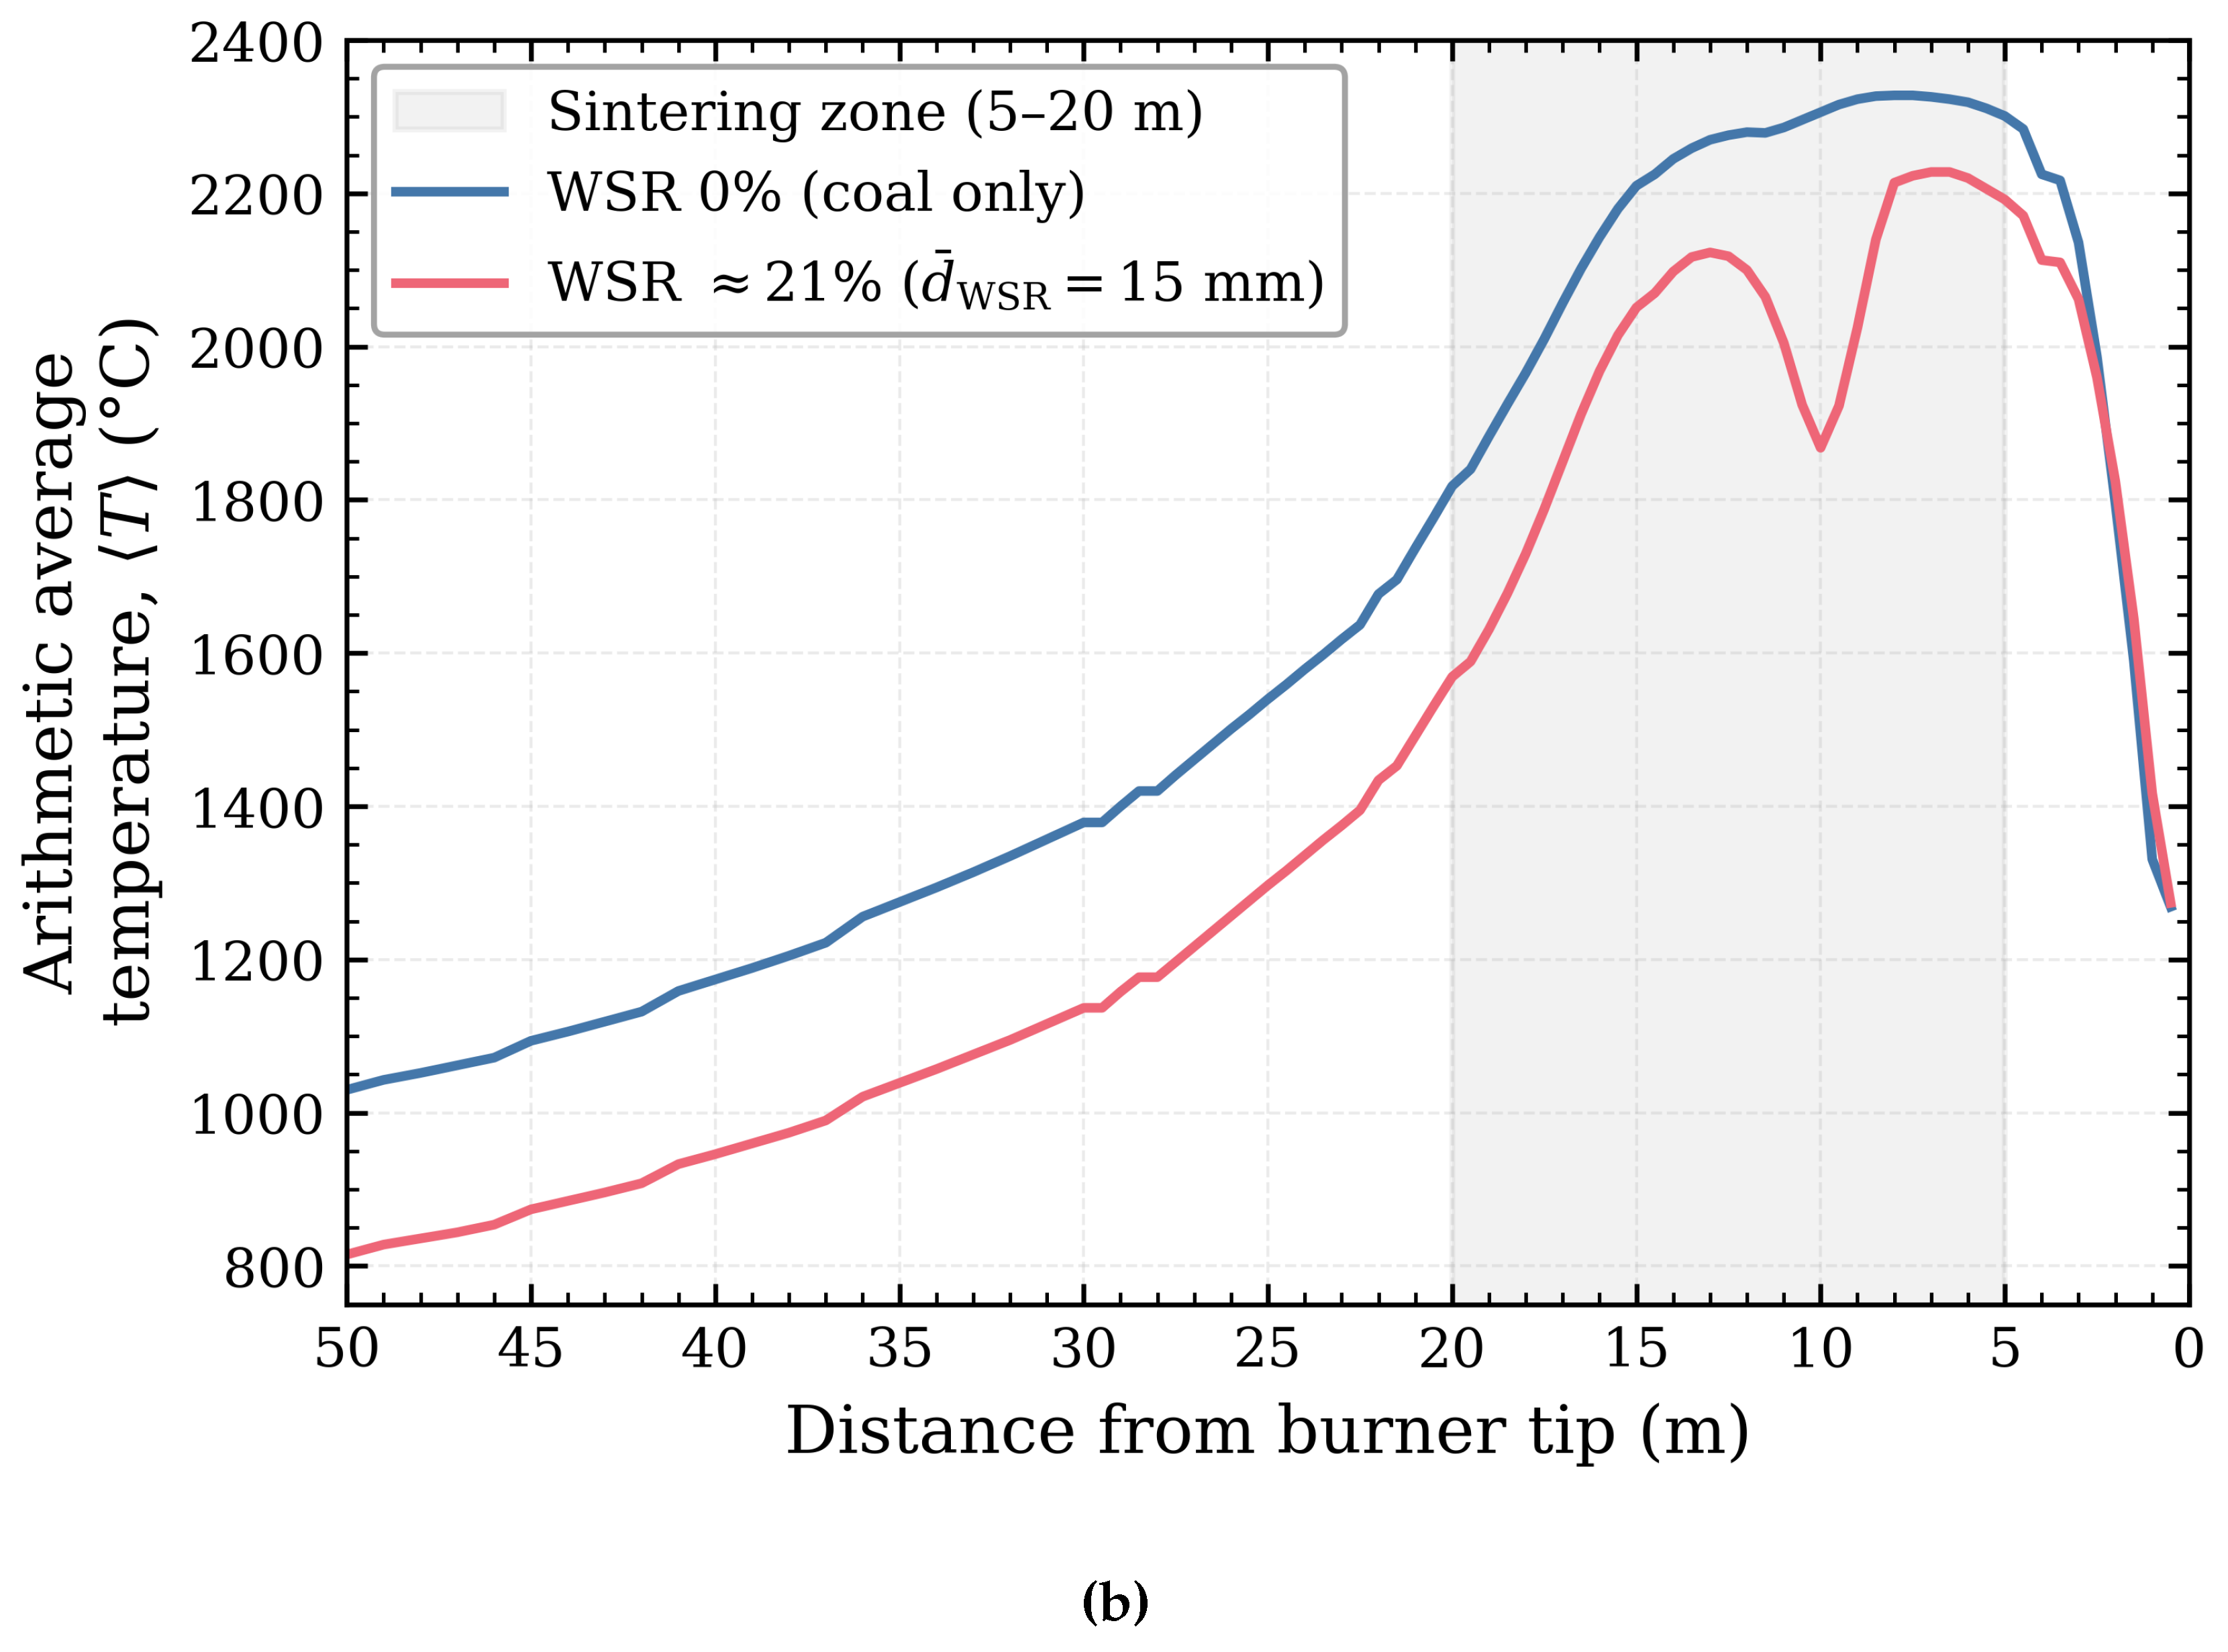
Figure 7.
Comparison of temperature isotherms on the axial plane of the kiln for the coal-only baseline (WSR 0%, top) and WSR co-firing (≈21% thermal substitution, mm, bottom). Axial position is measured in meters from the burner tip. The shaded region indicates T ≥ 2000 °C, highlighting the spatial morphology of the high-temperature flame core, while the remaining curves denote lower-temperature isotherms. Quantitative axial temperature profiles for both cases are shown in Figure 6; Table 6 summarizes only the coal-only baseline values.
Figure 7.
Comparison of temperature isotherms on the axial plane of the kiln for the coal-only baseline (WSR 0%, top) and WSR co-firing (≈21% thermal substitution, mm, bottom). Axial position is measured in meters from the burner tip. The shaded region indicates T ≥ 2000 °C, highlighting the spatial morphology of the high-temperature flame core, while the remaining curves denote lower-temperature isotherms. Quantitative axial temperature profiles for both cases are shown in Figure 6; Table 6 summarizes only the coal-only baseline values.
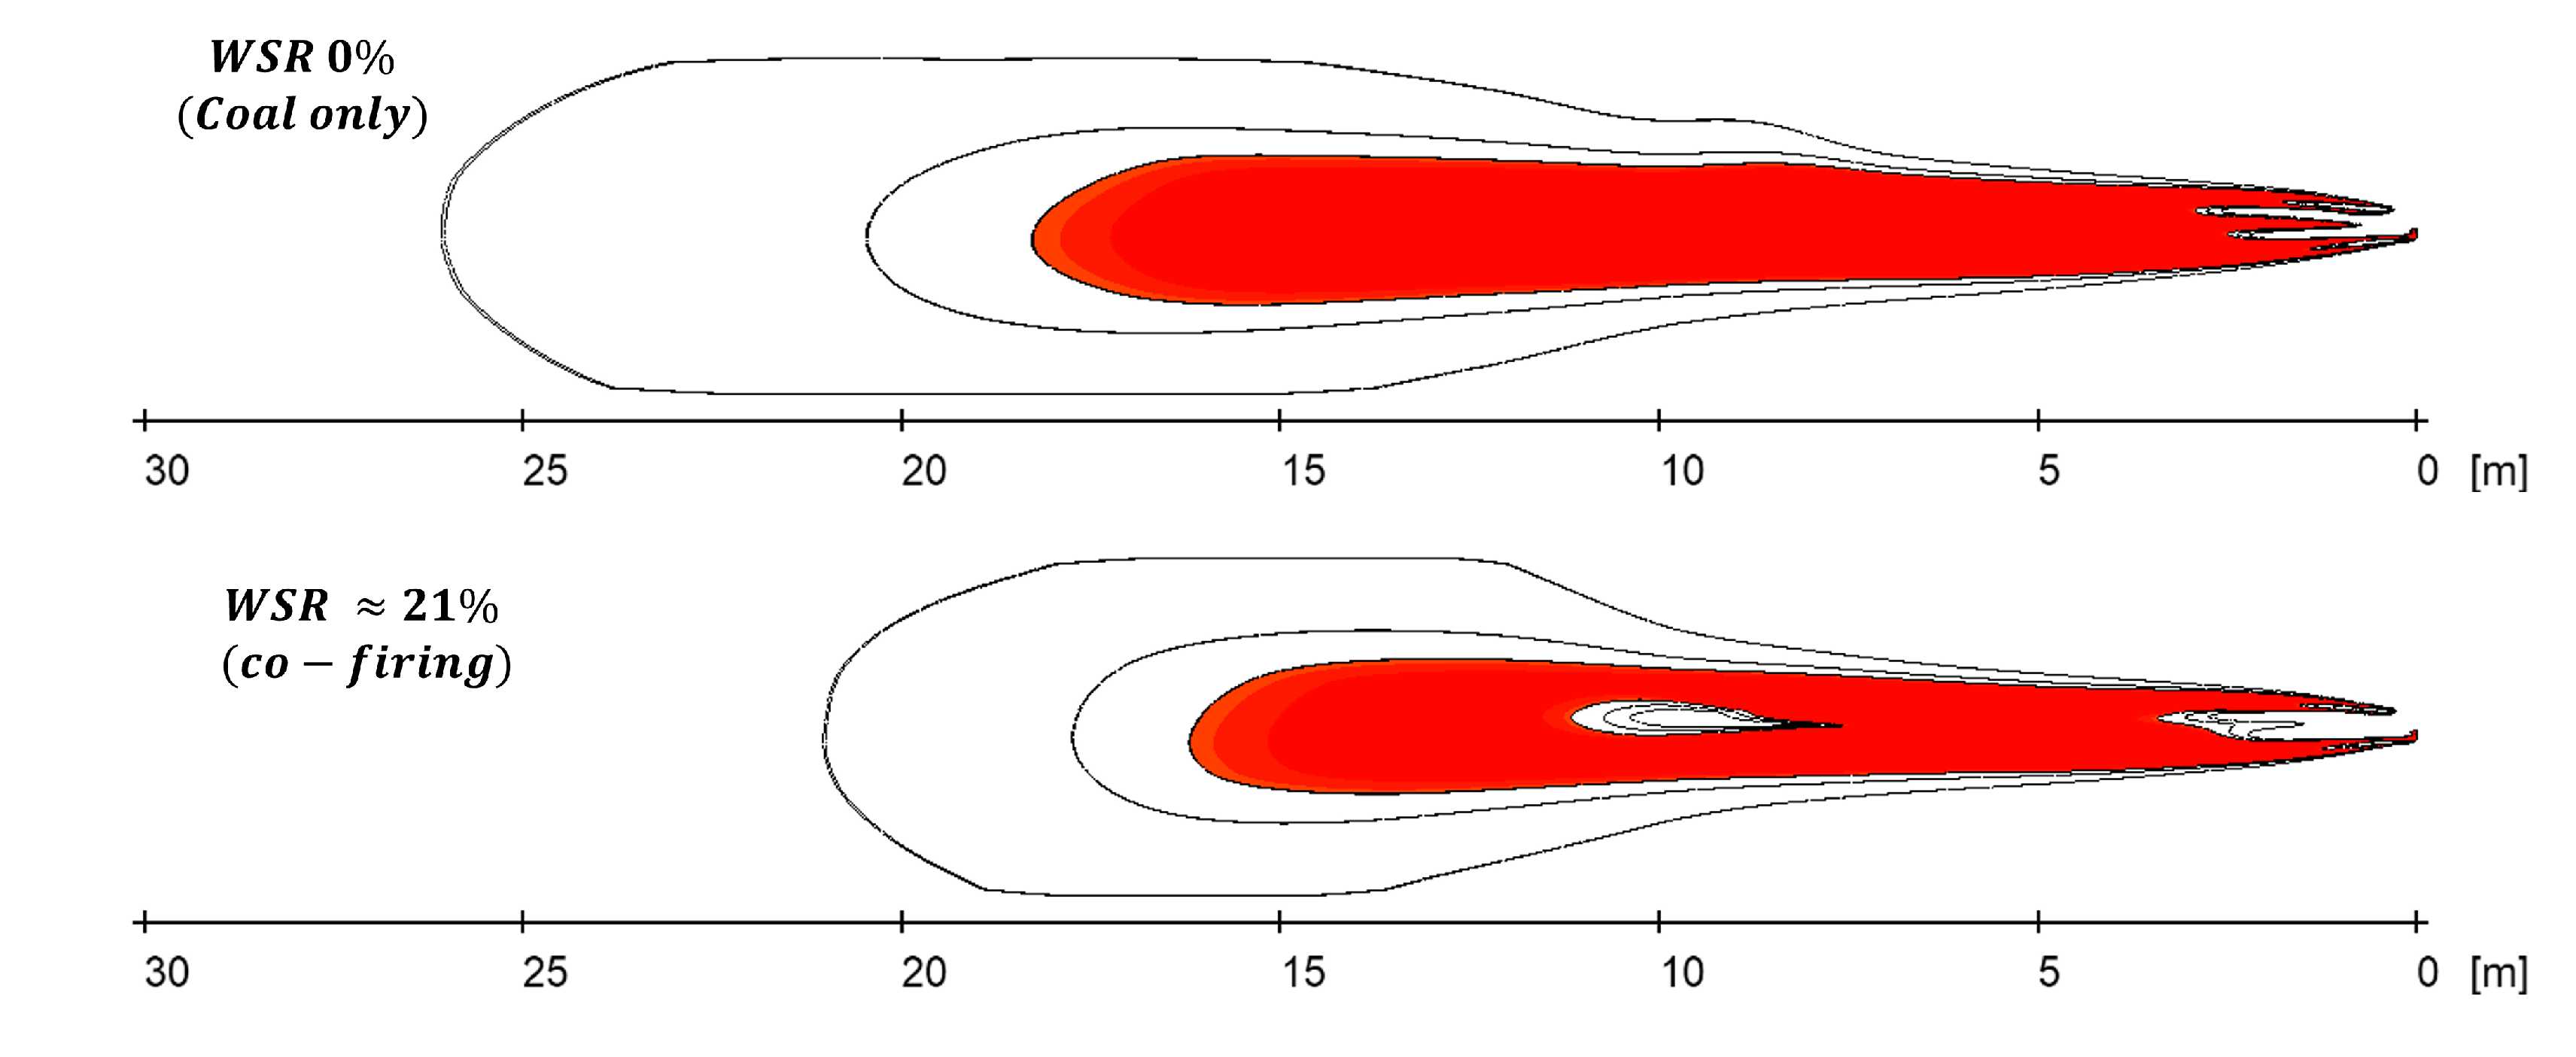
Figure 8.
Axial temperature distribution for five discrete WSR particle diameters (5, 10, 15, 20, 25 mm) at ≈21% thermal substitution: (a) mass-flow-weighted mean temperature, ; (b) arithmetic mean temperature, . The shaded segment (5–20 m) corresponds to the sintering zone.
Figure 8.
Axial temperature distribution for five discrete WSR particle diameters (5, 10, 15, 20, 25 mm) at ≈21% thermal substitution: (a) mass-flow-weighted mean temperature, ; (b) arithmetic mean temperature, . The shaded segment (5–20 m) corresponds to the sintering zone.
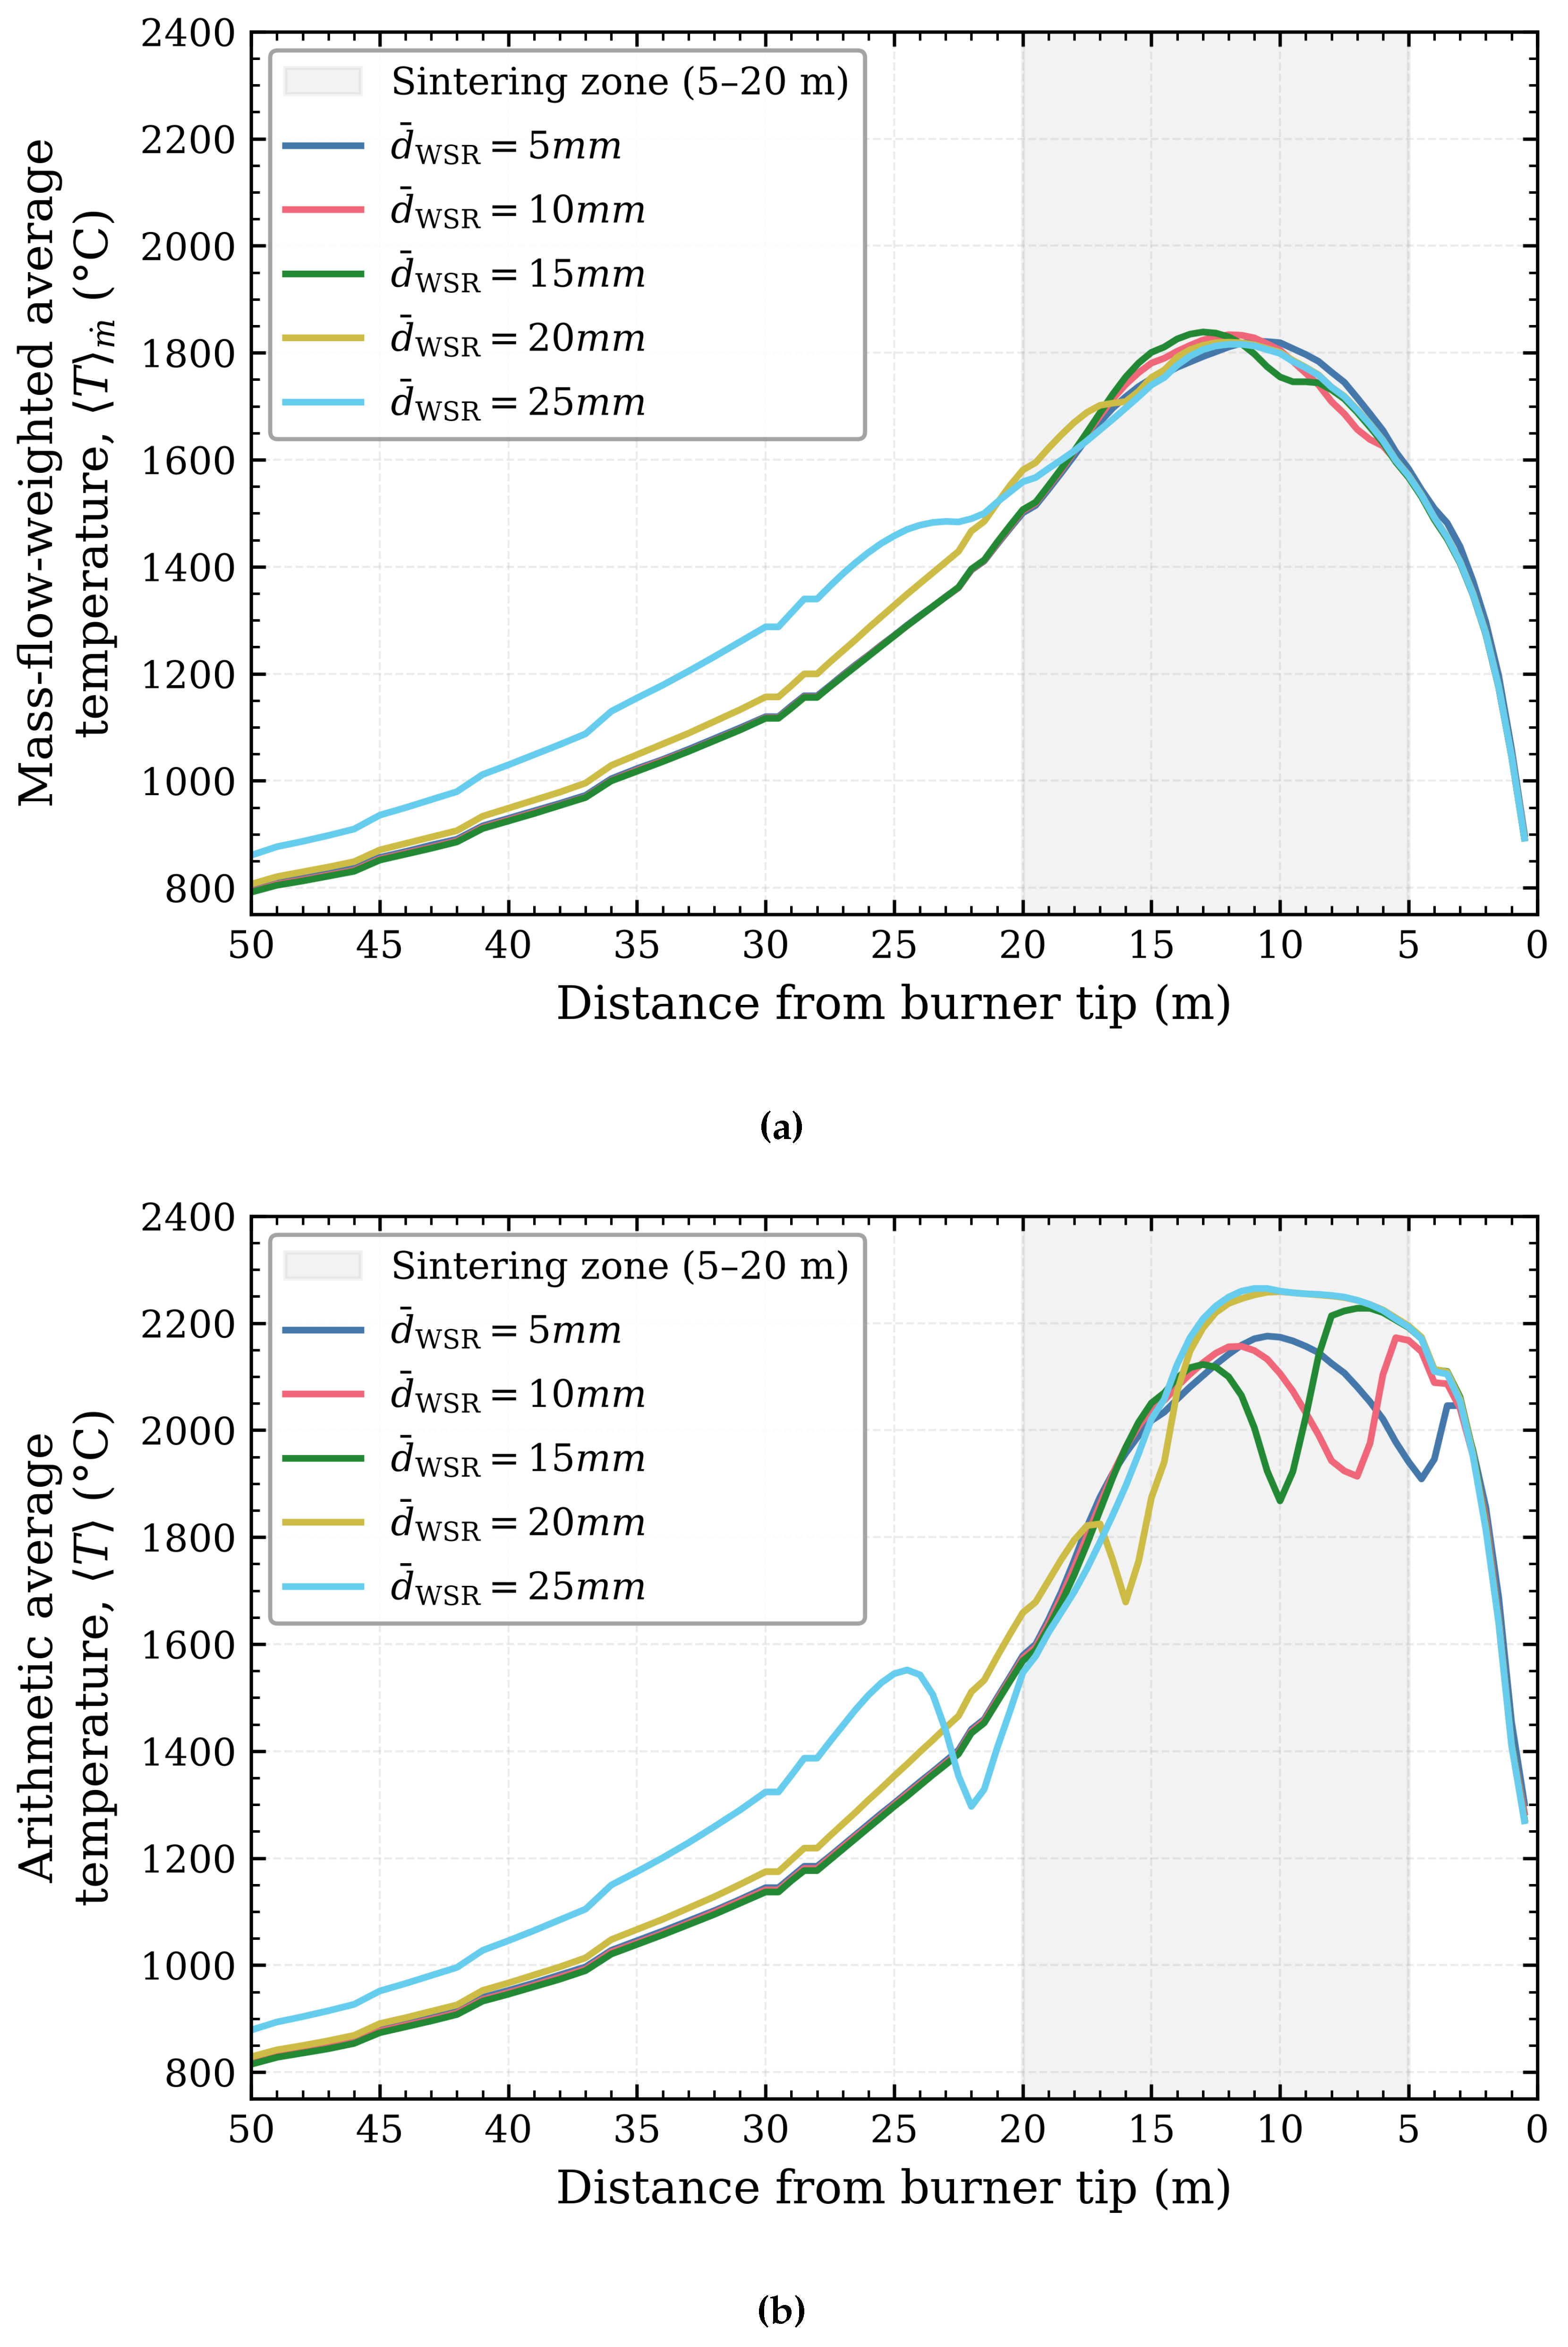
Figure 9.
Axial extent of the DPM devolatilization (active pyrolysis) region along the kiln for three discrete WSR particle diameters: mm (top), 15 mm (middle), and 25 mm (bottom), all at ≈21% thermal substitution. The contours indicate only the spatial extent of the active region; color is qualitative and no colorbar is provided. Distance is measured in meters from the burner tip.
Figure 9.
Axial extent of the DPM devolatilization (active pyrolysis) region along the kiln for three discrete WSR particle diameters: mm (top), 15 mm (middle), and 25 mm (bottom), all at ≈21% thermal substitution. The contours indicate only the spatial extent of the active region; color is qualitative and no colorbar is provided. Distance is measured in meters from the burner tip.
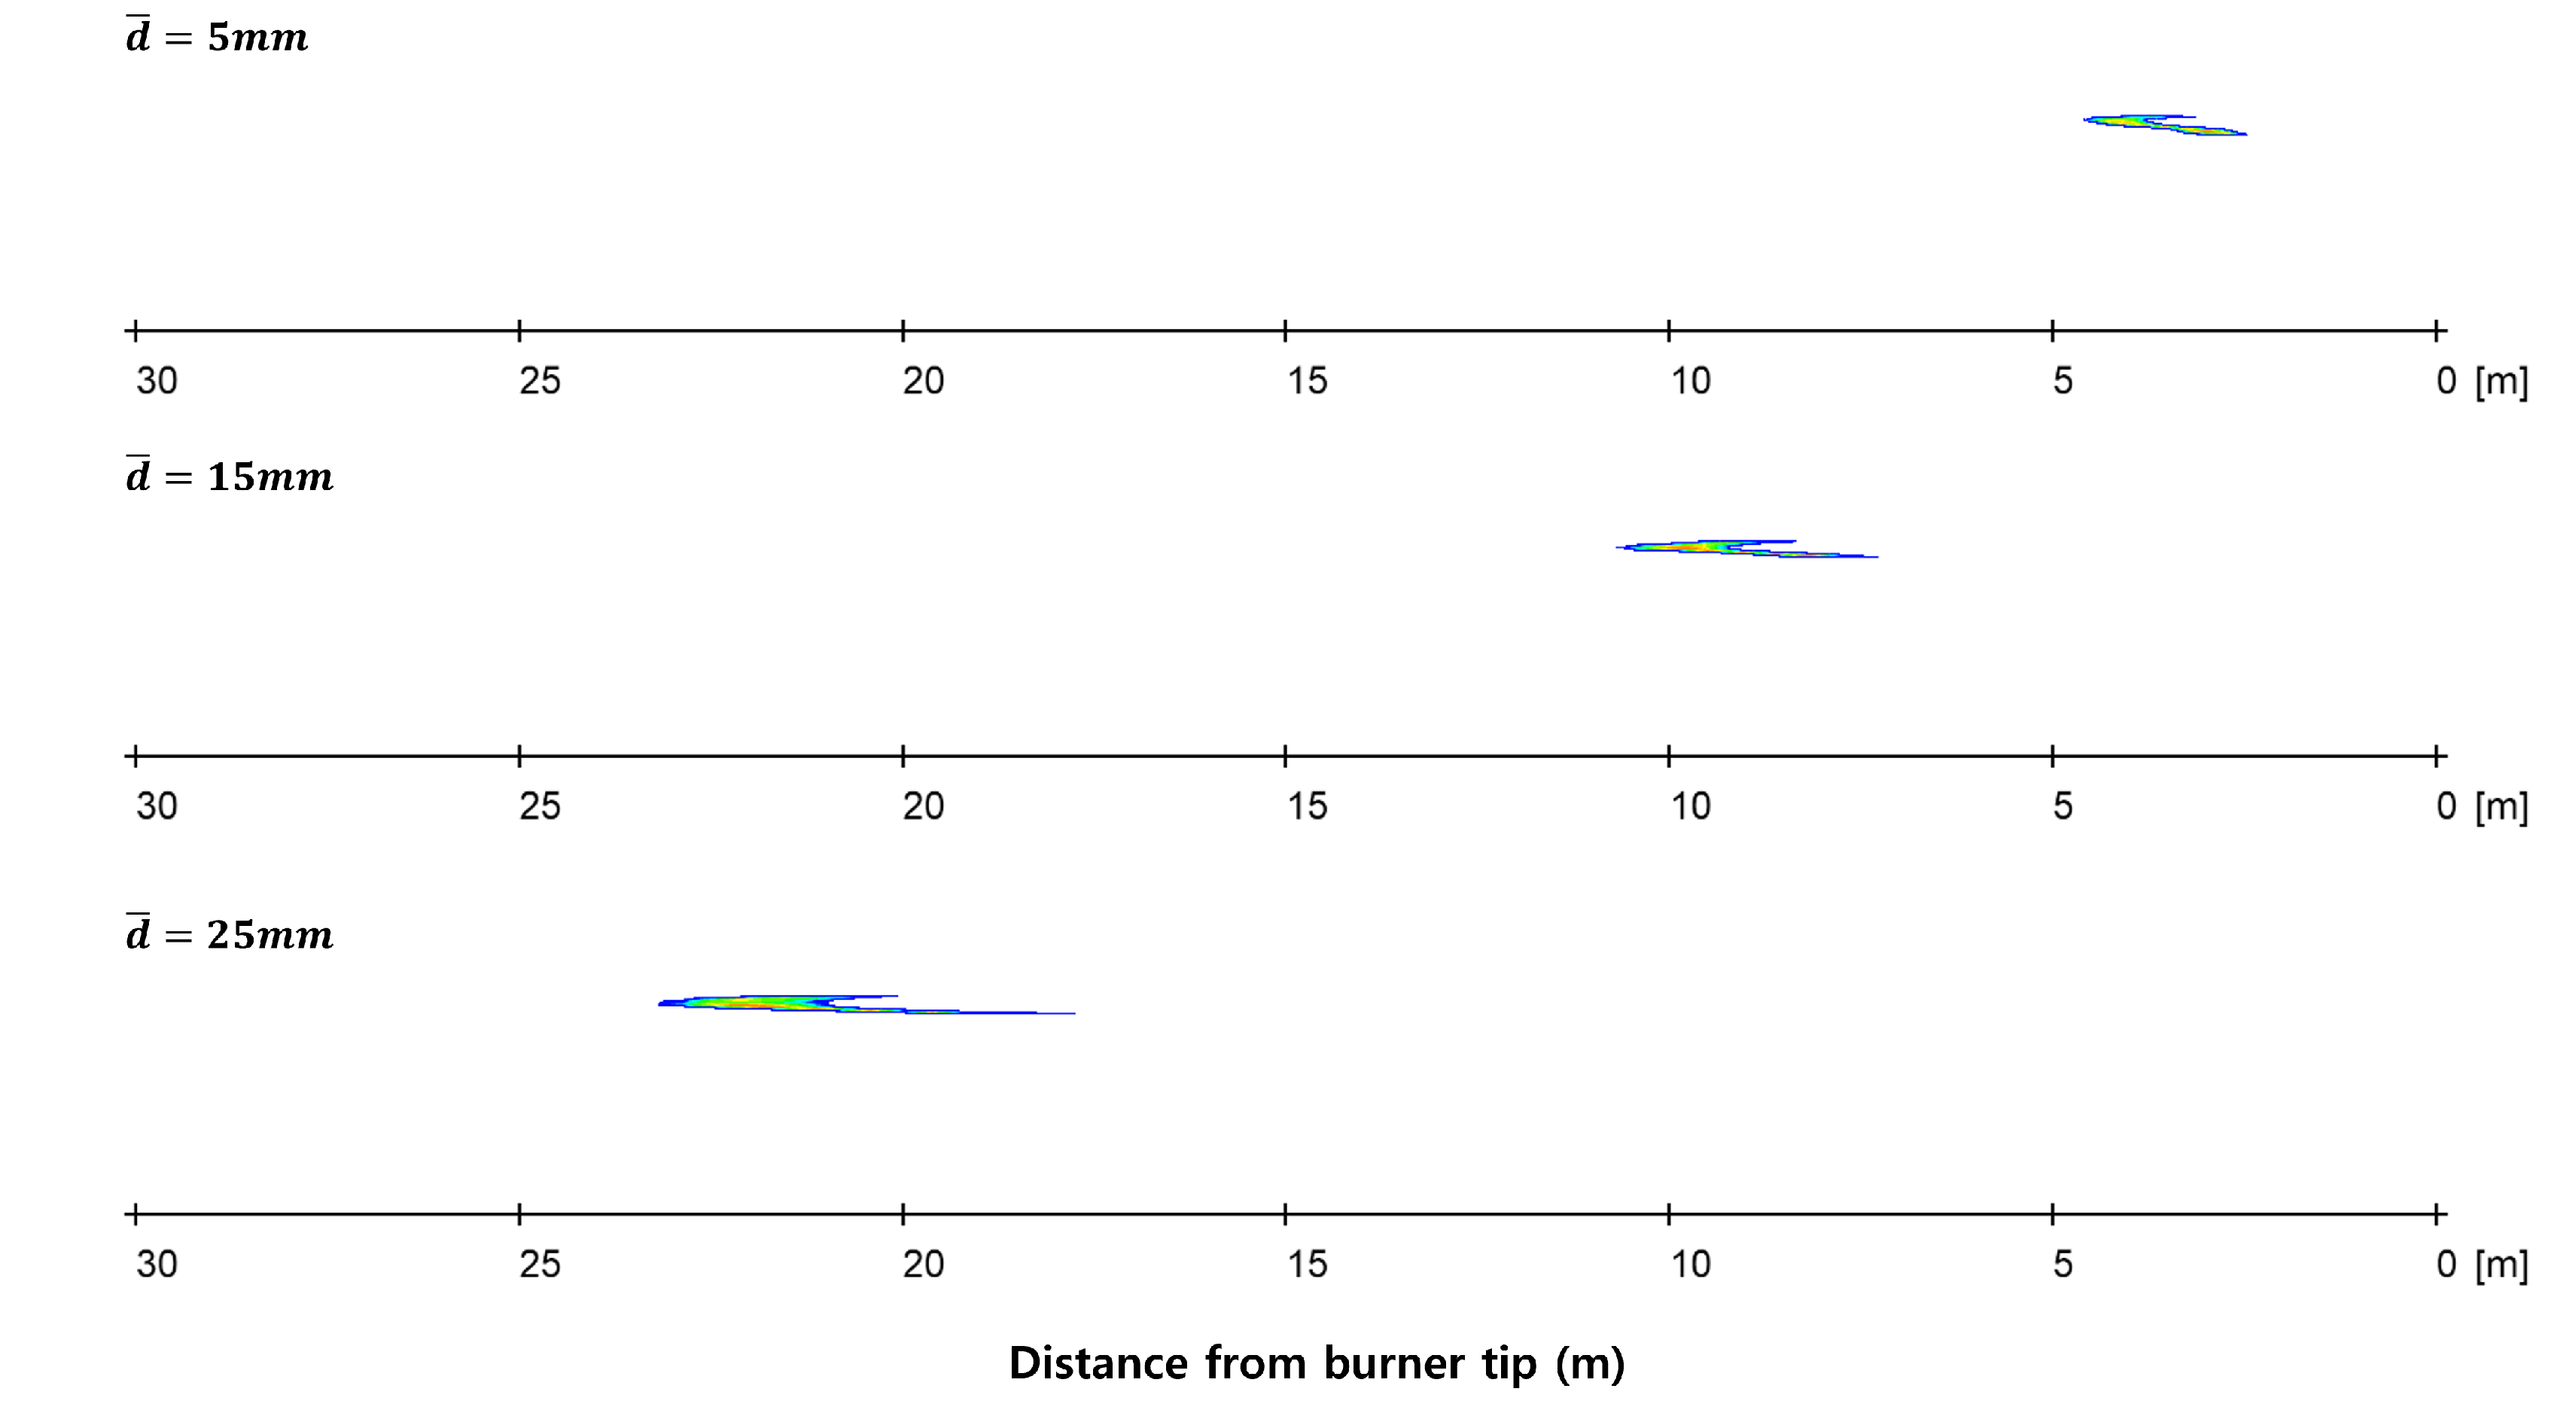
Figure 10.
Schematic of the three devolatilization-confinement categories (front-shifted, complete, incomplete) as a function of WSR particle size, illustrated with four representative cases. For each representative case, the active devolatilization region (from the ignition location to the devolatilization-completion location ) is shown relative to the sintering zone (5–20 m, shaded). Front-shifted (d = 5 mm): the active devolatilization region terminates before the sintering-zone front boundary; complete (d = 10–20 mm): the devolatilization-completion location remains within the sintering zone, with the 20 mm case close to the rear boundary (limited margin); incomplete (d = 25 mm): exceeds the rear boundary (20 m). Plotted values are the and from Table 8.
Figure 10.
Schematic of the three devolatilization-confinement categories (front-shifted, complete, incomplete) as a function of WSR particle size, illustrated with four representative cases. For each representative case, the active devolatilization region (from the ignition location to the devolatilization-completion location ) is shown relative to the sintering zone (5–20 m, shaded). Front-shifted (d = 5 mm): the active devolatilization region terminates before the sintering-zone front boundary; complete (d = 10–20 mm): the devolatilization-completion location remains within the sintering zone, with the 20 mm case close to the rear boundary (limited margin); incomplete (d = 25 mm): exceeds the rear boundary (20 m). Plotted values are the and from Table 8.
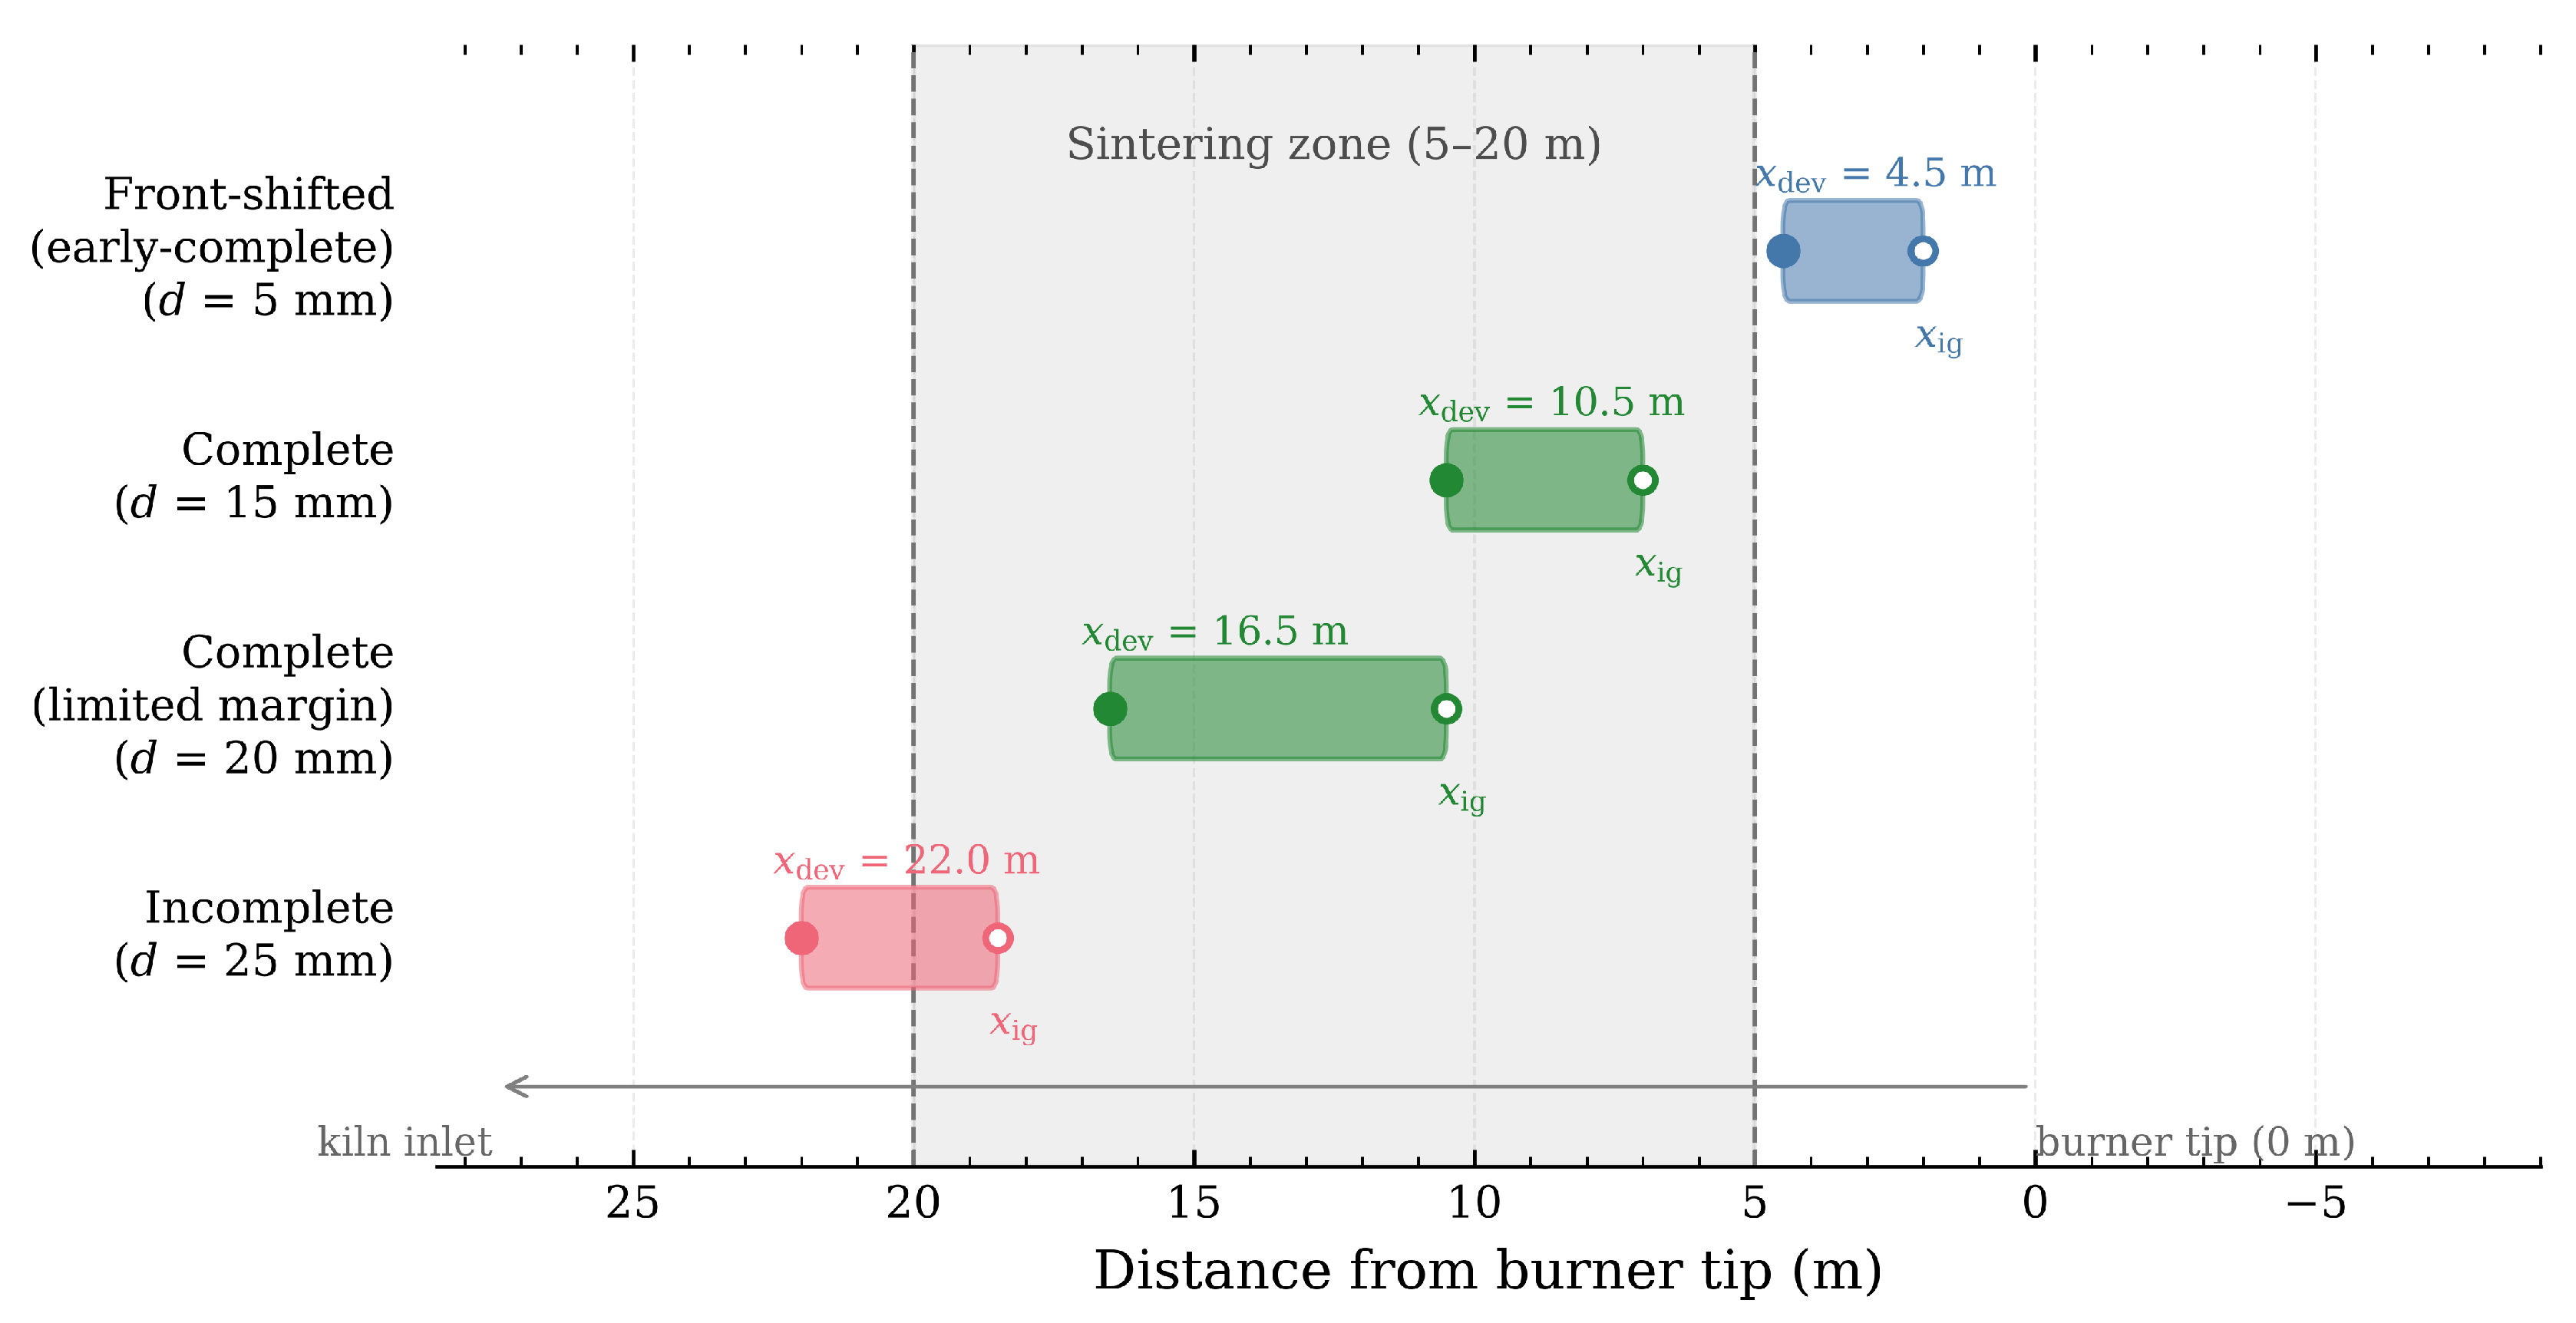
Figure 13.
Axial temperature distribution under the SD baseline ( mm) and four PSD cases (PSD1: mm, PSD2: mm, PSD3: mm, PSD4: mm) at ≈21% thermal substitution: (a) mass-flow-weighted mean temperature, ; (b) arithmetic mean temperature, . The shaded segment (5–20 m) corresponds to the sintering zone.
Figure 13.
Axial temperature distribution under the SD baseline ( mm) and four PSD cases (PSD1: mm, PSD2: mm, PSD3: mm, PSD4: mm) at ≈21% thermal substitution: (a) mass-flow-weighted mean temperature, ; (b) arithmetic mean temperature, . The shaded segment (5–20 m) corresponds to the sintering zone.
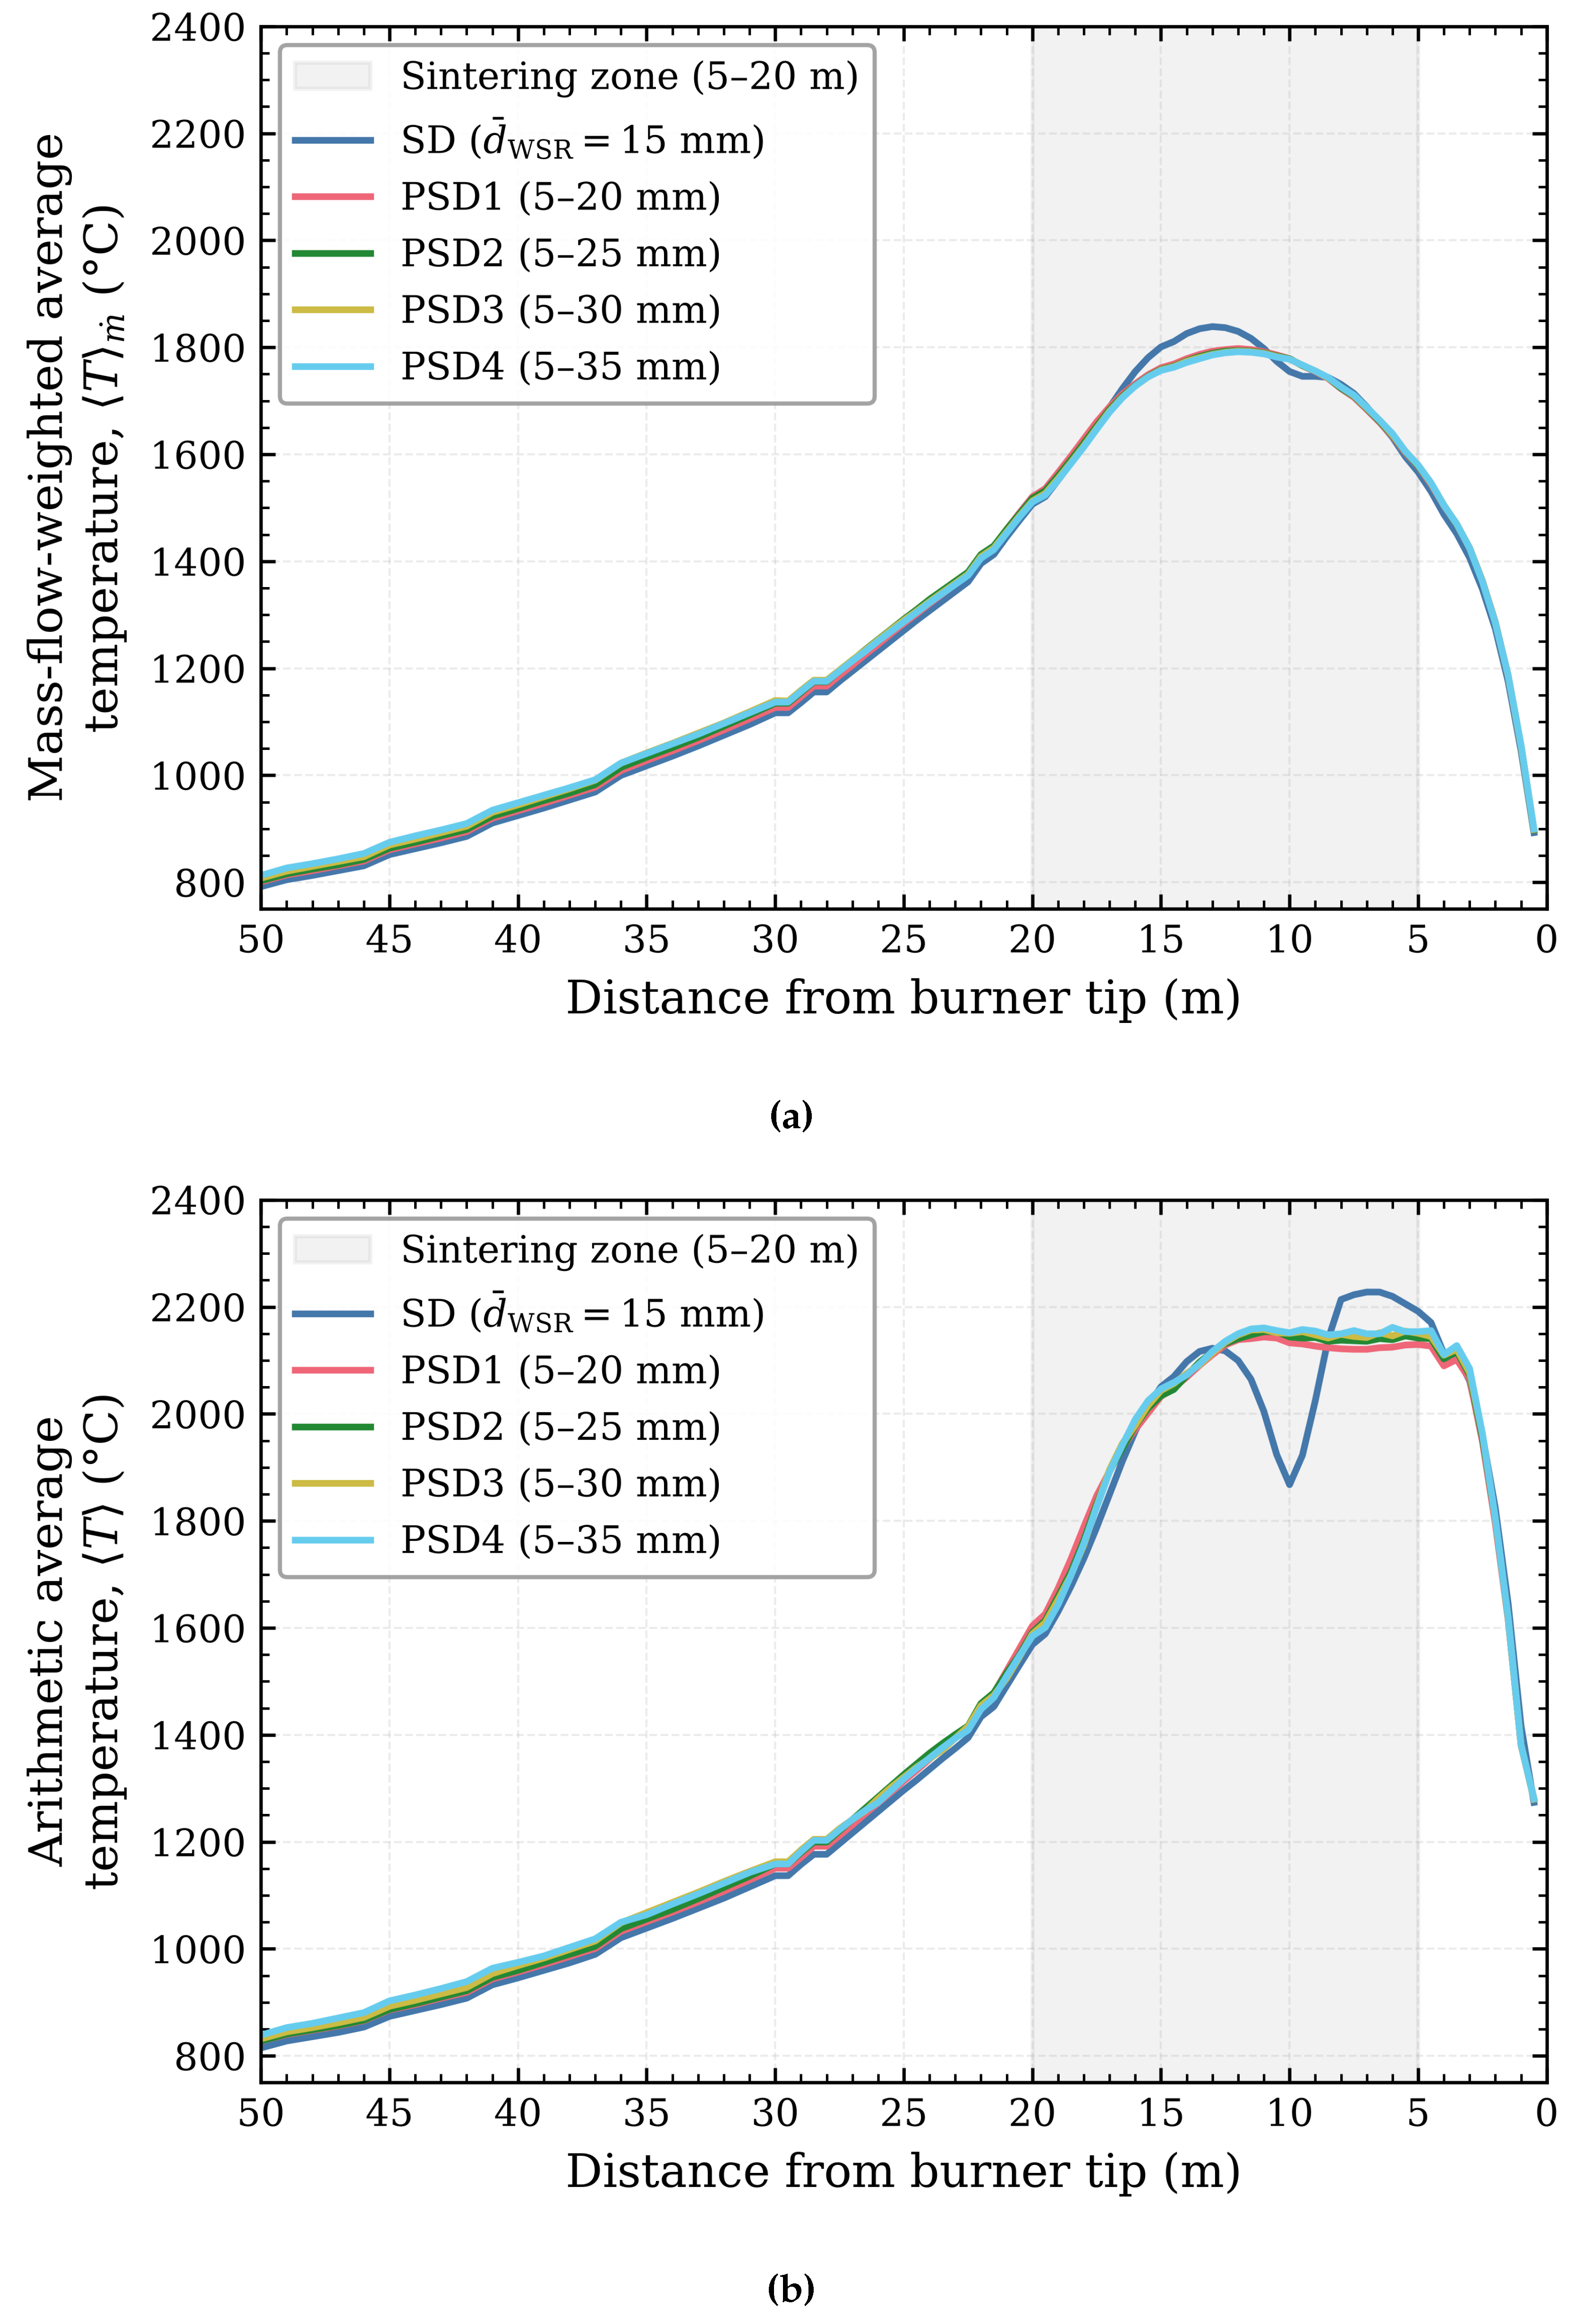
Disclaimer/Publisher’s Note: The statements, opinions and data contained in all publications are solely those of the individual author(s) and contributor(s) and not of MDPI and/or the editor(s). MDPI and/or the editor(s) disclaim responsibility for any injury to people or property resulting from any ideas, methods, instructions or products referred to in the content. |
© 2026 by the authors. Licensee MDPI, Basel, Switzerland. This article is an open access article distributed under the terms and conditions of the Creative Commons Attribution (CC BY) license (http://creativecommons.org/licenses/by/4.0/).
Copyright: This open access article is published under a Creative Commons CC BY 4.0 license, which permit the free download, distribution, and reuse, provided that the author and preprint are cited in any reuse.