Preprint
Article

This version is not peer-reviewed.

Root and Shoot Trait Adaptations During Vegetative Development of Festuca gracillima Ecotypes from Two Xeric Patagonian Vegetation Types Under Controlled Condition

Submitted:

28 August 2026

Posted:

31 August 2026

You are already at the latest version

Abstract

Perennial plant ecotypes exhibit adaptive functional traits associated with abiotic stress tolerance linked to their origin. This study hypothesized that F. gracillima displays ecotypic variation which employ different shoot-root compensation mechanisms to sustain plant growth and development. A common-environment experiment was used to examine the adaptive traits of F. gracillima accessions. Destructive sampling was performed at six development stages, while non-destructive measurements were taken biweekly (roots) and every 2 days (shoots) from six pots per accession The development stages were: (i) seedling, (ii) one fully expanded leaf, (iii) two fully expanded leaves, (iv) three fully expanded leaves, (v) early senescence, and (vi) one fully senesced leaf. A factorial design with 6 developmental stages×2 accessions × 6 replicates were used. The steppe accession had greater fine root length percentage, smaller root diameter, longer single roots, fewer roots, slower rhizochron (i.e., slower root appearance rate) and faster leaf phyllochron (i.e., faster leaf appearance rate). Phenotypic differences between accessions support the existence of ecotypic variation. The steppe accession combined acquisitive and conservative traits, indicating multidimensional trait variation rather than a single acquisitive–conservative strategy. Additionally, asynchronous leaf and root tissue appearance rates suggest partial decoupling between above and belowground development.

Keywords: 
;  ;  ;  ;  

1. Introduction

The coordination of shoots and root growth, together with plant functional traits, is fundamental for understanding plant adaptation to abiotic stress [1] and for developing sustainable grazing management that promotes vegetation persistence in arid and semiarid ecosystems [2]. Ecotypic differentiation represents an important mechanism by which plant populations adjust to contrasting environmental conditions through variation in morphology, physiology, and growth dynamics [3,4]. Such variation influences resource acquisition, tissue turnover [5], and plant persistence [6], ultimately determining species performance under environmental stress [7].
The rangelands of southern Chilean Patagonia, located in the Magellan Region (43°36′ S and 56°30′ S), are characterized by a cold steppe climate [BSk’c; (8)] and are dominated by the native tussock grass Festuca gracillima[9,10,11]. Rangelands occur along a climatic gradient comprising the steppe zone (200–300 mm annual precipitation) and the transition zone (300–400 mm annual precipitation), which differ in vegetation structure and shrub abundance [9,10,12]. Although F. gracillima is highly tolerant to water deficit [13], it exhibits low tolerance to severe defoliation, making it vulnerable to degradation associated with poor grazing management [2,14]. Consequently, understanding its adaptive strategies across these contrasting environments is relevant for grazing management and vegetation conservation in Patagonia.
Evidence from forage grasses indicates that ecotypes can exhibit substantial variation in functional traits across environmental gradients [4]. Similar variation is expected in F. gracillima, potentially affecting both shoot and root traits [4,15], and reflecting alternative strategies of resource acquisition and conservation.
Roots play a central role in soil resource acquisition and plant water relations [16,17]. Fine roots are primarily responsible for uptake [18,19], whereas coarse roots contribute to storage, transport, and soil exploration [19,20]. Root dynamics include root lifespan and turnover; root lifespan describes root longevity, whereas turnover depends on the balance between root appearance and mortality [16]. Root appearance rate can be quantified by the rhizochron, the thermal time required for successive root emergence, and analogous to phyllochron in leaves; rhizochron reflects belowground growth rates and carbon investment [21,22,23]. According to the cost-benefits hypothesis, plants under water limited environments reduce tissue turnover and increase lifespan, that can results in slower phyllochron and rhizochron values, diminishing construction costs [13,16,24].
Therefore, resource-poor ecosystems are expected to promote contrasting shoot–root strategies expressed through variation in developmental dynamics [5,25]. In this context, phyllochron [13,26] and rhizochron [22,23] represent key descriptors of above and belowground growth strategies, respectively. Slower phyllochron and rhizochron are expected under resource limitation, potentially coordinated across shoot and root systems. Despite its relevance, root traits remain poorly understood compared with aboveground traits [22].
Festuca gracillima is a resource-conservative species characterized by long leaf lifespan and slow phyllochron compared with fast-growing grasses [5,13] and high tolerance to water limitation but sensitivity to defoliation [2,13,14]. However, it remains unclear whether populations from contrasting Patagonian environments differ in shoot-root developmental coordination. The hypothesis proposed is F. gracillima displays ecotypic variation, with accessions exhibiting distinct shoot–root compensation strategies under contrasting environmental conditions. Specifically, the steppe accession is expected to exhibit a more conservative strategy, characterized by slower leaf and root tissue appearance rates and traits associated with conservation of resources. Conversely, the transition zone accession is expected to exhibit a more acquisitive strategy, characterized by faster tissue appearance rates and traits associated with higher resource acquisition under comparatively less stressful conditions. To test this hypothesis, we evaluated shoot and root growth, morphology, and developmental dynamics in two F. gracillima accessions from the Patagonian steppe and transition zones.

2. Materials and Methods

2.1. Seed Collection and Study Description

This study was conducted in growth chamber at the Agricultural Research Institute (INIA, Kampenaike), within the Soil and Forage Laboratory (53° 8′5.36″ S and 70°53′7.78″ W), located in Punta Arenas, Magellan Region, Chile. Seeds from F. gracillima accessions were collected between 15 December 2021 and 15 January 2022. The first collection site was located in the administrative district of San Gregorio, corresponding to the steppe zone (52°22′43″ S, 70°33′33″ O), the driest area in the Magellan Region, where F. gracillima is dominant (Pisano 1974; Rodríguez 1986; Lara and Cruz 1987). The second site was centered at the INIA Kampenaike experimental station, representative of the transition zone (52° 41′ 43″ S, 71° 01′ 19″ O) where Chiliotrichum diffusum (G. Frost) Kuntze. and F. gracillima co-dominate [10,12,27].
Seed collection for the steppe accession was undertaken near the Argentinian border and far from the coast. As such, the most representative climatic data for that site is provided from the Mount Aymond weather station (52° 09′ 51″ S, 69° 36′ 28″ O), which characterizes the steppe zone. for the transition accession was undertaken in INIA’s Kampenaike Research Station, which is closer to the Strait of Magellan and has a closer weather station (52° 36′ 25″ S, 70° 56′ 24″ O).
Figure 1 presents the mean monthly temperature, annual rainfall (between 2014 and 2024), average wind speed and wind gusts (between 2017 and 2024) for the steppe and transition zones. Averaged over the last 10 years, rainfall in the transition zone was 107 mm higher than that of the steppe zone. Over the same 10-year period, the steppe zone experienced slightly warmer conditions (~0.38 °C higher) when compared to the transition zone. While the average wind and wind gusts were higher for the transition zone [28].
Seeds were germinated on moistened filtered paper in separate (by accession) Petri dishes and germinated under controlled conditions. Thirty six uniform seedlings (prior to the appearance of the first real leaf) of each F. gracillima accession were planted in 1 L pots (72 in total), containing a coconut substrate [Cocos Brix; pH H20 between 6.0 and 7.4; EC (1:1.5) 0.09–0.14 mS cm−1; water retention 8.0 mL g−1; particle size between 0.2 and 0.5 mm], and placed in growth chambers, with an average temperature of 15 °C (20 °C day and 10 °C night), with 14h of light and 10h of darkness on the October 19, 2023. The study was terminated on the January 24, 2024. Coconut substrate was selected as it allows for rapid, precise, non-destructive root structure evaluation with minimal damage and/or loss of root material during the extraction and cleaning process.

2.2. Shoot and Root Evaluations

A common-environment experiment was used to determine the adaptive traits of two F. gracillima accessions and to assess changes in plant growth alongside morphological and physiological traits, destructive and non-destructive root and shoot measurements were conducted. For non-destructive evacuations a total of 12 pots (n=6 per accession) were analyzed. For dry matter (DM) assessments and growth evaluations, destructive sampling was performed on the remaining 60 pots. To track plant development, between one tiller (at early vegetative growth) and up to three tillers per plant (at late vegetative growth) were evaluated non-destructively [29]. Once plants reached the target developmental stage, 12 pots (n=6 per accession) from the remaining pots (60 in total) were harvested for each destructive evaluation. These evaluations were conducted across six developmental stages defined as follows: (i) seedling; (ii) one fully expanded leaf; (iii) two fully expanded leaves; (iv) three fully expanded leaves; (v) early senescence (defined by the start of leaf senescence); and (vi) late senescence (defined by the presence of one fully senescent leaf). The final harvest at the late senescence stage included 12 plants previously evaluated non-destructively.
Non-destructive shoot measurements were performed every 2–3 days on a total of 12 plants (n=6 per accession) to evaluate leaf elongation, leaf number, and phyllochron (i.e., leaf appearance rate; Equation 1; [21]). For the destructive evaluations, for each harvest the plant herbage mass, leaf mass, tiller leaf area, plant leaf area, and specific leaf area (SLA; Equation 2) was determined. Leaves were scanned using the Epson V850 (Perfection Pro, Seiko Epson Corp., Suwa, Japan) and leaf area determined (Easy Leaf Area software; Easlon and Bloom 2014). The DM for leaf and plant was obtained by drying the material at 70 °C for 72 h. The SLA was calculated from the relation between the leaf area and the leaf mass ([30]; Equation 2).
P h y l l o c h r o n = A G D D ( n ) A G D D ( n 1 )
The phyllochron was calculated using accumulated growing degree days (AGDD). The AGDD (n) is when leaf “n” appears. The AGDD (n−1) is when leaf “n−1” appears.
S L A = L e a f a r e a ( c m 2 p l a n t 1 ) L e a f D M ( g p l a n t 1 )
Where SLA is the specific leaf area (cm2 g−1). Leaf area is the total surface area of leaves per plant (cm2 plant−1). Leaf dry matter (g plant−1) refers to the oven-dried weight (g plant−1) of the measured leaves included in the numerator.
To determine root growth and development, destructive and non-destructive root measurement was performed once every 2 weeks from the same 12 plants utilized for the non-destructive shoot measurements (n= 6 for each accession). The destructive and non-destructive root evaluations included total root length, fine root length, coarse root length, rhizochron (root appearance rate), root surface area, root volume, total number of root tips, root diameter, and number of branch points. Roots were scanned using the Epson V850 (Perfection Pro, Seiko Epson Corp., Suwa, Japan) and analyzed with RhizoVision explorer (version 2.0.3; Noble Research Institute, Ardmore, Oklahoma USA) [31,32] with 1200 dpi of resolution. With the overall root length and the overall root weight, the specific root length was determined according to Equation (3). At the end of the experiment, roots DM was determined in a dry oven at 70 °C for 72h.
S R L = T o t a l r o o t l e n g t h ( m m p l a n t 1 ) R o o t D M ( g p l a n t 1 )
Where SRL is specific root length (mm g−1 plant−1). Total root length is the root length (considering coarse and fine roots in meter) determined by the Rhizovision explorer software at a 1200 dpi of resolution. Root DM (g plant−1) refers to the dry weight (g) of the root sample used for determining total root length included in the numerator.
The rhizochron was estimated based on the following assumptions: (i) each root tip identified by the software represented the terminal end of one full root in the scanned image at a resolution of 1200 dpi, (ii) all roots in the scanned images were arranged to avoid overlaps between them, (iii) the analyzed roots were intact, with no broken segments and (iv) observations yielding negative rhizochron values were excluded because such values are biologically implausible. A known limitation of this method is that the software only recognizes root tips when roots are sufficiently visible; thus, extremely thin/fine roots may not be detected. Rhizochron estimation was defined in Equation (4).
R h i z o c h r o n = A G D D ( n ) A G D D ( n 1 ) N r o o t t i p s ( n ) N r o o t t i p s ( n 1 )
Where rhizochron means the root appearance rate during the experimental period in AGDD. The AGDD (n) is the accumulating growing degree days during the “n” evaluation. The AGDD (n−1) is the accumulating growing degree days during the “n−1” evaluation. N° root tips (n) is the number of root tips during the “n” evaluation. N° root tips (n−1) is the number of root tips during the “n−1” evaluation.

2.3. Statistical Analysis and Experimental Design

This study was conducted using a factorial design with two factors: the first factor was the developmental stage with six levels of development, and the second factor was the population of F. gracillima, consisting of two accessions. Each treatment combination had six replicates for destructive and non-destructive evaluations (Equation 5). The normality of the residual values was evaluated using the Shapiro–Wilk test (p<0.05) and homogeneity of variance was tested using the Levene test (p<0.05). When the data was not normally distributed, a natural logarithm transformation was used. When data was normally distributed, a factorial analysis of variance (ANOVA) was performed. Fisher’s least significance difference test (LSD) (p≤0.05) was used to separate the media. When data transformation was not able to confer normality, nonparametric statistics were applied (box diagrams, mean, median, percentiles, and standard deviation) and Kruskal-Wallis test for compare the median values. Multiple linear regression, confidence interval, coefficient of determination [33], and Pearson correlation were used to determine the effect of the shoot development against the root mass, root morphology, and growth (dependent variables). Standard error of the mean (±SEM) was determined for linear regressions.
Y i j k = μ + α i + β j + α β i j + ε i j k
where Yijk=observed value for the k (replicates) in the “i” stage of development and “j” population origin; μ as the overall mean; αi as the “i” developmental stage effect; βj as the “j” population origin effect; (αβ)ij as the interaction effect between developmental stage and population origin effect; εijk as the random error term.

3. Results

3.1. Leaf and Root Growth and Functional Traits of F. gracillima Accessions

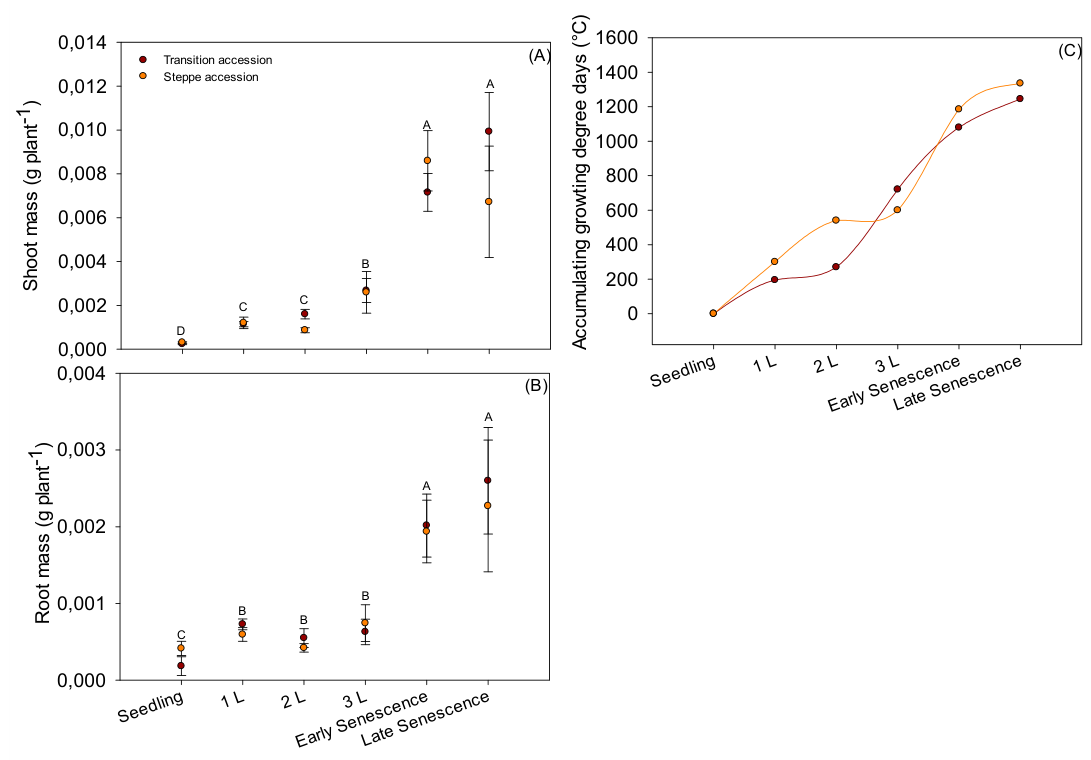
Figure 2 shows shoot and root DM for each stage of development for the two accessions. No statistical differences between the two accessions were found for the shoot mass and root mass at each development stage (p≥0.05), but differences were observed for the development stages (p<0.001). The shoot mass at seedling stage on average was 2.95 × 10⁻⁴ g plant−1 and increased up to 7.26 × 10⁻³ g plant−1 in the late senescence stage. The root mass for seedling stage on average was 2.25 × 10⁻⁴ g plant−1 and for late senescence was 2.43 × 10⁻³ g plant−1.
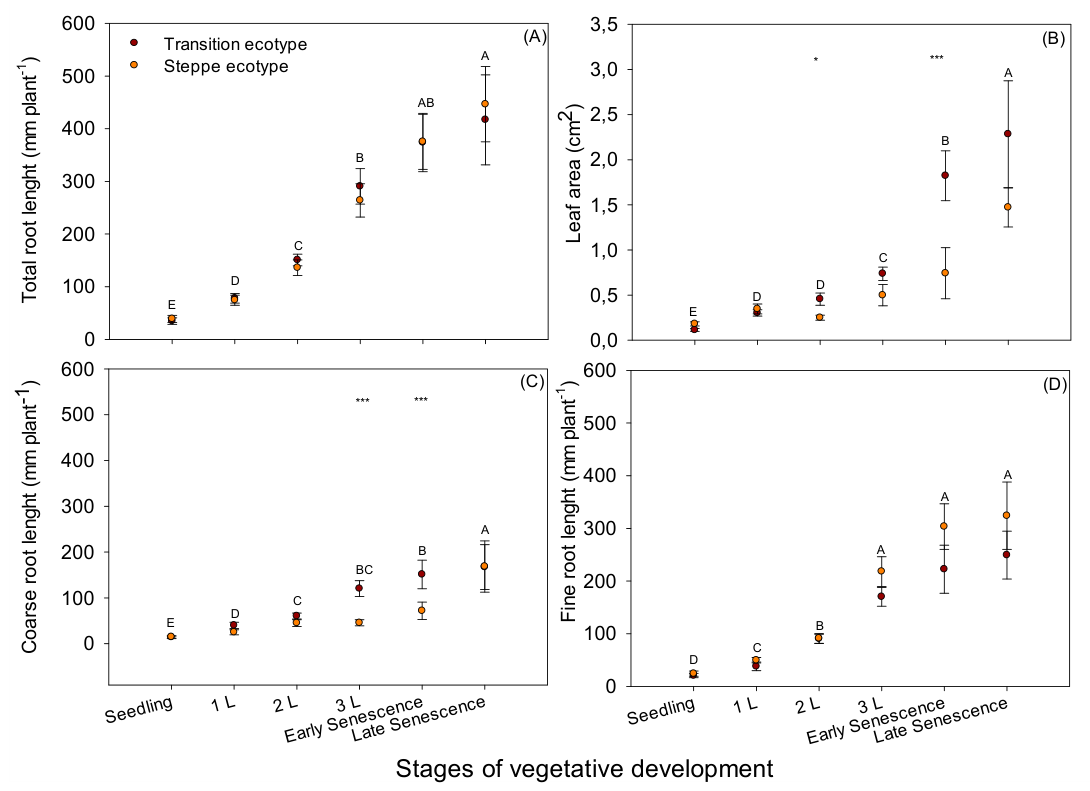
Figure 3 shows the functional traits (total root length, fine root length, coarse root length, and leaf area) for the two accessions. For total root length differences were found for development stage (p<0.001), but no differences were found for accession (p≥0.05) and with no interaction between factors (p ≥ 0.05). For fine root length differences were found for development stage (p < 0.001), but no differences for accession (p≥0.05) and with no interaction between factors (p ≥ 0.05). For coarse root length differences were found for accession (p < 0,001) and development stage (p < 0.001) with no interaction between factors (p ≥ 0.05). Leaf area differed between accessions at the two fully expanded leaves stage (p = 0.0308) and early senescence (p < 0.001), but not at late senescence (p ≥ 0.05; Figure 3B). Coarse root length differed between accessions at the three fully expanded leaves stage and early senescence (p < 0.001), whereas no differences were detected at late senescence (Figure 3C).
For leaf growth and development, no differences were found for the plant development stages (p ≥ 0.05), but statistical differences were observed for F. gracillima accessions with a non-interaction between factors (p≥0.05). Table 1 shows leaf development and growth parameters evaluated for the two accessions of F. gracillima. Significant differences were found for phyllochron (p= 0.042). The phyllochron was 172.0 AGDD leaf−1 for the steppe accession and 201.5 AGDD leaf−1 for the transition accession. The SLA, average leaf length, and leaf elongation rate were statistically similar (p≥0.05).
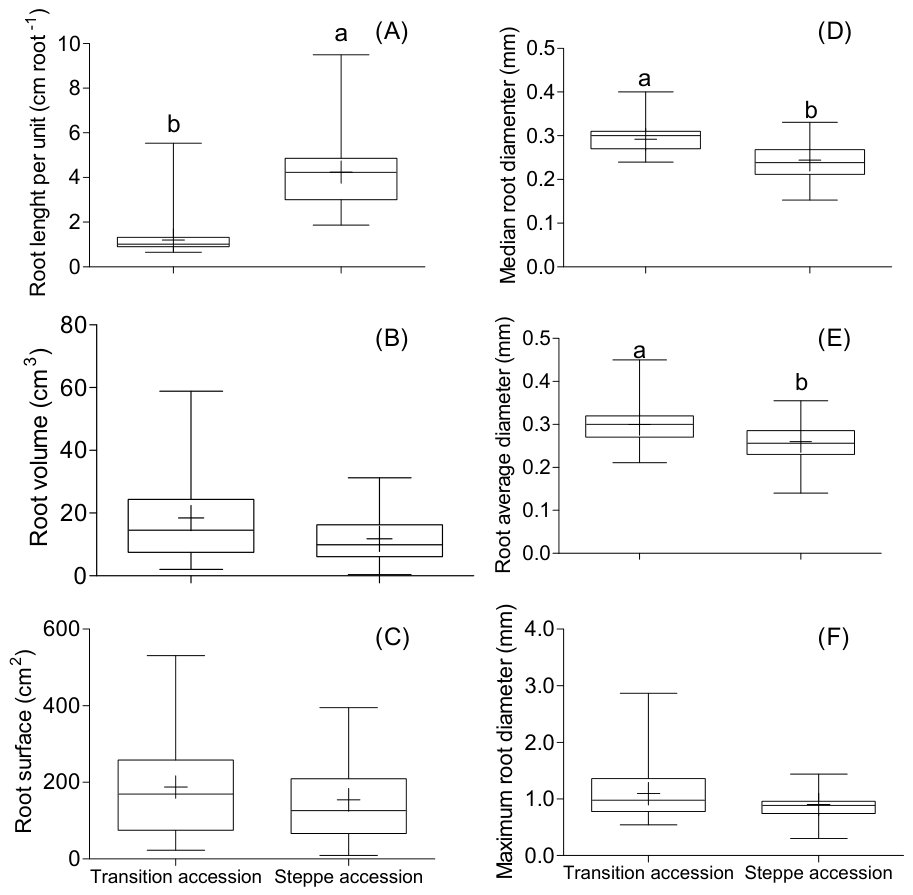
Figure 4 shows a significant difference between the accessions for the root growth per unit of root (p<0.001), median (p< 0.001), and average root diameter (p < 0.001). However, no differences were found for root surface (p≥0.05), root volume (p≥0.05), and maximum root diameter (p≥0.05). For the individual root length, greater values for the steppe accession were found, with an average of 4.3 mm length in comparison to the transition accession that showed an average of 1.21 mm length (Figure 4A). For the root median diameter, higher values were found for the transition accession with a median value of 0.30 mm and the steppe accession had a median of 0.24 mm (Figure 4D). For root average diameter, the higher values were observed for the transition accession with median values of 0.30 mm and the steppe accession had a median of 0.26 mm (Figure 4E).
For the root growth and development, no significant differences were observed across developmental stages (p≥0.05), but statistical differences were found for F. gracillima accessions (p<0.001), with a non-interaction between factors (p≥0.05). Table 2 shows the root development and growth parameters evaluated for the two accessions of F. gracillima. The steppe accession exhibited a higher rhizochron than the transition accession (18.9 vs. 4.9 AGDD root−1; p < 0.001). In addition, fine root proportion for the steppe accession contributed 72.1% of the total root length in comparison to the transition accession, with a fine root proportion accounted for 56.6% of its total root length (p= 0.007). No differences in growth rate were found for coarse and fine root growth rate (p≥0.05).

3.2. Growth Coordination and Leaf Area Carbon Supply

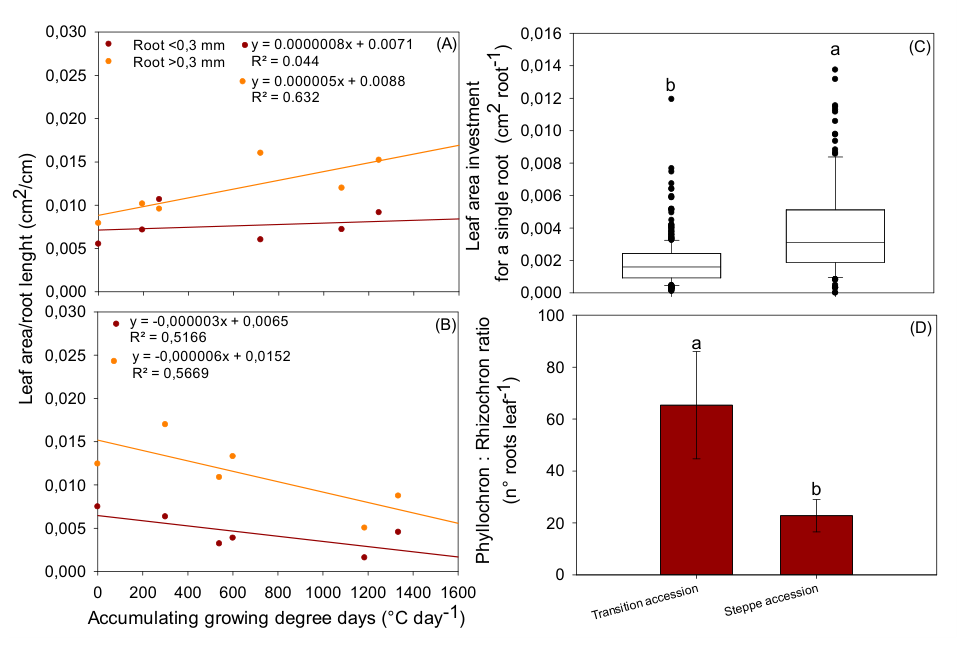
Figure 5 shows the relationship between leaf area per mm of fine and coarse root growth (Figure 5A, B), leaf area per root (Figure 5C), phyllochron: rhizochron ratio (Figure 5D) for the two F. gracillima accessions. Significant differences between accessions were observed for leaf area per root (p<0.001) and phyllochron: rhizochron ratio (p= 0.004). For the transition zone accession, the correlation between the index composed by “leaf area/coarse root length” versus AGDD was statistically significant (p<0.001), with a positive slope and an R2 of 0.63. For the transition zone accession, the correlation between the index composed by “leaf area/fine root length” versus AGDD was not significant (p≥0.05), with an R2 of 0.04 (Figure 5A). For the steppe accession, the correlation between the index composed by “leaf area/coarse root length” versus AGDD was statistically significant (p<0.001), with a negative slope and an R2 of 0.56. For the steppe accession, the correlation between the index composed by “leaf area/fine root length” versus AGDD was statistically significant (p<0.001), with a negative slope and an R2 of 0.51 (Figure 5B).
Figure 5C shows the leaf area related to individual root growth. Significant differences were found between accessions, with the steppe accession exhibiting a higher median value of 0.0036 cm2 root−1 (mean = 0.0045 cm2 root−1), compared to 0.0017 cm2 root−1 (mean = 0.0019 cm2 root−1) for the transition zone accession. Figure 5D presents the phyllochron: rhizochron ratio for both accessions. The transition zone accession showed higher values, with an average of 63.6 ± 18.3 roots leaf−1, compared to 22.1 ± 6.4 roots leaf−1 for the steppe accession.
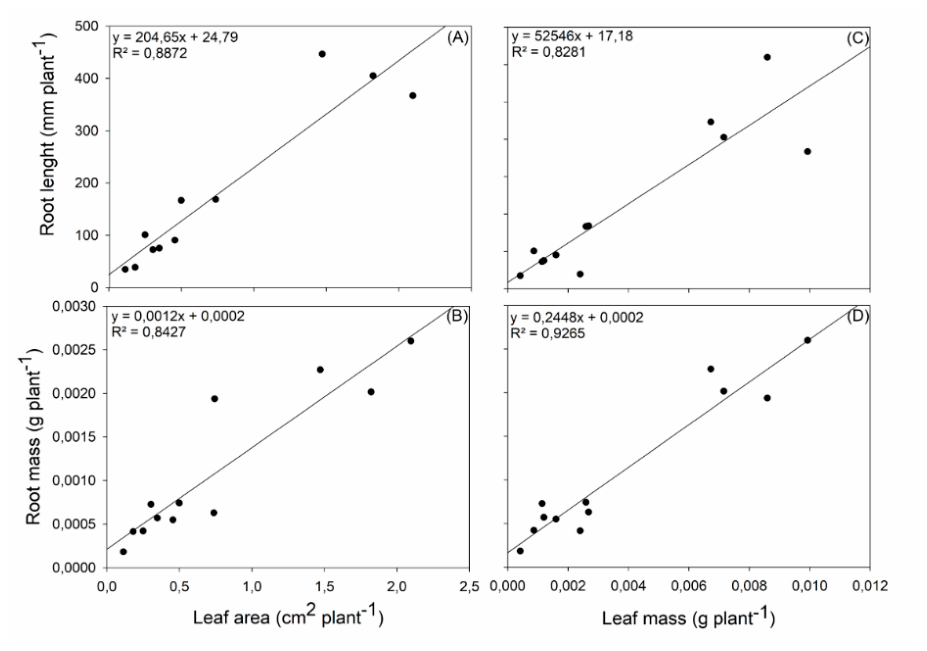
Figure 6 presents the relationships between root length and leaf area (Figure 6A), root mass and leaf area (Figure 6B), root length and leaf mass (Figure 6C), and root mass and leaf mass (Figure 6D). All relationships were significant (p<0.001), with R2 values ranging from 0.83 to 0.92.

4. Discussion

This is the first study to assess phenotypic variation in F. gracillima originating from contrasting environmental conditions within Magellan Region. Significant differences were observed in shoot and root traits, including phyllochron and rhizochron, and fine root proportion. However, no differences were found in growth (in terms of root or shoot elongation or dry matter) between accessions under the experimental conditions. These results suggest that ecotypic differentiation in perennial grasses may be more effectively identified through functional traits than plant growth or biomass production alone when being evaluated in a common-environment experiment.
The steppe accession originated from San Gregorio administrative district, one of the driest area of the Magellan region, is characterized by F. gracillima dominance [10,27]. In contrast, the transition accession was collected from the INIA Kampenaike Experimental Station, where F. gracillima coexist with C. diffusum. Indicates that these two environments differ not only in climatic conditions but also in vegetation structure. Shrub dominated systems have been show to modify local environment conditions through wind protection and shading, and enhance moisture retention [34,35,36] and higher infiltration rates [37].
However, this study was not designed to disentangle the relative influence of climatic conditions and vegetation structure on trait differentiation. Therefore, the observed differences should be interpreted as responses associated with the environmental conditions characterizing the accession origins rather than being attributed to a single environmental driver. Nevertheless, the trait syndromes expressed by the steppe and transition accessions are consistent with adaptive responses commonly reported for plants originating from different environments [5,38,39]. Previous studies have shown that long term exposure to contrasting environmental conditions can promote divergence in root and shoot functional traits associated with resource acquisition and conservation strategies [4,39]. Thus, the differences observed between accessions likely reflect ecotypic differentiation resulting from prolonged exposure to contrasting environmental conditions.
Several aspects of the experimental design need to be considered when interpreting these findings. Coconut coir was selected because it allowed repeated, non-destructive assessment of root development throughout the experimental period. While this approach enabled detailed measurements of root appearance, elongation, and allocation patterns, it does not reproduce the soil properties. Likewise, the growth chamber provided controlled environmental conditions that minimized external sources of variation but did not incorporate important field factors such as wind exposure, diurnal temperature fluctuations, seasonal drought, or plant–soil interactions. Consequently, the responses observed here should be interpreted as the expression of intrinsic differences between accessions under common environmental conditions rather than as direct predictions of field performance.
In addition, this study focused on the early stages of vegetative development, from seedling emergence to the onset of leaf senescence. Previous studies have evaluated morphophysiological traits over similar thermal time periods, ranging from 650 AGDD [40] up to 2000 AGDD [13,29], although these studies focused on mature plants. Perennial species will exhibit changes in trait expression as plants mature, especially when they are exposed to repeated environmental stresses and defoliation events. Therefore, the strategies identified in this study represent early developmental responses that provide insight into potential ecotypic differentiation. However, further research under field conditions and across later developmental stages is needed to determine how these traits contribute to long-term persistence and productivity.

4.1. Leaf and Root Growth and Functional Traits of F. gracillima Accessions

The steppe accession exhibited a slower rhizochron (i.e., high rhizochron values or slower root appearance rate) compared to the transition zone accession, reflecting differences in their growth strategies. Suggesting, from a root-based perspective, one potential adaptation to drier conditions was reduced root number per plant, which may directly contribute to increased root lifespan [18], consistent with a resource-saving strategy aimed at minimizing the construction costs of new root tissue [22,23]. This aligns with the cost–benefit hypothesis, which proposes that plant species in low-water environments tend to favor increased root lifespan reducing turnover rates, as a means of conserving resources [16,24], indicates that extending root lifespan enhances functional duration and improves resource-use efficiency in resources-limited ecosystems [18], by allocating C to fewer longer-lived roots, rather than investing in the continuous production of new ones. During this study, this was reflected in a slower rhizochron accompanied by greater elongation of individual roots.
Both accessions showed similar values for total and growth rate for the fine and coarse roots. However, the steppe accession’s higher proportion of fine roots length likely enhanced resource uptake efficiency per unit of root length [41,42,43]. This advantage may be related to the lower proportion of coarse roots when compared to the transition zone accession. Fine roots, along with smaller root diameter, increase root contact with the soil and nutrient and water absorption [19,44]. Suggesting that this trait should be beneficial in water-limited environments, where surface soil moisture availability is critical and infiltration rates tend to be slower when compared to transition zones dominated by C. diffusum [37].
The greater fine-root proportion of the steppe ecotype indicates a more acquisitive strategy for resource capture, whereas its slower rhizochron reflects a more conservative strategy related to resource-use efficiency. This combination suggests that these traits vary independently rather than along a single acquisitive–conservative axis, supporting the view that root exploration and resource-use efficiency represent distinct functional dimensions [39].
In terms of shoot growth strategy, the steppe ecotype exhibited reduced leaf area (in two development stages), a faster phyllochron (i.e., lower phyllochron or faster leaf appearance rate), when compared to the transition accession. Was reported that Festuca pallescens St.-Yves. Parodi, the steppe ecotype displayed shorter, more rigid leaves in comparison to the longer and more flexible leaves characteristic of Andean-foothills ecotypes. Traits such as shorter leaves are considered adaptive under water-limited conditions, as they help reduce water loss [3,5]. Although leaves were numerically shorter in the steppe accession, the difference was not statistically significant. Further studies including a broader range of accessions would help determine whether this trend is consistently associated with F. gracillima ecotypes.

4.2. Growth Coordination and Resource Partitioning

The C demand of fine and coarse roots was assessed by the relation between the leaf area required to support the growth of 1 mm of root length during the whole experimental period. This calculation assumes that both accessions have similar net photosynthesis per leaf cm2. Overall, the C allocation associated with fine root length was higher than that per unit of coarse root length in both accessions and throughout the experimental period. This aligned with previous findings that fine roots are more C demanding [45] due to their greater total respiration, which can be related to the greater length in comparison to coarse roots.
At the onset of vegetative growth, C allocation to coarse roots in transition zone accession was approximately 57.9% higher than the steppe accession. As growth progressed, the transition zone accession reduced its investment in coarse roots (reflected by an increase in the leaf area required per mm of coarse root length) while the steppe accession increased its C allocation to coarse roots. These patterns suggest that, early in development, the transition zone accession may prioritize deeper soil exploration. In contrast, the transition zone accession did not show changes in C allocation to fine roots during the experimental period. The steppe accession, however, showed a marked increase in C allocation to fine roots, from 0.0065 mm2 leaf area mm fine root−1 at the beginning of the study, to 0.0025 mm2 leaf area mm fine root−1 at the end. Suggesting a shift in strategy.
Differences between accessions were observed in terms of C allocation to the root system, as indicated by the number of roots supported per growing leaf and the leaf area invested in constructing and maintaining a single root [22,23,24]. Each leaf in the steppe accession supported approximately three times fewer roots than in the transition zone accession (22.1 vs. 63.6 roots leaf−1).
These results suggest several physiological root adaptations to the steppe environment: (i) greater investment is required for single root construction and maintenance, even though this investment is distributed across a smaller number of roots; (ii) although SRL did not differ significantly between accessions, the differences in C allocation to root construction are likely due to the greater fine root proportion observed in the steppe accession; and (iii) the higher leaf area investment per root may reflect increased respiratory costs, potentially linked to longer root lifespan and greater fine root proportion. Together, these three aspects reflect an adaptive strategy involving fewer roots but with longer root lifespan in the steppe accession, which is consistent with its slower rhizochron.
The strong relationships observed between above and below-ground traits indicate a high degree of coordination between leaf and root development during early plant growth. Although these relationships were identified under controlled conditions, they provide a basis for future field studies aimed at determining whether similar patterns occur under natural environmental and grazing conditions. Furthermore, the contrasting shoot and root strategies identified between accessions demonstrate that populations of F. gracillima originating from different environments can express distinct developmental responses. This variation highlights the potential importance of accession origin when evaluating plant material for restoration and revegetation across environmental gradients in Patagonia. However, additional studies involving a broader range of populations and field conditions are required to determine whether these trait differences translate into differences in persistence, productivity, or adaptation under natural grazing environments.

5. Conclusions

The observed phenotypic differences between F. gracillima accessions from contrasting environments in the Magellan Region support the existence of ecotypic variation, indicating that population origin contributes to trait variation, although these findings require validation under field conditions. These results also highlight the importance of evaluating shoot and root functional traits related to development when assessing plant adaptation and ecotypic variation, as biomass measurements or even growth traits alone may overlook important differences in developmental strategies.
Compared with the transition accession, the steppe accession exhibited a mixture of acquisitive (faster phyllochron, smaller root diameter and greater fine-root proportion) and conservative traits (slower rhizochron and a smaller number of roots). Within the experimental conditions of this study, this combination showed that traits did not vary along a common acquisitive–conservative axis, revealing a partial decoupling both between above and belowground developmental strategies and among different root traits. These findings are consistent with emerging multidimensional frame-works of root trait variation.
Leaf and root tissue appearance rates were asynchronous, as the steppe accession exhibited a faster phyllochron but a slower rhizochron than the transition accession. Thus, the developmental coordination between shoots and roots can respond independently to environmental adaptation.

Author Contributions

For research articles with several authors, a short paragraph specifying their individual contributions must be provided. Conceptualization, I.O. and I.L.; methodology, I.O., P.O., A.C. and A.D.C; software, I.O., I.L. ; validation, I.O. and I.L; formal analysis, I.O, P.O. and A.C.; investigation, I.O., I.L. and S.R.; resources, I.O. and S.R.; data curation, I.O., P.O. and A.C.; writing—original draft preparation, I.O., I.L., A.L., S.R and A.D.C.; writing—review and editing, I.O., I.L., A.L., S.R and A.D.C.; visualization, I.O., I.L., A.L., S.R and A.D.C.; supervision, I.O.; project administration, I.O.; funding acquisition, I.O and I.L. All authors have read and agreed to the published version of the manuscript.”.

Funding

This research was funded by National Agency for Research and Development of Chile (ANID) and the FONDECYT Initiation, Chile, Project No. 11231013. Dr. Andrew D. Cartmill was supported through the T.R. Ellett Agricultural Research Trust. .

Data Availability Statement

The data that support the findings of this study are available at https://doi.org/10.6084/m9.figshare.32786382.

Acknowledgments

The first author would like to thank the National Agency for Research and Development-Chile (ANID) and the FONDECYT Initiation (Project No. 11231013) for funding and supporting the experiment and preparation of the manuscript. Agricultural Research Institute (INIA, Chile) is gratefully acknowledged for its support of this study. Dr. Andrew D. Cartmill was supported through the T.R. Ellett Agricultural Research Trust. To Jaime Valenzuela for his invaluable assistance with seed collection and laboratory evaluations. During the preparation of this manuscript/study, the author(s) used free version of Chat GPT 5.6 for the purposes of assistance with grammar, spelling, and language correction. The authors have reviewed and edited the output and take full responsibility for the content of this publication.

Conflicts of Interest

The authors declare no conflicts of interest. The funders had no role in the design of the study; in the collection, analyses, or interpretation of data; in the writing of the manuscript; or in the decision to publish the results.

References

  1. Volaire, F.; Barkaoui, K.; Norton, M. Designing resilient and sustainable grasslands for a drier future: Adaptive strategies, functional traits and biotic interactions. Eur. J. Agron. 2014, 52, 81–89. [Google Scholar] [CrossRef]
  2. Radic-Schilling, S.; Sales, F.; Lira, R.; Muñoz-Arriagada, R.; Corti, P.; Covacevich, N.; Ivelic-Sáez, J.; Ordóñez, I.; Vidal, O.; Echeverría, R.; et al. Magallanes Sheep Farming. In Sheep Farming - Herds Husbandry and Management System, Reproductive and Improving Animal Health [Working Title]; Gonzalez, M., Palacios, C., Eds.; IntechOpen, 2022; pp. 1–29. [Google Scholar]
  3. Zwicke, M.; Picon-Cochard, C.; Morvan-Bertrand, A.; Prud’homme, M.P.; Volaire, F. What functional strategies drive drought survival and recovery of perennial species from upland grassland? Ann. Bot. 2015, 116, 1001–1015. [Google Scholar] [CrossRef] [PubMed]
  4. Bristiel, P.; Roumet, C.; Violle, C.; Volaire, F. Coping with drought: root trait variability within the perennial grass Dactylis glomerata captures a trade-off between dehydration avoidance and dehydration tolerance. Plant Soil 2019, 434, 327–342. [Google Scholar] [CrossRef]
  5. Reich, P.B. The world-wide “fast-slow” plant economics spectrum: A traits manifesto. J. Ecol. 2014, 102, 275–301. [Google Scholar] [CrossRef]
  6. Norton, M.R.; Malinowski, D.P.; Volaire, F. Plant drought survival under climate change and strategies to improve perennial grasses. A review. Agron. Sustain. Dev. 2016, 36. [Google Scholar] [CrossRef]
  7. Volaire, F.; Morvan-Bertrand, A.; Prud’homme, M.P.; Benot, M.L.; Augusti, A.; Zwicke, M.; Roy, J.; Landais, D.; Picon-Cochard, C. The resilience of perennial grasses under two climate scenarios is correlated with carbohydrate metabolism in meristems. J. Exp. Bot. 2020, 71, 370–385. [Google Scholar] [CrossRef] [PubMed]
  8. Gastó, J.; Cosio, F.; Panario, D. Clasificación de ecorregiones y determinación de sitio y condición. Manual de aplicación a municipios y predios rurales; Andinos, Red de Pastizales, Ed.; Centro lnternacional de Investigaciones para el Desarrollo, CIID-Canadá: Quito, Ecuador, 1993. [Google Scholar]
  9. Pisano, E. Fitogeografía de Fuego-Patagonia chilema. An. Inst. La. Patagon. 1977, 8, 121–250. [Google Scholar]
  10. Pisano, E. V. Estudio Ecologico de la region continental sur del area Andino-Patagonica. II. Contribución a la fitogeografía de la zona del parque nacional “Torres del Paine.”. An. Del Inst. La Patagon. 1974, V, 59–104. [Google Scholar]
  11. Radic-Schilling, S.; Corti, P.; Muñoz-Arriagada, R.; Butorovic, N.; Sánchez-Jardón, L. Ecosistemas de estepa en la Patagonia chilena: distribución, clima, biodiversidad y amenazas para su manejo sostenible. Conservación en la Patagonia chilena: evaluación del conocimiento, oportunidades y desafíos 2021, 223–256. [Google Scholar]
  12. Rodríguez, D. Recursos forrajeros utilizados en producción ovina. V. Zona Austral (XII Región). In Talleres Gráficos Facultad de Ciencias Agrarias y Forestales; García, G., Ed.; Universidad de Chile: Santiago, Chile, 1986; pp. 101–108. [Google Scholar]
  13. Oyaneder, P.; Ordóñez, I.; Radic-schilling, S.; López, I.; Ivelic-Sáez, J. Coirón dulce ( Festuca gracillima Hook, f.) growth physiology under different defoliation intensity levels and water restriction regimes. Chil. J. Agric. Anim. Sci. 2025, 41, 44–58. [Google Scholar] [CrossRef]
  14. Ordoñez, I.P.; Radic-Schilling, S.; Ivelic-Sáez, J.; Muñoz-Arriagada, R.; Pinochet, D.; Covacevich, N.; Valle, S.; Tapia, A.; Oyaneder, P.; Valenzuela, J.; et al. Descripción de la vegetación, suelo y tasas de crecimiento de vegas y coironales en la región de Magallanes; Ordóñez, I.P., Radic-Schilling, S., Lira, R., Eds.; Instituto de Investigaciones Agropecuarias, Boletin 486: Punta Arenas, Chile, 2023. [Google Scholar]
  15. López, A.S.; López, D.R.; Caballé, G.; Siffredi, G.L.; Marchelli, P. Local adaptation along a sharp rainfall gradient occurs in a native Patagonian grass, Festuca pallescens, regardless of extensive gene flow. Environ. Exp. Bot. 2020, 171. [Google Scholar] [CrossRef]
  16. Eissenstat, D.; Yanai, R.D. Root lifespan, turnover and efficiency. Plant Roots. Hidden Half 2013, 221–238. [Google Scholar]
  17. Ordóñez, I.P.; López, I.F.; Kemp, P.D.; Donaghy, D.J.; Dörner, J.; García-Favre, J.; Zhang, Y. A short-term effect of multi-species pastures and the plant’s physiological response on pasture growth. Eur. J. Agron. 2024, 159, 127232. [Google Scholar] [CrossRef]
  18. Eissenstat, D.; McCormack, M.; Du, Q. Root Lifespan and Global Change David. In Plant Roots: The Hidden Half; Eshel, A., Beeckman, T., Eds.; CRC Press, 2013; pp. 399–412. ISBN 9780429108594. [Google Scholar]
  19. Freschet, G.T.; Pagès, L.; Iversen, C.M.; Comas, L.H.; Rewald, B.; Roumet, C.; Klimešová, J.; Zadworny, M.; Poorter, H.; Postma, J.A.; et al. A starting guide to root ecology: strengthening ecological concepts and standardising root classification, sampling, processing and trait measurements. New Phytol. 2021, 232, 973–1122. [Google Scholar] [CrossRef] [PubMed]
  20. Comas, L.H.; Becker, S.R.; Cruz, V.M. V.; Byrne, P.F.; Dierig, D.A. Root traits contributing to plant productivity under drought. Front. Plant Sci. 2013, 4, 1–16. [Google Scholar] [CrossRef] [PubMed]
  21. Wilhelm, W.W.; McMaster, G.S. Importance of the phyllochron in studying development and growth in grasses. Crop Sci. 1995, 35, 1–3. [Google Scholar] [CrossRef]
  22. Robin, A.H.K.; Irving, L.J.; Khaembah, E.N.; Matthew, C. Modelling carbon fluxes as an aid to understanding perennial ryegrass (lolium perenne) root dynamics. Agronomy 2018, 8, 1–13. [Google Scholar] [CrossRef]
  23. Robin, A.H.K.; Irving, L.J.; Crush, J.; Schnyder, H.; Lattanzi, F.A.; Matthew, C. Time course of root axis elongation and lateral root formation in perennial ryegrass (Lolium perenne l.). Plants 2021, 10. [Google Scholar] [CrossRef] [PubMed]
  24. Eissenstat, D.M.; Wells, C.E.; Yanai, R.D.; Whitbeck, J.L. Building roots in a changing environment: Implications for root longevity. New Phytol. 2000, 147, 33–42. [Google Scholar] [CrossRef]
  25. Li, X.; He, D.; Chen, G.; Yang, J.; Yang, Z.; Guo, X. juan; Wang, C.; Zhu, S.; Huang, Y.; Chen, H.; et al. Responses of leaf functional traits to different hydrological regimes and leaf economics spectrum in the water level fluctuation zone of Three Gorges Reservoir, China. Front. Plant Sci. 2022, 13. [Google Scholar] [CrossRef] [PubMed]
  26. Calvache, I.; Balocchi, O.; Alonso, M.; Keim, J.P.; López, I.F. Thermal time as a parameter to determine optimal defoliation frequency of perennial ryegrass (Lolium perenne L.) and pasture brome (Bromus valdivianus Phil.). Agronomy 2020, 10, 1–13. [Google Scholar] [CrossRef]
  27. Lara, A.; Cruz, G. Vegetación del area de uso agropecuario de la XII Región, Magallanes y de la Antártica Chilena; Santiago, Chile, 1987. [Google Scholar]
  28. INIA Red Agrometeorologia INIA. Available online: https://agrometeorologia.cl/# (accessed on 1 Jun 2025).
  29. Ordóñez, I.P.; López, I.F.; Kemp, P.D.; Donaghy, D.J.; Zhang, Y.; Herrmann, P. Response of Bromus valdivianus (Pasture Brome) growth and physiology to defoliation frequency based on leaf stage development. Agronomy 2021, 11, 2058. [Google Scholar] [CrossRef]
  30. Fort, F.; Jouany, C.; Cruz, P. Root and leaf functional trait relations in Poaceae species: Implications of differing resource-acquisition strategies. J. Plant Ecol. 2013, 6, 211–219. [Google Scholar] [CrossRef]
  31. Seethepalli, A.; Dhakal, K.; Griffiths, M.; Guo, H.; Freschet, G.T.; York, L.M. RhizoVision Explorer: Open-source software for root image analysis and measurement standardization. AoB Plants 2021, 13, 1–27. [Google Scholar] [CrossRef] [PubMed]
  32. Guo, H.; Ayalew, H.; Seethepalli, A.; Dhakal, K.; Griffiths, M.; Ma, X.F.; York, L.M. Functional phenomics and genetics of the root economics space in winter wheat using high-throughput phenotyping of respiration and architecture. New Phytol. 2021, 232, 98–112. [Google Scholar] [CrossRef] [PubMed]
  33. Gutiérres, H.; de la Vara, R. Análisis y diseño de experimentos, Second edi.; McGraw-Hill/Interamericana editores: Mexico D.F., 2008; ISBN 9789701065266. [Google Scholar]
  34. Posse, G.; Anchorena, J.; Collantes, M.B. Spatial micro-patterns in the steppe of Tierra del Fuego induced by sheep grazing. J. Veg. Sci. 2000, 11, 43–50. [Google Scholar] [CrossRef]
  35. Hu, W.; Shao, M.; Han, F.; Reichardt, K. Spatio-temporal variability behavior of land surface soil water content in shrub- and grass-land. Geoderma 2011, 162, 260–272. [Google Scholar] [CrossRef]
  36. Zhang, S.; Yuan, W.; Yu, Y.; Zhang, Y.; Wang, W.; Wang, L.; Yang, Y.; Wang, H. Shrubs plays an important role in configuration of shelterbelt in windy and sandy areas. Front. Ecol. Evol. 2024, 12, 1–10. [Google Scholar] [CrossRef]
  37. Hervé-Fernández, P.; Muñoz-Arriagada, R.; Glucevic-Almonacid, C.; Bahamonde-Vidal, L.; Radic-Schilling, S. Influence of Rangeland Land Cover on Infiltration Rates, Field-Saturated Hydraulic Conductivity, and Soil Water Repellency in Southern Patagonia. Rangel. Ecol. Manag. 2023, 90, 92–100. [Google Scholar] [CrossRef]
  38. Barkaoui, K.; Roumet, C.; Volaire, F. Mean root trait more than root trait diversity determines drought resilience in native and cultivated Mediterranean grass mixtures. Agric. Ecosyst. Environ. 2016, 231, 122–132. [Google Scholar] [CrossRef]
  39. Wang, R.; Kong, D.; Han, M.; Sack, L.; Lambers, H.; Cornelissen, J.H.C.; Li, Q.; Zhang, S.; Wang, X.; Wang, Z.; et al. Root quantity traits : a leading dimension in root trait space. 2026. [Google Scholar] [CrossRef] [PubMed]
  40. Oliviera, B.; López, I.F.; Cranston, L.M.; Kemp, P.D.; Donaghy, D.; Dörner, J.; López-Villalobos, N.; García-Favre, J.; Ordóñez, I.P.; Van Hale, R. 18O isotopic labelling and soil water content fluctuations validate the hydraulic lift phenomena for C3 grass species in drought conditions. Plant Stress 2024, 11, 100414. [Google Scholar] [CrossRef]
  41. Bodner, G.; Loiskandl, W.; Hartl, W.; Erhart, E.; Sobotik, M. Characterization of cover crop rooting types from integration of rhizobox imaging and root atlas information. Plants 2019, 8. [Google Scholar] [CrossRef] [PubMed]
  42. Eissenstat, D.M. Costs and benefits of constructing roots of small diameter. J. Plant Nutr. 1992, 15, 763–782. [Google Scholar] [CrossRef]
  43. Eissenstat, D.M.; Achor, D.S. Anatomical characteristics of roots of citrus rootstocks that vary in specific root length. New Phytol. 1999, 141, 309–321. [Google Scholar] [CrossRef] [PubMed]
  44. Wasson, A.P.; Richards, R.A.; Chatrath, R.; Misra, S.C.; Prasad, S.V.S.; Rebetzke, G.J.; Kirkegaard, J.A.; Christopher, J.; Watt, M. Traits and selection strategies to improve root systems and water uptake in water-limited wheat crops. J. Exp. Bot. 2012, 63, 3485–3498. [Google Scholar] [CrossRef] [PubMed]
  45. Liu, Y.; Li, P.; Wang, T.; Liu, Q.; Wang, W. Root respiration and belowground carbon allocation respond to drought stress in a perennial grass (Bothriochloa ischaemum). Catena 2020, 188, 104449. [Google Scholar] [CrossRef]
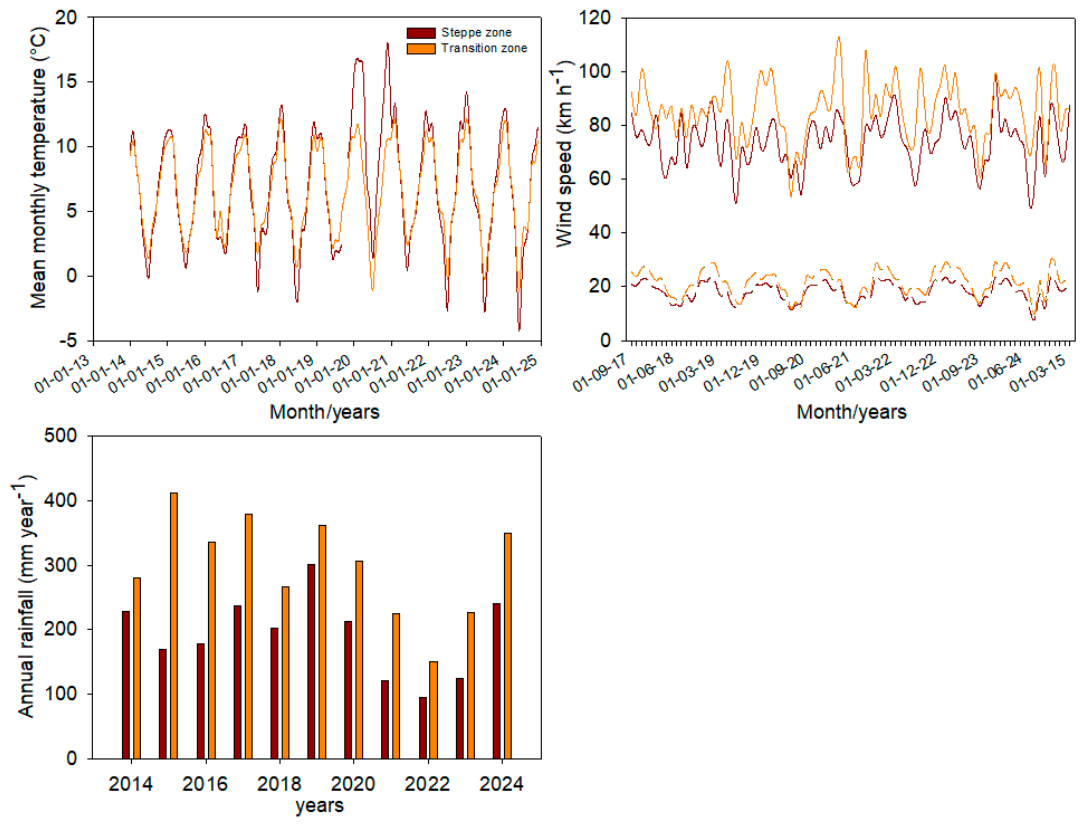
Figure 1. mean monthly temperature for the transition and steppe zones between the 2014 and 2024 (A). Annual rainfall for the transition and steppe zones between the 2014 and 2024 (B). Average wind between 2017 and 2025 (dashed lines); and wind gusts between 2017 and 2025 (solid lines) (C).
Preprints 230625 g001
Figure 2. Festuca gracillima growth of shoot mass (A) and root mass (B), and the accumulating growing degree needed to reach each development stage; i) seedling, ii) 1 leaf, iii) 2 leaves, iv) 3 leaves, v) early senescence and vi) late senescence (C). Bars indicated standard error of the mean (n=6). Uppercase letters indicate differences between dates (P<0.001).
Preprints 230625 g002
Figure 3. Total root length (A), fine root length (B), coarse root length (C) and leaf area (D) for each development stage for the steppe and transition accessions during the vegetative development evaluated. Bars indicated standard error of the mean (n=6). Uppercase letters indicate differences between dates. *** (P<0.001), ** (P<0.01), * (P<0.05) indicates differences between the accessions within the same date.
Preprints 230625 g003
Figure 4. Boxplots for root growth parameters of root length per unit (A), root volume (B) root surface (C), median root diameter (D), average root diameter (E) and maximum root diameter (F). Lowercase letters indicate statically differences. + indicates the mean, bars, and, boxes the distribution of the population (quartiles) (transition = 113; Steppe = 92).
Preprints 230625 g004
Figure 5. Figure 4. Boxplots for root growth parameters of root length per unit (A), root volume (B) root surface (C), median root diameter (D), average root diameter (E) and maximum root diameter (F). Lowercase letters indicate statically differences. + indicates the mean, bars, and, boxes the distribution of the population (quartiles) (transition = 113; Steppe = 92).
Preprints 230625 g005
Figure 5. Linear regressions between shoot and root growth parameters for both accessions; leaf area and root length (A); leaf area and root mass (B); leaf mass and root length (C); leaf mass and root mass (D). All linear regressions were statistically significant (p < 0 . 0 01) .
Preprints 230625 g006
Table 1. Leaf development and growth parameters for the transition and steppe accessions. Lower case letters indicate statistical differences between accessions. SEM indicates the standard error of the mean.
Leaf parameter Transition Steppe SEM transition SEM Steppe P-value
Phyllochron
(GDA leaf appearance-1)
201.5 a 172.0 b 9.1 7.6 =0.042
Specific leaf area
(cm2 g-1)
261.9 a 268.1 b 9.2 15.0 ≥0.05
Average leaf length
(cm leaf-1)
2.42 1.89 0.15 0.21 ≥0.05
Average leaf length superior quartile (cm leaf-1) 3.76 2.98 0.31 0.32 ≥0.05
Leaf elongation rate
(cm GDA-1)
0.01 0.01 1.0x10⁻³ 1.8x10⁻³ ≥0.05
Shoot: root ratio 2.91 2.85 0.49 0.40 ≥0.05
Table 2. Average values for root development and growth parameters for the transition and steppe accessions. Lower case letters indicate statistical differences between accessions. SEM indicates standard error of the mean (n=6).
Root parameter Transition Steppe SEM transition SEM Steppe P-value
Rhizochron
(GDA root appearance-1)
4.9 b 18.9 a 0.08 0.21 <0.001
Branching frequency
(root mm-1)
0.95 0.92 0.06 0.09 ≥0.05
Fine root proportion
(%)
56.6 b 72.1 a 1.05 1.56 =0.007
Fine root growth rate
(root mm GDA-1)
0.14 0.18 0.02 0.04 ≥0.05
Coarse roots growth rate
(root mm GDA-1)
0.11 0.05 0.02 0.02 ≥0.05
Total root growth rate
(root mm GDA-1)
0.25 0.24 0.03 0.04 ≥0.05
Specific root length
(m g-1)
164.4 190.3 25.4 40.2 ≥0.05
Disclaimer/Publisher’s Note: The statements, opinions and data contained in all publications are solely those of the individual author(s) and contributor(s) and not of MDPI and/or the editor(s). MDPI and/or the editor(s) disclaim responsibility for any injury to people or property resulting from any ideas, methods, instructions or products referred to in the content.
Copyright: This open access article is published under a Creative Commons CC BY 4.0 license, which permit the free download, distribution, and reuse, provided that the author and preprint are cited in any reuse.