

Submitted:
27 August 2026
Posted:
28 August 2026
You are already at the latest version
Abstract
This study presents a comprehensive parametric optimization of the blade geometry for the so-called Vertical Axis Autorotation Current Turbine (VAACT) using Computational Fluid Dynamics (CFD) simulations at high-blockage conditions. The optimization process aimed to minimize the resisting torque produced by the returning blade, the major contributor to performance loss in drag-type vertical axis turbines. The investigation was first conducted to assess the effects of maximum camber and its position on turbine efficiency. A response surface relating the power coefficient (CP) to maximum camber (M), camber position (P), and tip speed ratio (TSR) was then generated and used as input for the optimization routine. The optimal configuration was M = 40%, P = 65%, and TSR = 1.06, achieving an efficiency of 40.68% at 21.4% blockage ratio. The enhanced blade demonstrated a 21% improvement in performance compared to the conventional S-shaped profile, primarily due to the reduction of resisting torque during the returning phase. The intra-cycle analysis showed that the optimized turbine allowed a better distribution of hydrodynamic effects along the cycle, improving efficiency. Flow field analysis confirmed that the optimized geometry delays vortex shedding and reduces pressure gradients along the returning blade, leading to improved hydrodynamic behavior. The results demonstrate this procedure offers an effective way for the design of vertical axis hydrokinetic turbines.
Keywords:
vertical axis autorotation current turbine
; hydrokinetic turbines
; computational fluid dynamics
; blockage effect
; turbine efficiency
; blade enhancement
; renewable energies
1. Introduction
The investigation of Vertical Axis Turbines (VATs) is extensively employed for energy harvesting in sites where conventional horizontal turbines are not feasible, such as roads and urban areas [31,32,33], and low flow-rate rivers [27,28,29,30]. Although they have lower efficiency than horizontal axis turbines [21,22], their omnidirectional behavior [18,19,20], good self-starting capability associated to drag devices [15,16,17], and low levelized cost of energy (LCOE) [23,24] justify their study.
In the literature, these vertical turbines are classified as cross-flow turbines [14]. That means they capture the kinetic energy of a moving flow with spinning blades oriented perpendicular to the direction of flow [26]. Furthermore, the VATs can be subdivided into drag-driven [12] and lift-driven devices [25]. The drag-driven devices are simple machines that usually operate at low velocities and high torques. The maximum tip speed ratio () is 1.0, and they are less efficient than the lift-driven devices, which operate at higher rotational speeds and achieve higher efficiency values [13]. Nevertheless, drag devices have economic and operational benefits that justify their study and application over lift devices (low cost, simpler manufacturing, and better self-starting properties) [13]. Equations (1) and (2) depicts the tip speed ratio and power coefficient expressions:
where is the rotation speed; D is the turbine diameter; is the flow velocity measured 0.75 m () upstream of the turbine model; P is the power output; is the fluid density; and A is the frontal area (or the projected area).
There are also the so-called hybrid turbines [11]. These devices are manufactured by coupling lift- and drag-driven devices on the same axis to improve their overall properties. Recent investigations indicate these hybrid concepts can increase the design tip speed ratio and the optimum rotor efficiency against the conventional Savonius and Darrieus rotors [42,56].
Hybrid Darrieus–Savonius turbines have emerged as a promising alternative for overcoming the self-starting limitations of conventional Darrieus rotors. In this configuration, the drag-driven Savonius rotor provides the starting torque required for operation at low flow velocities, while the lift-driven Darrieus rotor ensures higher energy conversion efficiency at larger tip-speed ratios. Numerical investigations carried out by Inácio et al. [56] suggest hybrid configurations can increase the power coefficient by up to 70% at low TSR conditions and still achieve performance gains of approximately 6.5% at the optimum operating TSR, indicating a favorable balance between the additional power generated by the Savonius rotor and the aerodynamic losses caused by flow interaction effects.
The present approach focuses on the so-called Vertical Axis Autorotation Current Turbine (VAACT). This is an S-shaped configuration that resembles the classical Savonius geometry. The research has already investigated the performance of a flat plate [34], a flapped plate [35], an S-Shaped profile [8,37], and currently an optimized S-shape shown in this study.
This investigation also focuses on the methodology and main findings of the intra-cycle performance improvement of vertical axis turbines, as analyzed by examining the VAACT turbine. This methodology includes an extensive Computational Fluid Dynamics (CFD) campaign to determine the device’s power coefficient as a function of the tip speed ratio and the geometry, creating a database that allowed for applying the single-objective optimization method on a response surface achieved with this database.
The results obtained with the enhanced profile were compared with the classical VAACT turbine performance by using polar diagrams of hydrodynamic coefficients versus azimuthal angle and post-processing CFD images, which made possible to understand how the geometry and the resisting torque affect the intra-cycle performance of this device.
Blade-shape optimization procedures have demonstrated the potential to substantially improve the performance of drag-driven vertical axis turbines. For the Vertical Axis Autorotation Current Turbine (VAACT), this novelty CFD-based optimization study shows the blade camber and camber position can significantly influence the hydrodynamic loads acting on the rotor. By combining response surface methodology and optimization algorithms, an optimized blade profile was identified with an efficiency improvement of about 21%.
Moreover, this study also details the physical mechanism behind the efficiency improvement, such as the reduction of the resisting torque generated by the returning blade, the vortex-shedding pattern, and the pressure distributions around the rotor, reducing hydrodynamic losses throughout the rotational cycle. These findings indicate that controlling the flow dynamics on the returning side of the turbine is a key mechanism for improving the efficiency of drag-based hydrokinetic devices and provides valuable guidelines for future blade design developments.
2. Literature Review
Most recently, vertical axis turbine studies have focused on performance optimization either by blade optimization or operational performance enhancement. Blade optimization is employed since the turbine profile can be improved to boost turbine characteristics and minimize efficiency drop in the wake. This is usually performed by applying optimization techniques or parametric analysis.
On the other hand, operational enhancement assumes the turbine geometry is already optimal, or close to an optimal solution, and external aspects are changed to achieve better performance metrics. This approach may be accomplished by adding an obstacle close to the blade to create more favourable gradients of pressure and velocity near the blades. Moreover, hybrid solutions combining lift- and drag-driven devices are also adopted to improve the intracycle performance with the drag device and operate at larger tip speed ratio values because of the lift device.
Obstacles have been widely explored in the literature to improve the operational performance of vertical axis turbines. Typical applications intend to add deflectors or a flow lens to improve the flow through the device [47,48,53]. Wind lenses were installed by Hesami & Nikseresht [53] to study the effect of flanged diffusers on the performance improvement of a Savonius turbine. Six diffuser layouts were analyzed to achieve the best configuration by CFD simulations. The optimum configuration occurs when the diffuser and the flange lengths are 4 and 6 times the turbine diameters, respectively. It is worth noting that these wind lens layouts create constrained fluid flow, which allows for performance greater than the Betz Limit, defined for unbounded flow [6].
Hajong et al. [48] and Khoury et al. [47] utilized a shielding strategy to induce favorable pressure gradients and flow conditions to minimize the effect of resisting torque in a hybrid Savonius-Darrieus and in a single Savonius rotor, respectively. The CFD study conducted by Ref. [48] led to power coefficient enhancements larger than 6.0% for hybrid turbines operating with deflectors. On the other hand, Khoury et al. [47] accomplished experimental and numerical analyses with a shielding technique for redirecting the flow from the returning blade to the advancing blade. This study clarifies that the and curtain shield configuration shows a good improvement in the power coefficient () based on the unshielded profile.
Parametric studies have also been taken into consideration to enhance the Savonius turbine’s performance by shape modification [44,45,46,55,57]. Chullai et al. [57] conducted their research evaluating the effect of the aspect ratio and the wind speed on the performance of a conventional semicircular Savonius turbine. Cabalo & Marcelo [55] performed their analysis changing the number of blades (2 - 4) and the overlap ratio (0.0 - 0.2) for a Savonius turbine for operation in an irrigation canal in the Philippines. Similarly, Francisco et al. [45] tested 2-, 3-, and 6-bladed Savonius turbines on roofs at 2 m/s of wind speed. Their results indicate that the three-bladed configuration achieved the highest performance [45,57].
Tham et al. [46] analyzed a two-stage Savonius turbine by varying the blade configurations at four flow velocities. The optimum layout found in the investigation occurs when the turbines are perpendicular to each other, which minimizes the intra-cycle fluctuations. Jamal et al. [44] accomplished a broader parametric analysis, analyzing the effect of geometry (aspect ratio and blade shape) and operational (tip speed ratio, end plates, guide vanes, and deflecting blades) issues to enhance and boost a novel Savonius turbine performance. The novel approach proposes flexible blades that achieve a 17% improvement over a conventional Savonius rotor.
Moreover, the so-called Taguchi method is widely employed to determine the experimental factors that most affect the performance of vertical axis turbines [43,49,50,51,52,54]. This is a statistical approach to improve the product and process quality against external disturbances represented by the turbine’s geometric and operational factors. The most recent research in the literature shows this methodology has been applied to enhance Savonius and hybrid Darrieus-Savonius turbine performance.
Kaya & Acir [49] investigated the effect of blade type, overlap ratio, blade separation, separation distance, and blade thickness on the power coefficient of a two-bladed Savonius turbine. They found that the blade separation and the overlap ratio further influence the turbine’s performance. Moreover, the best turbine model has elliptical blades with 2 mm thickness, an overlap ratio of 0.15, and a blade separation of 7.5 mm.
Jiang et al. [50] analyzed a Bach turbine to enhance the global performance of a dual-rotor configuration. A three-turbine layout was evaluated by changing turbine spacing, configuration angle, and rotation angle. The analysis shows that the configuration angle has a large effect on the power coefficient, followed by the spacing and the direction of rotation speed. The optimal layout leads to a 64% improvement in the global efficiency. Note that a Bach turbine has also been tested by Zadeh et al. [43], getting similar performance improvement at = 2.5.
Hybrid Savonius-Darrieus solutions were tested by Abdel-Razak et al. [54] for vertical axis turbines incorporated at water storage tank buildings. They conducted numerical simulations to apply the Taguchi method, considering a methodology similar to that developed by Ref. [50]. The study also agreed that the rotation direction and the turbine distance most affect the global performance.
Meanwhile, Mirzaeian et al. [52] and Nath et al. [51] analyzed modifications in Darrieus and Savonius turbines, respectively. Mirzaeian et al. [52] present a novel dual-row vertical-axis wind turbine combining inner J-shaped and outer conventional blades to exploit both drag and lift forces, thereby improving performance especially at low values. They explore five key geometric parameters and identify that the tip-speed ratio has the greatest influence, with other important factors including airfoil shape, radial ratio, solidity ratio, and angular spacing. The optimized configuration achieved a maximum power coefficient of approximately 0.52, significantly outperforming comparable hybrid or single-row designs.
Furthermore, Nath et al. [51] studied the hydrodynamic behavior of a hybrid-bladed Savonius turbine under low-flow conditions using computational fluid dynamics and a Taguchi optimization framework, aiming to improve its torque and efficiency in hydrokinetic applications. By blending curved (airfoil-shaped) blades with straight ones, the study identifies optimal geometric parameters and operating conditions that enhance starting torque, reduce flow separation, and maximize power output over a range of Reynolds numbers.
These hybrid concepts were employed by Nhambiu et al. [42] and Inácio et al. [56]. The first investigation focused on a hybrid Savonius-Darrieus turbine solution for rural Mozambique fields, while the second only intended to improve the device performance. The Ref. [42] determined the lift-to-drag ratio for achieving the optimum turbine setup, so that it presented = 45% at = 2.0. On the other hand, the CFD model proposed in Ref. [56] led to a significant performance improvement () at = 1.5. These studies also suggest that the hybrid turbine performance becomes better than a conventional Darrieus turbine.
Other approaches recently considered in the literature are the application of design of experiments (DOE) and factorial design [39,40], artificial neural network surrogate model [41], and torque fluctuation reduction techniques [38]. They also lead to promising findings on the shape and operational optimization of Savonius rotors.
The relevant operational parameters from the literature discussed in this section are summarized in Table 1.
3. Materials and Methods
3.1. Domain and Boundary Conditions
Table 2 shows the control volume dimensions. The boundary conditions are the following: the inlet and the outlet have velocity and pressure gauge boundary conditions, whereas the turbine and the wall have no-slip boundary conditions. Figure 1 illustrates the CFD domain and the boundary conditions.
The CFD simulations have been accomplished using the commercial software Ansys Fluent [5]. A two-dimensional approach has been adopted in this study. This assumption is only possible if the turbine base is close to the control volume bottom, constraining the development of vertical flow motions, or if it is installed with winglets. This restriction reduces the vertical velocity component and concentrates the flow in the horizontal plane.
This hypothesis neglects the effect of three-dimensional vortices that could appear at the top and base. These vortices are responsible for energy losses, which drop the turbine’s performance. Then, a two-dimensional model may slightly overpredict the turbine’s performance since it does not present three-dimensional vortex effects. Nonetheless, 2D models are a widely applied approach as they are less computationally expensive than 3D models and provide robust data to evaluate the turbine’s performance and make design decisions.
3.2. Grid
The grid for these simulations is illustrated in Figure 2. It has about 136,000 elements, where 64,000 are wedges, and 72,000 are hexahedra. The dimensionless distance to the wall () at the turbine geometry is between 0.54 and 1.30, which complies with the recommendations for using the turbulence model SST k- to model the boundary layer () [10]. These properties are summarized in Table 3. The time series of is seen in Figure 3.
3.3. Numerical Formulation
This study examines the shape of a vertical turbine using a pressure-based solver with a transient time formulation. The simulation lasts 40 seconds and is conducted at a flow velocity of 0.30 m/s and an angular velocity range of 0.2 rad/s to 1.9 rad/s. The details of this research are presented in Table 4. Note that second-order schemes are applied since the error in the second order avoids convergence issues in the transient formulation. This scheme provides higher accuracy and lower numerical diffusion than first-order schemes, while maintaining greater numerical stability. This approach enables a more accurate prediction of turbine loads and wake characteristics.
It is worth mentioning that the SST k- model was selected because this is a noteworthy alternative to the CFD study of vertical turbines, since this model is computationally cheap, robust, and handles separation better than k- turbulence models. Moreover, it achieves good accuracy in predicting the power and torque coefficients, as well as the wake gradients [7].
3.4. Blade Improvement Methodology
The blade improvement methodology adopted in this study was based on a CFD-driven optimization framework combining parametric analysis, response surface modeling, and single-objective optimization. The primary objective was to improve the hydrodynamic efficiency of the Vertical Axis Autorotation Current Turbine (VAACT) by reducing the resisting torque generated by the returning blade, which had previously been identified as one of the main sources of performance loss in S-shaped drag-based rotors [4]. The overall blade improvement workflow adopted in this study is illustrated in Figure 4.
In the first step, the blade geometry was parameterized using two nondimensional design variables: the maximum camber (M) and the position of maximum camber (P). These parameters were selected because they directly influence the pressure distribution around the blade, the vortex shedding process, and consequently the balance between driving and resisting torque during a rotor revolution. A design space was established by varying the maximum camber between 5% and 90% and the camber position between 50% and 90% of the blade radius. The turbine performance was evaluated over a range of tip-speed ratios (TSR) from 0.2 to 1.9.
For each combination of (), the blade geometry was generated in Rhinoceros 3D [2] and further processed in ANSYS Design Modeler [1]. Computational meshes were subsequently generated using ANSYS Meshing [3] and employed in transient two-dimensional CFD simulations performed in ANSYS Fluent [5]. The hydrodynamic loads acting on the turbine were calculated by solving the Reynolds-Averaged Navier–Stokes equations using the SST (k-) turbulence model.
The lift and drag forces were determined by the net force, shown in Eq. (3). It is obtained by normal pressure () and viscous () contributions integration onto the turbine profile S:
where is the normal vector. Then, the lift and drag forces are defined perpendicularly and parallel to the flow so that .
On the other hand, the torque is given by Eq. (4) as a function of the position vector and the net force for a two-dimensional approach:
The power coefficient was determined by Eq. (2), where the power output is the turbine torque times the rotation speed (). Equation (5) shows the expression to calculate the lift, drag, and torque coefficients:
The resulting torque and power output were used to determine the power coefficient (), which was adopted as the performance metric throughout the single-objective optimization process. This procedure generated a database relating the turbine efficiency to the blade geometry and operating tip-speed ratio.
The numerical results obtained from the parametric analysis were subsequently used to construct a response surface model. A polynomial regression was fitted to the CFD data to express the power coefficient as a nonlinear function of maximum camber, camber position, and tip speed ratio. The resulting model provided an analytical representation of the turbine performance, significantly reducing the computational cost associated with repeatedly evaluating candidate designs during optimization.
The response surface was then employed as the objective function of the optimization procedure. The optimization problem was formulated to maximize the power coefficient while respecting the prescribed geometric bounds. A single-objective optimization algorithm searched the design space using the response surface approximation to identify the combination of blade parameters and operating conditions that maximized turbine performance. Finally, the hydrodynamic mechanisms responsible for the performance improvement were investigated through analyses of lift, drag, torque, vorticity, and pressure fields and compared with the results achieved for the baseline turbine geometry (S-Shaped VAACT profile). Table 5 summarizes the simulation matrix considered in the parametric analysis.
4. Results
4.1. Model Verification
4.1.1. Domain
The sensitivity study for the domain is made by changing the upstream () and downstream () lengths of the control volume. To achieve a blockage ratio () of for the width, it is maintained at , the condition at the test facility used to validate the numerical model.
This analysis enables the study of the power coefficient () on the turbine by creating three domains: large (1), medium (2), and small (3). Their dimensions are provided in Table 6. It should be noted that the domain width is 1.4 m, and the rotating region diameter () is 0.35 m. The time-averaged power coefficient for the three domains is also presented, assuming that it is determined by Equation (6).
where is the hydrodynamic torque, is the fluid density, A is the frontal area, and is freestream velocity. The sensitivity test was carried out at a freestream velocity of and a rotation speed of , resulting in a tip speed ratio of .
It is worth noting that the changes in the simulations between the medium-large and small-medium domains were and , respectively. The domain had oscillatory convergence, as the convergence ratio was negative (). The small domain approach was used in the simulations due to its time-saving and cost-effective nature compared to running cases using large or medium domains [9].
4.1.2. Grid
The grid sensitivity test involves three grids with a refinement ratio of approximately . The number of elements in each grid is provided in Table 7. The refinement ratio can be determined using Eq. (7), which is calculated by taking the square root of the ratio between the number of elements in the medium-fine and coarse-medium grids. The value of n in the equation depends on the characteristics of the model. For example, for a two-dimensional model, and for a three-dimensional model.
Table 7 contains information about the dimensionless distance to the wall () at the turbine and the control volume. The value is less than 6.0, indicating that the model can capture turbulent phenomena at all layers of the boundary layer. It is worth noting that the value at the turbine is less than 2.0, while it is less than 4.0 at the walls.
During the sensitivity test, changes were observed between medium-fine and coarse-medium grids when the power coefficient was adopted as a parameter. The changes resulted in a convergence ratio of with and . After this, a monotonic convergence of the grid was observed. The medium grid was found to have a small error compared to the fine grid (less than 2.0%) and was chosen for the test.
4.1.3. Time-Step Size
The study aimed to analyze the effect of different time-step sizes on the power coefficient. Three time-step sizes were tested: 0.007 s, 0.010 s, and 0.014 s. Table 8 shows the power coefficient values for each time-step size. The analysis revealed that the power coefficient exhibited an oscillatory convergence concerning the time-step size.
Specifically, the power coefficient for the medium time-step of was smaller than that for both and . Based on these findings, a time-step size of 0.010 seconds was chosen for the simulations. The changes between medium-fine and coarse-medium are and , respectively. Thus, the convergence ratio is .
4.1.4. Simulation Uncertainty
A summary of the verification procedures was presented in Table ? . The expressions listed in the table are applied to determine the domain and the time-step uncertainties for oscillatory convergence. For grid convergence, Richardson extrapolation is used as described in Eq. (8). To account for monotonic convergence, a safety factor of is applied to the expression. These procedures are following the ITTC guidelines [9].
where,
then, the simulation uncertainty can be determined as which provides .
4.2. Model Validation
The CFD validation followed the International Towing Tank Conference (ITTC) guidelines for uncertainty analysis in CFD verification and validation [9]. The error between the real data () and the simulation (S) was determined by Equation (10):
Meanwhile, the validation uncertainty () is achieved by Equation (11), where is the data uncertainty and the simulation uncertainty:
The experimental uncertainty () was determined from the tests accomplished at the current flume of the Waves and Currents Laboratory (LOC-COPPE/UFRJ) [8]. It has length of 22 m, a width of 1.4 m, a depth of 0.50 m, and flow velocities in the range 0.05 m/s - 0.5 m/s. The tests are assumed two-dimensional since the free surface effects/deformations are negligible, and the model bottom does not produce vortex-shedding at the gap found between the model tests and the test facility (see Figure 5)
The Qualisys Track Manager (QTM) was used to determine the kinematic properties of the model test, as shown in Figure 6. It measures the angular displacement () of the VAACT, enabling us to estimate both the rotation speed () and angular acceleration () by applying an upwind scheme. The first-order schemes are described in Equation (12).
Figure 7 presents a diagram of the Power Take-Off (PTO) system. The mechanical power take-off device uses the time derivative of the potential energy to evaluate power output.
The power output can be calculated using the equation , where m is the mass lifted, g is the acceleration due to gravity, and is the vertical velocity of the mass. Note that can also be represented as , where is the pulley radius attached to the vertical axis. The average efficiency of the turbine can be measured as follows:
The equation leads to the PTO torque. To estimate the velocity components, an Acoustic Doppler Velocimeter (ADV) is placed 3 meters upstream of the test section, as shown in Figure 6. This is a Nortek Vectrino Profiler [36]. A 100 Hz sampling rate is established in the measurements. The turbulence intensity at the test section ranges from 3.5% to 4.2%.
The uncertainty quantification is determined by Equation (14).
where is the standard deviation of y, N denotes the sample length, typically comprising three samples. Assuming a Gaussian distribution, the coverage factor for a 95% confidence level is taken as .
The validation results are depicted in Table 9 and Figure 8. The error between the simulation results is less than the uncertainty validation in all five configurations considered in the analysis. These show there is a good match between the experimental and CFD data. That means the CFD simulations employed in the present research are robust to reproduce the data and the physics behind the phenomenon of energy harvesting by hydrokinetic turbines.
4.3. Blade Enhancement Technique
A screening analysis made by CFD simulations allowed for determining the surface response to estimate the power coefficient () behavior as a function of the maximum camber (M), the camber position (P), and the tip speed ratio (). Equation (17) provides this response surface:
where are the unknown coefficients.
The unknown coefficients were firstly adjusted based on the M - , P - , and - - ranges defined in the two-dimensional simulations with the turbine profiles. Note that the polynomial expressions do present a good agreement with the simulated data as the determination coefficient is larger than 0.80 (see Table 10).
Table 11 shows the results found by applying the optimization method using the response surface presented in Equation (17). The maximum camber is , the camber position is between , and the tip speed ratio is about . The turbine’s power coefficient is around 42.05%. The development of the optimization method through the generations is illustrated in Figure 9. This regression gets good adherence for the data obtained from the numerical simulations.
Figure 10 displays the efficiency surface as a function of the input parameters (M, P, and ) with the design point shown in red in the graph. The optimum blade geometry achieved by the response surface was then simulated to verify the model’s feasibility in predicting the turbine’s performance. The analysis shows the optimization limits led to an inaccurate power coefficient result since the global maximum was not close to the best turbine blades obtained in the parametric study, leading to a power coefficient of 37.6%.
As a result, a new optimization was conducted, changing the lower and upper limits for maximum camber, camber position, and tip speed ratio based on the parametric simulations. The results inspection made possible to change the limits to regions at which the power coefficient is larger than 38%, leading to more realistic results. The updated results are summarized in Table 12.
The lower and upper limits in the optimization algorithm were updated to achieve a high level of accuracy between the optimization model and the CFD simulations, with a relative error of less than 1%. The nonlinear coefficients used to build the nonlinear power coefficient curve with the "Updated" optimization method are provided in Appendix A.
5. Discussions
The hydrodynamic coefficients’ behavior in the time domain and as a function of the azimuth angle are provided in Figure 11 and Figure 12, respectively, comparing the performance of the optimized blade profile to the S-shaped profile. Note that both blade geometries are presented in Figure 13. Their power coefficient as a function of the tip speed ratio is also depicted in Figure 14. The S-shaped profile induces a resisting torque, which causes a loss of performance between the angles of attack , and .
Regarding the lift and drag coefficients, no further changes can be observed in the polar diagram views. However, the time series shows the peaks are slightly more prominent at the S-shaped profile than at the optimized profile. Moreover, the drag coefficient for the S-shaped VAACT also verifies a high fluctuation. These behaviors are reflected in the performances in Table 13, where the power coefficient at bounded fluid is described.
Figure 14 also ratifies the performance improvement comparing the power coefficient curve from the baseline S-Shaped VAACT with the optimized profile proposed in the current study for the blocked and corrected coefficients, respectively. The figure shows that the optimized profile efficiency is enhanced for a tip speed ratio around 1.0. The graph still provides the optimized profile, which presents greater performance than the baseline profile at . Their performance is nearly the same outside this interval ( and ).
The vorticity field around the S-shaped VAACT and the optimized profile are presented in Figure 15. The illustrations show that the vortex-shedding pattern has more intensity close to the S-shaped VAACT than the optimized blade geometry. Because the turbine’s vortex shedding is associated with rotor energy loss, this could explain the performance loss observed for the S-shaped profile relative to the new proposal.
On the other hand, the effect of blade optimization can be seen in Figure 15c and Figure 15d. These figures display that the turbines do have a vortex generation at the returning blade that creates a resisting angular motion. This vortex presents a lower magnitude in the optimized blade than the classical S-shaped profile. This phenomenon contributes a resisting torque to the turbine. In Figure 15g and Figure 15h, the vorticity field shows another advantage in the optimized blade geometry that consists of delayed vortex shedding. These figures show that the vortices are attached to the blade at azimuth angle. In contrast, the S-shaped profile presents an interaction between rotation and counter-rotating vortices that induces the vortex release.
The effect of the resisting torque in the turbine dynamics can also be seen in Figure 16 for the pressure coefficient around the rotors. Indeed, the blade shape at the tips has been a determining factor in the turbine dynamics. These illustrations allow us to conclude that the S-shaped VAACT has high positive and negative pressures at the returning blade, which causes the so-called resisting torque. On the other hand, the optimized blade geometry presents lower pressure values. This suggests the optimized profile gets better hydrodynamic performance than the S-shaped VAACT.
6. Conclusions
This paper presented the results of optimizing the blade design for the VAACT profile. The analysis employed a design of experiments and single-objective optimization to identify a blade that minimizes the resisting torque on the returning blade, thereby enhancing turbine efficiency. This analysis aimed to propose a new S-shaped profile following the optimization procedures.
Firstly, a parametric analysis of the geometry was conducted to verify the efficiency as a function of the maximum camber and camber position. The lift, drag, and torque coefficients were analyzed to derive meaningful insights from the simulations. This parametric analysis revealed that an effective method for improving performance is to minimize the resisting torque.
Furthermore, simulations were conducted to vary the tip speed ratio (). This enabled achieving a response surface that describes the power coefficient about maximum camber (M), camber position (P), and tip speed ratio (). A single-objective optimization was then applied to this surface to identify the optimal blade design, resulting in , , and , with an efficiency of for a blocked turbine.
The performance of the optimized profile and the S-shaped profile was compared to assess the level of improvement. The simulations revealed an efficiency improvement of 21%, primarily attributed to an enhancement in resisting torque. This phenomenon can also be observed in the post-processing images of vortex shedding and the pressure coefficient around the rotor.
Author Contributions
Conceptualization, A.C.F. and J.S.S.J.; methodology, R.B.S.; software, R.B.S.; verification and validation, R.B.S.; formal analysis, R.B.S.; investigation, R.B.S.; resources, A.C.F. and J.S.S.J.; data curation, R.B.S.; writing—original draft preparation, R.B.S.; writing—review and editing, R.B.S., A.C.F. and J.S.S.J.; visualization, R.B.S.; supervision, A.C.F. and J.S.S.J.; project administration, A.C.F. and J.S.S.J.. All authors have read and agreed to the published version of the manuscript.
Funding
This research received no external funding.
Institutional Review Board Statement
Not applicable.
Data Availability Statement
The data presented in this study are available from the corresponding author upon reasonable request.
Acknowledgments
The authors would like to acknowledge the support of the Laboratory of Waves and Currents (LOC/COPPE - Laboratório de Ondas e Correntes), the ESSS Institute (Engineering Simulation and Scientific Software), and Ansys for the technical support. The researchers have been financially supported by the Human Resources Training Program of the Brazilian National Agency for Petroleum, Natural Gas and Biofuels – PRH18-ANP, under the management of the São Paulo Research Foundation (FAPESP), Brazil. Process N. 2025/03263-0. The authors are also grateful to the Research Support Foundation of the State of Rio de Janeiro (FAPERJ – Fundação de Amparo à Pesquisa do Estado do Rio de Janeiro), the Coordination for the Improvement of Higher Education Personnel (CAPES – Coordenação de Aperfeiçoamento de Pessoal de Nível Superior), and the National Council for Scientific and Technological Development (CNPq – Conselho Nacional de Desenvolvimento Científico e Tecnológico), Brazil. Their financial and institutional support was essential for the development of this research.
Conflicts of Interest
The authors declare no conflicts of interest.
Appendix A. Response Surface Coefficients
Table A1 provides the coefficients from the nonlinear regression for the turbine’s performance. These coefficients are obtained from the so-called "Updated Optimization Method" expressed in Table 12 so that it feeds Eq. (17) and generates Figure 10.

Table A1.
Polynomial coefficients.
| -16.2753 | 5.3695 | ||
|---|---|---|---|
| 0.2019 | -7.0305 | ||
| 97.5750 | 0.8497 | ||
| -0.2493 | -0.2254 | ||
| 0.9796 | -4.1478 | ||
| -217.5038 | -0.2405 | ||
| -0.0634 | -0.0984 | ||
| 0.5309 | 3.8430 | ||
| 212.8415 | 0.2711 | ||
| 0.0265 | 0.0709 | ||
| -0.5010 | -1.7278 | ||
| -77.0977 | -3.3817 | ||
| -0.0041 | -0.0395 | ||
| 0.5795 | 2.4233 | ||
| -1.2823 | -0.6654 | ||
| 2.5594 | 2.1493 |
References
- ANSYS, Inc. Ansys DesignModeler User’s Guide; ANSYS, Inc., 2026 (Release 2026 R1. [Google Scholar]
- McNeel, Robert; Associates. Rhinoceros 3D. 2024. Available online: https://rhino3d.com.
- ANSYS, Inc. ANSYS Meshing User’s Guide; ANSYS, Inc., 2026 (Release 2026 R1. [Google Scholar]
- Soares, R. B.; Fernandes, A. C.; Sales Junior, J. S. On the Intracycle Performance of an S-Shaped Vertical-Axis Autorotation Current Turbine by Computational Fluid Dynamics. J. Offshore Mech. Arct. Eng. 2026, 148(3), 031901. [Google Scholar] [CrossRef]
- ANSYS, Inc. ANSYS Fluent User’s Guide, Release 2026 R1; Available via Ansys Customer Portal; ANSYS, Inc., 2026. [Google Scholar]
- Manwell, J. F.; Branlard, E.; McGowan, J. G.; Ram, B. Wind Energy Explained: On Land and Offshore; Wiley, 2024. [Google Scholar]
- Fazlizan, A.; Muzammil, W. K.; Al-Khawlani, N. A. A Review of Computational Fluid Dynamics Techniques and Methodologies in Vertical Axis Wind Turbine Development. Comput. Model. Eng. Sci. 2025. [Google Scholar] [CrossRef]
- Soares, R. B.; Fernandes, A. C.; Sales Junior, J. S. Vertical Axis Autorotation Current Turbine (VAACT) Analysis With Power Take-Off System. International Conference on Offshore Mechanics and Arctic Engineering, 2024; p. V007T09A087. [Google Scholar] [CrossRef]
- International Towing Tank Conference (ITTC). Uncertainty Analysis in CFD Verification and Validation, Methodology and Procedures. Resistance Committee of 28th ITTC, 2017, 2023; Available online: http://www.ittc.info.
- Menter, F. R. Two-equation eddy-viscosiy turbulence models for engineering applications. AIAA J. 2012, 32(8). [Google Scholar] [CrossRef] [PubMed]
- Abdel-Razak, M. H.; Emam, M.; Ookawara, S.; Hassan, H. Study the performance of a novel design of twin hybrid Darrieus-Savonius vertical-axis wind turbines integrated with building water storage tanks: 3D optimization study. Renew. Energy 2026, 256, 124024. [Google Scholar] [CrossRef]
- Zhu, J.; Qian, G.; Zhang, P.; Zhu, J.; Sun, X. Aerodynamic synergy through cooperative vortex control in Savonius turbine clusters. Energy 2025, 339, 139090. [Google Scholar] [CrossRef]
- Fatahian, E.; Ismail, F.; Hafifi Hafiz Ishak, M.; Shyang Chang, W. An innovative deflector system for drag-type Savonius turbine using a rotating cylinder for performance improvement. Energy Convers. Manag. 2022, 257, 115453. [Google Scholar] [CrossRef]
- Anand, R. S.; Jawahar, C. P.; Bellos, E.; Malmquist, A. A comprehensive review on Crossflow turbine for hydropower applications. Ocean Eng. 2021, 240, 110015. [Google Scholar] [CrossRef]
- Shamsuddin, M. S. M.; Kamaruddin, N. M. Experimental study on the characterization of the self-starting capability of a single and double-stage Savonius turbine. Results Eng. 2023, 17, 100854. [Google Scholar] [CrossRef]
- Ghafoorian, F.; Mirmotahari, S. R.; Eydizadeh, M.; Mehrpooya, M. A systematic investigation on the hybrid Darrieus-Savonius vertical axis wind turbine aerodynamic performance and self-starting capability improvement by installing a curtain. Next Energy 2025, 6, 100203. [Google Scholar] [CrossRef]
- Salleh, M. B.; Kamaruddin, N. M.; Mohamed-Kassim, Z.; Bakar, E. A. Experimental investigation on the characterization of self-starting capability of a 3-bladed Savonius hydrokinetic turbine using deflector plates. Ocean Eng. 2021, 228, 108950. [Google Scholar] [CrossRef]
- Xie, L.; Huang, H.; Liu, Q.; Yue, M.; Miao, W.; Li, C.; Xu, Z. Fully coupled aero-hydrodynamic analysis of a floating VAWT with enhanced spar platforms. Energy 2025, 341, 139362. [Google Scholar] [CrossRef]
- Zhang, D.; Chen, J.; Chen, Y.; Kuang, L.; Wu, Z.; Peng, Y.; Zhou, D.; Tu, Y. Wake characteristics of 5-MW floating VAWTs under coupled pitch-surge motions: A numerical analysis. Renew. Energy 2026, 256, 124669. [Google Scholar] [CrossRef]
- Rezaei, F.; Paraschivoiu, M. Evaluating roof-mounted VAWT performance with CFD for various building shapes, boundary layer flows, and location scenarios. Trans. Can. Soc. Mech. Eng. 2025, 49(2), 350–367. [Google Scholar] [CrossRef]
- Das Karmakar, S.; Chattopadhyay, H. A review of augmentation methods to enhance the performance of vertical axis wind turbine. Sustain. Energy Technol. Assess. 2022, 53, 102469. [Google Scholar] [CrossRef]
- Fadil, J.; Soedibyo; Ashari, M. Performance comparison of vertical axis and horizontal axis wind turbines to get optimum power output. 2017 15th International Conference on Quality in Research (QiR): International Symposium on Electrical and Computer Engineering, 2017; pp. 429–433. [Google Scholar] [CrossRef]
- Rostami, A. B.; Armandei, M. Renewable energy harvesting by vortex-induced motions: Review and benchmarking of technologies. Renew. Sustain. Energy Rev. 2017, 70, 193–214. [Google Scholar] [CrossRef]
- Arredondo-Galeana, A.; Brennan, F. Floating Offshore Vertical Axis Wind Turbines: Opportunities, Challenges and Way Forward. Energies 2021, 14. [Google Scholar] [CrossRef]
- Reddy, K. B.; Bhosale, A. C.; Saini, R. P. Performance parameters of lift-based vertical axis hydrokinetic turbines - A review. Ocean Eng. 2022, 266, 113089. [Google Scholar] [CrossRef]
- Bhagat, R.; Kumar, D.; Sarkar, S. Design modification and performance prediction of ellipsoid cross-flow hydrokinetic turbine. Renew. Energy 2023, 219, 119475. [Google Scholar] [CrossRef]
- Rodriguez-Valencia, A. F.; Escobar-Nunez, E.; Jaramillo-Pizarro, G. A. Recent advances and performance characteristics of vertical axis hydrokinetic turbines: A review. Energy Rep. 2025, 14, 5170–5203. [Google Scholar] [CrossRef]
- Park, J.; Mangano, M.; Seraj, S.; Pacini, B.; Liao, Yingqian; Knight, Bradford G.; Naik, Kartik; Maki, Kevin J.; Martins, Joaquim R.R.A.; Sun, Jing; Pan, Yulin. CFD-based design optimization of a 5 kW ducted hydrokinetic turbine with practical constraints. Renew. Energy 2026, 256, 124304. [Google Scholar] [CrossRef]
- Seifi Davari, H.; Seify Davari, M.; Ntantis, E. L. A review on the design and optimization of lift-based hydrokinetic turbines: Darrieus, Gorlov, and helical types. Results Eng. 2025, 28, 107746. [Google Scholar] [CrossRef]
- Maldar, N. R.; Yee, N. C.; Oguz, E.; Krishna, S. Performance investigation of a drag-based hydrokinetic turbine considering the effect of deflector, flow velocity, and blade shape. Ocean Eng. 2022, 266, 112765. [Google Scholar] [CrossRef]
- Abohela, I.; Hamza, N.; Dudek, S. Effect of roof shape, wind direction, building height and urban configuration on the energy yield and positioning of roof mounted wind turbines. Renew. Energy 2013, 50, 1106–1118. [Google Scholar] [CrossRef]
- Stephan, A.; Srikumar, S. K. R.; Tsionas, I.; Llaguno-Munitxa, M.; Gambale, A. Deploying small vertical axis wind turbines on urban rooftops — A parametric, dynamic, and hybrid life cycle energy and greenhouse gas emissions analysis. Sustain. Cities Soc. 2025, 135, 106977. [Google Scholar] [CrossRef]
- Gallorini, F.; Barelli, L. Design and prototyping of miniature wind turbine and power generation section for the exploitation of wind generated by vehicle movement in road tunnels. Energy 2024, 305, 132308. [Google Scholar] [CrossRef]
- Fernandes, A. C.; Rostami, A. B. Hydrokinetic Energy Harvesting by an Innovative Vertical Axis Current Turbine. Renew. Energy 2015, 81, 694–706. [Google Scholar] [CrossRef]
- Rostami, A. B.; Fernandes, A. C. The Effect of Inertia and Flap on Autorotation Applied for Hydrokinetic Energy Harvesting. Appl. Energy 2015, 143, 312–323. [Google Scholar] [CrossRef]
- NORTEK. The Comprehensive Manual for Velocimeters - NORTEK Manuals. Available online: https://www.nortekgroup.com/assets/software/N3015-030-Comprehensive-Manual-Velocimeters_1118.pdf (accessed on 5 December 2016).
- Soares, R. B.; Fernandes, A. C.; Sales Junior, J. S. The Effect of Power Take-Off System on S-Shaped Vertical Axis Autorotation Current Turbine. In Proceedings of the ASME 2023 42nd International Conference on Ocean, Offshore and Artic Engineering, 2023. [Google Scholar] [CrossRef]
- Trent, R.; Ajayi, O. Torque Ripple Reduction Techniques for Improved Smoothness of Savonius Vertical Axis Wind Turbine Operation. Adv. Environ. Eng. Res. 2025. [Google Scholar]
- Velásquez, L.; Rengifo, J.; Saldarriaga, A.; Rubio-Clemente, A.; Chica, E. Geometric Optimization of Savonius Vertical-Axis Wind Turbines Using Full Factorial Design and Response Surface Methodology. Sci 2025, 7(154). [Google Scholar] [CrossRef]
- Prabowoputra, D. M.; Pranata, A.; Prabowo, A. R.; Istanto, I.; Wijaya, R.; Do, Q. T.; Sohn, J. M.; Carvalho, H.; Yaningsih, I.; Wibowo, W.; Susilo, D. D. Effect of curved geometrical aspects of Savonius rotor on turbine performance using factorial design analysis. Curved Layer. Struct. 2025, 12(1), 20250039. [Google Scholar] [CrossRef]
- Fatahian, H.; Mishra, R.; Jackson, F. F.; Fatahian, E. Data-Driven ANN-Based Surrogate Modeling: Exploring Power Performance of Dual Savonius Rotor. Joint event Euromech Colloquium on Data-Driven Fluid Dynamics/2nd ERCOFTAC Workshop on Machine Learning for Fluid Dynamics, 2025. [Google Scholar]
- Nhambiu, J.; Cossa, T. A.; Chichango, F. Aerodynamic Optimization and Cost-Benefit Analysis of Savonius-Darrieus Hybrid Wind Turbines for Rural Mozambique. World J. Adv. Res. Rev. 2025, 28(1). [Google Scholar] [CrossRef]
- Zadeh, M. N.; Pourfallah, S. S.; Gholinia; Mouloodi, M.; Ahangar, S.A. T. Performance Assessment and Optimization of a Helical Savonius Wind Turbine by Modifying the Bach’s Section. SN Appl. Sci. 2021, 3(8). [Google Scholar] [CrossRef]
- Jamal, S. V.; Abay, A. A.; Mebrat, A. A.; Beyene, A. Performance of a Novel, Flapping Vertical Axis Wind Turbine of the Savonius Derivative. ASME Open J. Eng. 2025, 4, 041031. [Google Scholar] [CrossRef]
- Francisco, J.; Rhakasywi, D.; Fahrudin, F. Experimental Analysis of the Performance of Savonius VAWT with Different Numbers of Blades on Roofs. Indones. J. Innov. Stud. 2025, 4. [Google Scholar] [CrossRef]
- Tham, X. Y.; Ng, C. Y.; Ong, M. C.; Tingkas, N. F. A Parametric Study on the Effect of Blade Configuration in a Double-Stage Savonius Hydrokinetic Turbine. J. Mar. Sci. Eng. 2025, 13(5). [Google Scholar] [CrossRef]
- Khoury, G.; Alomar; Rishmany, Z.; Daaboul, J.M. Improving the Efficiency of Savonius Wind Turbine Through Shielding: Numerical and Experimental Study. Int. J. Power Energy Syst. 2025, 45(10). [Google Scholar] [CrossRef]
- Hajong, G.; Raman, R.; Sarma, S.; Raji, R.; Alom, N. Computational Investigation of a Hybrid Vertical Axis Wind Turbine using Deflector Plates. Sãdhanã 2025, 50(271). [Google Scholar] [CrossRef]
- Kaya, A. Fatih; Acir, A. Enhancing the aerodynamic performance of a Savonius wind turbine using Taguchi optimization method. Energy Sources Part A Recovery Util. Environ. Eff. 2022, 44(2), 5610–5626. [Google Scholar] [CrossRef]
- Jiang, J.; Chen, J.; Zeng, Z.; Chen, W.; Zhou, L.; Li, Cong. Performance Optimization of Modified Bach Savonius Wind Turbine Clusters Based on Taguchi Method. Clean Energy 2025, zkaf039. [Google Scholar] [CrossRef]
- Nath, B.; Biswas, A.; Das, B.; Misra, R. D. Hydrodynamic Investigation of a Hybrid-Bladed Savonius Hydrokinetic Turbine—Computational Fluid Dynamics and Taguchi Optimization Approaches. J. Fluids Eng. 2025, 147(10), 101205. [Google Scholar] [CrossRef]
- Mirzaeian, H.; Ghobadian, B.; Mirhosseini. Performance Analysis and Optimization of Dual-Row Vertical Axis Wind Turbines With Innovative Hybrid Blades. Energy Sci. Eng. 2025, 13(6), 101205. [Google Scholar] [CrossRef]
- Hesami, A.; Nikseresht, A. H. Towards development and optimization of the Savonius wind turbine incorporated with a wind-lens. Energy 2023, 274, 127263. [Google Scholar] [CrossRef]
- Abdel-Razak, M. H.; Emam, M.; Mori, S.; Hassan, H. Performance of an Innovative Configuration of Three Hybrid Darrieus-Savonius Vertical-Axis Turbines Incorporated with Building Water Storage Tanks. Phys. Fluids 2025, 37, 082116. [Google Scholar] [CrossRef]
- Cabalo, J. L.; Marcelo, A. L. Optimization of Savonius type hydro-kinetic turbine for irrigation canal in the Philippines using computational fluid dynamics. IOP Conf. Ser. Earth Environ. Sci. 2025, 1500(1), 012016. [Google Scholar] [CrossRef]
- Inácio, R. G. da S.; da Rosa, I. A.; Avila, V. H.; Rocha, L. A. O.; Isoldi, L. A.; Dias, G. da C.; Gonçalves, R. A. A. C.; dos Santos, E. D. Numerical Investigation of Hybrid Darrieus/Savonius Vertical Axis Wind Turbine Subjected to Turbulent Airflows. J. Mar. Sci. Eng. 2025, 13(10). [Google Scholar] [CrossRef]
- Chullai, E. T.; Maity, S.; Sarkar, B. K. Parametric Analysis of Conventional Semicircular and Newly Developed Parabolic Rotors for Savonius-Style Wind Turbines: Three-Dimensional Numerical Simulations. J. Fluids Eng. 2025, 147(11), 111203. [Google Scholar] [CrossRef]
Figure 1.
CFD domain and boundary conditions: (a) Turbine geometry; (b) Domain dimensions and boundary conditions.
Figure 1.
CFD domain and boundary conditions: (a) Turbine geometry; (b) Domain dimensions and boundary conditions.
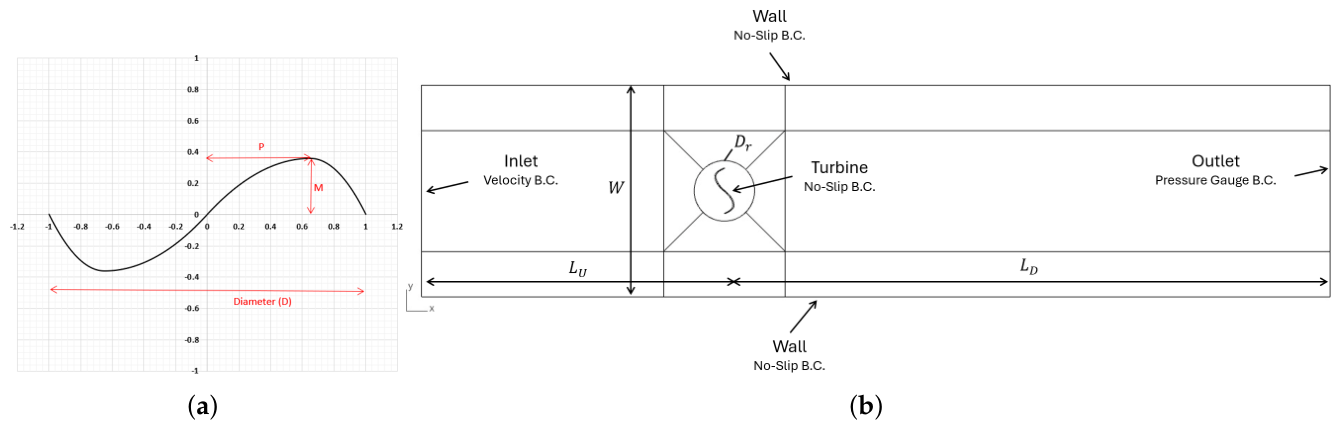
Figure 2.
Grid around the profile: (a) Control volume; (b) Rotationg-region; (c) Turbine geometry; (d) Turbine blades.
Figure 2.
Grid around the profile: (a) Control volume; (b) Rotationg-region; (c) Turbine geometry; (d) Turbine blades.
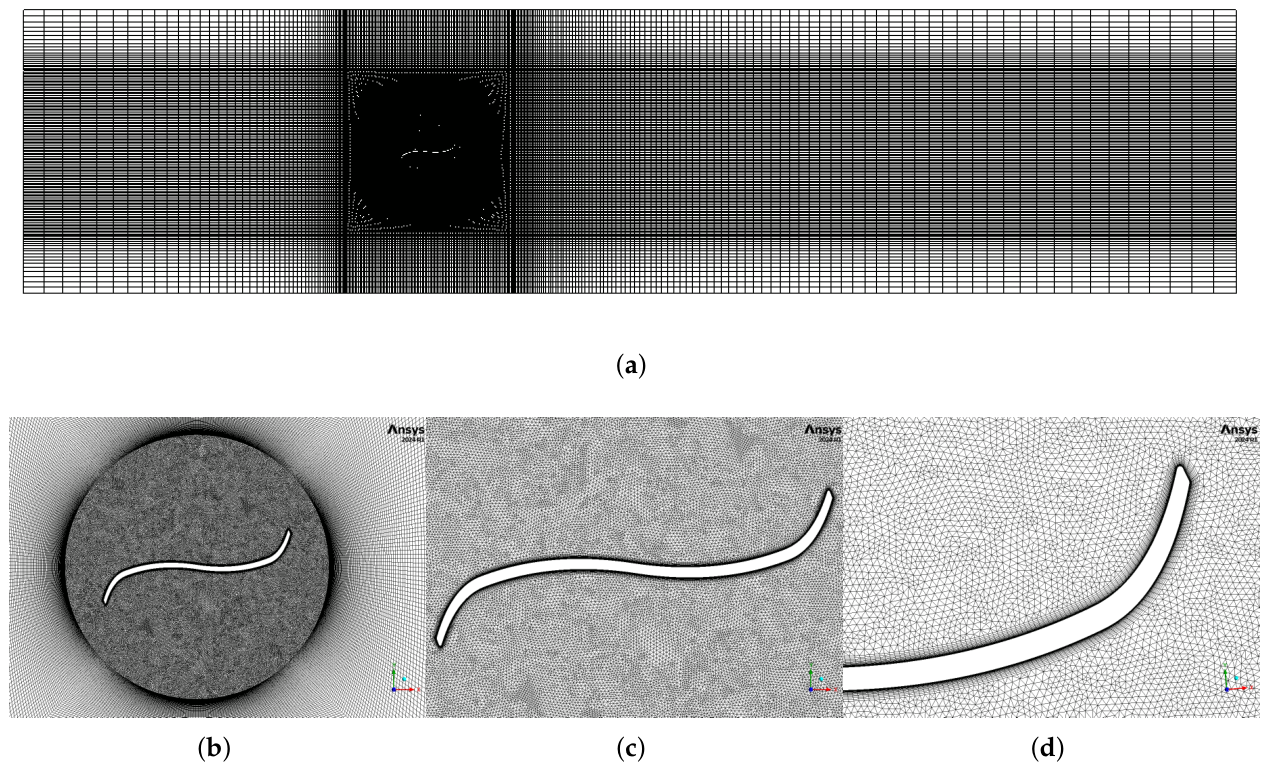
Figure 3.
Time series of the dimensionless distance to the wall ().
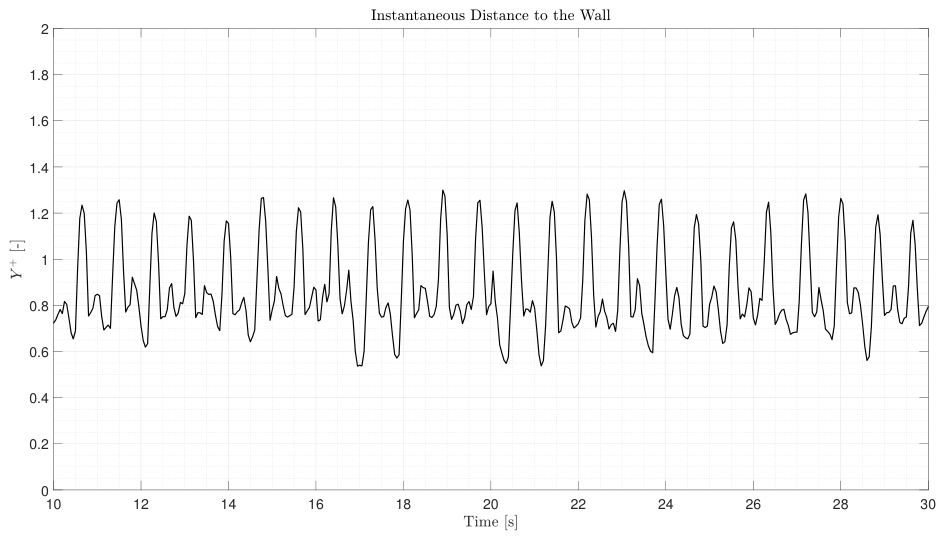
Figure 4.
CFD-based blade improvement framework adopted for the VAACT.
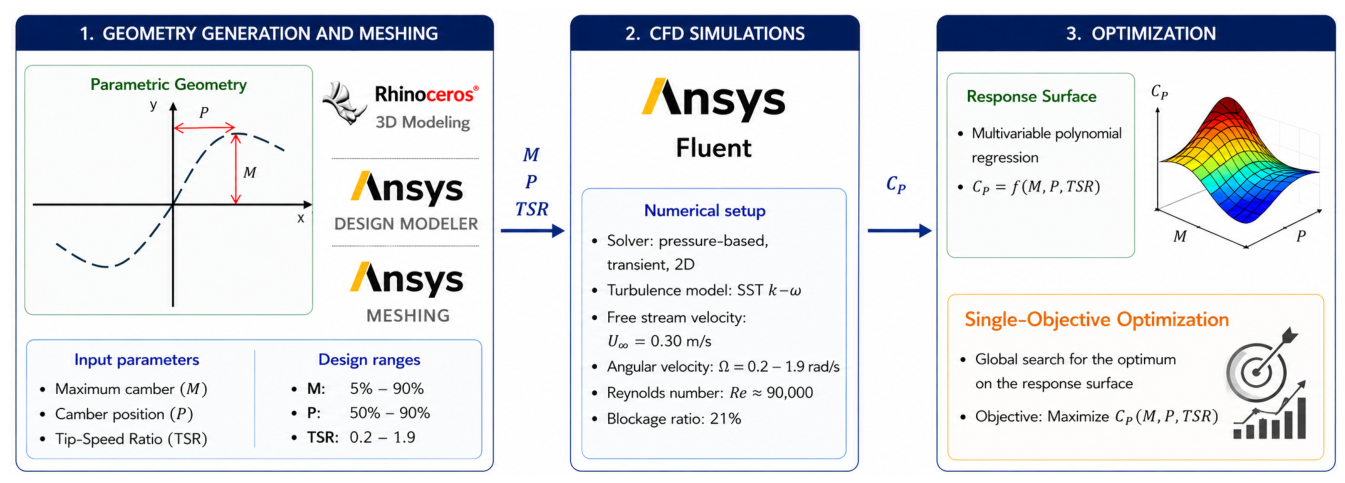
Figure 5.
Experimental setup - Tests with S-shaped VAACT at LOC-COPPE/UFRJ.
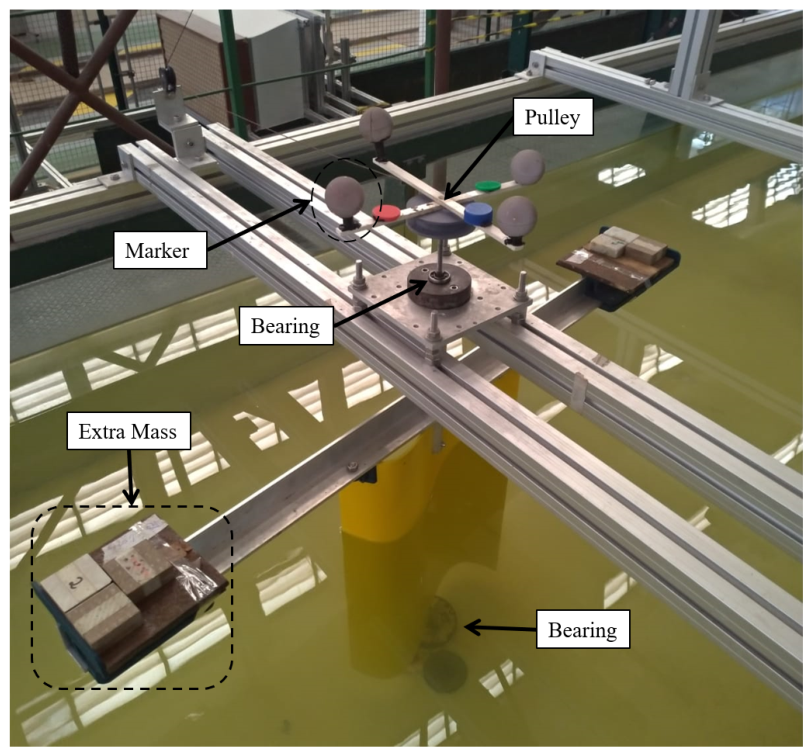
Figure 6.
Measuring devices of the test: (a) Qualisys system; (b) Acoustic Doppler Velocimeter.
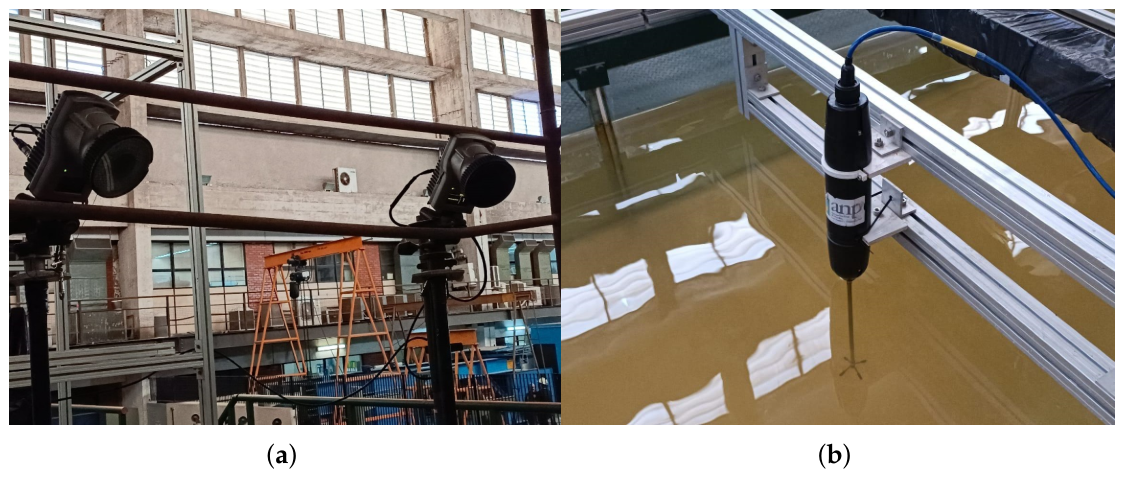
Figure 7.
Mechanical power take-off (PTO) system - Weight lifting approach.
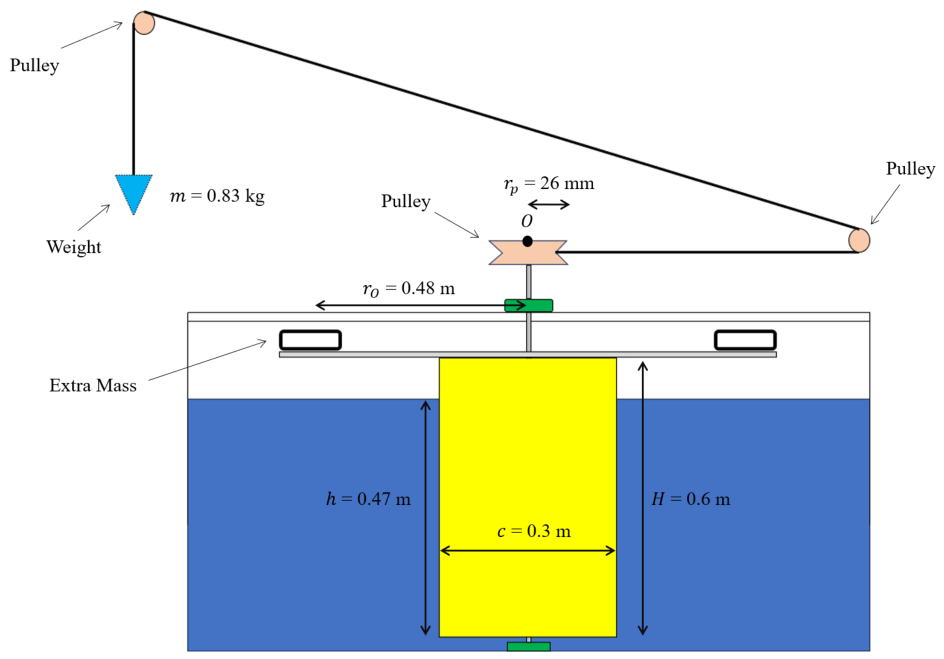
Figure 8.
Model validation - Comparison between CFD and experimental models. The error bars mean the simulation and experimental uncertainties, respectively.
Figure 8.
Model validation - Comparison between CFD and experimental models. The error bars mean the simulation and experimental uncertainties, respectively.
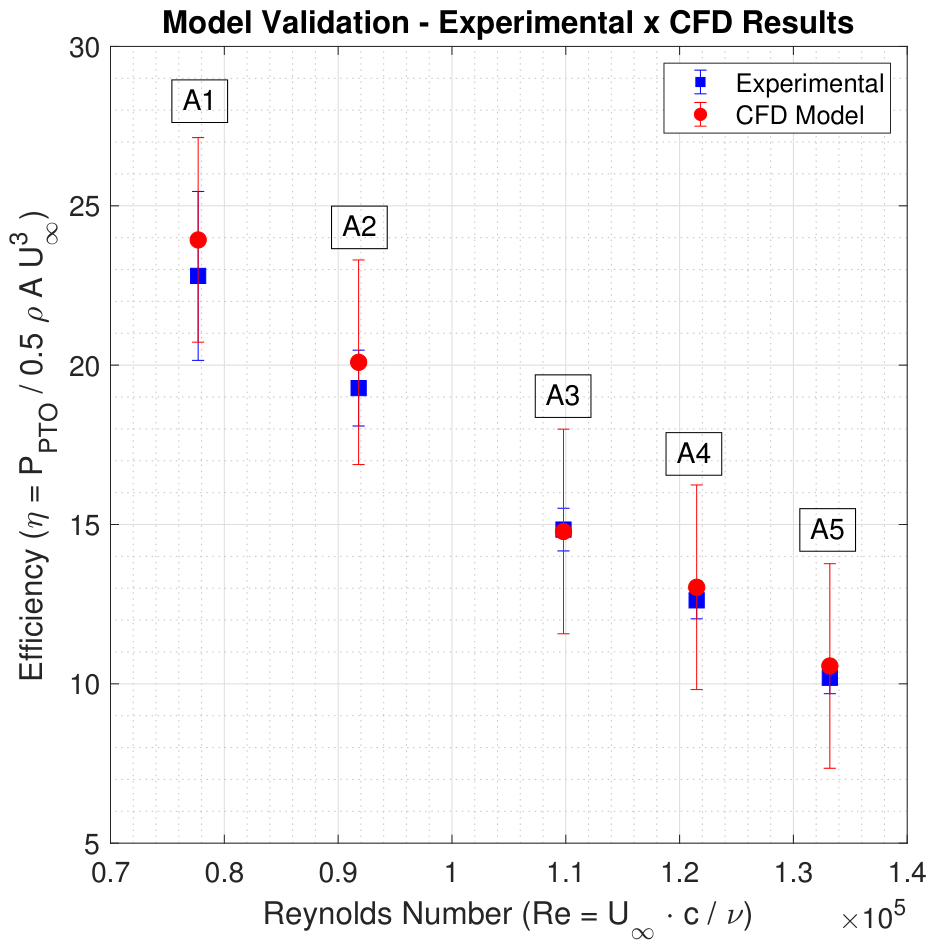
Figure 9.
Optimization generations for the blade optimization using polynomial regressions.
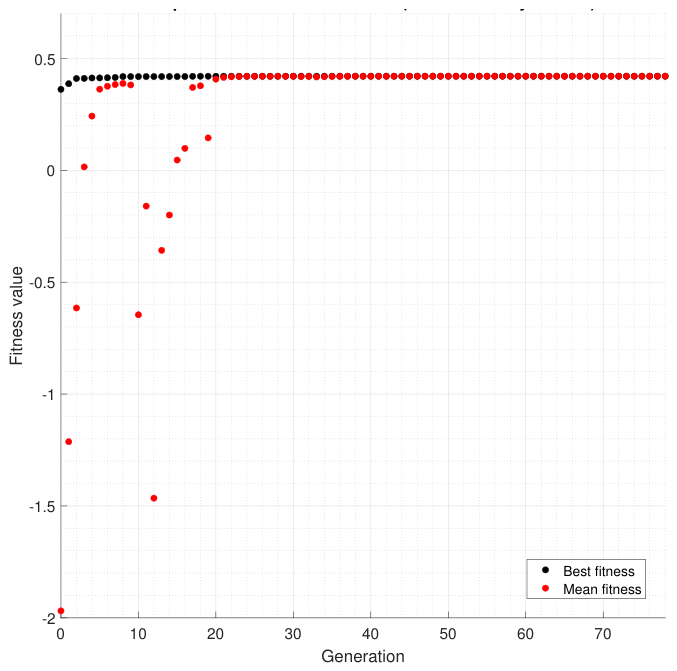
Figure 10.
Efficiency response surface obtained by CFD simulations. The red point refers to the optimum blade solution.
Figure 10.
Efficiency response surface obtained by CFD simulations. The red point refers to the optimum blade solution.
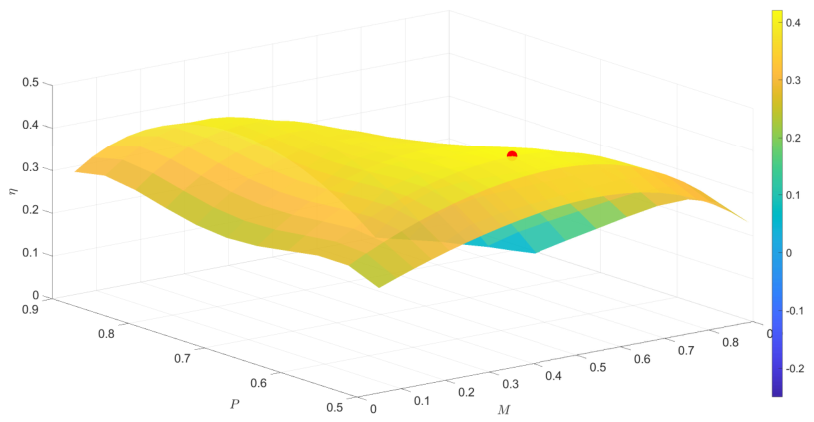
Figure 11.
Time series of hydrodynamic coefficients - S-shaped VAACT and optimized turbine model.
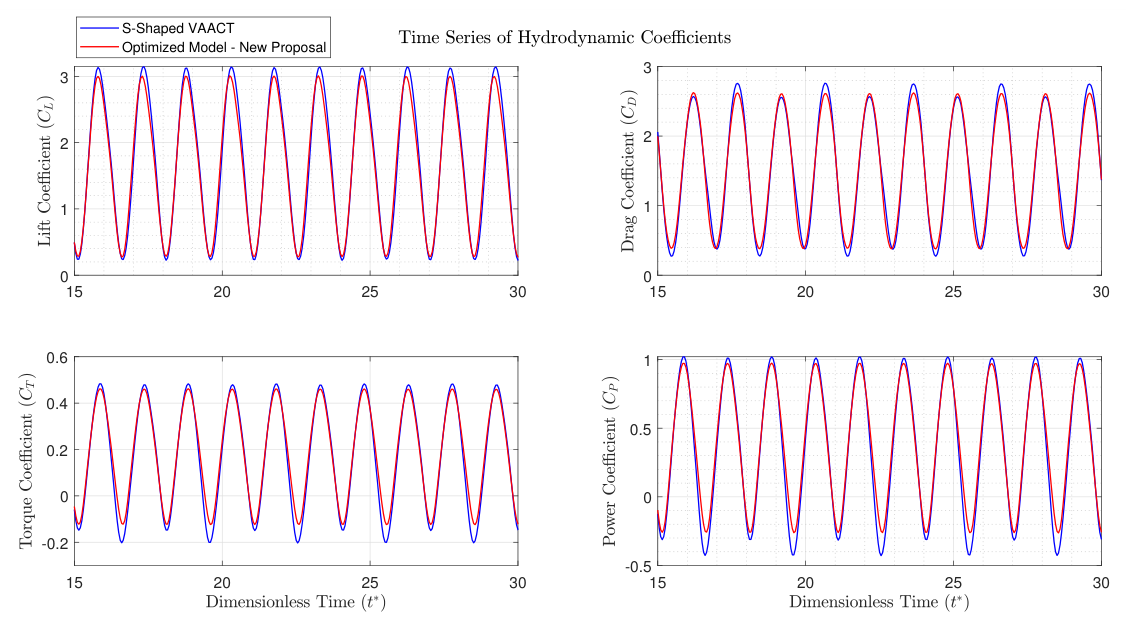
Figure 12.
Comparison of hydrodynamic coefficients from S-shaped VAACT and the optimized model proposed in this study by polar diagram.
Figure 12.
Comparison of hydrodynamic coefficients from S-shaped VAACT and the optimized model proposed in this study by polar diagram.
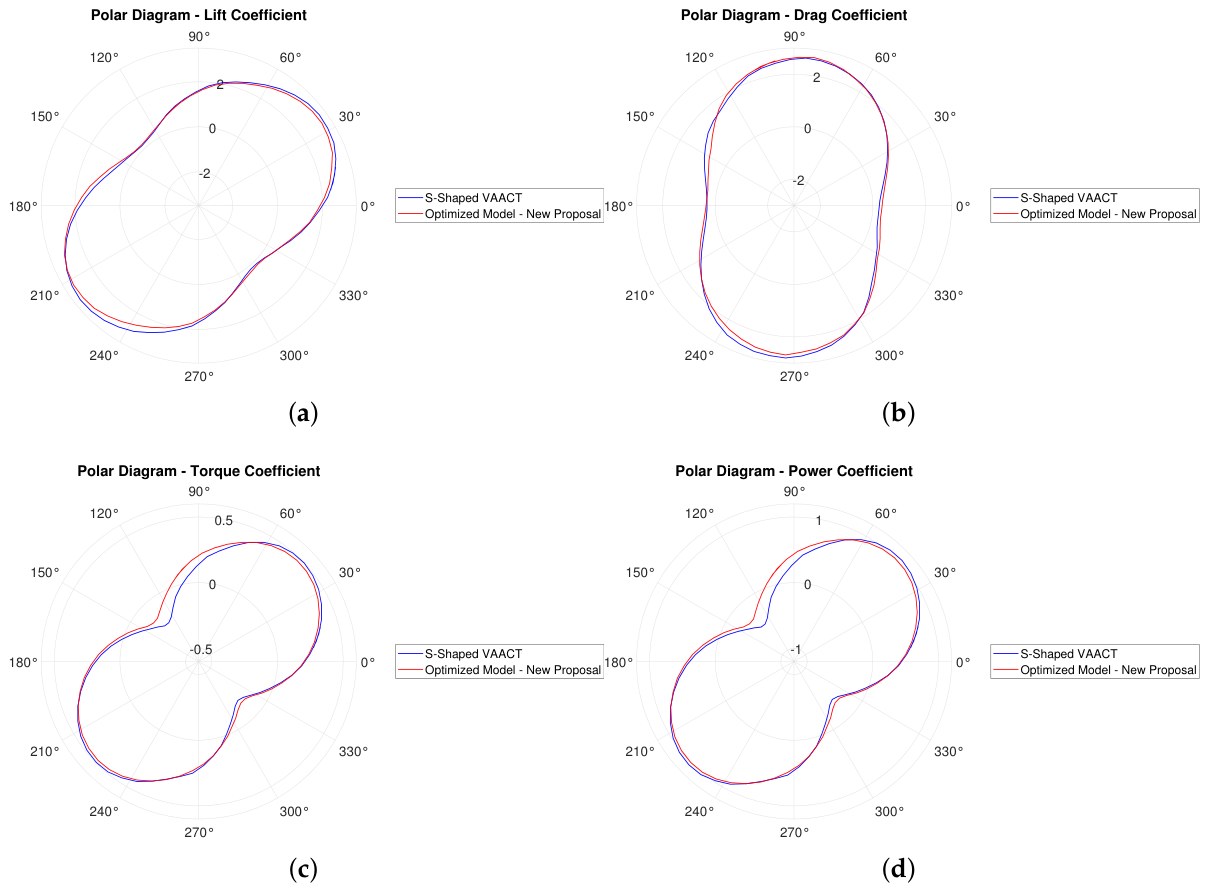
Figure 13.
Blade geometry - S-Shaped VAACT and optimized profile.
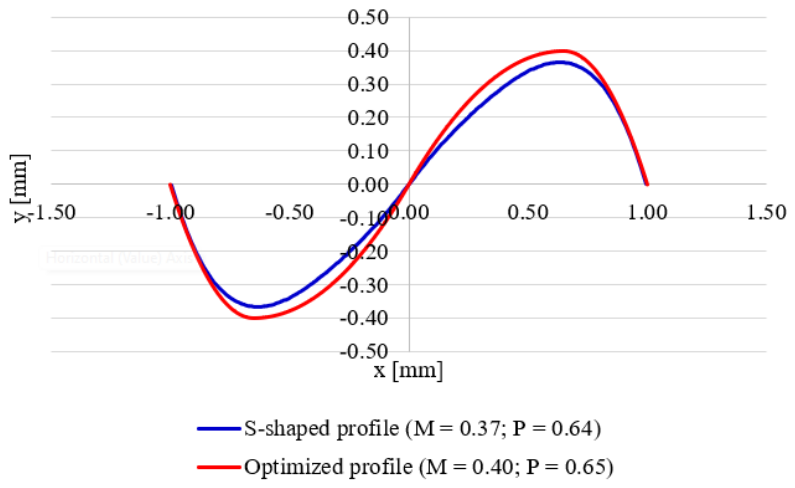
Figure 14.
Power coefficient x Tip speed ratio - S-Shaped Profile x Optimized Profile.
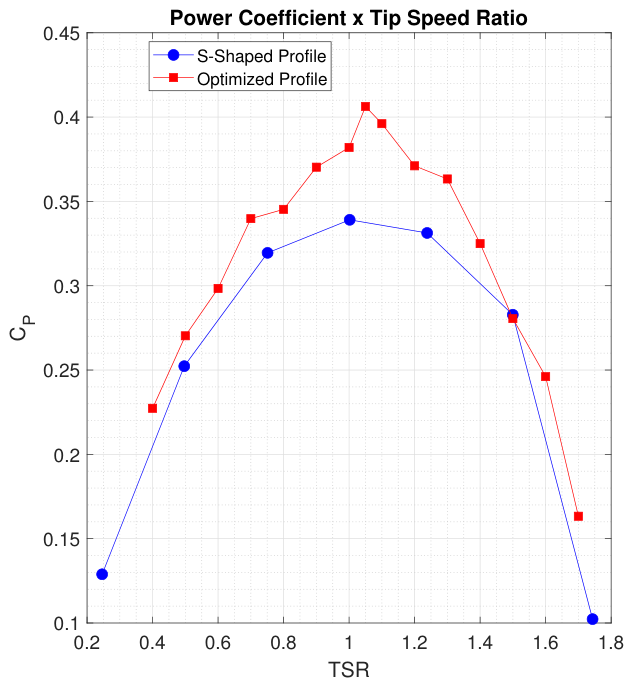
Figure 15.
Analysis of the vorticity field around the S-shaped VAACT - (a), (c), (e), (g) - and the optimized blade geometry - (b), (d), (f), (h) - for azimuth angles of , , , and , respectively.
Figure 15.
Analysis of the vorticity field around the S-shaped VAACT - (a), (c), (e), (g) - and the optimized blade geometry - (b), (d), (f), (h) - for azimuth angles of , , , and , respectively.
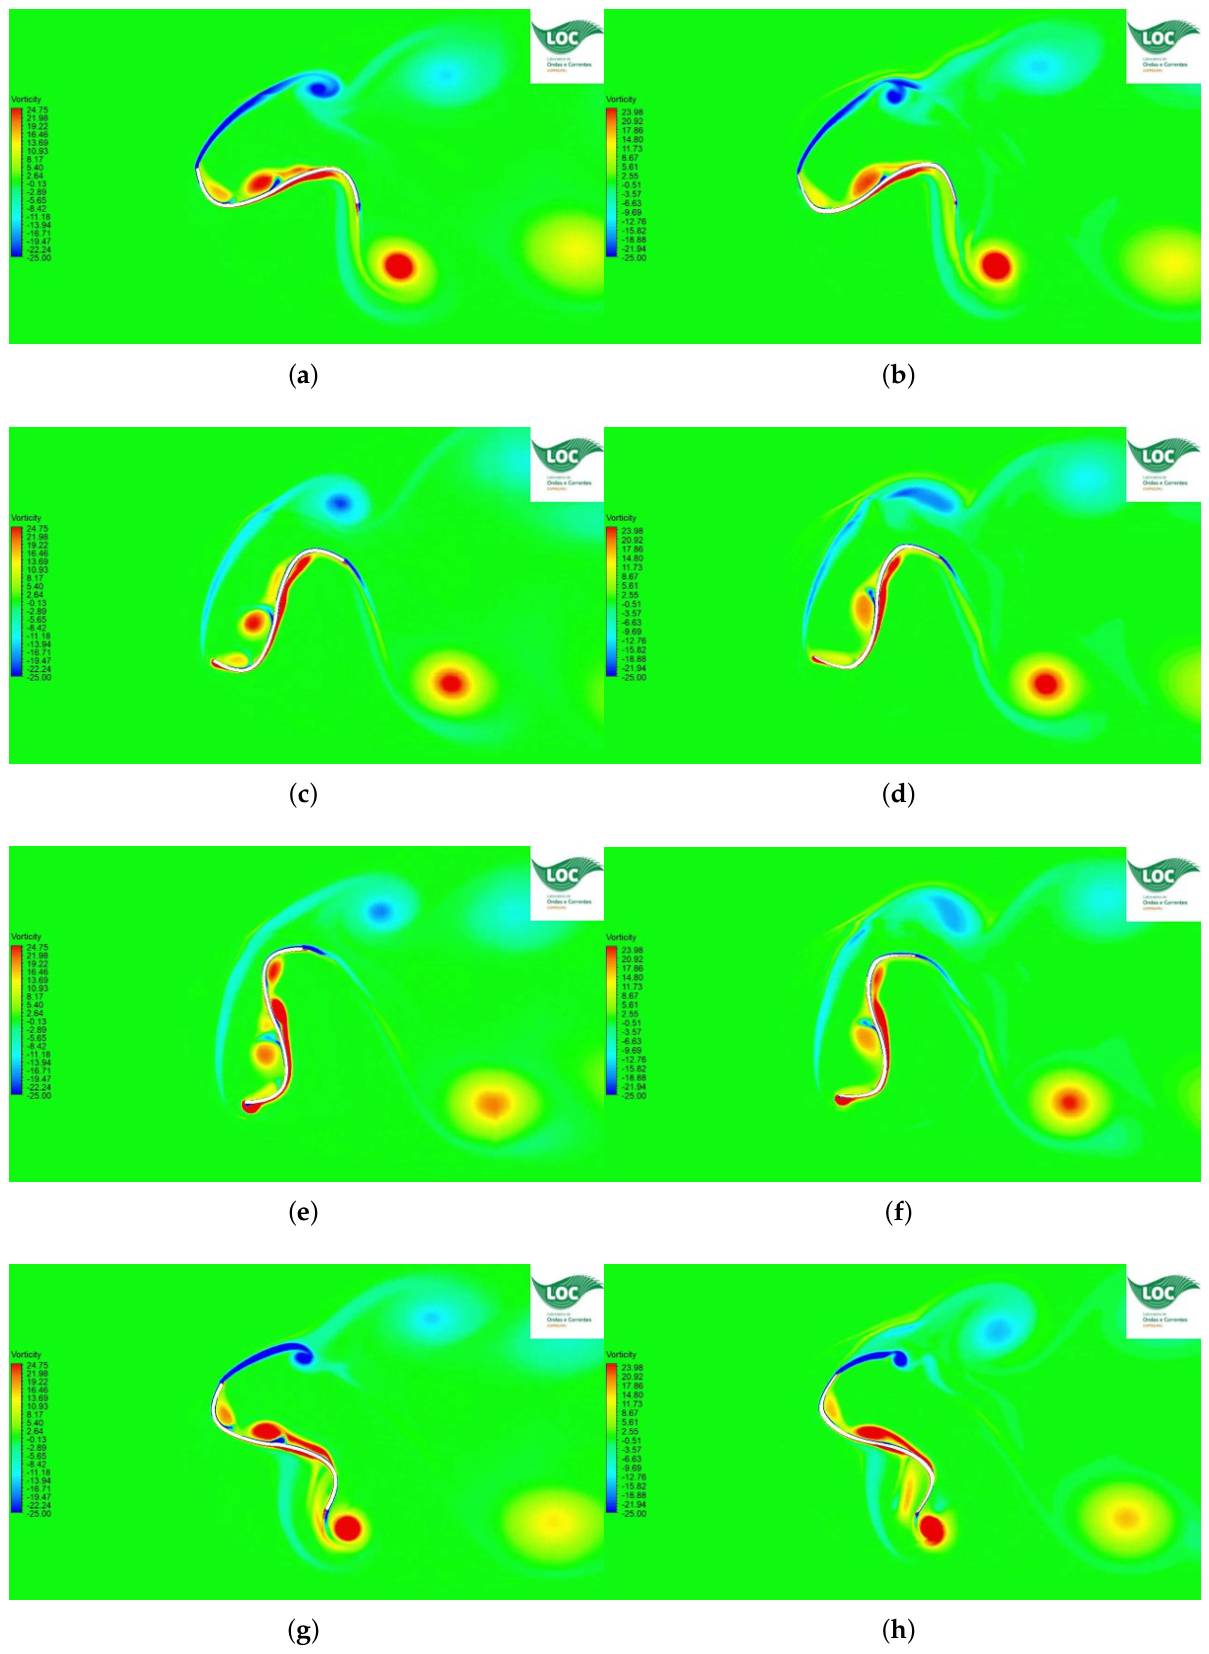
Figure 16.
Analysis of the pressure coefficient around the S-shaped VAACT - (a), (c), (e), (g) - and the optimized blade geometry - (b), (d), (f), (h) - for azimuth angles of , , , and , respectively.
Figure 16.
Analysis of the pressure coefficient around the S-shaped VAACT - (a), (c), (e), (g) - and the optimized blade geometry - (b), (d), (f), (h) - for azimuth angles of , , , and , respectively.
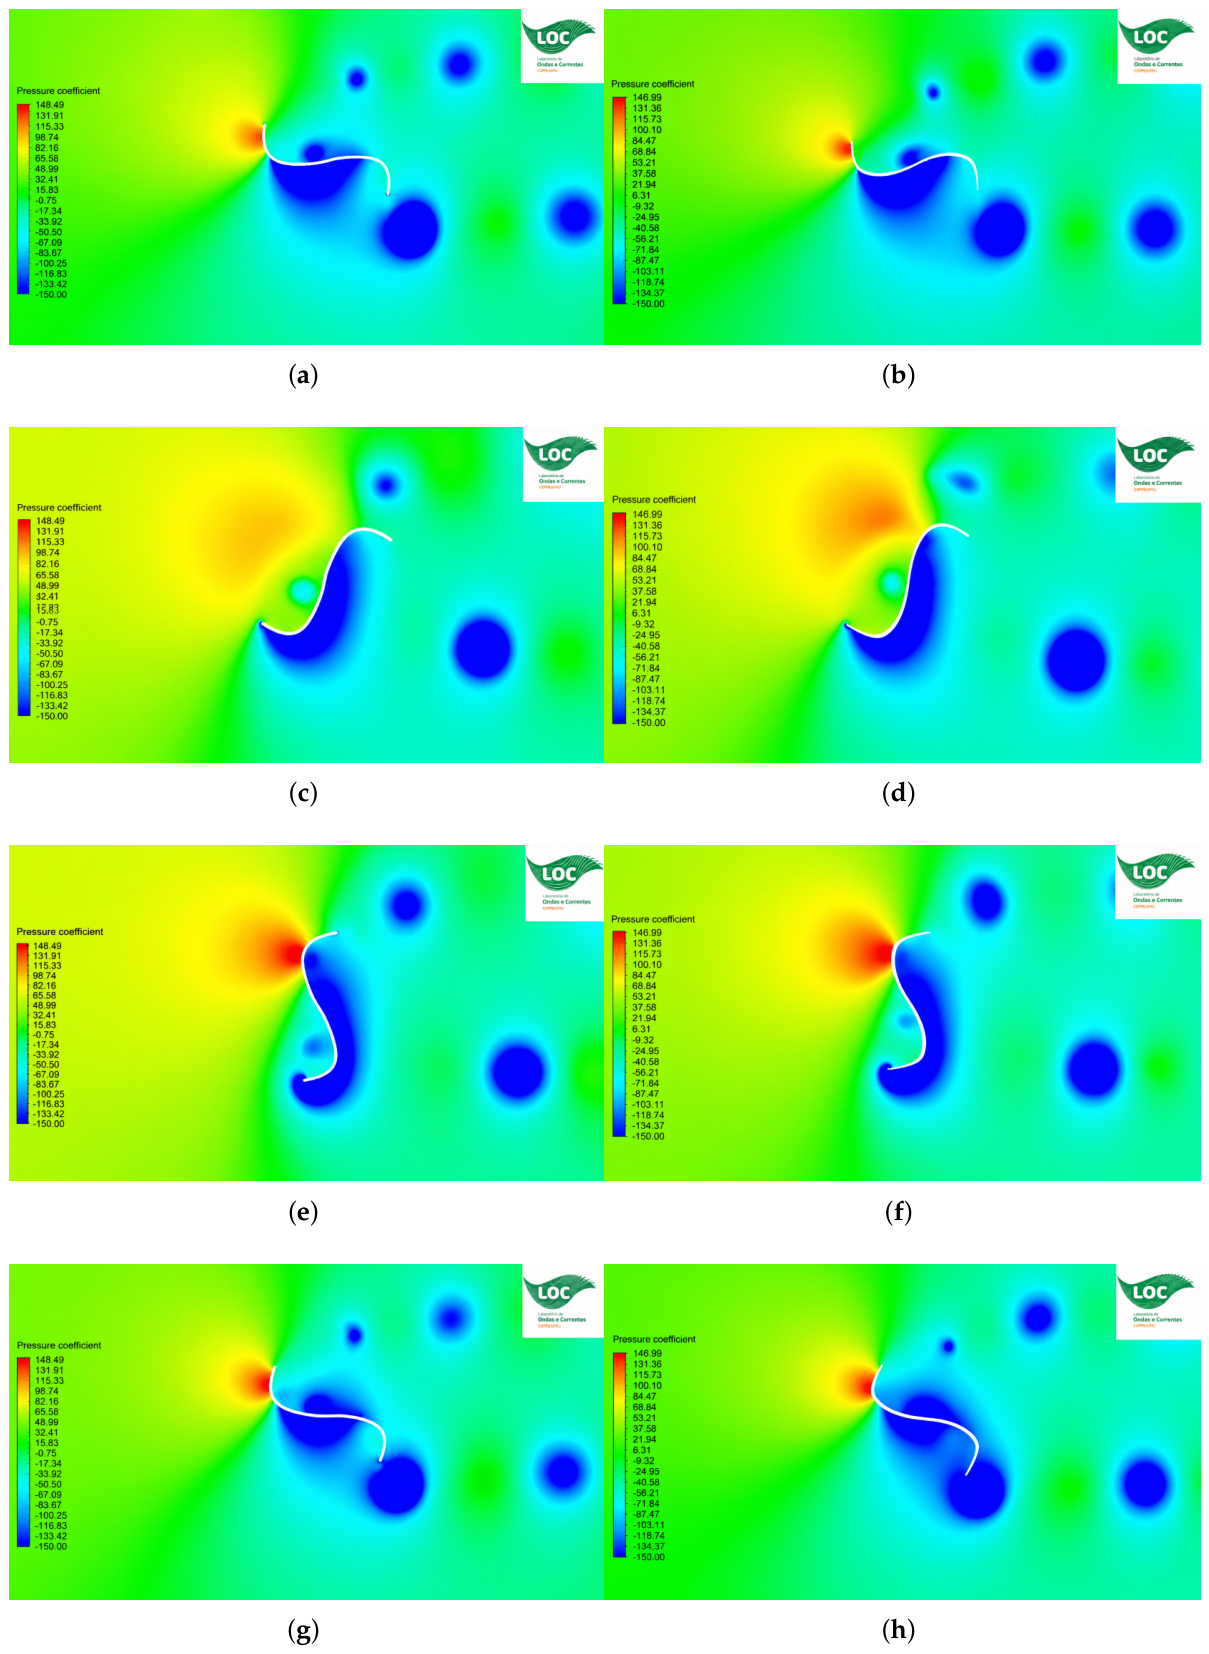
Table 1.
Recent investigation on vertical axis turbines. and values are provided by the respective authors. The subscripts 2b, 3b, 4b, and 6b mean 2-, 3-, 4-, and 6-bladed turbines
Table 1.
Recent investigation on vertical axis turbines. and values are provided by the respective authors. The subscripts 2b, 3b, 4b, and 6b mean 2-, 3-, 4-, and 6-bladed turbines
| Turbine | Ref. | Method | Operational Range | Design Point |
|---|---|---|---|---|
| Savonius | [53] | CFD |
|
|
| Hybrid | ||||
| Darrieus-Savonius | [48] | CFD |
|
|
| Savonius | [47] | CFD + Exp. |
|
|
| Savonius | [57] | CFD | - |
|
| Savonius | [55] | CFD + Exp. | - |
|
| Savonius | [45] | Exp. | - |
|
| Savonius | [46] | CFD |
|
|
| Savonius | [44] | CFD |
|
|
| Savonius | [49] | CFD | - | |
| Bach | ||||
| Savonius | [50] | CFD | - | |
| Bach | ||||
| Savonius | [43] | CFD |
|
|
| Hybrid | ||||
| Darrieus-Savonius | [54] | CFD | - |
|
| Hybrid | ||||
| Bladed-Darrieus | [52] | CFD |
|
|
| Hybrid | ||||
| Bladed-Savonius | [51] | CFD | - |
|
| Hybrid | ||||
| Darrieus-Savonius | [42] | CFD | - | - |
| Hybrid | ||||
| Darrieus-Savonius | [56] | CFD |
|
|
| Savonius | [40] | CFD |
|
|
| Savonius | [39] | Exp. |
|
|
| Savonius | [41] | CFD | - | - |
| Savonius | [38] | CFD + Exp. | - | - |
Table 2.
Control volume dimensions in the turbine shape parameterization study.
| Parameter | Symbol | Value |
|---|---|---|
| Upstream Length | 1.50 m | |
| Downstream Length | 3.00 m | |
| Control Volume Width | W | 1.40 m |
| Rotation Region Diameter | 0.35 m | |
| Blockage Ratio | 21% |
Table 3.
Mesh information for simulations with NACA profiles.
| Parameter | Value |
|---|---|
| Number of Nodes | 212,756 |
| Number of Elements | 135,788 |
| Wedge Mesh | 63,428 |
| Hexahedra Mesh | 72,360 |
| Maximum | 1.30 |
| Average | 0.86 |
| Minimum | 0.54 |
Table 4.
CFD simulations - Numerical schemes.
| Parameter | Description |
|---|---|
| Turbulence Model | SST k- |
| Solver | Pressure-Based |
| Time | Transient |
| 2D Space | Planar |
| Simulation Time | 40 s |
| Flow Velocity | 0.30 m/s |
| Angular Velocity | 0.2 - 1.9 rad/s |
Table 5.
Simulation matrix for the parametric analysis.
| Parameter | Symbol | Value |
|---|---|---|
| Turbine Diameter | D | 0.3 m |
| Reynolds Number | 90,000 | |
| Tip Speed Ratio | 0.2 - 1.9 | |
| Maximum Camber | M | 5% - 90% |
| Camber Position | P | 50% - 90% |
Table 6.
Domain dimensions and results - Domain sensitivity test.
| # | ||||
|---|---|---|---|---|
| 1 | 3.0 | 6.0 | 0.75 | 32.92% |
| 2 | 2.1 | 4.2 | 0.75 | 32.81% |
| 3 | 1.5 | 3.0 | 0.75 | 32.87% |
Table 7.
Grid setup and results - Grid sensitivity test.
| # | Grid | Elements | ||||
|---|---|---|---|---|---|---|
| 1 | Fine | 268,134 | 1.35 | 1.59 | 1.81 | 33.40% |
| 2 | Medium | 147,064 | 1.37 | 1.47 | 2.26 | 32.76% |
| 3 | Coarse | 77,914 | - | 1.74 | 3.27 | 31.96% |
Table 8.
Time-step size and results - Time-step sensitivity test
| # | Time-Step Size [s] | ||
|---|---|---|---|
| 1 | 0.007 | 0.75 | 32.92% |
| 2 | 0.010 | 0.75 | 32.76% |
| 3 | 0.014 | 0.75 | 32.81% |
Table 9.
Validation of the numerical model using ITTC guidelines [9].
Table 9.
Validation of the numerical model using ITTC guidelines [9].
| Case | D | S | Validated? | ||||
|---|---|---|---|---|---|---|---|
| A1 | 22.80% | 2.65% | 23.93% | 3.21% | 1.13% | 4.16% | Yes |
| A2 | 19.28% | 1.19% | 20.09% | 3.21% | 0.81% | 3.42% | Yes |
| A3 | 14.84% | 0.67% | 14.78% | 3.21% | 0.06% | 3.28% | Yes |
| A4 | 12.62% | 0.58% | 13.03% | 3.21% | 0.41% | 3.26% | Yes |
| A5 | 10.19% | 0.50% | 10.56% | 3.21% | 0.37% | 3.25% | Yes |
Table 10.
Power coefficient surface statistics.
| Parameter | Value |
|---|---|
| 0.94962 | |
| P-Value | |
| Standard Error | 0.00056 |
Table 11.
Optimal results achieved by optimization procedure. Results provided considering a blockage ratio of .
Table 11.
Optimal results achieved by optimization procedure. Results provided considering a blockage ratio of .
| Parameter | Value |
|---|---|
| M | 0.4915 |
| P | 0.5809 |
| 1.0723 | |
| 42.05% |
Table 12.
Optimal results achieved by the optimization method. Results provided considering a blockage ratio of .
Table 12.
Optimal results achieved by the optimization method. Results provided considering a blockage ratio of .
| Parameter | General | Updated |
|---|---|---|
| M limits | 0.05 - 0.90 | 0.30 - 0.40 |
| P limits | 0.50 - 0.90 | 0.65 - 0.75 |
| limits | 0.20 - 1.90 | 0.9 - 1.3 |
| M | 0.4915 | 0.4000 |
| P | 0.5809 | 0.6500 |
| 1.07 | 1.06 | |
| 42.05% | 40.37% | |
| 37.60% | 40.68% | |
| Relative error | 10.58% | -0.78% |
Table 13.
Performance of S-shaped profile and optimized profile at bounded fluid ().
| Parameter | S-Shaped Profile | Optimized Profile |
|---|---|---|
| Maximum Camber - M | 0.64 | 0.65 |
| Camber Position - P | 0.37 | 0.40 |
| Tip speed ratio - | 1.06 | 1.06 |
| Efficiency - | 33.80% | 40.68% |
Disclaimer/Publisher’s Note: The statements, opinions and data contained in all publications are solely those of the individual author(s) and contributor(s) and not of MDPI and/or the editor(s). MDPI and/or the editor(s) disclaim responsibility for any injury to people or property resulting from any ideas, methods, instructions or products referred to in the content. |
© 2026 by the authors. Licensee MDPI, Basel, Switzerland. This article is an open access article distributed under the terms and conditions of the Creative Commons Attribution (CC BY) license (http://creativecommons.org/licenses/by/4.0/).
Copyright: This open access article is published under a Creative Commons CC BY 4.0 license, which permit the free download, distribution, and reuse, provided that the author and preprint are cited in any reuse.