

Submitted:
27 August 2026
Posted:
28 August 2026
You are already at the latest version
Abstract
Molecular symmetry governs numerous physical and chemical properties, but its statistical distribution across biological molecular systems remains insufficiently explored. We compare the symmetry landscape of biological molecules with that previously established for molecules constituting the TMC-1, Orion KL, and IRC+10216 molecular clouds. The comparison reveals a pronounced contrast: symmetry dominates among molecules detected in molecular clouds, whereas asymmetry dominates among biological molecules. Interstellar and circumstellar molecular corpora are rich in linear, axially symmetric, and mirror-symmetric species, while biological corpora are dominated by the asymmetric point group C1. Exact molecular point groups and symmetry elements were analyzed for a 50-molecule biological pilot corpus, normal human plasma, normal human urine, and the principal molecular constituents of poliovirus. Species- and concentration-weighted point-group probabilities, were considered, and their diversity was quantified using the Shannon entropy, normalized Shannon entropy, and Simpson diversity number D2. The predominance of C1 in biological systems reflects the extensive use of chiral building blocks, stereogenic centers, and chemically nonequivalent functional groups required for molecular recognition and biochemical specificity. Concentration weighting modifies but does not universally reverse this tendency: normal human plasma remains predominantly asymmetric, whereas normal urine becomes abundance-dominated by C2v symmetry because of the exceptionally high concentration of urea. Poliovirus represents the limiting molecular case: all principal chemically defined constituents: VP1, VP2, VP3, VP4, VPg, and genomic RNA belong to C1, yielding zero point-group entropy and D2=1. Nevertheless, repeated asymmetric capsid proteins self-assemble into a shell possessing approximate proper icosahedral symmetry. Thus, the transition from cosmic molecular matter to biological molecular organization is accompanied by extensive molecular symmetry breaking, while high symmetry may re-emerge at the supramolecular level through the ordered assembly of asymmetric components.
Keywords:
symmetry
; biological molecules
; human plasma
; human urine
; poliovirus
; asymmetry
; point group
1. Introduction
Symmetry is one of the basic concepts of physics and chemistry [1,2,3,4]. Molecular symmetry, conventionally described by point-group theory, determines the equivalence of atomic positions, constrains molecular orbitals and normal vibrational modes, governs spectroscopic selection rules, and influences electric and magnetic properties [5,6,7]. The relevant symmetry operations include the identity operation, proper rotations, reflections, inversion, and improper rotations. Their combinations provide a rigorous classification of molecular structures and establish a natural bridge between molecular geometry and measurable physical properties.
The role of symmetry in chemistry is nevertheless dual [8]. High symmetry may reflect structural simplicity, equivalent bonding environments, and efficient geometrical organization. Conversely, the breaking of symmetry increases the number of distinguishable atomic positions and can generate polarity, chirality, chemical selectivity, and functional differentiation. Symmetry and asymmetry should therefore not be regarded as mutually exclusive measures of molecular organization. Rather, they represent complementary structural principles whose relative importance may change between different chemical environments [5,6,7,8].
Role and origine of symmetry in biology are much less clear [9,10,11,12,13,14,15]. Symmetry appears on different levels of organization of biological systems, starting from biomolecules [13] up to the symmetry of entire organisms [14,15,16]. In this paper we systematically address symmetry of biomolecules [13]. We pose the following question: what symmetry operations and symmetry groups prevail within biomolecules? We compare the results to the symmetry of molecules constituting molecular clouds, which was addressed in our recent paper [17]. Actually, our paper continues this investigation started recently [17]. We address the fundamental question: what is the difference in the symmetry of molecules constituting the molecular clouds and biological tissues?
Molecular clouds provide a particularly suitable natural laboratory for studying molecular symmetry. More than 250 molecular species have been identified in interstellar and circumstellar environments, including stable neutral molecules, ions, radicals, carbon chains, rings, and increasingly complex organic compounds [18,19,20,21,22,23,24,25]. These molecules form and survive under conditions that differ radically from those encountered in terrestrial laboratories: extremely low densities, weak intermolecular interactions, intense radiation fields in some regions, and temperatures ranging from approximately 10 K in cold dark clouds to several hundred kelvin in hot molecular cores and inner circumstellar envelopes [18,19,20,21,22,23,24,25]. In our study each molecular carrier was assigned a point group using an equilibrium-structure, species-level convention [17]. We revealed that the resulting symmetry distributions are strongly uneven: a small number of symmetry classes and, in particular, reflection and proper axial symmetry dominate all three molecular corpora [17].
Biological chemistry provides a conceptually important counterpart. Living systems are highly organized, but their constituent small molecules are frequently asymmetric. Amino acids, carbohydrates, nucleosides, metabolites, vitamins, and cofactors commonly contain stereogenic centers and nonequivalent functional groups. A chiral molecular structure cannot possess a mirror plane, an inversion center, or an improper rotation axis. The homochirality of terrestrial life—expressed most prominently by the predominance of (L)-amino acids and (D)-sugars—therefore imposes a fundamental geometrical restriction on the symmetry classes accessible to biological molecules [26,27,28,29,30,31,32].
Chirality is essential to molecular recognition and biochemical specificity [26,27,28,29,30,31,32]. Enzymes, receptors, transport proteins, and nucleic acids distinguish between molecular configurations that would be equivalent in an achiral environment. The classical lock-and-key concept and its subsequent development into the induced-fit model emphasize the geometrical complementarity required for selective biological interactions. Molecular asymmetry consequently increases the number of distinguishable orientations and interaction patterns available to biological systems. This structural differentiation is indispensable for catalysis, regulation, information transfer, and the construction of organized reaction networks [26,27,28,29,30,31,32]. Regardless of the mechanism responsible for selecting one handedness, the resulting homochirality represents a profound breaking of mirror symmetry. It is therefore reasonable to ask whether the progression from interstellar chemistry through prebiotic chemistry to biological chemistry is accompanied by a systematic transformation of the molecular symmetry landscape.
This question requires a distinction between geometrical symmetry and statistical diversity. The symmetry of an individual molecule is described by its point group and by the presence or absence of particular symmetry elements. A molecular population, however, can also be characterized by the distribution of its members among symmetry classes. Species-weighted statistics describe molecular diversity, whereas abundance-weighted statistics describe the relative contribution of different structures to the material composition of the system. These two descriptions need not coincide: a chemically diverse population may contain many asymmetric species but remain abundance-dominated by one or several highly symmetric molecules.
The principal objective is to determine whether the transition from cosmic molecular chemistry to biological molecular chemistry is associated with a measurable change from symmetry-rich to asymmetry-rich molecular populations. The analysis tests the hypothesis that comparatively simple cosmic environments preferentially contain linear, planar, mirror-symmetric, and axially symmetric molecular structures, whereas biological functionality is associated with extensive molecular symmetry breaking, chirality, and configurational differentiation. This approach establishes molecular symmetry as a quantitative comparative descriptor and may contribute to a more general understanding of the structural transition from nonliving chemical matter to biologically organized molecular systems.
The paper is organized as follows. Section 2 describes the molecular corpora, symmetry-classification conventions, and statistical methods used in the analysis. Section 3 presents the symmetry distributions of the 50-molecule biological pilot corpus, normal human plasma, normal human urine, and poliovirus; introduces the Shannon and Simpson diversity measures; and discusses the relationship between complete molecular asymmetry and three-dimensional structure. Section 4 compares the symmetry landscapes of cosmic and biological molecules and discusses the transition from molecular symmetry to biological asymmetry, including the re-emergence of symmetry at the supramolecular level. Section 5 summarizes the principal conclusions. Detailed molecular compositions, point-group assignments, and concentration data are provided in the Appendices.
2. Methods
Four complementary biological systems were examined: a pilot corpus of 50 biologically relevant small molecules, normal human plasma, normal human urine, and poliovirus. Each molecular species was assigned a point group using its idealized isolated equilibrium or representative low-energy structure. Conformers were not counted separately, neutral canonical structures were used where appropriate, and the identity operation was not treated as a distinguishing symmetry element. The presence of mirror planes, proper rotational axes, inversion centers, and improper rotational axes was recorded for every species [5,6].
The general biological corpus contained 20 proteinogenic amino acids, 5 nucleobases, 5 carbohydrates, 10 central or related metabolites, and 10 vitamins/cofactors. Species-weighted prevalence was calculated as the fraction of molecules possessing a given point group or symmetry-element type.
For normal human plasma, molar concentrations were obtained from NIST SRM 1950 and the associated SRM1950-DB compilation [33,34,35,36]. Exact concentration matches were available for 36 of the 50 pilot molecules; unmatched compounds were excluded rather than assigned zero concentration. For urine, a separate corpus of 50 common organic metabolites was assembled, excluding water and inorganic ions [36,37]. Representative normal urinary concentrations were used [36,37]. Concentration-weighted symmetry fractions were calculated by dividing the summed concentration of molecules belonging to a given symmetry class by the total concentration represented in the corresponding corpus.
The viral analysis used poliovirus as an illustrative hierarchical case [38,39]. Symmetry was evaluated separately for its RNA genome, VPg, individual capsid proteins, protomers, pentamers, and the assembled capsid. Exact molecular symmetry was distinguished from approximate supramolecular symmetry inferred from the idealized capsid architecture [38,39]. For functional comparison, genomic RNA and VPg were counted separately as chemically distinguishable viral components, although they occur in the mature virion as a covalently linked VPg–RNA conjugate. Treating the conjugate as a single molecular species would not change the symmetry distribution because VPg, RNA, and the conjugate all belong to . The resulting biological distributions were compared with the molecular-cloud data obtained previously using the same species-level symmetry convention.
3. Results
3.1. Study of the Symmetry of the Biological Molecules Forming the Pilot Molecular Corpus
In our recent paper we investigated the symmetry of molecules constituting the molecular clouds. We reported the striking prevalence of the molecules possessing the mirror symmetry and linear molecules. Now we address the symmetry of the biological molecules. The pilot corpus, supplied in Appendix A, contains 50 canonical endogenous or biologically relevant small molecules: 20 proteinogenic amino acids, 5 nucleobases, 5 common carbohydrates, 10 central or related metabolites, and 10 vitamins/cofactors. Exact molecular symmetry is considered. For flexible molecules, the point-group assignment refers to an idealized isolated equilibrium/low-energy structure and should ultimately be verified by a standardized quantum-chemical geometry optimization. Configurational chirality provides a robust constraint: a chiral molecular structure cannot possess a mirror plane, an inversion centre, or an improper rotation axis:
To retain direct comparability with the molecular-cloud analysis, we define an indicator variable for symmetry-element type α: Let be an indicator that equals unity if molecule i possesses a symmetry-element type and zero otherwise:
Here , where is the total number of molecular species in the analysed biological corpus. The index α denotes a symmetry-element type, such as a mirror plane , a proper rotational axis , a linear axis , an inversion centre i, or a finite improper rotational axis . The indicator records only the presence or absence of a specified symmetry-element type. Thus, each molecular species is counted only once for a given α, irrespective of how many geometrically distinct elements or symmetry operations of that type it possesses. The number of biological molecular species possessing symmetry-element type α is:
where k, is the total number of distinct molecular species included in the analysed biological corpus, and the corresponding species prevalence is:
Thus, represents the fraction of molecular species in the given biological corpus possessing symmetry-element type α. Both and are dimensionless.
Now address the symmetry distribution in the pilot corpus of biological molecules supplied in Table 1. Table 1 represents distribution of the molecules of the pilot class according to the point symmetry groups. The dominant class in this pilot biological corpus is C1: approximately 70% of the molecules have no nontrivial exact spatial symmetry under the adopted assignments. Thus, the fraction of this symmetry group in the entire pilot corpus is:
This 50-molecule pilot strongly supports the hypothesis that the symmetry landscape of small biological molecules differs qualitatively from that of the studied molecular-cloud species. The dominant biological point group is , while mirror symmetry is substantially reduced. Biological chirality supplies a direct structural mechanism for this suppression. The contrast has a natural stereochemical origin. The astronomical samples are rich in linear, planar, or otherwise relatively simple achiral molecules. Biological chemistry, by contrast, makes extensive use of stereogenic centers and homochiral molecular building blocks. This drives many small biological molecules toward and suppresses exact improper symmetries. Fifteen of the 50 pilot molecules possess a mirror plane, thus Thus the preliminary mirror-symmetry prevalence is 30%. This contrasts strongly with the molecular-cloud corpora previously analysed under the equilibrium species-level convention, for which mirror-plane prevalence was 100%. Five of the 50 molecules in the pilot classification possess a nontrivial proper rotational axis, thus, . Two pilot molecules, oxalic acid and fumaric acid, are assigned an inversion centre: The molecular prevalences of symmetry operations is summarized in Table 2. It should be emphasized that the pilot molecular corpus does not represent any biological tissue or object.
The natural next step is the study of symmetry of biological molecules constituting specific biological tissues.
3.2. Abundance-Weighted Symmetry Analysis of Normal Human Plasma
Now we address the symmetry of molecules constituting normal human plasma. Concentrations were taken from the NIST SRM 1950 normal human plasma reference material and the associated SRM1950-DB quantitative compilation. SRM 1950 represents pooled fasting plasma from 100 adults, with equal numbers of men and women aged approximately 40–50 years. The database combines validated NMR, LC-MS/MS, DI-MS/MS and related quantitative measurements. The raw data is supplied in Appendix B, Table A2.
Direct concentration matches were obtained for 36 of the original 50 pilot molecules. Molecules lacking an exact, defensible match were excluded from the denominator rather than assigned zero concentration. The 14 unquantified molecules were: Guanine and thymine; D-ribose, D-fructose and D-galactose; Oxalic acid and maleic acid; Biotin, NAD+, FAD, coenzyme A, tetrahydrofolate, S-adenosyl-L-methionine and R-lipoic acid. The last group consists predominantly of intracellular cofactors and is therefore expected to be poorly represented in cell-free plasma. The amino-acid values are reported by SRM1950-DB with generally high reliability. For point group G, the concentration-weighted fraction is defined as:
where is the molar plasma concentration of species i and is the number of quantified molecules. The abundance-weighted point-group distribution is supplied in Table 3.
The distribution follows . The large contribution is almost entirely caused by urea, whose concentration alone constitutes approximately 26.02% of the analyzed concentration sum.
Now we define the abundance-weighted prevalence of the symmetry operation denoted :
The data for normal human plasma is supplied in Table 4.
Thus, approximately 69.8% of the represented molecular concentration is contributed by molecules and demonstrate no symmetry elements (except of the trivial identity symmetry element). What molecules are main contributors to the aforementioned symmetry distribution? These data are supplied in Table 5.
The six compounds listed in Table 5 contribute approximately 87% of the total concentration represented in the analyzed plasma corpus. Consequently, the abundance weighted symmetry landscape is determined primarily by glucose, urea and lactate rather than by the number of molecular species. The molecule of D-glucose is depicted in Figure 1, illustrating absence of the symmetry elements in this molecule.
The data summarized in Table 5 leads to the following conclusion: normal human plasma is dominated by molecular asymmetry. Approximately 69.8% of the concentration belongs to molecules. This strengthens the result reported in the previous Section for the pilot molecular corpus: the asymmetry dominates among biological molecules. Mirror symmetry retains an abundance prevalence of approximately 30.2% (see Table 4), but most of this value arises from urea, a single highly abundant molecule. Proper rotational symmetry increases from the original species prevalence of 10% to an abundance-weighted prevalence of 26.3%, again primarily because of urea. Inversion symmetry is quantitatively negligible because fumarate is present only at submicromolar concentration. The close agreement between the original species-weighted mirror prevalence of 30% and the abundance-weighted value of 30.23% is therefore largely coincidental. The species statistic is distributed over 15 mirror-symmetric molecules, whereas the abundance statistic is dominated by one compound.
The reported results related to SRM1950-DB primarily characterize measurements of the pooled reference material; they should not be interpreted as population-level interindividual variability.
3.3. Symmetry of Molecules Constituting Normal Human Urine
The pilot corpus comprises 50 common organic metabolites reported in normal human urine (see Appendix C). It is deliberately chemically broad and comparable in size to the earlier biological pilot analysis; it is not an unbiased slice of the several-thousand-compound urine metabolome. Water and inorganic ions are excluded. Exact molecular point symmetry is assigned to an idealized isolated equilibrium or representative low-energy structure. Neutral canonical structures are used to preserve comparability with the preceding plasma analysis. Conformers are not counted separately, and the identity operation E is not treated as a distinguishing symmetry element. Representative normal molar concentrations are used for weighting; hydration, diet, collection time, age, sex, and normalization method can substantially change urinary concentrations.
Accordingly, the abundance-weighted values below are pilot estimates of a repre-sentative normal urine composition rather than universal physiological constants. 36 molecular species listed in Table A3 belong to the point group, representing 72% of the 50-molecule corpus. The resulting species- and concentration-weighted point-group distribution is summarized in Table A3. It is clearly seen from the data supplied in the Table A3 that the asymmetric molecules dominate between the molecules constituting the human urine.
The situation changes dramatically when concentration-weighted point-group distribution is addressed as demonstrated in Table 6.
The sole C2ᵥ molecule is urea. Although it represents only 2% of the selected species, its representative concentration of 250 mmol L−1 gives it approximately 92% of the total organic-molecule concentration represented by the corpus.
The abundance-weighted prevalences, supplied in Table 7 are not mutually exclusive: urea contributes simultaneously to the C2 and mirror-symmetry categories.
We conclude that at the species level, normal urine is dominated by C1 molecules. Many urinary metabolites are configurationally chiral, conformationally flexible, asymmetrically substituted, or produced through stereoselective enzymatic pathways. Most therefore possess no exact nontrivial point symmetry in their equilibrium conformations (see Table 6). On the other hand, at the concentration level, the picture is reversed. The represented organic abundance is dominated by small, achiral, C2ᵥ urea. Consequently, approximately 92% of the represented molecular concentration possesses a proper C2 axis, and approximately 97% possesses at least one mirror plane.
3.4. Study of Symmetry of Molecules Constituting Viruses
Viruses provide an especially revealing extension of comparative molecular-symmetry studies because they combine biological molecular composition with extraordinarily ordered supramolecular architecture. Viral proteins, finite RNA and DNA genomes, membrane lipids, and glycans are generally chiral, conformationally heterogeneous, and of exact point group . Nevertheless, repeated copies of such low-symmetry components self-assemble into capsomers, nucleocapsids, and complete particles with high proper rotational or helical symmetry. Ideal icosahedral capsids exhibit the rotational icosahedral group I, containing 60 proper rotations and distinguished twofold, threefold, and fivefold axes. Helical nucleocapsids are generated by screw operations combining rotation with axial translation. In both cases, mirror symmetry is normally excluded by molecular chirality. Viruses therefore do not occupy an intermediate position between astronomical and biological matter at the level of chemical composition; rather, they occupy an intermediate conceptual position because they restore high symmetry at a higher hierarchical level. A quantitative study should separately catalogue constituent-molecule symmetry, oligomeric symmetry, capsid symmetry, and exact whole-virion symmetry, while explicitly distinguishing idealized reconstruction symmetry from the lower symmetry of individual particles.
The investigation of symmetry of molecules constituting viruses deserves a series of extended studies. We focus on a single illustrative example of poliovirus. Poliovirus is an especially clear example of the emergence of high supramolecular symmetry from asymmetric biological molecules. Every principal molecular constituent of the mature virion has exact point group , yet 240 protein molecules self-assemble into a capsid possessing approximate proper icosahedral symmetry.
Poliovirus belongs to the family Picornaviridae. It is a non-enveloped virus approximately 30 nm in diameter. Its mature virion principally contains:
- i)
- one linear positive-sense single-stranded RNA genome;
- ii)
- one small genome-linked protein, VPg, covalently attached to the RNA 5′ end;
- iii)
- 60 copies each of capsid proteins VP1, VP2, VP3 and VP4;
- iii)
- small, non-stoichiometric quantities of water, ions and possibly lipid-like pocket factors.
Type equation here.
Thus, the protein shell contains: =240 individual protein molecules. The capsid consists of 60 protomers, each containing one molecule of VP1, VP2, VP3 and VP4. The organization is described as, pseudo- icosahedral architecture [38,39,40]. Symmetry classification of the constituent molecules is supplied in Table 8.
VP1, VP2 and VP3 share a structurally related eight-stranded antiparallel β-barrel fold. However, similarity of folding does not constitute molecular symmetry. Each protein contains an asymmetric amino-acid sequence, chiral -amino acids, irregular loops and chemically different termini. Consequently, A mirror operation would transform the -amino-acid protein into an enantiomeric structure constructed from -amino acids. It therefore cannot be a symmetry operation of the original protein.
We now address poliovirus RNA. The poliovirus genome is a single positive-sense RNA molecule of approximately 7.5 kb. It is not a regular geometrical helix throughout the virion. It contains stems, loops, unpaired regions, tertiary contacts and a unique nucleotide sequence. Although short RNA regions can possess approximate local helical order, the complete finite genome has no exact rotational axis, mirror plane, inversion centre or improper rotation axis. Therefore, the covalently attached VPg protein marks one end of the genome and reinforces this asymmetry.
Now we address extremely interesting hierarchical emergence of capsid symmetry of Poliovirus. One copy each of VP1, VP2, VP3 and VP4 forms a protomer:
Because its four constituents are chemically and structurally different, an isolated protomer has:
The protomer is the asymmetric unit of the idealized icosahedral capsid. Five protomers assemble around a fivefold axis: The idealized pentamer possesses proper cyclic symmetry . Poliovirus contains 12 such pentameric assemblies: protomers. This symmetry belongs to the arrangement of five protomers, not to any individual VP1, VP2, VP3 or VP4 molecule.
The 60 protomers occupy equivalent positions under the proper rotational icosahedral group . This group contains 60 proper rotations: . Its nontrivial symmetry elements are.: i) six axes; ii) ten axes; iii) fifteen axes. The corresponding rotations comprise: 24 – type rotations, 20 -type rotations, 15 -type rotations. Together with the identity we calculate: Because the capsid is assembled from chiral proteins, the appropriate ideal group is the proper rotational group , not the full icosahedral group . Mirror reflection, inversion and improper rotations would reverse the handedness of the protein components.
In an ordinary capsid, 180 copies of the same capsid protein occupy three quasi-equivalent environments. In poliovirus, each icosahedral asymmetric unit contains three chemically different major surface proteins: . They have related β-barrel folds and occupy positions resembling the three quasi-equivalent subunits of a lattice. The shell is therefore called pseudo- , rather than a true Caspar–Klug capsid. VP4 lies mainly on the internal capsid surface. The number of major external protein molecules is , while inclusion of VP4 gives 240 capsid-protein molecules. ICTV explicitly describes this organization as , pseudo-, with 60 protomers [40]. Now compare Capsid symmetry versus whole-virion symmetry. A crucial distinction must be made, which is summarized in Table 9.
The protein shell can be represented with icosahedral symmetry, but the single packaged RNA genome cannot occupy 60 symmetry-equivalent orientations simultaneously. Applying an icosahedral rotation to the complete particle generally changes the position of the RNA sequence, its secondary structure and its interactions with the inner capsid surface. Consequently,
The approximation sign is important. Cryo-EM and crystallographic structures frequently impose or average over icosahedral symmetry. Such reconstruction symmetry accurately represents the highly repetitive capsid shell but suppresses particle-specific asymmetry associated with the RNA and heterogeneous molecular occupancy.
If the principal chemically defined constituents are counted as six molecular species—VP1, VP2, VP3, VP4, VPg and genomic RNA - all six belong to : .Therefore, for the species-weighted constituent-molecule distribution. The same conclusion is obtained by copy-number weighting. All 240 capsid-protein molecules, the VPg molecule and the RNA molecule are individually : . This result excludes water, ions and incompletely occupied small-molecule binding sites, for which a unique virion stoichiometry cannot be assigned. We conclude that Poliovirus demonstrates an extreme symmetry-emergence transition:
Thus, symmetry first emerges through the repetition and self-assembly of asymmetric proteins, reaches its maximum at the capsid level, and is reduced again when the unique RNA genome and other particle-specific details are included. This non-monotonic hierarchical progression is probably the most important symmetry characteristic of poliovirus.
3.5. Calculation of the Shannon Measure of Symmetry
Now we quantify the diversity of the symmetry in the studied biological systems with the Shannon measure of symmetry H, normalized Shannon measure of symmetry : and the Simpson diversity number supplied by Eqs. 12:
where is given by Eq. 6, and is the fixed number of point-group classes included in the common biological comparison space, namely , , , and . Classes with zero probability are retained in the distribution [41,42]. This fixed reference space permits direct comparison among all systems, including poliovirus. The calculated measures are supplied in Table 10.
The diversity measures demonstrate that the point-group distributions of the pilot biological corpus, normal human plasma, and normal human urine are strongly uneven. Their relatively low values of , , and arise principally from the prevalence of one dominant point group. In the species-weighted distributions, this dominant group is , reflecting the widespread molecular asymmetry and chirality of biological metabolites. Concentration weighting further reduces the diversity when a small number of abundant compounds dominate the material composition. This effect is especially pronounced in urine, where highly abundant urea produces the lowest nonzero entropy and values.
Poliovirus represents the limiting case. All six chemically defined constituent species—VP1, VP2, VP3, VP4, VPg, and genomic RNA—are assigned to . Therefore, whereas for every other point group. Consequently, These values must not be interpreted as indicating that the poliovirus constituents are structurally simple or highly symmetric. They express the complete absence of diversity among their point-group assignments: all constituents belong to the same asymmetric class. Thus, zero entropy describes maximal concentration of the distribution in , rather than maximal molecular symmetry.
The poliovirus result also reveals an important distinction between molecular and supramolecular symmetry. The individual viral proteins and RNA genome are asymmetric, but repeated copies of the capsid proteins assemble into a shell possessing approximate proper icosahedral symmetry. The entropy measures in the table characterize the point groups of the constituent molecules and therefore do not quantify the symmetry of their spatial arrangement within the capsid. Poliovirus consequently demonstrates a striking hierarchical emergence of symmetry: a population with and , composed entirely of asymmetric molecules, self-assembles into a highly ordered approximately icosahedral capsid. The high capsid symmetry is therefore a collective property of molecular organization rather than an inherited symmetry of the individual molecular building blocks.
3.6. Asymmetry of Biological Molecules and Dimensionality of Physical Space
Asymmetric molecules belonging to the point group dominate among the biological molecules examined in the present study. A molecule possessing symmetry contains no symmetry operation other than the identity operation, . Such complete molecular asymmetry necessarily requires a nonplanar, three-dimensional arrangement of atoms.
Indeed, every strictly planar molecule possesses a mirror plane coinciding with the plane containing its atomic nuclei, as illustrated in Figure 2. Reflection through this plane transforms the coordinate into , while all atoms of the molecule satisfy . Consequently, every atom is mapped onto itself, and the molecular plane constitutes a symmetry plane, . A strictly planar molecule therefore cannot belong to the point group; its symmetry is at least . Similarly, a strictly linear molecular structure necessarily possesses mirror planes containing its molecular axis.
These geometrical considerations establish a direct connection between complete molecular asymmetry and three-dimensional space. If the predominance of molecules in biological systems reflects a fundamental functional requirement for molecular asymmetry, then three-dimensionality may be regarded as a necessary geometrical condition for realizing the molecular architecture characteristic of terrestrial life. It should be emphasized that at the higher level of organization asymmetric molecules could be assembled int the symmetric structures. This is exactly the case of viruses, addressed in Section 3.4. This conclusion should nevertheless be understood as a hypothesis concerning the role of molecular asymmetry in living systems, rather than as a general proof that all conceivable one- or two-dimensional forms of life are impossible.
4. Discussion
4.1. From Cosmic Molecular Symmetry to Biological Asymmetry
The comparison reveals a pronounced difference between the symmetry landscapes of molecules detected in molecular clouds and those occurring in biological systems. The molecular inventories of TMC-1, Orion KL, and IRC+10216 are strongly dominated by structurally symmetric species. Under the adopted equilibrium-structure convention, all molecules included in the three astronomical corpora possess at least one mirror plane. Moreover, molecules possessing a nontrivial proper rotational axis constitute 65.3% of the TMC-1 corpus, 79.5% of the Orion KL corpus, and 95.7% of the IRC+10216 corpus. Linear C∞v molecules alone account for 44.0%, 51.3%, and 78.3% of the respective molecular inventories.
The biological corpus displays the opposite tendency. Most small biological molecules belong to the C1 point group and therefore possess no symmetry element other than the identity operation. This category contains many amino acids, carbohydrates, metabolites, vitamins, and cofactors. Even molecules that appear approximately symmetric in two-dimensional structural formulae frequently become exactly asymmetric when their three-dimensional configurations, conformations, substituent orientations, and stereogenic centres are considered. Thus, the transition from interstellar chemistry to biological chemistry is accompanied by a transition from a symmetry-rich molecular population to one dominated by exact molecular asymmetry. The presented finding supports the idea that asymmetry is a crucial feature of living systems [43].
This contrast is particularly evident for mirror symmetry. Mirror symmetry is universal in the three analysed molecular-cloud corpora, whereas it is excluded for every chiral molecular structure. Biological chemistry is inherently stereochemical: amino acids, sugars, nucleosides, and numerous metabolites contain one or more stereogenic centres. A chiral molecule cannot possess a mirror plane, an inversion centre, or an improper rotation axis. Consequently, the homochirality of terrestrial biology necessarily suppresses several major classes of molecular symmetry. The predominance of L-amino acids and D-sugars is therefore not merely a chemical peculiarity of living matter; it is a fundamental restriction on its accessible symmetry landscape.
The observed distinction can be understood partly from the different chemical compositions of the two environments. Molecular-cloud inventories contain many small linear chains, radicals, highly unsaturated molecules, symmetric rotors, and relatively simple planar species. Linear molecular backbones naturally generate symmetry, while equivalent terminal atoms or substituents frequently produce C2v, C3v, or related point groups. By contrast, biological molecules are generally larger, more heavily substituted, conformationally flexible, and chemically heterogeneous. The attachment of non-equivalent functional groups to a carbon skeleton progressively destroys rotational axes and mirror planes. Molecular complexity therefore tends to reduce exact point symmetry, even when an approximate geometrical pattern remains visually recognizable.
The difference may also reflect distinct forms of chemical selection. Interstellar molecules are selected principally by energetic stability, kinetic accessibility, reaction pathways under rarefied conditions, and observational detectability. Radioastronomical surveys preferentially detect molecules possessing a permanent electric dipole moment, and this introduces an important selection effect. Nevertheless, the persistence of mirror and axial symmetry across three physically different astronomical environments suggests that the result cannot be attributed solely to a single cloud or observational survey.
Biological molecules are subject to a different selection regime. Their structures are shaped by molecular recognition, enzyme specificity, information storage, catalysis, membrane organization, and regulated reaction networks. These functions frequently require the discrimination of one molecular orientation from another. Exact symmetry may reduce the number of chemically distinguishable binding orientations, whereas asymmetry and chirality provide greater structural specificity. A chiral active site, for example, can distinguish between enantiomers that possess identical scalar physical properties in an achiral environment. Molecular asymmetry therefore supplies biological systems with an enlarged vocabulary for selective recognition and functional differentiation.
The result suggests a broader evolutionary interpretation. Simple symmetry may be favoured during the formation and survival of relatively small molecules in non-living cosmic environments. Biological evolution, however, does not merely preserve chemically stable structures; it selects structures capable of participating in highly specific networks of interactions. The breaking of molecular symmetry may consequently represent an important structural step in the transition from comparatively simple cosmic chemistry to functionally organized biological matter. In this sense, biological complexity is associated not with the disappearance of organization, but with the replacement of exact geometrical symmetry by relational, hierarchical, and functional organization.
The comparison also demonstrates why species-weighted and abundance-weighted descriptions must be distinguished. Species-weighted biological corpora are generally dominated by asymmetric molecules because most distinct metabolites possess low point symmetry. However, an abundance-weighted distribution may be controlled by a small number of highly concentrated symmetric compounds. The urine pilot analysis provides a striking example: 72% of the molecular species belong to C1, but concentration weighting is dominated by C2v urea, which contributes approximately 92% of the total concentration represented in the selected corpus. Thus, a biological fluid may be asymmetric in terms of molecular diversity while appearing strongly symmetric in terms of molecular abundance.
Shannon entropy of the point-group distribution provides a useful measure of the diversity of symmetry classes, but it should not be interpreted as a direct measure of the amount of symmetry possessed by individual molecules. A corpus concentrated in the C1 class may have low symmetry-class entropy even though its molecules are predominantly asymmetric. Conversely, a corpus distributed across several highly symmetric point groups may have greater class entropy. The identity of the populated point groups must therefore be considered together with the entropy value.
Several limitations should be emphasized. The biological dataset is a chemically broad pilot corpus rather than an unbiased inventory of the metabolome. Point-group assignments refer to idealized isolated equilibrium or representative low-energy structures, whereas biological molecules exist in fluctuating, solvated, protonated, complexed, and conformationally heterogeneous states. Environmental interactions generally reduce rather than increase exact molecular symmetry. The astronomical datasets are also affected by observational selection, particularly the requirement of rotational detectability. The present comparison should therefore be interpreted as evidence for a robust qualitative tendency rather than as a universal quantitative law.
Despite these limitations, the contrast is substantial. Molecular clouds are dominated by mirror-symmetric and axially symmetric molecular structures, whereas biological molecular diversity is dominated by asymmetric and frequently chiral structures. The results support the hypothesis that the emergence of biological functionality is accompanied by extensive molecular symmetry breaking. Cosmic chemistry appears to favour geometrical simplicity and regularity; biological chemistry exploits asymmetry to achieve recognition, selectivity, information content, and functional complexity.
5. Conclusions
The present study demonstrates a pronounced contrast between the symmetry landscapes of molecules detected in cosmic molecular environments and those constituting biological systems. The previously analyzed molecular inventories of TMC-1, Orion KL, and IRC+10216 are dominated by linear, mirror-symmetric, and axially symmetric species. Under the adopted equilibrium-structure convention, all molecular species included in these astronomical corpora possess at least one mirror plane. Biological molecular systems exhibit the opposite general tendency: their molecular diversity is dominated by structures belonging to the point group and therefore possessing no exact symmetry operation other than the identity operation, .
This contrast is already evident in the 50-molecule biological pilot corpus. Approximately 70% of the examined species belong to , whereas only 30% possess a mirror plane and only 10% possess a proper twofold rotational axis. Inversion symmetry is rare, and higher-order proper and improper rotational symmetries are absent from the selected corpus. Although this chemically broad pilot set cannot be regarded as an unbiased representation of the entire metabolome, it clearly demonstrates that exact molecular asymmetry is widespread among amino acids, carbohydrates, metabolites, vitamins, and cofactors.
The concentration-weighted analysis of normal human plasma supports the same conclusion. Approximately 69.8% of the represented molecular concentration is contributed by molecules. Biological asymmetry is therefore not merely a consequence of counting numerous low-abundance species: it remains dominant when the molecules are weighted by their concentrations. D-glucose and L-lactic acid make particularly large contributions to the asymmetric fraction. Mirror and proper rotational symmetries retain appreciable abundance-weighted prevalences, but these values arise predominantly from highly concentrated urea.
Normal human urine demonstrates why species-weighted and concentration-weighted symmetry distributions must be distinguished. At the species level, 72% of the selected urinary metabolites belong to , confirming that urinary molecular diversity is strongly dominated by asymmetric structures. At the concentration level, however, the distribution is reversed by urea. Although urea represents only one of the 50 molecular species, its high representative concentration accounts for approximately 92% of the total concentration included in the pilot corpus. Consequently, the concentration-weighted urine distribution is dominated by symmetry. A biological fluid may therefore be dominated by asymmetric molecules in terms of species diversity while being dominated by a symmetric molecule in terms of material abundance.
The Shannon entropy, normalized Shannon entropy, and Simpson diversity number provide complementary descriptions of these point-group distributions. The biological pilot corpus, plasma, and urine all display strongly uneven distributions because one point group makes the principal contribution. In the species-weighted biological corpora, the dominant class is , whereas concentration-weighted urine is dominated by . These diversity measures characterize the distribution among point-group classes; they do not measure the degree of symmetry of the individual molecules. The identity of the dominant point group must therefore always be considered together with the calculated diversity measure.
Poliovirus provides the limiting illustration of this distinction. All six principal chemically defined constituents—VP1, VP2, VP3, VP4, VPg, and genomic RNA—belong to the point group. The corresponding distribution is concentrated completely in a single asymmetric class and consequently possesses zero Shannon entropy, zero normalized Shannon entropy, and a Simpson diversity number equal to unity. These limiting values do not indicate high molecular symmetry or structural simplicity. They indicate the complete absence of diversity among the point-group assignments because every principal constituent belongs to the same asymmetric class.
At the same time, poliovirus reveals that molecular asymmetry and supramolecular symmetry can coexist. Individual capsid proteins are asymmetric because they are constructed from chiral amino acids, possess nonperiodic sequences, contain chemically different termini, and adopt irregular folded conformations. The RNA genome is likewise asymmetric because of its chiral ribose backbone, unique nucleotide sequence, finite ends, secondary and tertiary structures, and covalently attached VPg. Nevertheless, repeated copies of the asymmetric capsid proteins assemble into an approximately icosahedral protein shell.
Poliovirus therefore exhibits a non-monotonic hierarchical development of symmetry. Molecular asymmetry dominates at the level of individual proteins and RNA; high proper rotational symmetry emerges through the repeated organization of these asymmetric components into pentamers and the capsid; and exact symmetry is reduced again when the unique genome and particle-specific heterogeneity are included. High symmetry at the supramolecular level is consequently an emergent collective property and need not be inherited from the molecular building blocks.
The prevalence of molecules in biological systems has a clear stereochemical origin. Terrestrial life extensively employs chiral amino acids, sugars, nucleosides, metabolites, and cofactors. A chiral molecular structure cannot possess a mirror plane, an inversion center, or an improper rotational axis. Homochirality therefore constitutes a fundamental breaking of mirror symmetry and strongly restricts the point groups accessible to biological molecules. Chemically nonequivalent substituents, irregular sequences, flexible conformations, and differentiated functional groups further eliminate proper rotational axes and other exact symmetry elements.
Molecular asymmetry is plausibly connected with biological functionality. Enzymatic catalysis, receptor binding, molecular transport, information transfer, and biochemical regulation require discrimination between different molecular orientations and configurations. Asymmetry increases the number of distinguishable interaction sites and enables stereoselective recognition. Biological complexity should therefore not be interpreted as an absence of organization. Living systems frequently replace the exact geometrical symmetry characteristic of comparatively simple molecules with functional, relational, and hierarchical organization.
The comparison with molecular clouds suggests that extensive symmetry breaking accompanies the transition from cosmic molecular chemistry to biological molecular organization. Cosmic molecular inventories contain numerous small linear chains, symmetric rotors, planar species, and relatively simple achiral molecules. Biological systems employ larger, more substituted, conformationally complex, and stereochemically differentiated molecules. Cosmic chemistry appears to favor geometrical simplicity and regularity, whereas biological chemistry exploits asymmetry to achieve recognition, selectivity, information content, and functional differentiation.
A further geometrical consequence follows from the predominance of structures. Every strictly planar molecule possesses a mirror plane coinciding with the plane containing its atomic nuclei. Reflection through this plane maps Because all atomic nuclei of a strictly planar molecule satisfy , every atom is mapped onto itself. A strictly planar molecule therefore cannot possess point symmetry; its symmetry is at least . Similarly, a strictly linear molecular structure necessarily possesses mirror planes containing its molecular axis. Complete molecular asymmetry consequently requires a genuinely nonplanar, three-dimensional arrangement of atoms.
This result establishes a direct geometrical connection between biological molecular asymmetry and the dimensionality of physical space. If the predominance of molecules reflects a fundamental biological requirement for molecular recognition, stereochemical differentiation, and functional specificity, then three-dimensional space supplies the geometrical freedom required to realize the molecular architecture characteristic of terrestrial life. This conclusion should be regarded as a hypothesis concerning the biological significance of molecular asymmetry rather than as a general proof that every conceivable one- or two-dimensional form of life is impossible.
Several limitations define the scope of the conclusions. The biological datasets are pilot corpora rather than exhaustive inventories of the metabolome, proteome, or virome. Point-group assignments refer to idealized isolated equilibrium or representative low-energy structures, whereas biological molecules exist in fluctuating, solvated, protonated, complexed, and conformationally heterogeneous states. Plasma and urinary concentrations also depend on physiological state, diet, age, sex, hydration, sampling conditions, and analytical methodology. The astronomical datasets are affected by observational selection, particularly the preferential rotational detection of polar molecules. Exact molecular symmetry must also be distinguished from approximate, local, time-averaged, and supramolecular symmetry.
Future investigations should extend this analysis to larger and independently curated molecular datasets. Standardized quantum-chemical geometry optimization would strengthen the point-group assignments of flexible molecules. Further comparisons should include additional biological fluids, cellular compartments, lipidomes, proteomes, nucleic acids, healthy and pathological tissues, and different viral families. It would also be valuable to follow changes in symmetry across multiple hierarchical levels, from small molecules to macromolecules, molecular complexes, membranes, organelles, viral particles, cells, and complete organisms.
In summary, the investigated molecular clouds and biological systems occupy markedly different regions of the molecular-symmetry landscape. Molecules detected in molecular clouds are predominantly mirror-symmetric and axially symmetric, whereas biological molecular diversity is predominantly asymmetric and frequently chiral. Concentration weighting can modify or even reverse the apparent distribution when a highly abundant symmetric compound dominates a biological fluid, as demonstrated by urea in urine. Poliovirus shows that asymmetric molecular constituents can generate highly symmetric supramolecular assemblies and that this symmetry may disappear again at the level of the complete individual particle. The results support a general picture in which cosmic chemistry favors exact geometrical symmetry, biological molecular functionality employs extensive symmetry breaking, and living organization reconstructs symmetry selectively at higher hierarchical levels.
Funding
This research received no external funding.
Author: Contributions
Conceptualization, E.B.; methodology E.B., investigation, E.B. writing—original draft preparation, E. B.
Data Availability Statement
The original contributions presented in this study are included in the article. Further inquiries can be directed to the corresponding author.
Conflicts of Interest
The authors declare no conflicts of interest.
Abbreviations
The following abbreviations are used in this manuscript:
| FAD | Flavin adenine dinucleotide |
| ICTV NAD |
International Committee on Taxonomy of Viruses Nicotinamide adenine dinucleotide |
| RNA | Ribonucleic acid |
| ssRNA | single-stranded ribonucleic acid |
| VPg | viral protein genome-linked |
Appendix A. Pilot Corpus of 50 Small Biological Molecules

Table A1.
Pilot Corpus of 50 Small Biological Molecules.
| No. | Molecule | Class | Point group | σ | Proper axis | i |
|---|---|---|---|---|---|---|
| 1 | Glycine | Amino acid | Cₛ | + | – | – |
| 2 | L-Alanine | Amino acid | C1 | – | – | – |
| 3 | L-Valine | Amino acid | C1 | – | – | – |
| 4 | L-Leucine | Amino acid | C1 | – | – | – |
| 5 | L-Isoleucine | Amino acid | C1 | – | – | – |
| 6 | L-Serine | Amino acid | C1 | – | – | – |
| 7 | L-Threonine | Amino acid | C1 | – | – | – |
| 8 | L-Cysteine | Amino acid | C1 | – | – | – |
| 9 | L-Methionine | Amino acid | C1 | – | – | – |
| 10 | L-Aspartic acid | Amino acid | C1 | – | – | – |
| 11 | L-Glutamic acid | Amino acid | C1 | – | – | – |
| 12 | L-Asparagine | Amino acid | C1 | – | – | – |
| 13 | L-Glutamine | Amino acid | C1 | – | – | – |
| 14 | L-Lysine | Amino acid | C1 | – | – | – |
| 15 | L-Arginine | Amino acid | C1 | – | – | – |
| 16 | L-Histidine | Amino acid | C1 | – | – | – |
| 17 | L-Phenylalanine | Amino acid | C1 | – | – | – |
| 18 | L-Tyrosine | Amino acid | C1 | – | – | – |
| 19 | L-Tryptophan | Amino acid | C1 | – | – | – |
| 20 | L-Proline | Amino acid | C1 | – | – | – |
| 21 | Adenine | Nucleobase | Cₛ | + | – | – |
| 22 | Guanine | Nucleobase | Cₛ | + | – | – |
| 23 | Cytosine | Nucleobase | Cₛ | + | – | – |
| 24 | Thymine | Nucleobase | Cₛ | + | – | – |
| 25 | Uracil | Nucleobase | Cₛ | + | – | – |
| 26 | D-Ribose | Carbohydrate | C1 | – | – | – |
| 27 | D-Glucose | Carbohydrate | C1 | – | – | – |
| 28 | D-Fructose | Carbohydrate | C1 | – | – | – |
| 29 | D-Galactose | Carbohydrate | C1 | – | – | – |
| 30 | D-Mannose | Carbohydrate | C1 | – | – | – |
| 31 | Formic acid | Metabolite | Cₛ | + | – | – |
| 32 | Acetic acid | Metabolite | Cₛ | + | – | – |
| 33 | Pyruvic acid | Metabolite | Cₛ | + | – | – |
| 34 | L-Lactic acid | Metabolite | C1 | – | – | – |
| 35 | Oxalic acid | Metabolite | C2h | + | C2 | + |
| 36 | Fumaric acid | TCA-related | C2h | + | C2 | + |
| 37 | Maleic acid | Metabolite/reference | C2v | + | C2 | – |
| 38 | Urea | Nitrogen metabolism | C2v | + | C2 | – |
| 39 | Creatinine | Nitrogen metabolism | Cₛ | + | – | – |
| 40 | Acetone | Ketone metabolism | C2v | + | C2 | – |
| 41 | Biotin | Cofactor | C1 | – | – | – |
| 42 | Riboflavin | Vitamin/cofactor | C1 | – | – | – |
| 43 | NAD+ | Cofactor | C1 | – | – | – |
| 44 | FAD | Cofactor | C1 | – | – | – |
| 45 | Coenzyme A | Cofactor | C1 | – | – | – |
| 46 | L-Ascorbic acid | Vitamin | C1 | – | – | – |
| 47 | Pantothenic acid | Vitamin/cofactor | C1 | – | – | – |
| 48 | Tetrahydrofolate | Cofactor | C1 | – | – | – |
| 49 | S-Adenosyl-L-methionine | Cofactor/metabolite | C1 | – | – | – |
| 50 | R-Lipoic acid | Cofactor | C1 | – | – | – |
Note: point-group assignments in this pilot table are idealized. Flexible achiral molecules require a precisely defined conformer and optimization protocol before the numerical statistics can be regarded as publication-grade.
Appendix B. Chemical Composition and Symmetry Analysis of the Normal Human Plasma
Table A2.
Chemical composition and symmetry analysis of the normal human plasma.
| Molecule | Point group | Plasma concentration, μM |
|---|---|---|
| Glycine | Cₛ | 244.6 |
| L-Alanine | C1 | 298.0 |
| L-Valine | C1 | 177.7 |
| L-Leucine | C1 | 101.0 |
| L-Isoleucine | C1 | 55.4 |
| L-Serine | C1 | 91.2 |
| L-Threonine | C1 | 118.3 |
| L-Cysteine | C1 | 44.3 |
| L-Methionine | C1 | 20.9 |
| L-Aspartic acid | C1 | 6.74 |
| L-Glutamic acid | C1 | 59.2 |
| L-Asparagine | C1 | 42.2 |
| L-Glutamine | C1 | 427.9 |
| L-Lysine | C1 | 144.9 |
| L-Arginine | C1 | 81.4 |
| L-Histidine | C1 | 68.3 |
| L-Phenylalanine | C1 | 50.5 |
| L-Tyrosine | C1 | 56.5 |
| L-Tryptophan | C1 | 34.9 |
| L-Proline | C1 | 169.1 |
| Adenine | Cₛ | 0.136 |
| Cytosine | Cₛ | 0.210 |
| Uracil | Cₛ | 0.020 |
| D-Glucose | C1 | 4393 |
| D-Mannose | C1 | 23.3 |
| Formic acid | Cₛ | 17.0 |
| Acetic acid | Cₛ | 112.3 |
| Pyruvic acid | Cₛ | 77.6 |
| L-Lactic acid | C1 | 2538 |
| Fumaric acid | C2h | 0.749 |
| Urea | C2v | 3371 |
| Creatinine | Cₛ | 56.5 |
| Acetone | C2v | 36.4 |
| Riboflavin | C1 | 0.0427 |
| L-Ascorbic acid | C1 | 36.1 |
| Pantothenic acid | C1 | 0.433 |
| Total | — | 12,955.831 |
All concentrations are expressed in
Appendix C
Table A3.
Chemical composition and symmetry analysis of the normal human urine.
| No. | Molecule | Representative concentration (mmol L−1) |
Point group |
|---|---|---|---|
| 1 | D-Glucose | 0.20 | C1 |
| 2 | L-Lactic acid | 0.50 | C1 |
| 3 | Citric acid | 1.00 | C1 |
| 4 | Creatine | 0.30 | C1 |
| 5 | L-Alanine | 0.20 | C1 |
| 6 | L-Valine | 0.05 | C1 |
| 7 | L-Leucine | 0.03 | C1 |
| 8 | L-Isoleucine | 0.03 | C1 |
| 9 | L-Serine | 0.10 | C1 |
| 10 | L-Threonine | 0.05 | C1 |
| 11 | L-Aspartic acid | 0.05 | C1 |
| 12 | L-Glutamic acid | 0.05 | C1 |
| 13 | L-Glutamine | 0.20 | C1 |
| 14 | L-Asparagine | 0.05 | C1 |
| 15 | L-Lysine | 0.05 | C1 |
| 16 | L-Histidine | 0.10 | C1 |
| 17 | L-Phenylalanine | 0.05 | C1 |
| 18 | L-Tyrosine | 0.05 | C1 |
| 19 | L-Tryptophan | 0.02 | C1 |
| 20 | L-Methionine | 0.02 | C1 |
| 21 | L-Proline | 0.05 | C1 |
| 22 | L-Cysteine | 0.02 | C1 |
| 23 | L-Ornithine | 0.05 | C1 |
| 24 | L-Arginine | 0.02 | C1 |
| 25 | Taurine | 1.00 | C1 |
| 26 | 3-Methylhistidine | 0.05 | C1 |
| 27 | L-Carnitine | 0.10 | C1 |
| 28 | Choline | 0.20 | C1 |
| 29 | Betaine | 0.50 | C1 |
| 30 | myo-Inositol | 0.10 | C1 |
| 31 | D-Glucuronic acid | 0.20 | C1 |
| 32 | D-Galactose | 0.10 | C1 |
| 33 | D-Fructose | 0.10 | C1 |
| 34 | D-Ribose | 0.05 | C1 |
| 35 | L-Malic acid | 0.30 | C1 |
| 36 | 2-Oxoglutaric acid | 2.24 | C1 |
| 37 | Creatinine | 10.00 | Cₛ |
| 38 | Hippuric acid | 2.00 | Cₛ |
| 39 | Uric acid | 0.40 | Cₛ |
| 40 | Formic acid | 0.20 | Cₛ |
| 41 | Acetic acid | 0.50 | Cₛ |
| 42 | Pyruvic acid | 0.20 | Cₛ |
| 43 | Benzoic acid | 0.10 | Cₛ |
| 44 | Acetone | 0.10 | Cₛ |
| 45 | Glycine | 0.10 | Cₛ |
| 46 | Uracil | 0.05 | Cₛ |
| 47 | Oxalic acid | 0.10 | C2ₕ |
| 48 | Fumaric acid | 0.05 | C2ₕ |
| 49 | Succinic acid | 0.12 | C2ₕ |
| 50 | Urea | 250.00 | C2ᵥ |
References
- Wigner, E.P. Violations of Symmetry in Physics. In Philosophical Reflections and Syntheses; The Collected Works of Eugene Paul Wigner; Mehra, J., Ed.; Springer: Berlin/Heidelberg, Germany, 1995; Volume B/6. [Google Scholar]
- Hamermesh, M. Group Theory and Its Application to Physical Problems; Dover Publications: New York, NY, USA, 1989. [Google Scholar]
- Nambu, Y. Nobel lecture: Spontaneous symmetry breaking in particle physics: A case of cross fertilization. Rev. Mod. Phys. 2009, 81, 1015. [Google Scholar] [CrossRef]
- Beekman, A.J.; Rademaker, L.; van Wezel, J. An introduction to spontaneous symmetry breaking. SciPost Phys. Lect. Notes 2019, 11, 1–140. [Google Scholar] [CrossRef]
- Cotton, F.A. Chemical Applications of Group Theory, 3rd ed.; Wiley-Interscience: New York, NY, USA, 1990. [Google Scholar]
- Bishop, D.M. Group Theory and Chemistry; Dover Publications: New York, NY, USA, 1993. [Google Scholar]
- Barron, L.D. Molecular Light Scattering and Optical Activity, 2nd ed.; Cambridge University Press: Cambridge, UK, 2004. [Google Scholar]
- Heilbronner, E.; Dunitz, J. D. Reflections on symmetry; VCH Publishers, Inc: New York, USA, 1993. [Google Scholar]
- McManus, I. C. Right hand, left hand: The origins of asymmetry in brains, bodies, atoms and culture; Weidenfeld & Nicolson, UK: London, 2002. [Google Scholar]
- Finnerty, J.H.; Pang, K.; Burton, P.; Paulson, D.; Martindale, M.Q. Origins of Bilateral Symmetry: Hox and Dpp Expression in a Sea Anemone. Science 2004, 304, 1335. [Google Scholar] [CrossRef] [PubMed]
- Yonekura, T.; Sugiyama, M. Symmetry and its transition in phyllotaxis. J. Plant. Res. 2021, 134, 417–430. [Google Scholar] [CrossRef] [PubMed]
- Cannon, K.A.; Ochoa, J.M.; Yeates, T.O. High-symmetry protein assemblies: Patterns and emerging applications. Curr. Opin. Struct. Biol. 2019, 55, 77–84. [Google Scholar] [CrossRef] [PubMed]
- Wolynes, P.G. Symmetry and the energy landscapes of biomolecules. Proc. Natl. Acad. Sci. USA 1996, 93, 14249–14255. [Google Scholar] [CrossRef] [PubMed]
- Hollo, G. A new paradigm for animal symmetry. Interface Focus 2015, 5, 20150032. [Google Scholar] [CrossRef] [PubMed]
- Bormashenko, E. Fibonacci Sequences, Symmetry and Order in Biological Patterns, Their Sources, Information Origin and the Landauer Principle. Biophysica 2022, 2(3), 292–307. [Google Scholar] [CrossRef]
- Hollo, G. Demystification of animal symmetry: Symmetry is a response to mechanical forces. Biol. Direct. 2017, 12, 11. [Google Scholar] [CrossRef] [PubMed]
- Bormashenko, Ed.; Nosonovsky, M. The Symmetry Landscape of Cosmic Molecules: From TMC-1 to Orion KL and IRC+10216, submitted to Symmetry. preprints 2026, 2026081266. [Google Scholar] [CrossRef]
- McGuire, B.A. 2021 census of interstellar, circumstellar, extragalactic, protoplanetary disk, and exoplanetary molecules. Astrophys. J. Suppl. Ser. 2022, 259, 30. [Google Scholar] [CrossRef]
- Herbst, E.; van Dishoeck, E.F. Complex organic interstellar molecules. Annu. Rev. Astron. Astrophys. 2009, 47, 427–480. [Google Scholar] [CrossRef]
- Agúndez, M.; Wakelam, V. Chemistry of dark clouds: Databases, networks, and models. Chem. Rev. 2013, 113, 8710–8737. [Google Scholar] [CrossRef] [PubMed]
- Xue, C.; Byrne, A.N.; Morgan, L.; Wenzel, G.; Changala, P.B.; Fried, Z.T.P.; Loomis, R.A.; Remijan, A.; Bergin, E.A.; Cooke, I.R.; et al. The molecular inventory of TMC-1 with GOTHAM observations. Astrophys. J. Suppl. Ser. 2025, 281, 9. [Google Scholar] [CrossRef]
- Crockett, N.R.; Bergin, E.A.; Neill, J.L.; Favre, C.; Schilke, P.; Lis, D.C.; Bell, T.A.; Blake, G.A.; Cernicharo, J.; Emprechtinger, M.; et al. Herschel observations of extraordinary sources: Analysis of the HIFI 1.2 THz wide spectral survey toward Orion KL. I. Methods. Astrophys. J. 2014, 787, 112. [Google Scholar] [CrossRef]
- Crockett, N.R.; Bergin, E.A.; Neill, J.L.; Favre, C.; Blake, G.A.; Herbst, E.; Anderson, D.E.; Hassel, G.E. Herschel observations of extraordinary sources: Analysis of the HIFI 1.2 THz wide spectral survey toward Orion KL. II. Chemical implications. Astrophys. J. 2015, 806, 239. [Google Scholar] [CrossRef]
- Cernicharo, J.; Guélin, M.; Kahane, C. A (\lambda) 2 mm molecular line survey of the C-star envelope IRC+10216. Astron. Astrophys. Suppl. Ser. 2000, 142, 181–215. [Google Scholar] [CrossRef]
- Ao, Y.-N.; Zhang, Y.; Qiu, J.-J.; Sun, H.-M.; Li, X.-H. A 3 mm molecular line survey toward IRC+10216. Astron. Astrophys. 2025, 699, A216. [Google Scholar] [CrossRef]
- Blackmond, D.G. The origin of biological homochirality. Cold Spring Harb. Perspect. Biol. 2010, 2, a002147. [Google Scholar] [CrossRef] [PubMed]
- Sallembien, Q.; Bouteiller, L.; Crassous, J.; Raynal, M. Possible chemical and physical scenarios towards biological homochirality. Chem. Soc. Rev. 2022, 51, 3436–3476. [Google Scholar] [CrossRef] [PubMed]
- Bonner, W.A. The origin and amplification of biomolecular chirality. Orig. Life Evol. Biosph. 1991, 21, 59–111. [Google Scholar] [CrossRef] [PubMed]
- Fischer, E. Einfluss der Configuration auf die Wirkung der Enzyme. Ber. Dtsch. Chem. Ges. 1894, 27, 2985–2993. [Google Scholar] [CrossRef]
- Koshland, D.E., Jr. Application of a theory of enzyme specificity to protein synthesis. Proc. Natl. Acad. Sci. USA 1958, 44, 98–104. [Google Scholar] [CrossRef] [PubMed]
- Frank, F.C. On spontaneous asymmetric synthesis. Biochim. Biophys. Acta 1953, 11, 459–463. [Google Scholar] [CrossRef] [PubMed]
- Soai, K.; Shibata, T.; Morioka, H.; Choji, K. Asymmetric autocatalysis and amplification of enantiomeric excess of a chiral molecule. Nature 1995, 378, 767–768. [Google Scholar] [CrossRef]
- Simón-Manso, Y.; Lowenthal, M. S.; Kilpatrick, L. E.; et al. Metabolite profiling of a NIST Standard Reference Material for human plasma (SRM 1950): GC–MS, LC–MS, NMR, and clinical laboratory analyses, libraries, and web-based resources. Anal. Chem. 2013, 85, 11725–11731. [Google Scholar] [CrossRef] [PubMed]
- Mandal, R.; Zheng, J.; Zhang, L.; Oler, E.; LeVatte, M. A.; Berjanskii, M.; Lipfert, M.; Han, J.; Borchers, C. H.; Wishart, D. S. Comprehensive, quantitative analysis of SRM 1950: The NIST human plasma reference material. Anal. Chem. 2025, 97, 667–675. [Google Scholar] [CrossRef] [PubMed]
- National Institute of Standards and Technology. Standard Reference Material® 1950: Metabolites in Frozen Human Plasma. NIST: Gaithersburg, MD, USA. Available online: https://shop.nist.gov/ccrz__ProductDetails?sku=1950 (accessed on 27 August 2026).
- Bouatra, S.; Aziat, F.; Mandal, R.; Guo, A.C.; Wilson, M.R.; Knox, C.; Bjorndahl, T.C.; Krishnamurthy, R.; Saleem, F.; Liu, P.; et al. The human urine metabolome. PLoS ONE 2013, 8, e73076. [Google Scholar] [CrossRef] [PubMed]
- Wishart, D.S.; Guo, A.; Oler, E.; Wang, F.; Anjum, A.; Peters, H.; Dizon, R.; Sayeeda, Z.; Tian, S.; Lee, B.L.; et al. HMDB 5.0: The Human Metabolome Database for 2022. Nucleic Acids Res. 2022, 50, D622–D631. [Google Scholar] [CrossRef] [PubMed]
- Hogle, J. M.; Chow, M.; Filman, D. J. Three-dimensional structure of poliovirus at 2.9 Å resolution. Science 1985, 229, 1358–1365. [Google Scholar] [CrossRef] [PubMed]
- Hogle, J. M. Poliovirus cell entry: Common structural themes in viral cell entry pathways. Annu. Rev. Microbiol. 2002, 56, 677–702. [Google Scholar] [CrossRef] [PubMed]
- Zell, R.; Delwart, E.; Gorbalenya, A.E.; Hovi, T.; King, A.M.Q.; Knowles, N.J.; Lindberg, A.M.; Pallansch, M.A.; Palmenberg, A.C.; Reuter, G.; et al. ICTV Virus Taxonomy Profile: Picornaviridae. J. Gen. Virol. 2017, 98, 2421–2422. [Google Scholar] [CrossRef] [PubMed]
- Shannon, C.E. A mathematical theory of communication. Bell Syst. Tech. J. 1948, 27, 379–423, 623–656. [Google Scholar] [CrossRef]
- Bormashenko, Ed.; Legchenkova, I.; Frenkel, M.; Shvalb, N.; Shoval, Sh. Shannon (Information) Measures of Symmetry for 1D and 2D Shapes and Patterns. Appl. Sci. 2022, 12(3), 1127. [Google Scholar] [CrossRef]
- Li, R.; Bowerman, B. Symmetry Breaking in Biology. Cold Spring Harb. Perspect. Biol. 2010, 2, a003475. [Google Scholar] [CrossRef] [PubMed]
Figure 1.
2D scheme of the molecule of D-glucose is depicted. Absence of symmetry elements is shown. The symmetry group is
Figure 1.
2D scheme of the molecule of D-glucose is depicted. Absence of symmetry elements is shown. The symmetry group is
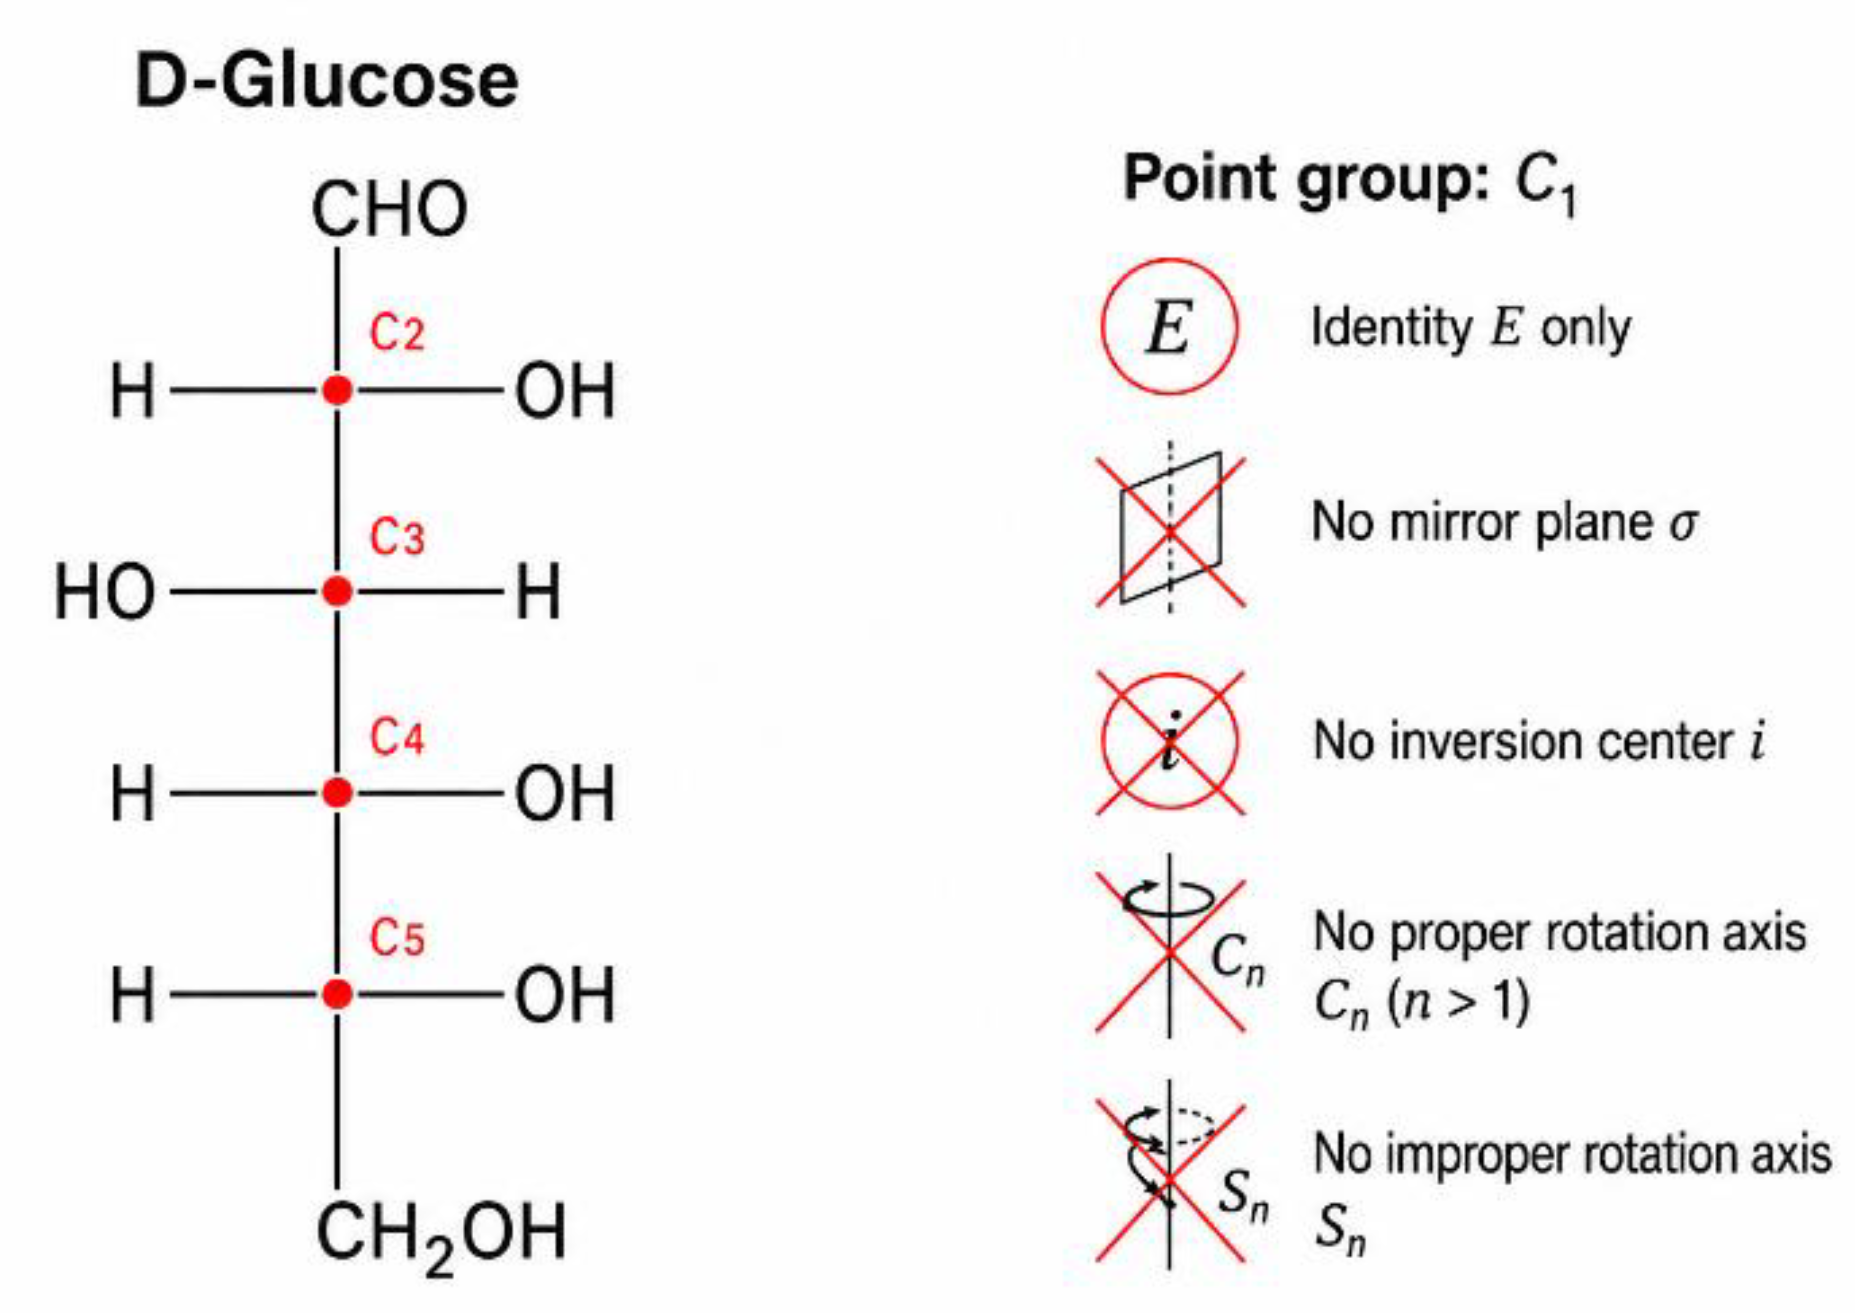
Figure 2.
Mirror symmetry of a strictly planar molecule. All atomic nuclei and bonds lie in the same plane. Reflection through this plane, , leaves every atom unchanged because . The molecular plane therefore constitutes a mirror plane, , and a strictly planar molecule cannot possess point symmetry.
Figure 2.
Mirror symmetry of a strictly planar molecule. All atomic nuclei and bonds lie in the same plane. Reflection through this plane, , leaves every atom unchanged because . The molecular plane therefore constitutes a mirror plane, , and a strictly planar molecule cannot possess point symmetry.
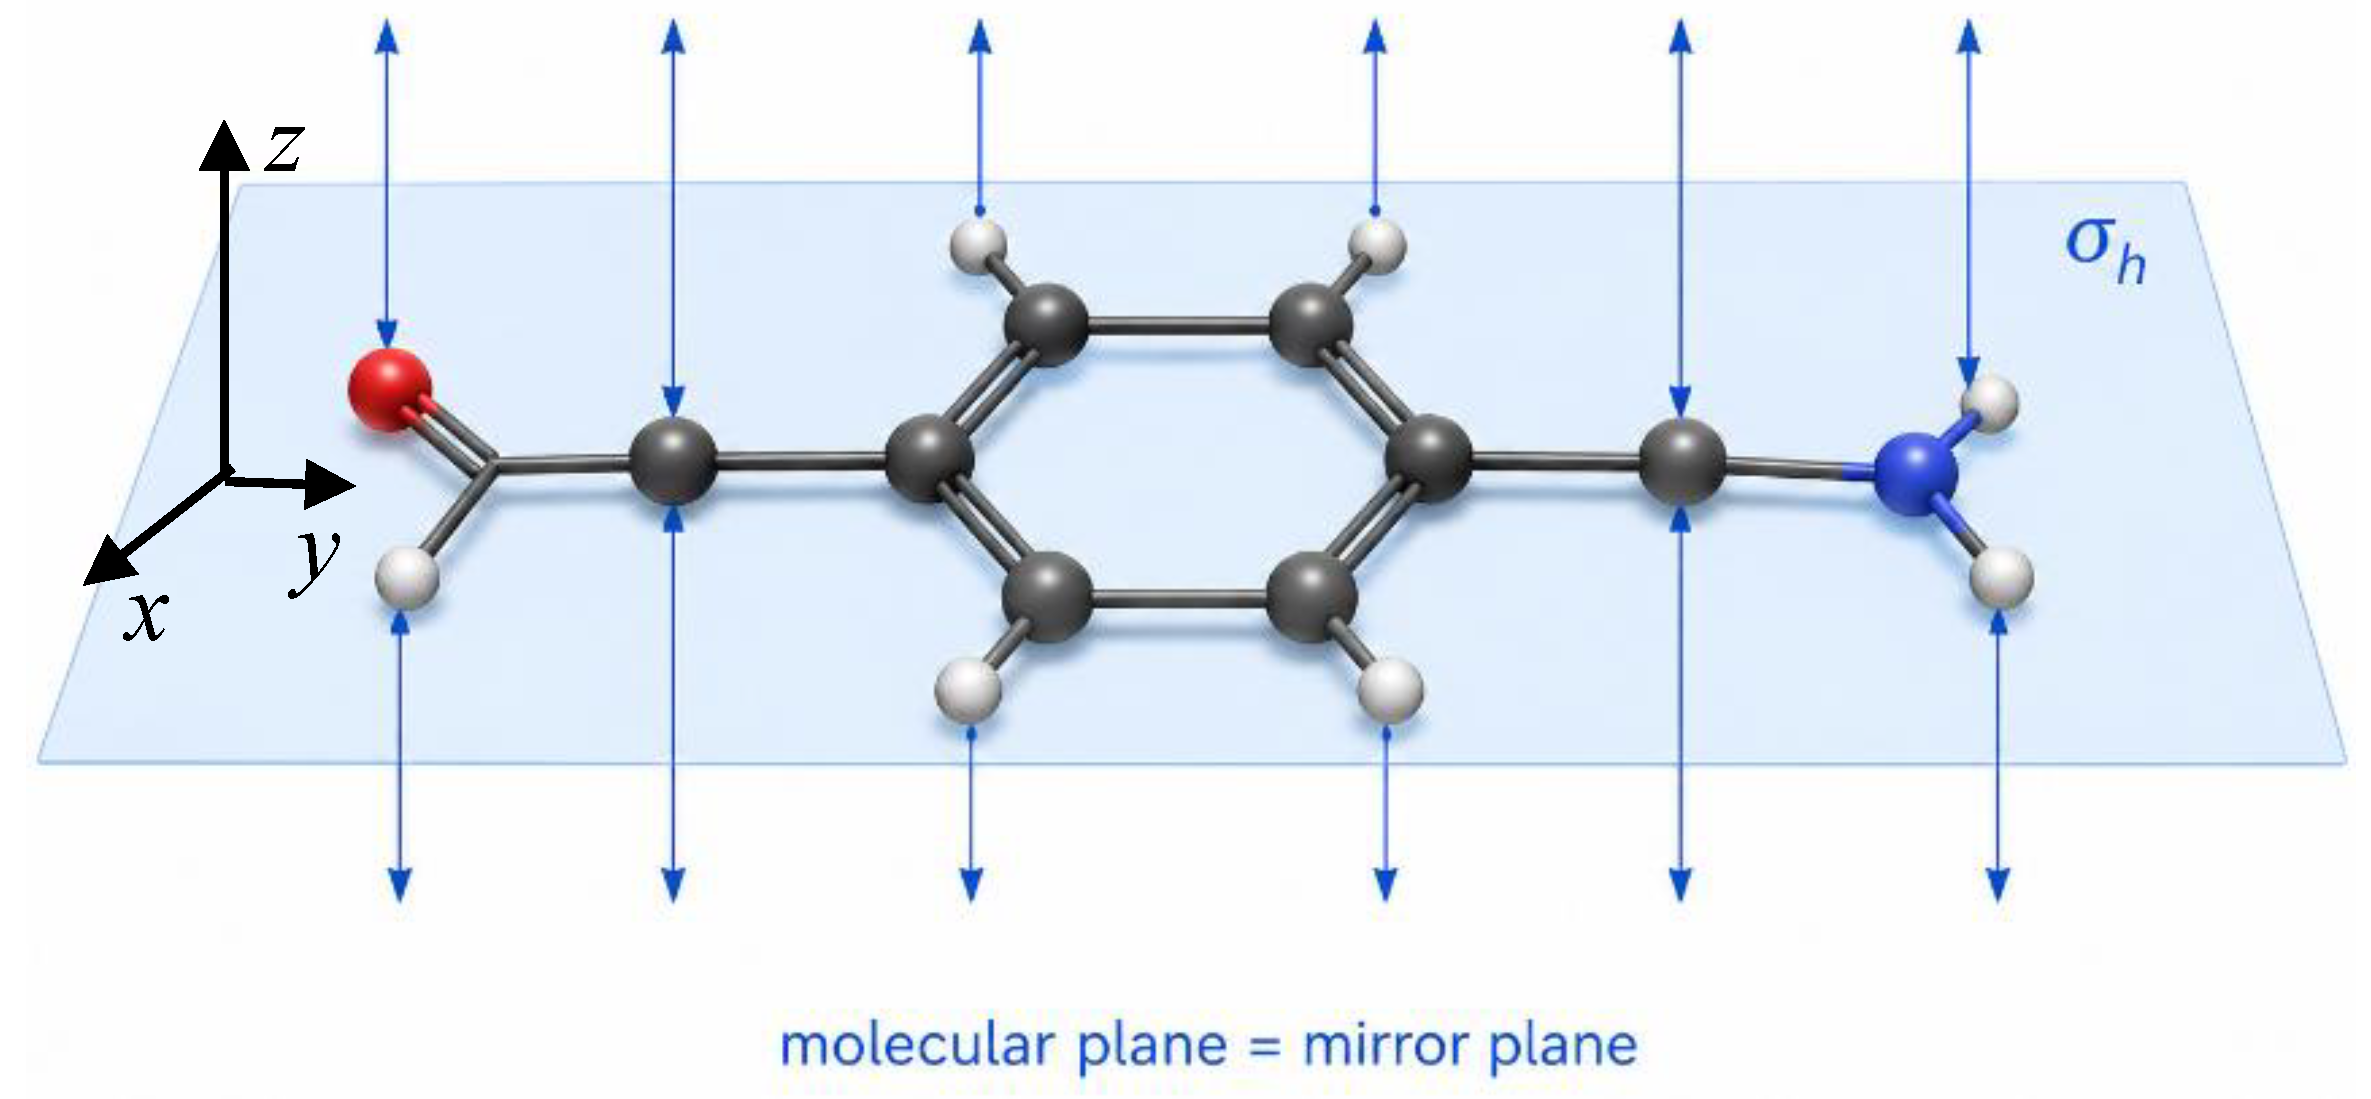
Table 1.
Distribution of the molecules of the pilot corpus according to the point symmetry groups.
| . Point group | n | Fraction, |
| 35 | 70% | |
| 10 | 20% | |
| 3 | 6% | |
| 2 | 4% | |
| Total: | 50 | 100% |
Table 2.
Molecular prevalence of symmetry-operation types established for the pilot corpus of biological molecules.
Table 2.
Molecular prevalence of symmetry-operation types established for the pilot corpus of biological molecules.
| Symmetry-operation type | Molecules possessing it, | Molecular prevalence, |
| Mirror reflection, σ | 15 | 30% |
| Proper twofold rotation, C2 | 5 | 10% |
| Inversion, i | 2 | 4% |
| Improper rotation other than inversion, Sₙ (n > 2) | 0 | 0% |
| Higher-order proper rotation, Cₙ (n > 2) | 0 | 0% |
Table 3.
Abundance-weighted point-group distribution for normal human plasma.
| Point group | Quantified molecules, n | Summed concentration, μM | Abundance fraction |
|---|---|---|---|
| C1 | 25 | 9039.316 | 69.770% |
| Cₛ | 8 | 508.366 | 3.924% |
| C2v | 2 | 3407.400 | 26.300% |
| C2h | 1 | 0.749 | 0.0058% |
| Total | 36 | 12,955.831 | 100% |
Table 4.
Abundance-weighted symmetry-element prevalence.
| Symmetry-element type | Contributing groups | Abundance-weighted prevalence, |
|---|---|---|
| Mirror plane, σ | 30.230% | |
| Nontrivial proper axis | 26.306% | |
| Inversion centre, i | 0.0058% | |
| Improper rotation beyond inversion | None | 0% |
| No nontrivial symmetry | C1 | 69.770% |
Table 5.
Dominant contributors to the symmetry distribution in the normal human plasma.
| Molecule | Point group | Concentration fraction |
|---|---|---|
| D-glucose | 33.91% | |
| Urea | 26.02% | |
| L-lactic acid | 19.59% | |
| L-glutamine | 3.30% | |
| L-alanine | 2.30% | |
| Glycine | 1.89% |
Table 6.
Species- and concentration-weighted point-group distribution for the 50-molecule normal-urine pilot corpus.
Table 6.
Species- and concentration-weighted point-group distribution for the 50-molecule normal-urine pilot corpus.
| Point group | Molecules, n | Species fraction | Concentration sum (mmol L−1) | Concentration fraction |
|---|---|---|---|---|
| C1 | 36 | 72.0% | 8.18 | 3.01% |
| Cₛ | 10 | 20.0% | 13.65 | 5.02% |
| C2ₕ | 3 | 6.0% | 0.27 | 0.10% |
| C2ᵥ | 1 | 2.0% | 250.00 | 91.88% |
| Total | 50 | 100% | 272.10 | 100% |
Table 7.
Molecular and abundance weight prevalence of symmetry elements of molecules appearing in the normal urine corpus.
Table 7.
Molecular and abundance weight prevalence of symmetry elements of molecules appearing in the normal urine corpus.
| Symmetry-element | Molecules possessing symmetry element | Molecularprevalence, | Abundance-weighted prevalence, |
|---|---|---|---|
| Mirror plane, σ | 14 | 28.0% | 96.99% |
| Proper twofold axis, C2 | 4 | 8.0% | 91.97% |
| Inversion centre, i | 3 | 6.0% | 0.10% |
| Linear axis, |
0 | 0% | 0% |
Table 8.
Symmetry classification of the molecules constituting Poliovirus.
| Constituent | Approximate copy number per virion | Exact molecular point group | Reason |
| VP1 | 60 | Chiral amino acids, asymmetric sequence, irregular folded conformation | |
| VP2 | 60 | Same | |
| VP3 | 60 | Same | |
| VP4 | 60 | Small but sequence-asymmetric chiral protein | |
| Genomic (+)ssRNA | 1 | Chiral ribose backbone, nonperiodic nucleotide sequence, finite ends and irregular folding | |
| VPg | 1 | Short chiral, sequence-asymmetric peptide | |
| VPg–RNA conju-gate | 1 | Covalent attachment further enforces molecular asymmetry | |
| Bound water and ions | Variable | Not assigned | Positions and occupancies vary among particles |
| Lipid-like VP1 pocket factor | Variable/uncertain | Molecule-dependent | Its precise identity and occupancy are not uni-versal |
Table 9.
Comparison of the Capsid symmetry versus whole-virion symmetry.
| Object | Symmetry assignment |
| Individual capsid protein | |
| VP1–VP2–VP3–VP4 protomer | |
| Idealized pentamer | |
| Idealized or icosahedrally averaged capsid | |
| Packaged genomic RNA | |
| Complete individual virion | Generally, no exact nontrivial symmetry expected |
Table 10.
Diversity measures of the point-group distributions in the studied biological systems.
| System and weighting | Shannon entropy, H | Normalized Shannon entropy, | Simpson diversitynumber, |
| Pilot biological corpus, species-weighted | 0.869 | 0.627 | 1.87 |
| Normal human plasma, species-weighted | 0.848 | 0.611 | 1.87 |
| Normal human plasma, concentration-weighted | 0.730 | 0.527 | 1.79 |
| Normal human urine, species-weighted | 0.805 | 0.581 | 1.78 |
| Normal human urine, concentration-weighted | 0.340 | 0.245 | 1.18 |
| Poliovirus constituents, species-weighted | 0 | 0 | 1.00 |
| Poliovirus constituents, copy-number-weighted | 0 | 0 | 1.00 |
Disclaimer/Publisher’s Note: The statements, opinions and data contained in all publications are solely those of the individual author(s) and contributor(s) and not of MDPI and/or the editor(s). MDPI and/or the editor(s) disclaim responsibility for any injury to people or property resulting from any ideas, methods, instructions or products referred to in the content. |
© 2026 by the authors. Licensee MDPI, Basel, Switzerland. This article is an open access article distributed under the terms and conditions of the Creative Commons Attribution (CC BY) license (http://creativecommons.org/licenses/by/4.0/).
Copyright: This open access article is published under a Creative Commons CC BY 4.0 license, which permit the free download, distribution, and reuse, provided that the author and preprint are cited in any reuse.