
Submitted:
26 August 2026
Posted:
28 August 2026
You are already at the latest version
Abstract
DNA methylation (DNAm) signatures may capture molecular variation associated with cognitive phenotypes, but saliva-based scores for subjective memory are poorly characterized. We developed MMS-32, a frozen 32-CpG salivary DNAm score derived from an independent EPIC-array comparison of individuals reporting Very bad memory (n = 1,117) versus Very good memory (n = 2,400). Candidate loci were screened using Mann-Whitney U tests; MMS-32 comprises all candidate CpGs with discovery p < 1 × 10⁻⁴ and uses signed discovery mean differences as normalized weights. The frozen score was evaluated in an independent male dataset (n = 1,044). Among single-category memory responses, MMS-32 discriminated Very bad (n = 16) from Very good (n = 66) memory with AUC = 0.861 (95% bootstrap CI 0.736–0.957; p = 8.50 × 10⁻⁶). A broader Bad/Very bad versus Good/Very good contrast yielded AUC = 0.603 (p = 0.0079). Linear dependence on chronological age was negligible (R2 = 0.0022; Pearson r = −0.047, p = 0.133), and the extreme-memory association remained significant after age adjustment. MMS-32 is therefore a research-stage, memory-associated methylation signature rather than a biological-age score. Independent validation against objective (diagnosed dementia, MRI etc.) and longitudinal cognitive outcomes is required.
Keywords:
DNA methylation
; subjective memory
; saliva
; epigenetics
; MethylationEPIC
; CpG
; cognitive phenotype
; biomarker
; MMS-32
1. Introduction
DNA methylation is a stable but dynamic epigenetic modification that can be quantified at scale across the human genome. The Illumina Infinium MethylationEPIC array provides dense coverage of CpG methylation and has enabled epigenome-wide association studies and multivariate methylation scores for complex human traits [1]. Although much of the applied methylation literature has focused on chronological or biological ageing, a methylation score need not be an age estimator; the same framework can be used to construct phenotype-specific signatures when the discovery phenotype and coefficient derivation are explicitly defined.
Peripheral DNAm has been associated with multiple domains of cognitive function. Large epigenome-wide meta-analyses have identified CpG associations with global cognition and verbal fluency [2], while longitudinal work has reported associations between DNAm and the level of processing speed, spatial ability, and working memory [3]. Multivariate blood-based epigenetic predictors of general cognitive ability have also shown measurable external prediction, supporting the broader principle that peripheral methylation can encode information related to cognitive phenotypes [4]. More recently, Epigenetic-g was independently evaluated in a diverse, nationally representative cohort of 3,575 older US adults and remained associated with cognitive performance after adjustment for education, APOE ε4 status, and circulating neurodegenerative biomarkers, providing further evidence that cognition-related DNAm predictors can generalize beyond their original development cohorts [10].
Subjective memory ratings are not equivalent to objective neuropsychological performance and should not be interpreted as a clinical diagnosis. Subjective memory complaints and subjective cognitive decline are reproducible phenotypes and, particularly in older populations, have been associated with increased subsequent risk of mild cognitive impairment and dementia [5,6,7]. Simple self-report measures also capture influences that extend beyond neurodegeneration, including mood, sleep, health status, and individual expectations. Recent work also demonstrates that multivariate DNAm indices can span subjective and objective cognitive phenotypes. Jiakponnah et al. developed a 100-CpG Alzheimer's disease DNA Methylation Index (AD-DMI) from postmortem dorsolateral prefrontal cortex and reported associations with global cognitive function, AD neuropathologic burden, clinical diagnosis, and subjective memory complaints [11]. Although AD-DMI is brain-derived and disease-oriented rather than a peripheral subjective-memory score, it provides a relevant conceptual precedent for testing whether phenotype-specific DNAm indices relate across subjective, objective, and pathological domains. A molecular score associated with subjective memory should therefore be described as a memory-associated signature unless and until it is validated against objective cognitive or clinical outcomes.
Saliva is attractive for population-scale epigenetic studies because collection is non-invasive and suitable for remote testing. However, whole saliva contains varying proportions of epithelial and immune cells, which can materially influence methylation measurements [8,9]. This cellular heterogeneity is an important consideration for interpretation and independent replication of saliva-derived signatures. Cross-tissue evidence provides additional support for saliva as a research matrix: Zarandooz and Raffington applied blood-derived DNAm indices to matched saliva and blood and reported a cell-composition-adjusted intraclass correlation coefficient of 0.69 for Epigenetic-g, indicating moderate cross-tissue agreement for a cognition-related methylation predictor [12]. The same study emphasized that such agreement is not sufficient to assume clinical interchangeability, reinforcing the need for saliva-specific validation and attention to cell composition.
The objective of the present study was to develop and freeze a compact salivary DNAm score associated with a five-level subjective memory questionnaire. Candidate CpGs were obtained from an independent Very bad versus Very good memory discovery analysis (appendix 1). A 32-CpG score, MMS-32, was then frozen using a discovery-only significance rule and evaluated in a separate male dataset. The principal aims were to quantify discrimination of the extreme subjective-memory categories, assess generalization to broader poor-versus-better memory groupings, and determine the extent to which the score was linearly related to chronological age.
2. Materials and Methods
2.1. Study Design and Data Source
This retrospective study used fully anonymised data provided by Muhdo Health Ltd. Biological material consisted of saliva samples profiled for DNA methylation using the Illumina Infinium MethylationEPIC platform as tested via. Eurofins Denmark. The analytical datasets contained no direct personal identifiers. The study used a two-stage design consisting of an independent discovery dataset and a separate male evaluation dataset.
The discovery analysis compared individuals reporting Very bad memory (n = 1,117) with individuals reporting Very good memory (n = 2,400) during discovery phase past and/or present smoker were removed, and known diagnosed pathology was also eliminated as the study was sex specific this was already accounted for. The resulting candidate CpGs were subsequently applied to a separate independent male dataset which was not-part of discovery containing 1,044 methylation profiles which were screened for smoking status, with ever-smokers being eliminated. The final 32-CpG panel was frozen after reduced panel performance had been explored in the male dataset; the male results are described as development/evaluation estimates rather than as a fully untouched confirmatory validation of the final panel size.
Scheme 1.
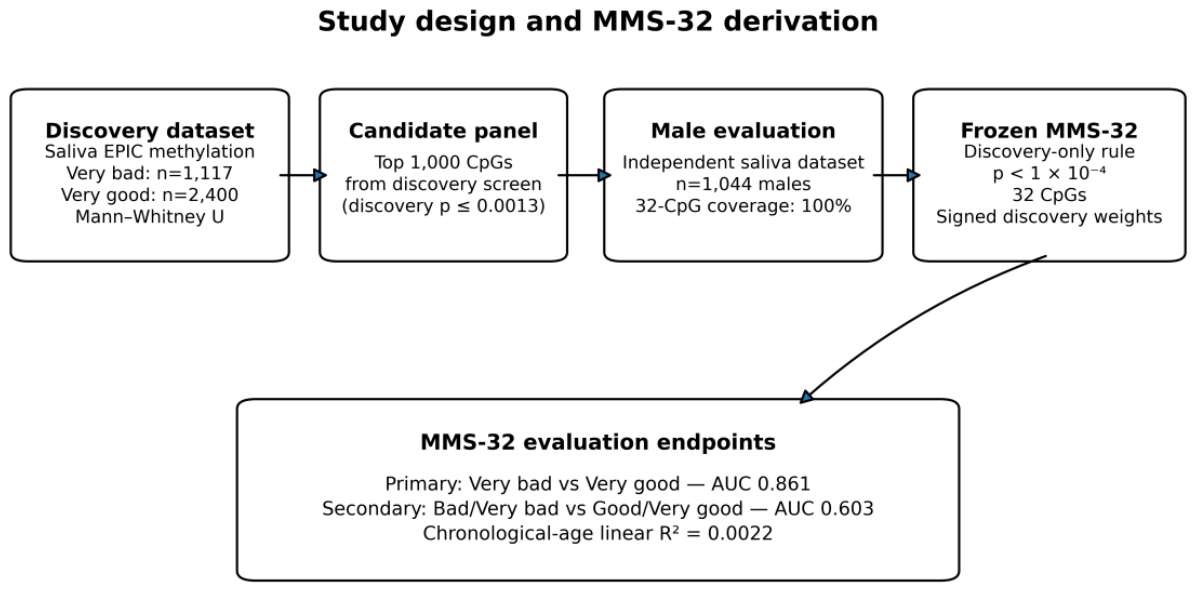
Study design and derivation of MMS-32. The CpG direction and weighting originate from the independent Very bad versus Very good memory discovery analysis conducted within the fixed approximately 32,000-CpG laboratory-release panel. The final 32-CpG panel is defined by the discovery-only rule p < 1 × 10⁻⁴ and is frozen as MMS-32 v1.0.
Scheme 1.
Study design and derivation of MMS-32. The CpG direction and weighting originate from the independent Very bad versus Very good memory discovery analysis conducted within the fixed approximately 32,000-CpG laboratory-release panel. The final 32-CpG panel is defined by the discovery-only rule p < 1 × 10⁻⁴ and is frozen as MMS-32 v1.0.
2.2. Saliva DNA Methylation Measurement
This study follows the ethical principles of the Declaration of Helsinki. Saliva was collected using Isohelix testing kits through Muhdo Health Ltd., and DNA extraction and methylation profiling were performed by Eurofins Denmark. Genome-scale DNAm was measured using the Illumina Infinium MethylationEPIC v1 BeadChip, which interrogates more than 850,000 CpG loci [1]. Under the laboratory data-access arrangement, Muhdo Health received methylation beta values for a fixed, predefined panel of approximately 32,000 CpG loci rather than the complete EPIC probe-level dataset. The released panel uses fixed CpG identifiers and genomic annotations and was established independently of the present subjective-memory phenotype; it therefore constituted the eligible discovery-testing universe for this study. This restriction reflected the laboratory data-access/commercial arrangement and was not a phenotype-driven filtering step. Methylation was quantified as beta values (fraction methylated, 0 to 1). All sample processing and hybridization steps were performed according to the manufacturer's instructions, and raw intensity data were normalized to correct for type I/II probe biases. The study data were obtained through the Muhdo Health mobile application with informed consent for DNA research, and all analytical records were anonymised. The large discovery sample reduces the influence of random variation in saliva cellular composition; however, large sample size does not eliminate systematic cell-composition differences associated with phenotype. Cell-type proportions were not explicitly modelled in the present analysis, and this remains a limitation. The reproducibility of the multivariate score in a separate male dataset provides evidence that the observed association is not restricted to the discovery cohort, but future replication should include estimation or adjustment of saliva epithelial and immune-cell proportions.
2.3. Subjective Memory Questionnaire
Memory was assessed using the Muhdo Health questionnaire via an android or IOs app. Response options were Very bad, Bad, Normal, Good, and Very good. The primary discovery and evaluation phenotype deliberately used the two extreme categories, Very bad and Very good, to maximize phenotypic contrast.
In the male evaluation dataset, 435 participants had a single, unambiguous response in one of the five categories: Very bad (n = 16), Bad (n = 60), Normal (n = 152), Good (n = 141), and Very good (n = 66). Records with missing questionnaire responses or simultaneous multi-category labels were excluded from categorical memory analyses. The primary binary comparison was Very bad versus Very good. A secondary analysis compared Bad + Very bad against Good + Very good, excluding Normal.
2.4. Discovery CpG Screening and Panel Reduction
For each of the approximately 32,000 CpG loci available in the fixed laboratory-release panel, methylation beta values were compared between the Very bad and Very good memory groups using two-sided Mann-Whitney U tests. The 1,000 strongest candidate CpGs were retained from this discovery screen. In the supplied discovery table, these 1,000 CpGs had p-values ranging from 2.04 × 10⁻⁶ to approximately 1.3 × 10⁻³. Because the approximately 32,000-site release panel was predefined independently of the memory phenotype, these candidates were not selected from the complete >850,000-probe EPIC array; the fixed laboratory-release panel was the relevant discovery-testing universe.
Reduced candidate panels were explored after the 1,000-CpG panel had been applied to the male dataset. To avoid selecting individual loci according to their performance in the male outcome data, the frozen MMS-32 inclusion rule was defined exclusively from the independent discovery statistic: all candidate CpGs with discovery Mann-Whitney p < 1 × 10⁻⁴ were included. This yielded exactly 32 CpGs. The smaller predefined testing universe is relevant when interpreting the nominal discovery p-value distribution, but no individual CpG is claimed to have achieved epigenome-wide significance. MMS-32 is therefore treated as a multivariate predictive signature rather than evidence for independently established causal loci.
2.5. Construction and Freezing of MMS-32
For CpG j, the signed discovery methylation difference was defined as:
Δj = mean(βVery bad,j) − mean(βVery good,j)
The discovery midpoint for each CpG was:
Mj = [mean(βVery bad,j) + mean(βVery good,j)] / 2
Weights were normalized across the 32 CpGs according to the absolute sum of discovery mean differences:
wj = Δj / Σk |Δk|
For individual i, the frozen score was calculated as:
MMS-32i = Σj wj (βij − Mj)
The sign of each coefficient therefore derives entirely from the discovery comparison. A positive weight means higher methylation contributes toward the Very bad-memory direction, while a negative weight means lower methylation contributes toward that direction. Higher MMS-32 values indicate a methylation profile more similar to the discovery Very bad-memory group. MMS-32 contains no chronological-age term. The CpG list, midpoints, and weights were frozen as MMS-32 v1.0.
2.6. Quality Control
A sample was considered scoreable only if all 32 CpGs were numeric and each beta value lay within the interval 0–1. All 1,044 male samples met these requirements for MMS-32.
2.7. Statistical Analysis
Differences in MMS-32 between two memory groups were assessed using two-sided Mann-Whitney U tests. Discrimination was quantified using receiver-operating-characteristic area under the curve (ROC AUC). The 95% confidence interval for the primary AUC was estimated using 10,000 bootstrap resamples. The ordered relationship across the five single-response categories was evaluated with Spearman rank correlation after coding memory from Very bad = 1 to Very good = 5.
Chronological-age dependence was assessed across the 1,044 male samples using Pearson correlation and ordinary least-squares regression, with the coefficient of determination (R2) used to quantify the proportion of MMS-32 variance explained linearly by age. Spearman correlation was reported as a complementary monotonic association measure. Because a small number of supplied age values were below 18 years, a sensitivity analysis restricted to age ≥18 years was also performed. Age-adjusted logistic regression was used to confirm that the primary memory association was not explained by chronological age. Analyses were performed in Python using NumPy, pandas, SciPy, statsmodels, and scikit-learn.
3. Results
3.1. Distribution of MMS-32 Across Subjective Memory Categories
The frozen MMS-32 score was highest in the Very bad memory category and lower in the remaining categories (Table 1; Figure 1). The Very bad group had a mean MMS-32 of 0.0725, compared with 0.0204 in the Very good group. Across the five ordered categories, higher MMS-32 was weakly associated with poorer memory rating (Spearman ρ = −0.114, p = 0.017). The intermediate categories showed substantial overlap, indicating that the principal signal was concentrated at the extreme poor-memory end rather than forming a uniformly separated five-level scale.
3.2. Primary Extreme-Memory Discrimination
The primary evaluation contrasted Very bad (n = 16) with Very good (n = 66) memory. MMS-32 achieved an AUC of 0.861 (95% bootstrap CI 0.736–0.957; Figure 2). The score distributions differed by Mann-Whitney U testing (p = 8.50 × 10⁻⁶). In a logistic model including standardized MMS-32 and chronological age, MMS-32 remained associated with the extreme-memory outcome (p = 0.0070), whereas age did not (p = 0.854).
3.3. Broader Poor-Versus-Better Memory Classification
A secondary analysis broadened the poor-memory group to Bad + Very bad (n = 76) and the better-memory group to Good + Very good (n = 207), while excluding Normal. Discrimination was attenuated but remained above chance (AUC = 0.603; 95% bootstrap CI 0.529–0.678; Mann-Whitney p = 0.0079). In age-adjusted logistic regression, each one-standard-deviation increase in MMS-32 was associated with approximately 44% higher odds of belonging to the poor-memory group (OR = 1.44; p = 0.019). This weaker performance is consistent with the score having been discovered from an extreme Very bad versus Very good phenotype.

Table 2.
Discriminatory performance of the frozen MMS-32 score in the male evaluation dataset.
| Memory contrast | Poor-memory n | Better-memory n | AUC | 95% bootstrap CI | Mann-Whitney p |
|---|---|---|---|---|---|
| Very bad vs Very good | 16 | 66 | 0.861 | 0.736–0.957 | 8.50 × 10⁻⁶ |
| Bad/Very bad vs Good/Very good | 76 | 207 | 0.603 | 0.529–0.678 | 0.0079 |
3.4. MMS-32 Has Negligible Linear Dependence on Chronological Age
Across all 1,044 male samples, the Pearson correlation between MMS-32 and chronological age was r = −0.0465 (p = 0.133). Linear regression yielded R2 = 0.00217, indicating that chronological age explained approximately 0.22% of the linear variance in MMS-32. The fitted slope was −0.000216 MMS-32 units per year (Figure 3).
Spearman correlation detected a weak inverse monotonic association (ρ = −0.113, p = 0.00027), demonstrating that age dependence was not mathematically zero despite the negligible linear R2. A sensitivity analysis restricted to participants aged ≥18 years produced a similarly small linear association (Pearson r = −0.057, p = 0.065; R2 = 0.00329). These findings, together with the non-significant age term in the extreme-memory logistic model, indicate that MMS-32 does not behave as a chronological-age estimator.
3.5. Frozen CpG Coefficient Profile
MMS-32 contains both positive and negative coefficients because the algorithm captures a multivariate pattern rather than global hypermethylation or hypomethylation. The complete frozen coefficient set is provided in Supplementary Table S1 and visualized in Supplementary Figure S1. No coefficient was altered according to chronological age or any non-memory health phenotype.
4. Discussion
This study describes MMS-32, a frozen 32-CpG salivary DNA methylation score associated with a single-item subjective memory questionnaire. The strongest finding was the separation of the two extreme response groups: MMS-32 discriminated Very bad from Very good memory with an AUC of 0.861 in the male evaluation dataset. A weaker but statistically significant association remained when the phenotype was broadened to Bad/Very bad versus Good/Very good. These results are consistent with a score whose discovery design deliberately maximized phenotypic contrast at the extremes.
The result should be interpreted as concurrent classification of a subjective memory phenotype, not as prospective prediction of cognitive decline. Subjective memory complaints have clinical and epidemiological relevance, and meta-analytic studies have associated subjective cognitive decline with increased future risk of mild cognitive impairment and dementia [5,6,7]. The relationship between subjective and objective cognition is imperfect, and simple self-report responses are influenced by many factors beyond neurological disease. MMS-32 should therefore be described as a memory-associated epigenetic signature until it has been tested against validated objective cognitive measures and longitudinal outcomes. The recent AD-DMI study provides a useful disease-oriented comparison: a brain-derived 100-CpG methylation index was associated with objective cognition, AD neuropathology, clinical diagnosis, and subjective memory complaints [11]. MMS-32 differs fundamentally in tissue, phenotype, and intended interpretation, but these findings strengthen the rationale for testing it against objective cognitive and neurological endpoints.
The near absence of linear age dependence is an important feature of the score. Chronological age explained only 0.22% of MMS-32 variance in the supplied male data, and the score remained associated with the extreme memory contrast after adjustment for age while age itself was not associated with that contrast. This makes MMS-32 conceptually distinct from epigenetic clocks, which are explicitly optimized to predict chronological or biological ageing. The weak but statistically significant Spearman correlation with age should nevertheless be retained in reporting: the score is practically age-independent in linear variance terms, not mathematically unrelated to age. Recent work linking DunedinPACE to self-reported daily memory lapses further illustrates this distinction. Jang et al. found no significant overall main effect of DunedinPACE on daily memory lapses, but identified a chronological-age interaction in which faster epigenetic ageing was associated with more prospective memory difficulties and greater reported impact among adults aged 40–49 years [13]. This age-dependent pattern contrasts with the negligible linear relationship between MMS-32 and chronological age observed here and reinforces the interpretation of MMS-32 as a phenotype-associated methylation score rather than an ageing clock.
The present work is also consistent with broader literature linking peripheral DNAm to cognition. Previous EWAS studies have reported associations with global cognition, verbal fluency, processing speed, spatial ability, and working memory [2,3], and multivariate blood DNAm scores have shown external association with measured cognitive ability [4]. Epigenetic-g has subsequently been associated with cognitive performance in a large, diverse cohort of older US adults [10]. Cross-tissue work further showed moderate blood-saliva agreement for Epigenetic-g (ICC = 0.69) after cell-composition correction [12]. MMS-32 differs from these studies by being derived directly in saliva and by targeting a subjective-memory phenotype. The use of saliva increases practical scalability, but it also introduces tissue-composition considerations because saliva contains varying epithelial and immune fractions [8,9]. Replication should therefore document and, where possible, account for saliva cell composition.
The reduction from the original 1,000 candidate CpGs to a compact panel was motivated by the observation that weaker discovery hits diluted discrimination in the male dataset. The final 32-CpG rule was intentionally simple: include all candidate CpGs with independent-discovery p < 1 × 10⁻⁴ and retain the signed discovery direction. This strategy avoids selecting individual CpGs according to their male outcome association. The choice to freeze a reduced panel was made after reduced-panel performance had been examined in the male dataset. Consequently, the AUC reported here is not a fully untouched confirmatory performance estimate for the final 32-site panel. The most important next methodological step is therefore to apply MMS-32 v1.0 without any modification to a new cohort.
A second limitation is the small size of the Very bad group in the male evaluation dataset (n = 16), which widens uncertainty around the AUC and may make the result sensitive to individual observations. The broad poor-versus-better memory analysis, although based on a larger sample, yielded more modest discrimination. This pattern may indicate true biological concentration at the extreme phenotype, but it may also reflect subjective classification noise in the intermediate response categories.
A further limitation is the discovery CpGs were candidate-screening signals rather than individually established epigenome-wide-significant loci. The scientific claim is about the combined performance of a frozen multivariate signature, not about definitive biological causality at individual CpGs. Mechanistic interpretation of individual loci should be treated as a separate follow-up analysis, these are available within Table 3.
Despite these limitations, the study has several strengths. The discovery contrast contained more than 3,500 observations, the final algorithm is mathematically transparent, all 32 CpGs were available in all 1,044 male samples, the score has been version-frozen, and its linear dependence on chronological age is negligible. These characteristics make MMS-32 straightforward to test prospectively in external datasets.
5. Conclusions
MMS-32 is a frozen 32-CpG salivary DNA methylation score associated with subjective memory performance. In a separate male evaluation dataset, the score showed strong discrimination of Very bad versus Very good memory (AUC = 0.861) and modest discrimination of a broader poor-versus-better memory contrast (AUC = 0.603). Chronological age explained only approximately 0.22% of MMS-32 variance linearly, supporting the interpretation that MMS-32 is a memory-associated methylation signature rather than a biological-age score. The algorithm should now be evaluated without modification in independent cohorts containing the same questionnaire and, ideally, objective cognitive testing and longitudinal follow-up.
Supplementary Materials
The following supporting information can be downloaded at the website of this paper posted on Preprints.org. Supplementary Table S1 contains the frozen MMS-32 CpG identifiers, discovery statistics, centering values, and normalized weights. Supplementary Figure S1 shows the frozen coefficient profile.
Author Contributions
CC: Methods, Data Analysis, Conceptualization; SA: Proofreading, Analysis, Clinical Viability.
Funding
This research received no external funding.
Institutional Review Board Statement
This study was completed in accordance with standard retrospective ethical study, ethical approval is not required for studies based on “previously collected data for research”, which this work falls under. The data used within this study are defined as secondary due to the data being previously collected via Muhdo’s normal day-to-day operations; these data were not specifically collected for this study. This work was conducted according to the guidelines of the Declaration of Helsinki, and all participants gave written informed consent via Muhdo Health Ltd. for data to be anonymized and utilized for research and publication (clients chose to opt in). Muhdo Health company is GDPR-compliant and registered in the U.K.
Data Availability Statement
Summary-level discovery statistics for the 1,000 candidate CpGs and the complete frozen MMS-32 coefficients are provided with the article. Participant-level methylation and questionnaire data are not publicly deposited because they constitute individual-level molecular and health information. Access may be considered subject to applicable consent, privacy, and governance requirements.
Acknowledgments
The authors acknowledge the participants whose anonymized saliva and questionnaire data contributed to this analysis and Muhdo Health Ltd for provision of the fully anonymized datasets used in the study.
Conflicts of Interest
Christopher Collins is affiliated with Muhdo Health Ltd., which provided the anonymized data used in this study. Muhdo Health operates in the DNA and epigenetic testing sector. No external funding was received for this work. Saima Ajaz declares no competing interests. Data were made available via the Muhdo Health Data repository, and all authors freely used uncompensated personal time to complete the paper. All data are accessible via Muhdo Health Ltd. All data are available via the Supplemental Information supplied.
References
- Pidsley, R.; Zotenko, E.; Peters, T.J.; Lawrence, M.G.; Risbridger, G.P.; Molloy, P.; Van Dijk, S.; Muhlhausler, B.; Stirzaker, C.; Clark, S.J. Critical evaluation of the Illumina MethylationEPIC BeadChip microarray for whole-genome DNA methylation profiling. Genome Biol. 2016, 17, 208. [Google Scholar] [CrossRef]
- Marioni, R.E.; McRae, A.F.; Bressler, J.; Colicino, E.; Hannon, E.; Li, S.; Prada, D.; Smith, J.A.; Trevisi, L.; Tsai, P.-C.; et al. Meta-analysis of epigenome-wide association studies of cognitive abilities. Mol. Psychiatry 2018, 23, 2133–2144. [Google Scholar] [CrossRef]
- Karlsson, I.K.; Ericsson, M.; Wang, Y.; Jylhava, J.; Hagg, S.; Dahl Aslan, A.K.; Reynolds, C.A.; Pedersen, N.L. Epigenome-wide association study of level and change in cognitive abilities from midlife through late life. Clin. Epigenet. 2021, 13, 85. [Google Scholar] [CrossRef]
- McCartney, D.L.; Hillary, R.F.; Conole, E.L.S.; Trejo Banos, D.; Gadd, D.A.; Walker, R.M.; Nangle, C.; Flaig, R.; Campbell, A.; Murray, A.D.; et al. Blood-based epigenome-wide analyses of cognitive abilities. Genome Biol. 2022, 23, 26. [Google Scholar] [CrossRef]
- Mitchell, A.J.; Beaumont, H.; Ferguson, D.; Yadegarfar, M.; Stubbs, B. Risk of dementia and mild cognitive impairment in older people with subjective memory complaints: Meta-analysis. Acta Psychiatr. Scand. 2014, 130, 439–451. [Google Scholar] [CrossRef]
- Wang, X.-T.; Wang, Z.-T.; Hu, H.-Y.; Qu, Y.; Wang, M.; Shen, X.-N.; Xu, W.; Dong, Q.; Tan, L.; Yu, J.-T. Association of subjective cognitive decline with risk of cognitive impairment and dementia: A systematic review and meta-analysis of prospective longitudinal studies. J. Prev. Alzheimers Dis. 2021, 8, 277–285. [Google Scholar] [CrossRef]
- Pike, K.E.; Cavuoto, M.G.; Li, L.; Wright, B.J.; Kinsella, G.J. Subjective cognitive decline: Level of risk for future dementia and mild cognitive impairment, a meta-analysis of longitudinal studies. Neuropsychol. Rev. 2022, 32, 703–735. [Google Scholar] [CrossRef]
- Middleton, L.Y.M.; Dou, J.; Fisher, J.; Heiss, J.A.; Nguyen, V.K.; Just, A.C.; Faul, J.; Ware, E.B.; Mitchell, C.; Colacino, J.A.; Bakulski, K.M. Saliva cell type DNA methylation reference panel for epidemiological studies in children. Epigenetics 2022, 17, 161–177. [Google Scholar] [CrossRef]
- Wong, Y.T.; Tayeb, M.A.; Stone, T.C.; Lovat, L.B.; Teschendorff, A.E.; Iwasiow, R.; Craig, J.M. A comparison of epithelial cell content of oral samples estimated using cytology and DNA methylation. Epigenetics 2022, 17, 327–334. [Google Scholar] [CrossRef]
- Faul, J.D.; Collins, S.; Smith, T.; Klopack, E.T.; Mitchell, C.; Crimmins, E.M.; Farina, M.P. Epigenetic g predicts cognitive function in a diverse, nationally representative sample of older adults. Clin. Epigenet. 2026, 18, 126. [Google Scholar] [CrossRef]
- Jiakponnah, N.N.; Biose, I.J.; Fischer, T.; Cherry, K.; Cronin, J.; Jazwinski, S.M.; Kim, S. Alzheimer's disease DNA methylation index (AD-DMI) and its association with late-life cognitive function. npj Dement. 2026, 2, 33. [Google Scholar] [CrossRef]
- Zarandooz, S.; Raffington, L. Applying blood-derived epigenetic algorithms to saliva: Cross-tissue similarity of DNA-methylation indices of aging, physiology, and cognition. Clin. Epigenet. 2025, 17, 61. [Google Scholar] [CrossRef]
- Jang, H.; Holmberg, J.C.; Nicholson, J.S.; Shannon, F.R.; Cerino, E.S.; Chai, H.W.; Charles, S.T.; Almeida, D.M. Linking Epigenetic Age Acceleration to Self-Reported Daily Memory Lapses: Evidence from the National Study of Daily Experiences. J. Gerontol. A Biol. Sci. Med. Sci. 2026, glag202. [Google Scholar] [CrossRef]
Figure 1.
MMS-32 distribution across the five subjective memory categories. Boxplots show the median and interquartile range; jittered points show individual participants. Higher MMS-32 indicates a more Very-bad-memory-like methylation pattern.
Figure 1.
MMS-32 distribution across the five subjective memory categories. Boxplots show the median and interquartile range; jittered points show individual participants. Higher MMS-32 indicates a more Very-bad-memory-like methylation pattern.
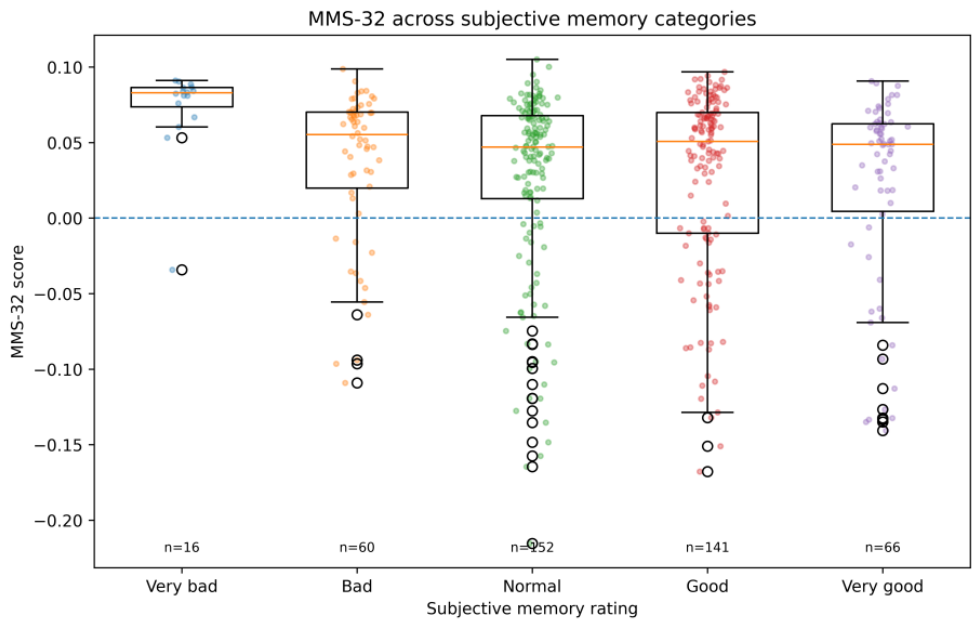
Figure 2.
Receiver-operating-characteristic curve for MMS-32 discrimination of Very bad versus Very good subjective memory in the male evaluation dataset. AUC = 0.861; 95% bootstrap CI 0.736–0.957.
Figure 2.
Receiver-operating-characteristic curve for MMS-32 discrimination of Very bad versus Very good subjective memory in the male evaluation dataset. AUC = 0.861; 95% bootstrap CI 0.736–0.957.
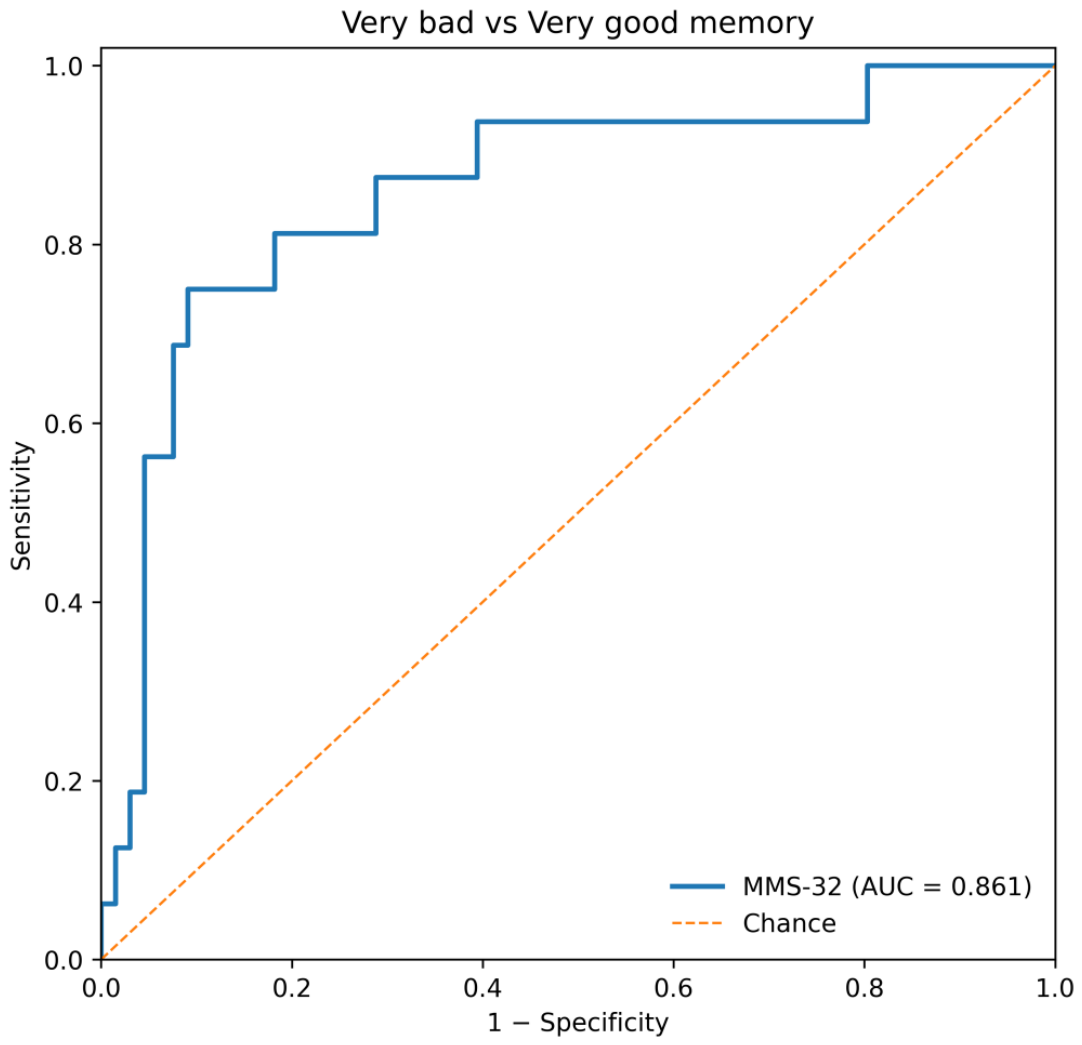
Figure 3.
Relationship between MMS-32 and chronological age across all 1,044 male samples. The linear association was negligible (Pearson r = −0.047; R2 = 0.0022). A sensitivity analysis restricted to age ≥18 years yielded R2 = 0.0033.
Figure 3.
Relationship between MMS-32 and chronological age across all 1,044 male samples. The linear association was negligible (Pearson r = −0.047; R2 = 0.0022). A sensitivity analysis restricted to age ≥18 years yielded R2 = 0.0033.
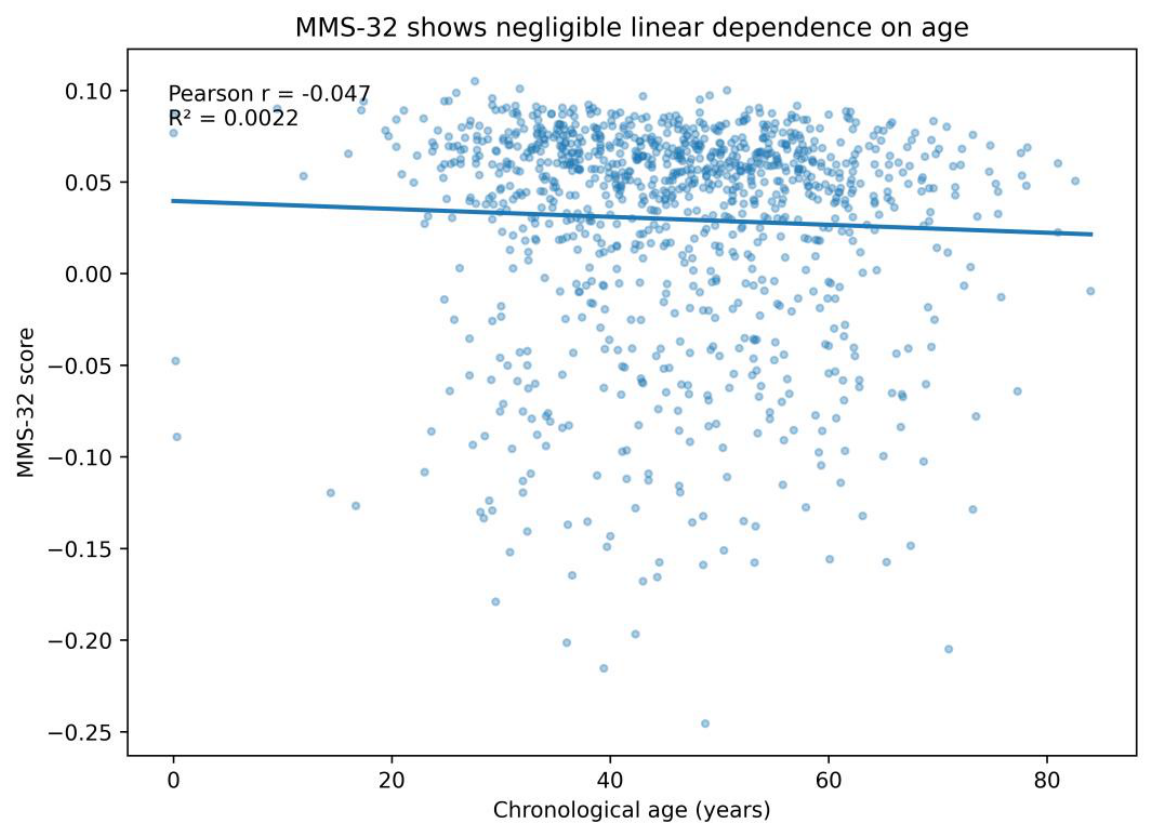
Table 1.
MMS-32 distribution across single-response subjective memory categories in the male evaluation dataset.
Table 1.
MMS-32 distribution across single-response subjective memory categories in the male evaluation dataset.
| Memory category | n | Mean MMS-32 | Median MMS-32 | SD |
|---|---|---|---|---|
| Very bad | 16 | 0.0725 | 0.0829 | 0.0304 |
| Bad | 60 | 0.0364 | 0.0552 | 0.0507 |
| Normal | 152 | 0.0255 | 0.0469 | 0.0627 |
| Good | 141 | 0.0268 | 0.0508 | 0.0616 |
| Very good | 66 | 0.0204 | 0.0488 | 0.0647 |
Table 3.
Genomic positions and annotations were obtained from the Illumina manifest (genome build 37/GRCh37). MMS-32 weights were frozen from the independent subjective-memory discovery analysis; positive weights indicate that higher methylation increases the poor-memory score, whereas negative weights indicate that lower methylation increases the poor-memory score.
Table 3.
Genomic positions and annotations were obtained from the Illumina manifest (genome build 37/GRCh37). MMS-32 weights were frozen from the independent subjective-memory discovery analysis; positive weights indicate that higher methylation increases the poor-memory score, whereas negative weights indicate that lower methylation increases the poor-memory score.
| Rank | CpG | Chromosome | Position (GRCh37/hg19) | UCSC RefGene | Gene region | CpG island relation | Frozen MMS-32 weight | MMS-32 direction |
|---|---|---|---|---|---|---|---|---|
| 1 | cg20355779 | 14 | 1.02E+08 | DYNC1H1 | Body | — | -0.01992 | Lower methylation → poorer-memory score |
| 2 | cg02159489 | 17 | 79459563 | — | — | S_Shelf | 0.046421 | Higher methylation → poorer-memory score |
| 3 | cg07258983 | 18 | 42255459 | — | — | N_Shelf | 0.084126 | Higher methylation → poorer-memory score |
| 4 | cg26734668 | 19 | 58111094 | ZNF530 | TSS200 | N_Shore | -0.01832 | Lower methylation → poorer-memory score |
| 5 | cg22747507 | 4 | 1.76E+08 | GLRA3 | Body | — | 0.039217429968875055 | Higher methylation → poorer-memory score |
| 6 | cg19366178 | 15 | 52484857 | MYO5C; GNB5 | 3'UTR; TSS1500 | — | 0.031480658070253444 | Higher methylation → poorer-memory score |
| 7 | cg02893604 | 14 | 23512805 | PSMB11 | 3'UTR; 1stExon | — | 0.023655 | Higher methylation → poorer-memory score |
| 8 | cg07055687 | 8 | 53926865 | — | — | — | 0.036639 | Higher methylation → poorer-memory score |
| 9 | cg19548470 | 18 | 3880510 | DLGAP1 | TSS1500 | S_Shore | 0.028012449977767896 | Higher methylation → poorer-memory score |
| 10 | cg03045635 | 4 | 9783198 | DRD5 | TSS200 | Island | -0.02526 | Lower methylation → poorer-memory score |
| 11 | cg01105418 | 1 | 2.44E+08 | ZNF238 | 1stExon; 5'UTR | S_Shore | 0.050689195197865716 | Higher methylation → poorer-memory score |
| 12 | cg14258236 | 6 | 29323330 | OR5V1 | 1stExon | — | 0.01992 | Higher methylation → poorer-memory score |
| 13 | cg04546573 | 2 | 1.89E+08 | GULP1 | 5'UTR | — | 0.033437 | Higher methylation → poorer-memory score |
| 14 | cg05059613 | 2 | 2.25E+08 | MRPL44 | TSS200 | Island | -0.03664 | Lower methylation → poorer-memory score |
| 15 | cg23432707 | 8 | 97278556 | PTDSS1 | Body | S_Shelf | 0.028812805691418406 | Higher methylation → poorer-memory score |
| 16 | cg05852337 | 16 | 19349832 | — | — | — | 0.031659 | Higher methylation → poorer-memory score |
| 17 | cg19903738 | 4 | 71069600 | ODAM | 3'UTR | — | 0.04313 | Higher methylation → poorer-memory score |
| 18 | cg07731047 | 11 | 1994977 | — | — | S_Shelf | 0.032814584259670966 | Higher methylation → poorer-memory score |
| 19 | cg19692710 | 11 | 73661920 | DNAJB13 | 1stExon; 5'UTR | — | 0.026678523788350377 | Higher methylation → poorer-memory score |
| 20 | cg08214584 | 17 | 68166140 | KCNJ2 | 5'UTR | S_Shore | -0.00871 | Lower methylation → poorer-memory score |
| 21 | cg03372205 | 2 | 1.2E+08 | — | — | S_Shelf | 0.036727 | Higher methylation → poorer-memory score |
| 22 | cg10874644 | 5 | 83898708 | — | — | — | 0.041441 | Higher methylation → poorer-memory score |
| 23 | cg08814536 | 13 | 1.07E+08 | — | — | — | 0.03735 | Higher methylation → poorer-memory score |
| 24 | cg13690785 | 11 | 72521478 | — | — | N_Shelf | 0.022587816807469983 | Higher methylation → poorer-memory score |
| 25 | cg27309871 | 11 | 86224410 | ME3 | Body | — | 0.036816 | Higher methylation → poorer-memory score |
| 26 | cg22409276 | 15 | 40763763 | CHST14 | 1stExon | Island | -0.00791 | Lower methylation → poorer-memory score |
| 27 | cg13608166 | 18 | 77157986 | NFATC1 | Body; 5'UTR | Island | 0.019208537127612273 | Higher methylation → poorer-memory score |
| 28 | cg15920472 | 7 | 23827492 | STK31 | Body | — | 0.040818 | Higher methylation → poorer-memory score |
| 29 | cg10508317 | 17 | 76355146 | SOCS3 | Body | Island | -0.01592 | Lower methylation → poorer-memory score |
| 30 | cg21816330 | 17 | 27044629 | RAB34 | Body; 5'UTR; 1stExon | Island | -0.01654 | Lower methylation → poorer-memory score |
| 31 | cg14721981 | 20 | 21381070 | — | — | S_Shelf | 0.048822 | Higher methylation → poorer-memory score |
| 32 | cg06530960 | 19 | 49140787 | SEC1; DBP | TSS1500; TSS200 | Island | -0.01032 | Lower methylation → poorer-memory score |
Disclaimer/Publisher’s Note: The statements, opinions and data contained in all publications are solely those of the individual author(s) and contributor(s) and not of MDPI and/or the editor(s). MDPI and/or the editor(s) disclaim responsibility for any injury to people or property resulting from any ideas, methods, instructions or products referred to in the content. |
© 2026 by the authors. Licensee MDPI, Basel, Switzerland. This article is an open access article distributed under the terms and conditions of the Creative Commons Attribution (CC BY) license (http://creativecommons.org/licenses/by/4.0/).
Copyright: This open access article is published under a Creative Commons CC BY 4.0 license, which permit the free download, distribution, and reuse, provided that the author and preprint are cited in any reuse.