
Submitted:
25 August 2026
Posted:
27 August 2026
You are already at the latest version
Abstract
The Lokbatan field, located in the Absheron Peninsula, represents an important example of the spatial and genetic association between hydrocarbon reservoirs and active mud volcanism. This study investigates the long-term evolution of Horizon VIII of the Lokbatan field and examines the relationship between reservoir development, production dynamics, and mud volcano activity. Historical production and reservoir data covering 1934–2024 were integrated with documented eruptive events. The dynamics of oil, water, liquid, and gas production, gas factor, and water cut were evaluated using Shewhart statistical control charts to identify long-term shifts in the production regime and deviations from established control ranges. The results reveal a pronounced transition from an early stage of intensive hydrocarbon production to a mature stage characterized by strongly depleted production conditions. Oil production reached exceptionally high values during the initial development period but subsequently declined and remained close to or below the lower control limit during the later decades. Liquid and water production also showed a long-term reduction, whereas water cut evolved toward a persistently high, water-dominated production regime, reaching a maximum of 94.9% in 1993 and remaining above 80% during most of the recent development period. Gas production and gas factor exhibited an overall decline, although the gas factor showed an exceptional increase during 1995–1997, reaching 871 m3/t in 1996. The analysis further indicates that intensive hydrocarbon extraction was associated with changes in the frequency and character of mud volcanic eruptions, whereas available monitoring data show no measurable short-term effect of individual eruptions on reservoir pressure or well productivity. The novelty of this study lies in integrating long-term reservoir performance indicators with Shewhart statistical process control and historical mud-volcano activity within a single analytical framework. This approach makes it possible to identify major transitions in the development regime of a mature hydrocarbon field while assessing its interaction with an active mud-volcanic system. The Lokbatan field thus provides a valuable case study of long-term reservoir depletion, increasing water dominance, changing gas behavior, and reservoir–mud volcano interaction in a tectonically active petroleum system.
Keywords:
mud volcano
; petroleum and natural gas
; eruption intensity
; hydrocarbon extraction
; oil and gas accumulations
; Lokbatan field
; oil production
1. Introduction
Mud volcanoes, as well as other hydrocarbon seeps, provided the first clues to drive petroleum and natural gas exploration by the modern fossil fuel industry. Even if many surface seeps may not be linked with economic subsurface petroleum reservoirs, many large onshore hydrocarbon fields were discovered after drilling around mud volcanoes in Europe, the Caspian Basin, Asia and the Caribbean [1].
Just as mud volcanoes are the main mechanism that creates the process of migration of hydrocarbons in a three-dimensional geological environment. At the same time, eruptive channels of mud volcanoes and tensile cracks created by the process of formation of diapiric structures serve as migration channels. If we take into account that almost all oil fields located in the territory of mud volcanism development are complicated by eruptive channels of mud volcanoes [2].
The thermogenic nature of most of mud volcanoes is well related to the relatively high thermal maturity of gas-generating organic-rich rocks [1]. The Lokbatan mud volcano represents a typical example of thermogenic mud volcanism, which is determined by its genetic relationship with deep-seated oil and gas complexes of the Absheron Peninsula [3,4,5,6,7,8,9,10]. Gases released during eruptive events are predominantly of thermogenic origin, including relatively enriched δ13C values of methane and corresponding δD compositions, which distinguish them from shallow biogenic sources, formed as a result of thermal decomposition of organic matter within sedimentary rocks under elevated temperature and pressure conditions.
Methane and associated hydrocarbon gases generated in the deeply buried strata of the Lokbatan field play a dominant role in feeding the volcanic system. These gases migrate upward along fault zones and tectonically weakened structures, leading to the development of excess pore pressure. When critical pressure thresholds are exceeded, gas–mud mixtures are expelled to the surface, frequently accompanied by spontaneous methane ignition.
Thus, the thermogenic character of the Lokbatan mud volcano is confirmed by its close association with hydrocarbon-bearing structures, the dominance of methane-rich gases, the high pressure-temperature conditions of gas generation, and the recurrent occurrence of flame during eruptive activity.
At the same time Lokbatan is one of the most active MVs that periodically erupt with a cycle of ~5-8 years. The first documented eruption of Lokbatan dates back to 1829. Other major eruptions have been documented in 1829, 1850, 1887, 1890, 1900, 1904, 1915, 1918, 1923, 1926, 1933, 1935, 1938, 1941, 1954, 1959, 1972, 1977, 2001, 2012, 2017, 2018, 2022 [2].
2. Geological Setting
The Lokbatan area is located within a highly deformed zone of the South Caspian Basin, characterized by thick Cenozoic sedimentary sequences (Productive Series (Lower Pliocene, Miocene) [11,12,13] and intense faulting. The petroleum system [14,15,16] is dominated by overpressured clastic reservoirs, where hydrocarbons are generated and accumulated under active tectonic conditions. The Lokbatan mud volcano is spatially and genetically associated with this structure (Figure 1).
2.1. Mechanisms of Mud Volcanic Interaction in the Lokbatan Field
The Lokbatan, the most active mud volcano in the world [17] serves as a vertical conduit for methane-rich gases, formation waters, and fine-grained sediments, providing a natural pressure-relief mechanism for the deeply buried hydrocarbon-bearing strata of the Lokbatan field (Figure 2). Historical eruptions, ranging from low-intensity mud extrusions to high-energy gas-dominated events with surface combustion, reflect episodic overpressure release and the dynamic connectivity between deep reservoirs and surface conduits. Morphological changes, such as the formation of new mud cones, indicate the reorganization of migration pathways and localized impacts on reservoir pressure and fluid distribution. These processes highlight the volcano’s dual role as both a regulator of subsurface pressures and an indicator of the ongoing hydrocarbon migration within the Lokbatan petroleum system.
2.1.1. The 1850 Eruption of the Lokbatan Mud Volcano and Its Relation to the Lokbatan Field
The eruption documented in 1850 represents the earliest recorded manifestation of mud volcanic activity at the Lokbatan structure and provides important insight into the early evolution of the Lokbatan petroleum system. Although quantitative observations from this period are limited, historical descriptions indicate the extrusion of mud and gas at the surface, reflecting the release of overpressured fluids from subsurface sedimentary formations.
This initial eruption is interpreted as the surface expression of active hydrocarbon migration from deep reservoirs and source intervals associated with the Lokbatan field. Elevated pore pressure within fine-grained, hydrocarbon-bearing sediments likely promoted upward fluid movement along fault-controlled pathways, resulting in localized mud extrusion. The absence of reported sustained combustion suggests that gas concentrations were sufficient to drive eruption but not to produce prolonged ignition.
From a petroleum geological perspective, the 1850 event is significant as it marks the earliest evidence of pressure-driven fluid communication between the subsurface reservoirs and the surface. This eruption indicates that the petroleum system was already active at that time, with ongoing hydrocarbon generation and migration processes. Consequently, the 1850 eruption established the Lokbatan mud volcano as a key indicator of the dynamic behavior of the Lokbatan field, providing a foundation for understanding later, more energetic eruptive episodes.
2.1.2. The 1887 Eruption of the Lokbatan Mud Volcano and Its Relation to the Lokbatan Field
The eruption that occurred in 1887 represents one of the earliest high-energy manifestations of the Lokbatan mud volcano and provides clear evidence of intensified gas migration within the Lokbatan petroleum system. Historical records indicate that this eruptive episode was accompanied by the ignition of methane-rich gases, resulting in visible flames at the surface.
The presence of combustion suggests a substantial concentration of hydrocarbons ascending from depth, most likely sourced from gas-saturated sedimentary horizons associated with the Lokbatan field. Elevated pore pressures within these formations would have facilitated rapid upward gas migration along fault zones and fractured intervals, ultimately leading to surface release and ignition.
From a geological perspective, the 1887 eruption indicates a transition from relatively low-intensity mud extrusion, as observed in earlier events, to a more gas-dominated eruptive regime. This shift reflects increasing pressure buildup and enhanced connectivity between deep reservoirs and the surface. The eruption demonstrates that by the late 19th century, the petroleum system was already well developed and actively expelling hydrocarbons through the mud volcanic conduit.
In the context of field evaluation, the 1887 event underscores the role of the Lokbatan mud volcano as a natural indicator of gas-rich zones and active migration pathways within the Lokbatan structure. Such eruptions highlight both the potential productivity of the underlying hydrocarbon system and the geological risks associated with pressure release and gas leakage along tectonically weakened zones.
2.1.3. The 1972 Eruption of the Lokbatan Mud Volcano and Its Relation to the Lokbatan Field
The eruption of 1972 is recognized as one of the most powerful and geodynamically significant events in the recorded history of the Lokbatan mud volcano. This eruptive episode was characterized by the violent discharge of gas and mud, accompanied by sustained combustion, which produced a combined column of flame and erupted material exceeding 300 meters in height. Such intensity indicates extreme overpressure conditions within the subsurface sedimentary sequence.
The 1972 eruption is genetically linked to the Lokbatan oil and gas field and reflects a major pressure release from deeply buried hydrocarbon-bearing formations. High concentrations of methane and other light hydrocarbons migrated rapidly upward along major fault systems and fracture networks that connect the reservoirs with the surface. The magnitude of the eruption suggests a temporary loss of pressure containment within the petroleum system.
From a reservoir and structural geology perspective, this event represents a critical stage in the evolution of the Lokbatan field. The abrupt decompression likely caused localized pressure redistribution within adjacent reservoirs and may have affected fluid saturation and permeability in structurally disturbed zones. The eruption also demonstrates the efficiency of the Lokbatan mud volcano as a vertical conduit for large volumes of hydrocarbons under extreme pressure conditions.
The 1972 event holds particular significance for hydrocarbon exploration and field development, as it clearly illustrates the dynamic and unstable nature of overpressured systems in the region. The scale and intensity of the eruption confirm the presence of an active, gas-rich petroleum system [18,19,20] and emphasize the necessity of incorporating mud volcanic activity into geological, geomechanical, and risk assessment models for the Lokbatan field.
2.1.4. The 1998 Eruption of the Lokbatan Mud Volcano and Its Relation to the Lokbatan Field
The 1998 eruptive episode represents a significant morphological and structural phase in the evolution of the Lokbatan mud volcano. Unlike earlier gas-dominated eruptions, this event was characterized by substantial mud extrusion that led to the formation of new mud cones and vents at the surface. Such surface deformation indicates sustained fluid discharge rather than a short-lived explosive release.
The eruption is genetically associated with the Lokbatan oil and gas field and reflects continued upward migration of overpressured fluids from hydrocarbon-bearing strata. Elevated pore pressures within fine-grained reservoir-adjacent sediments likely promoted prolonged mud ascent along fault-controlled pathways, resulting in the construction of new volcanic edifices. The absence of reported intense combustion suggests a relatively lower gas-to-mud ratio compared to earlier high-energy events.
From a petroleum geological standpoint, the 1998 eruption demonstrates the ability of the mud volcanic system to reorganize surface and near-surface structures in response to subsurface pressure conditions. The development of new mud cones implies the reactivation or creation of additional migration pathways, which may influence reservoir connectivity and seal integrity in structurally complex zones of the Lokbatan field.
Overall, the 1998 eruption highlights the transitional behavior of the Lokbatan mud volcano, emphasizing its role not only as a pressure-release mechanism but also as a geomorphological agent. This event provides important evidence of long-term fluid migration processes within the petroleum system and underscores the need to consider mud volcanic evolution in reservoir characterization and field development planning.
2.1.5. The 2001 Activity of the Lokbatan Mud Volcano and Its Relation to the Lokbatan Field
The 2001 eruptive phase of the Lokbatan mud volcano was distinguished by its prolonged duration, with active mud and gas emissions persisting over several consecutive days. This sustained behavior contrasts with short-lived explosive events and indicates a continuous release of subsurface fluids rather than a single episode of abrupt pressure failure (Figure 3).
The prolonged activity is genetically linked to the Lokbatan oil and gas field and reflects steady upward migration of hydrocarbons and formation fluids from overpressured sedimentary intervals. The persistence of emissions suggests the existence of an open and well-established conduit system connecting deep reservoirs with the surface. Such conduits are typically controlled by fault zones and fracture networks that facilitate long-term fluid flow.
From a reservoir dynamics perspective, the 2001 activity likely contributed to gradual pressure redistribution within nearby hydrocarbon accumulations. Although the event did not exhibit extreme eruptive intensity or widespread combustion, continuous degassing may have affected local pressure gradients and fluid saturation in structurally disturbed zones adjacent to the mud volcanic system.
The 2001 episode underscores the role of the Lokbatan mud volcano as an efficient and persistent degassing mechanism within the Lokbatan petroleum system. Its sustained nature provides valuable evidence of ongoing hydrocarbon generation and migration processes and highlights the importance of incorporating long-duration mud volcanic activity into reservoir evaluation, drilling risk assessment, and field development strategies.
2.1.6. The 2018 Eruption of the Lokbatan Mud Volcano and Its Relation to the Lokbatan Field
The eruptive event recorded in November 2018 represents one of the most recent and well-documented manifestations of activity at the Lokbatan mud volcano. This eruption was characterized by intense gas discharge accompanied by surface ignition, resulting in visible flames and the extrusion of mud and fragmented sedimentary material. Although shorter in duration than some historical events, the eruption demonstrated a relatively high level of eruptive energy.
The 2018 eruption is genetically linked to the Lokbatan oil and gas field and reflects renewed pressure accumulation within hydrocarbon-bearing formations at depth. Elevated concentrations of methane-rich gas migrated rapidly upward through fault-controlled pathways and pre-existing volcanic conduits, leading to surface release and combustion. The presence of flame indicates a gas-dominated eruptive regime and efficient connectivity between the subsurface reservoirs and the surface.
From a reservoir and petroleum system perspective, this event suggests localized overpressure conditions and dynamic fluid redistribution within structurally disturbed zones of the Lokbatan field. While the eruption did not result in significant long-term surface damage, it highlights the potential for sudden pressure release and gas leakage in areas proximal to active mud volcanic structures.
The 2018 eruption confirms the continuing activity of the Lokbatan mud volcano and its role as a surface expression of an active petroleum system. This event emphasizes the importance of integrating mud volcanic monitoring into geological modeling and risk assessment frameworks to ensure safe and efficient hydrocarbon field development.
2.1.7. The 2022 Eruption of the Lokbatan Mud Volcano and Its Relation to the Lokbatan Field
The eruptive episode recorded in 2022 represents a short-duration but clearly expressed phase of activity at the Lokbatan mud volcano. The event was characterized by a rapid discharge of mud and gas, accompanied by brief surface ignition. The eruptive phase lasted approximately ten minutes, indicating a sudden release of accumulated subsurface pressure rather than prolonged fluid expulsion.
This eruption is genetically associated with the Lokbatan oil and gas field and reflects localized pressure buildup within hydrocarbon-bearing sedimentary units. Methane-rich gases migrated upward through pre-existing fault systems and volcanic conduits, leading to surface release and short-lived combustion. The limited duration of the event suggests that the pressure was efficiently dissipated through an already established migration pathway.
From a reservoir dynamics perspective, the 2022 eruption likely resulted in minor and spatially confined pressure redistribution within nearby reservoirs. Although the overall impact on field-scale reservoir behavior was limited, the event provides further evidence of the dynamic nature of the petroleum system and the continuous interaction between deep hydrocarbon accumulations and the mud volcanic structure.
The 2022 eruption underscores the role of the Lokbatan mud volcano as a sensitive indicator of short-term pressure fluctuations within the Lokbatan field. Even brief eruptive episodes such as this highlight the importance of ongoing monitoring and the incorporation of mud volcanic activity into geological and geomechanical models to support safe and sustainable hydrocarbon development [21,22,23,24].
Below is a complete table (Table 1) of all known eruptions of the Lokbatan mud volcano, including 2018 and 2022, with a brief description and connection to the Lokbatan field.
2.2. Hydrocarbon Potential of the Lokbatan Field
Within the Lokbatan field, commercial oil and gas accumulations have been identified in both the upper and lower parts of the productive sequence [7]. The hydrocarbon-bearing units include horizons I through VIII (Figure 4).
The main oil-bearing horizons are characterized by high gas-oil ratios, reaching 100-200 m3 per ton, and gas caps are developed in the crestal zones of the fold. In the Pre-Kirmaki suite, whose deposits were encountered in the deeply submerged part of the southern limb of the structure, a gas-condensate reservoir with an underlying oil rim has been identified.
Gas caps are confined to the most elevated structural areas and are commonly associated with longitudinal tectonic faults. On the southern limb, they occur as narrow zones supported by relatively thick oil accumulations. On the northern limb, the gas caps are more extensive, covering areas of up to 30 hectares, and are accompanied by thinner oil rims.
The largest volumes of oil and gas are concentrated in the reservoirs of horizons VII and VIII, whereas the smallest accumulations are found within horizons I to V inclusive.
2.3. Exploration and Appraisal Drilling in the Lokbatan Area
Exploration and appraisal drilling in the Lokbatan area began in 1931. The first exploratory wells were drilled in the eastern part of the structure, at a considerable distance (2-3 km) from the mud volcano. In 1932, Well No. 62, drilled on the eastern periclinal of the structure, produced the first oil gusher in the area from horizon II, with a flow rate of about 1000 tons per day. In the same year, oil-bearing properties of horizons IV and V were confirmed in the eastern part of the field, followed in 1933 by the discovery of oil in horizons VI, VIa, and VII.
A landmark event for the development of exploration activities not only at Lokbatan but also at adjacent fields of the Absheron Peninsula – and later in other mud-volcano-affected oil and gas provinces of Azerbaijan – was the exceptional oil gusher obtained in 1933 from Well No. 45. This well was drilled through mud-volcano breccia at a distance of 1500 m east of the crater. The gusher from horizon VIa reached approximately 20 thousand tons per day. The well remains productive to this day, having yielded more than 250 thousand tons of oil and over 750 million m3 of gas.
In 1934, commercial oil inflows were obtained from the Post-Kirmaki sandy suite (horizon VIII). Thus, within three to four years, drilling confirmed the oil potential of a large stratigraphic interval within the Productive series at the Lokbatan field.
In 1937, drilling commenced on the deeply submerged part of the southern limb of the structure to determine the presence of the Pre-Kirmaki (PK) suite. These operations, carried out intermittently, continued until 1951, when Well No. 840 – drilled 2300 m south of the structural axis – encountered PK suite deposits. Testing at depths of 2912–2929 m resulted in a flow of about 100000 m3 of gas and 6 tons of condensate per day. The accumulation within the PK suite proved to be stratigraphic in nature, associated with up-dip pinch-out of sandy reservoirs [25,26,27,28].
Immediately following the discovery of oil accumulations, commercial oil production began at Lokbatan. In 1932, production amounted to 13.4 thousand tons. By 1933, output increased to 643.7 thousand tons, exceeding 1 million tons in 1934. Production continued to rise, reaching 1871.1 thousand tons in 1937. Subsequently, while remaining relatively high, production gradually declined to 1182.0 thousand tons by 1941. During the war years, the decline accelerated, reaching a minimum of 570.3 thousand tons in 1946. Thereafter, production increased slightly to 743.9 thousand tons in 1951, followed by a steady decline to 147.0 thousand tons by 1972.
Over 40 years of field development, more than 27 million tons of oil were produced from the Productive series strata. During the same period, over 65 million tons of formation water were extracted. In terms of reservoir conditions, the total volume of fluids produced from the Productive series amounted to approximately 100 million m3.
In addition, starting in 1949, free gas production and utilization of gas dissolved in oil were carried out. Total free gas production reached 630 million m3, while 1080 million m3 of dissolved gas were utilized. Overall gas production at the field exceeded 1.7 billion m³.
As a result of prolonged and intensive extraction of hydrocarbons, the oil and gas accumulations at the field became significantly reduced in size, and their original boundaries shifted closer to the crestal part of the structure (see, Figure 3). This process was accompanied by a substantial decline in reservoir pressures. For example, pressure in horizon VII reservoirs decreased from 120 to 43 atm, while in horizon VIII it fell from 130 to 55 atm.
Such pronounced reduction in reservoir size and pressure indicates progressive depletion of the field and a decline in its natural energy potential. This suggests that replenishment of oil and gas accumulations through inflow from mud-volcano feeder systems is insignificant, although the possibility of limited contribution cannot be entirely excluded.
3. Materials and Methods
3.1. Field Production Data
The study was conducted using original field production data from the Lokbatan oil field, Azerbaijan, covering the period from 1934 to 2024. The dataset represents long-term production behavior over approximately nine decades of field development and provides a basis for evaluating changes in production performance during different stages of reservoir exploitation. The Lokbatan field is a mature, multilayered oil field in the South Caspian Basin, with hydrocarbon-bearing intervals developed at different depths and under changing reservoir and production conditions. Industrial-scale oil production from the field was established during the 1930s, followed by continued development of its productive horizons and the subsequent application of secondary recovery measures.
The original production dataset was compiled from field records and includes chronological information on oil production and other available production-performance parameters. The long observation period allows both the initial high-productivity stage and the subsequent mature and late stages of field development to be evaluated within a unified analytical framework. Particular attention was given to the temporal behavior of oil production, because long-term production decline and deviations from the established production regime may provide important information about changes in reservoir performance and operating conditions.
Before statistical analysis, the original production records were subjected to data screening and quality-control procedures. The chronological sequence of observations was preserved, while the dataset was examined for missing values, inconsistent records, anomalous observations, and potential discontinuities related to changes in field operation or data recording. The objective of this preprocessing stage was not to eliminate naturally occurring production fluctuations, but to distinguish potential data-quality problems from genuine variations in field performance. Consequently, observations representing actual changes in production behavior were retained for subsequent statistical analysis.
Where the corresponding production variables were available, the analysis also considered water production and the resulting water cut as indicators of changes in produced-fluid composition. Water cut was calculated according to:
where (WC) is the water cut (%), (Qw) is the water-production rate, and (Qo) is the oil-production rate.
The production data were subsequently used to calculate and evaluate reservoir-performance indicators and to identify periods characterized by significant deviations from the prevailing production behavior. The resulting dataset constituted the primary input for the Statistical Process Control analysis described in Section 3.2.
3.2. Statistical Process Control and Shewhart Control Chart
Statistical Process Control (SPC) was applied to the Lokbatan field production data to identify statistically significant deviations from the established production behavior. In contrast to conventional production-trend analysis, which primarily describes changes in the magnitude and direction of a variable, SPC provides a statistical framework for distinguishing expected process variation from unusually large deviations that may indicate changes in the underlying production system.
The Shewhart control-chart method was selected because the study focuses on the identification of relatively large and immediate deviations in long-term production performance. For each monitored production indicator, the observations were arranged chronologically and evaluated against a central line and statistically defined control limits. The central line was calculated as the arithmetic mean of the analyzed observations:
CL=
where is the mean value of the monitored production variable.
For a standard Shewhart control chart, the upper and lower control limits were defined as: UCL= +3σ
where (UCL) and (LCL) are the upper and lower control limits, respectively, and (σ) is the standard deviation of the monitored variable. The ±3σ limits provide a statistical reference interval for distinguishing the expected variability of the process from observations exhibiting unusually large deviations.
The calculated control limits were superimposed on the chronological production series. Observations exceeding the upper control limit or falling below the lower control limit were identified as out-of-control signals and were subsequently examined in the context of field production behavior. Importantly, an out-of-control signal was not interpreted automatically as evidence of a specific reservoir mechanism. Instead, each statistically identified deviation was considered a diagnostic signal requiring comparison with the corresponding production trend and other available reservoir-performance indicators.
The Shewhart analysis was therefore integrated with conventional production-performance assessment. Changes identified by the control charts were evaluated together with oil-production behavior, water production, water cut, and, where available, injection-related parameters. This integrated approach was used to determine whether statistically significant deviations corresponded to meaningful changes in reservoir or production performance.
The analytical framework can therefore be summarized as follows: (1) compilation and quality control of the original 1934–2024 Lokbatan field production dataset; (2) calculation of production-performance indicators; (3) construction of Shewhart control charts; (4) identification of statistically unusual observations; and (5) engineering interpretation of the detected deviations in relation to reservoir and production performance. This approach enables statistical process monitoring to be used not as an isolated mathematical technique, but as a diagnostic component of mature oil-field performance assessment under real-world data conditions.
4. Result and Discussion
4.1. Development Dynamics of the Lokbatan Reservoirs and Their Influence on Mud Volcano Activity
Intensive field development caused significant alterations in the natural hydrodynamic conditions of the reservoirs. This raises the question of whether these changes affected mud volcano activity, and conversely, whether mud volcanism influenced reservoir development.
To address these issues, long-term observations of reservoir pressure and well productivity are of critical importance, particularly during periods of volcanic activity. Field measurements indicate that neither reservoir pressures nor well productivity at Lokbatan – including wells located close to the volcano – experienced any noticeable changes before, during, or after eruptions. No anomalies were observed between eruptions either, apart from the regular time-dependent decline in pressure and production.
Therefore, it can be concluded that the activity of the Lokbatan mud volcano does not exert a direct influence on well productivity or reservoir pressures within the Productive series [29].
However, analysis of eruption frequency, intensity, and style in relation to oil, water, and gas production (Figure 5a,b) reveals that development of the Productive series does, in turn, affect volcanic activity.
During the initial phase of intensive field development (1933-1941), when oil production increased sharply from 13.4 thousand tons in 1932 to 1.87 million tons in 1937 and subsequently remained above 1 million tons per year, four volcanic eruptions occurred. These eruptions took place within only nine years, with intervals of 2-3 years, a frequency not observed either before or after this period.
4.2. Oil Production Dynamics and Statistical Control Assessment of Horizon VIII of the Lokbatan Field
The Shewhart control chart for annual oil production in the Lokbatan field (Figure 6) demonstrates pronounced temporal variability throughout the production history from 1934 to 2024. Oil production increased rapidly during the early development stage, reaching 558 th.t. in 1938 and a maximum of 645.9 th.t. in 1942. These values substantially exceeded the upper control limit of 131 th.t., indicating periods of exceptionally high production relative to the established control range. After 1942, production generally declined, although several temporary increases were observed during 1951–1954.
From the late 1950s onward, oil production progressively decreased and remained below the mean value of 62 th.t. for most of the subsequent period. Production approached the lower control limit of 7 th.t. during the late 1980s and subsequently remained close to or below this limit. In particular, production decreased to 3.0 th.t. in 1995 and remained at relatively low levels during the following decades. A slight recovery was observed during 1997–1999, but this increase was not sustained.
During 2000–2024, annual oil production remained consistently low compared with the upper and mean control limits, with values generally ranging between approximately 2.2 and 9.1 th.t. The minimum value of 2.2 th.t. was recorded in 2020, followed by a modest increase to 4.5 th.t. in 2021. Production subsequently remained below the lower control limit, reaching 3.2 th.t. in 2024. Overall, the control-chart pattern indicates a long-term transition from high-production conditions in the early development period to a prolonged low-production stage, reflecting the mature and strongly depleted state of the Lokbatan field.
4.3. Water Production Dynamics and Shewhart Control Chart Analysis
The Shewhart control chart of annual water production in the Lokbatan field (Figure 7) demonstrates substantial temporal variability during 1941–2024. At the beginning of the analyzed period, water production was relatively high, reaching 255.7 th.m3 in 1941 and 231.9 th.m3 in 1942, both exceeding the upper control limit of 183 th.m3. After a temporary decrease to 94.8 th.m3 in 1944, water production increased again and remained predominantly above the upper control limit during the period from 1948 to 1964.
The highest water production values were recorded during the 1950s, with production increasing from 217.3 th.m3 in 1950 to 337.5 th.m3 in 1954 and reaching 345.2 th.m³ in 1958. These values substantially exceeded the upper control limit, indicating a prolonged period of elevated water production. From the early 1960s, a gradual decline became evident. Water production decreased from 275 th.m3 in 1960 to 176.4 th.m3 in 1965 and subsequently fluctuated around the mean value of 132 th.m3.
During the 1970s, water production generally remained below the mean value, reaching a minimum of 80.7 th.m3 in 1972. A temporary increase occurred in the late 1970s, when water production reached 217.6 th.m3 in 1979 and 190.1 th.m3 in 1980, exceeding the upper control limit. After this short-term increase, production gradually declined again, with values mostly remaining between the lower and mean control limits during the 1980s and early 1990s.
A pronounced decrease in water production occurred after 1994. The value declined from 79.6 th.m3 in 1994 to 38.7 th.m3 in 1995 and reached 20.7 th.m3 in 1996. During 1997–2002, water production remained at particularly low levels, ranging from 27.1 to 29.2 th.m3. Although a moderate increase was observed during 2003–2007, production remained well below the mean control value of 132 th.m3.
From 2008 to 2024, water production continued at a relatively low level, generally fluctuating between approximately 40 and 59 th.m3, with the exception of 2020, when it decreased to 20.9 th.m3. The maximum value during this later period was 58.7 th.m3 in 2017, which remained substantially below the mean control value. By 2024, water production was 37.1 th.m3.
Overall, the Shewhart analysis indicates a clear long-term reduction in water production in the Lokbatan field. The early and middle stages of the production history were characterized by frequent exceedances of the upper control limit, whereas the later period was dominated by values substantially below the mean and lower control limits. This shift reflects a major change in the water-production regime over the long-term development history of the field and provides an important indicator of the changing production conditions of the Lokbatan reservoirs.
4.4. Liquid Production Dynamics and Shewhart Control Chart Analysis
The Shewhart control chart of annual liquid production in the Lokbatan field (Figure 8) shows substantial temporal variability over the period 1934–2024. At the beginning of the production history, liquid production increased rapidly from 13.2 th.m3 in 1934 to 248 th.m3 in 1936 and subsequently exceeded the upper control limit of 259 th.m3 during several periods. The highest values in the early development stage were recorded in 1938 (558 th.m3), 1953 (476.8 th.m3), 1954 (472.3 th.m3), and 1952 (470. th.m3).
During 1948–1964, liquid production remained predominantly above the upper control limit, indicating a period of sustained high total fluid production. The production maximum of 558 th.m3 in 1938 represents the highest recorded value in the entire dataset. After the high-production period of the 1950s and early 1960s, a gradual decline became evident. Nevertheless, liquid production remained above the mean value of 177 th.m3 through much of the 1960s, before declining to 130.6 th.m3 in 1969.
During the 1970s, liquid production generally remained below the mean value, reaching 97.7 th.m3 in 1972. A temporary recovery occurred in the late 1970s, with production increasing to 236.7 th.m3 in 1979 and 207.0 th.m3 in 1980. After this short-term increase, liquid production again declined, reaching 138.1 th.m3 in 1984 and 106.4 th.m3 in 1989.
A pronounced reduction occurred during the 1990s. Liquid production decreased from 99.5 th.m3 in 1990 to 83.4 th.m3 in 1994 and subsequently fell sharply to 41.7 th.m3 in 1995 and 23.8 th.m3 in 1996. During 1997–2005, production remained at very low levels, ranging from 31.7 to 48.6 th.m3. A moderate increase was observed during 2006–2019, but the values remained substantially below the mean control value of 177 th.m3. The highest liquid production during this later period was 66.3 th.m3 in 2017.
In 2020, liquid production decreased to 23.1 th.m3, followed by a moderate recovery to 45.8 th.m3 in 2021 and 47.6 th.m3 in 2022. Production increased to 54.26 th.m3 in 2023 before decreasing to 40.33 th.m3 in 2024. Throughout this recent period, liquid production remained well below the mean and lower control limits.
Overall, the Shewhart control chart demonstrates a pronounced long-term transition from high liquid-production rates during the early and middle stages of Lokbatan field development to persistently low production during the later stage. The prolonged period of production below the lower control limit after the mid-1990s indicates a substantial change in the field’s production regime and is consistent with the mature stage of reservoir development. The liquid-production trend therefore provides an integrated measure of the long-term changes in total fluid withdrawal from the Lokbatan reservoirs.
4.5. Gas Production Dynamics and Shewhart Control Chart Analysis
The Shewhart control chart of annual gas production in the Lokbatan field (Figure 9) shows a pronounced long-term decline in gas production during 1966–2024. At the beginning of the analyzed period, gas production was relatively high, reaching 12.8 mln m3 in 1966, 15.1 mln 3³ in 1967, and 12.5 mln3m³ in 1968. These values substantially exceeded the upper control limit of 8 mln m3. Gas production remained above the upper control limit through 1970, when it reached 8.5 mln m3.
After 1970, gas production decreased sharply and fell below the mean value of 5 mln m3. During 1971–1979, production generally fluctuated between 2.6 and 3.6 mln m3, remaining below the mean control value but mostly above the lower control limit of 2 mln m3. A moderate increase occurred during 1980–1988, with production reaching 5.1 mln m3 in 1980 and 5.3 mln m3 in 1987. However, these increases were temporary and did not restore the production levels observed during the initial period.
From the late 1980s onward, gas production resumed its declining trend. Production decreased from 5.1 mln m3 in 1988 to 2.1 mln m3 in 1995, approaching the lower control limit. A short-term recovery occurred during 1996–1999, when production increased to 3.3 mln m3 in 1998. After 2000, however, gas production declined progressively, reaching 1.6 mln m3 in 2002–2003 and less than 1 mln m3 from 2004 onward.
The most pronounced reduction occurred during 2007–2012. Gas production decreased from 0.4 mln m3 in 2007 to 0.3 mln m3 in 2008–2009, followed by a further decline to 0.09 mln m3 in 2010, 0.04 mln m3 in 2011, and only 0.02 mln m3 in 2012. These values were substantially below the lower control limit of 2 mln m3. No production values are reported in the dataset for 2013–2014 and 2016–2020; therefore, these years are treated as missing observations rather than zero production.
A small amount of gas production was recorded again during 2015, with a value of 0.01 mln m3. In the most recent period with available observations, gas production remained extremely low, decreasing from 0.31 mln m3 in 2021 to 0.24 mln m3 in 2022, 0.21 mln m³ in 2023, and 0.18 mln m³ in 2024. All of these values remained substantially below the lower control limit.
Overall, the Shewhart control chart demonstrates a strong long-term transition from relatively high gas production during the initial development stage to persistently low production during the later stage of the Lokbatan field. The repeated exceedance of the upper control limit during 1966–1970 contrasts sharply with the prolonged period of production below the lower control limit after the early 2000s. This pattern indicates a substantial deterioration in gas-production performance over the development history of the field and is consistent with the advanced stage of reservoir depletion.
4.6. Gas Factor Dynamics and Shewhart Control Chart Analysis
The Shewhart control chart of the gas factor in the Lokbatan field (Figure 10) demonstrates substantial temporal variability during 1966–2024. During the initial period, the gas factor increased from 312.2 mln m3 in 1966 to 504.4 mln m3 in 1969. Although these values remained below the upper control limit of 556 mln3m³, most observations during 1968–1970 were close to or above the mean value of 362 mln m3.
A pronounced decrease occurred after 1970. The gas factor declined to 147.6 mln m3 in 1971 and remained predominantly below the mean value during 1971–1979. Several observations approached the lower control limit of 165 mln m3, while values in 1976 and 1978 fell below this limit, reaching 131.8 and 133.3 mln m3, respectively. This period was therefore characterized by relatively low gas-factor values compared with the established mean level.
During the 1980s, the gas factor showed a gradual recovery. Values increased to 301.8 mln m3 in 1980 and remained generally between the lower and mean control limits during the early 1980s. From 1985 onward, the gas factor increased more substantially, reaching 368.1 mln m3 in 1987 and 495.1 mln m³ in 1988. High values continued through the early 1990s, including 469.1 mln m³ in 1989, 485.7 mln m³ in 1990, and 517.9 mln m³ in 1992. These values were considerably higher than the mean control value of 362 mln m3, although they remained below the upper control limit.
The most pronounced increase occurred during 1994–1997. The gas factor increased from 528.9 mln m3 in 1994 to 700 mln m3 in 1995 and reached a maximum of 871 mln m3 in 1996. The 1995–1997 values substantially exceeded the upper control limit of 556 mln m3, indicating an exceptional deviation from the established production regime. After reaching its maximum in 1996, the gas factor decreased to 695.7 mln m3 in 1997 and subsequently declined to 428.6 mln m3 in 1998 and 344.4 mln m3 in 1999.
After 2000, a persistent downward trend became evident. The gas factor decreased from 291.1 mln m3 in 2000 to 202.5 mln m3 in 2002, followed by a temporary increase to 238.5 mln m3 in 2003. From 2004 onward, the decline became considerably stronger, with the gas factor falling below the lower control limit and reaching 112.7 mln m3 in 2004, 50 mln m3 in 2007, and only 12.5 mln m3 in 2010.
The lowest values were recorded during 2011–2020. The gas factor declined from 6.2 mln m3 in 2011 to 2.2 mln m3 in 2012 and 1.3 mln m3 in 2013. It was recorded as zero in 2014 and again during 2016–2020, while a value of 0.9 mln m3 was recorded in 2015. These observations were substantially below the lower control limit of 165 mln m3 and indicate an extremely low gas-factor level during this period.
A small recovery was observed in 2021, when the gas factor increased to 68.9 mln m3, followed by 65.7 mln m3 in 2022. However, the value subsequently decreased to 49.1 mln m³ in 2023 and 55.83 mln3 m³ in 2024. Despite this recent increase relative to the 2014–2020 period, the gas factor remained substantially below both the mean and lower control limits.
Overall, the Shewhart analysis reveals a highly variable gas-factor history characterized by an initial moderate level, a decline during the 1970s, recovery during the late 1980s and early 1990s, and an exceptional increase during 1995–1997, followed by a prolonged and pronounced decline. The maximum value of 871 mln m3 in 1996 represents the strongest positive deviation from the control range, whereas the near-zero values observed during 2014–2020 represent the strongest negative deviation. The long-term pattern indicates a major transformation in the gas-related production regime of the Lokbatan field during its development history.
4.7. Water Cut Dynamics and Shewhart Control Chart Analysis
The water-cut dynamics of the Lokbatan field during 1941–2024 demonstrate substantial temporal variability and a pronounced long-term increase in the contribution of water to total liquid production (Figure 11). Water-cut values for 1934–1940 are not available in the dataset; therefore, these years are not considered in the interpretation. During 1941–1955, water cut generally fluctuated between approximately 49% and 71%, remaining below the mean control value of 80%. The lowest value during this period was recorded in 1942 (23.5%), whereas the highest reached 70.8% in 1946.
A gradual increase in water cut became evident during the second half of the 1950s. The value increased from 73.5% in 1956 to 79.1% in 1957 and 81.8% in 1958, followed by 83.1% in 1959. Thus, water cut exceeded the mean control value of 80% during 1958–1959. However, substantial short-term fluctuations were observed in the following years, including decreases to 45.4% in 1960 and 45.6% in 1962. In contrast, water cut reached 85.3% in 1963 and remained relatively high during 1963–1972, generally fluctuating around or above the mean control value.
A pronounced temporary decrease occurred in 1973, when water cut fell to 40.9%. This was followed by a rapid recovery, with values increasing to 84.4% in 1974 and 84.8% in 1975. During 1976–1978, water cut remained predominantly above 77%, while a marked increase occurred in 1979, when the value reached 90.6%. Similar values were maintained during 1980–1983, ranging from 89.8% to 90.5%. This period represents a transition toward a persistently high-water-cut production regime.
From the mid-1980s through the early 1990s, the water cut continued to increase. Values of 87.7% were recorded in 1985–1986, followed by 89.9% in 1987, 90.2% in 1988, and 91.3% in 1989. The increasing trend continued during 1990–1994, reaching 91.9% in 1990, 92.9% in 1991, 93.3% in 1992, and a maximum of 94.9% in 1993. A similarly high value of 94.7% was recorded in 1994. These observations indicate that water became the dominant component of total liquid production during this stage of field development.
After 1994, a temporary decline in water cut was observed. The value decreased from 94.7% in 1994 to 91.7% in 1995, 85.1% in 1996, and 83.5% in 1997. A further decrease occurred in 1998–2001, when water cut reached 72.6% in 1999 and remained below the mean control value during this period. This temporary reduction was followed by a renewed increase beginning in 2002. Water cut increased from 76.0% in 2002 to 81.9% in 2003 and subsequently remained predominantly above the mean control value.
During 2004–2016, water cut generally remained within the range of approximately 82–86%. The values increased from 83.2% in 2004 to 85.5% in 2006, followed by some fluctuations during 2007–2016. A further increase was observed after 2016, reaching 86.9% in 2017, 88.4% in 2018, and 88.1% in 2019. Water cut remained high in the subsequent years, reaching 89.0% in 2020, 90.9% in 2022, and 91.1% in 2023. In 2024, the water cut was 90.8%.
Overall, the water-cut history indicates a long-term transition from moderate water production to a strongly water-dominated production regime in the Lokbatan field. The early period was characterized by substantial fluctuations and generally low-to-moderate water cut, whereas from the late 1970s onward, water cut progressively stabilized at high levels. The maximum recorded value of 94.9% in 1993 demonstrates the particularly advanced degree of water dominance during the early 1990s. Although temporary decreases occurred during 1995–2001, the subsequent recovery and sustained values above 80% indicate that high water production remained a persistent characteristic of the later development stage.
The Shewhart control limits further emphasize this transition. While most observations during the early production period remained below the mean value of 80%, a large proportion of the later observations exceeded the mean and approached the upper control limit of 96%. At the same time, the dataset contains no observations exceeding the upper control limit. Thus, the water-cut pattern is characterized not by isolated statistical excursions beyond the control range, but by a persistent shift toward high water-cut values. This behavior indicates a substantial change in the fluid-production regime and provides an important indicator of the mature development stage of the Lokbatan field.
4.8. Influence of Hydrocarbon Production on Mud Volcano Eruption Frequency and Intensity
Short dormant periods include the intervals 1887-1890, 1900-1904, 1915-1918, 1923-1926, 1933-1941, and 1954-1959. During these intervals, the time between eruptions typically ranged from 3 to 4 years. A shorter interval of about 2 years was observed only in 1933-1935, coinciding with the onset of intensive field development. According to the general pattern, the 1935 eruption should have been followed by a long dormant period; however, this lasted only three years, with subsequent eruptions in 1938 and 1941. This unique deviation from the long-term pattern is clearly linked to intensive hydrocarbon production.
A similar deviation is observed during the 1954-1959 period, when the interval extended to five years rather than the typical 3-4 years. This is likely related to intensive free gas production during that time. In 1958, gas production declined sharply, and an eruption followed in 1959. The extended dormancy may also reflect overall depletion of the field, by which time more than 22 million tons of oil, over 25 million tons of water, and substantial volumes of gas had already been extracted.
Long dormant periods include the intervals 1890-1900, 1904-1915, 1918-1923, 1926-1933, 1941-1954, and 1959-1972 (Figure 12). Before field development, these intervals lasted 10-11 years, later shortening to 5-7 years. After the period of intensive production (1933-1941), they increased sharply to 13 years. This prolongation is likely due to partial depletion of subsurface resources, requiring more time for deep-seated hydrocarbon gases to accumulate in the volcanic conduit prior to eruption.
In summary, development of the Productive series deposits has a direct impact on the frequency of Lokbatan mud volcano eruptions. During the early, intensive stage of development, eruption frequency increased sharply, followed by a pronounced decrease accompanied by lengthening of both short and long dormant periods. Field development also influenced the intensity and style of eruptions.
The four eruptions that occurred during the initial intensive development phase (1941-1972) were strong, characterized by gas release and modest extrusion of volcanic breccia. They were also associated with subsidence and downslope movement of older volcanic deposits, particularly during the 1935 eruption. This low eruption intensity is attributed to reduced reservoir pressures caused by aggressive hydrocarbon extraction, which decreased the elasticity of hydrocarbon-bearing strata and plastic clay masses beneath the volcano. Under geostatic loading, these materials compacted, leading to surface subsidence of older mud-volcano edifices [34,35,36,37,38].
Eruptions during the later stage of field development (1941, 1959, and 1972) were marked by stronger gas emissions, explosive activity, gas combustion, and the extrusion of large volumes of mud breccia (exceeding 100,000 m3 per eruption) (Figure 13). This shift in eruption character reflects the stabilization of hydrodynamic conditions following the cessation of rapid compaction and the gradual, uniform decline in hydrocarbon production.
4.9. Impact on Reservoir Dynamics
The discharge of fluids through the mud volcanic system may lead to localized pressure depletion and redistribution within nearby reservoirs. Such pressure variations can influence hydrocarbon phase behavior, gas saturation, and fluid flow regimes. In structurally complex zones adjacent to the volcano, these effects may alter well productivity and increase drilling and production risks if not adequately considered in reservoir models.
In structurally complex zones adjacent to the Lokbatan mud volcano, failure to adequately incorporate mud volcanic activity, fault-controlled fluid migration, and pressure heterogeneity into reservoir models may result in significant inaccuracies in pressure prediction and fluid flow simulation. Such omissions can lead to incorrect assessment of reservoir performance, unexpected gas influx during drilling operations, and increased risks to well stability and production efficiency. Therefore, the integration of mud volcanic structures and associated overpressure zones into geological and reservoir models is essential for reliable forecasting and safe hydrocarbon development.
4.10. Implications for Hydrocarbon Exploration and Development
Despite the long-term development of the Lokbatan field and others located in this zone, as well as the periodic activation of the Lokbatan mud volcano, accompanied by the release of gigantic volumes of breccia and gas, the fields continue to produce products. It is quite obvious that hydrocarbons are being replenished from deeper deposits.
From an exploration standpoint, the presence of the Lokbatan mud volcano serves as an indicator of active hydrocarbon generation and migration. Its alignment with productive structures highlights the role of faults as both migration pathways and potential leakage zones. Incorporating mud volcanic activity into geological and geomechanical models enhances reservoir characterization and supports safer, more efficient field development.
5. Conclusions
This study presents an integrated analysis of the long-term development of Horizon VIII of the Lokbatan field and its relationship with mud volcano activity. Historical production data, reservoir observations, documented eruptive events, and Shewhart statistical control charts were combined to evaluate changes in oil, water, liquid, and gas production, gas factor, and water cut over the development history of the field.
The main conclusions are as follows:
- The Lokbatan field has undergone a pronounced transition from an intensive production stage to a mature and strongly depleted development stage. Oil production was exceptionally high during the early development period, exceeding the upper control limit in several years, but subsequently declined and remained close to or below the lower control limit during the late stage of field development.
- The long-term reduction in oil, water, liquid, and gas production indicates a major transformation of the reservoir production regime. Liquid production changed from sustained high levels during the early and middle stages to persistently low values after the mid-1990s, consistent with the advanced maturity of the field.
- Water cut is one of the most important indicators of the late-stage evolution of the Lokbatan reservoirs. Although substantial fluctuations occurred during the early development history, water cut progressively shifted toward a high and persistent level from the late 1970s onward. The maximum value of 94.9% was recorded in 1993, and values remained predominantly above 80% during the subsequent period, demonstrating the establishment of a strongly water-dominated production regime.
- Gas-related production also experienced a major long-term transformation. Gas production declined from values exceeding the upper control limit during 1966–1970 to extremely low levels during the recent period. In contrast, the gas factor displayed strong temporal variability, including an exceptional increase during 1995–1997, followed by a prolonged decline to very low values. These contrasting patterns indicate substantial changes in gas behavior during different stages of reservoir depletion.
- The results support a predominantly one-way influence between long-term field development and mud volcano behavior. Available observations indicate that the Lokbatan mud volcano does not produce a measurable short-term impact on reservoir pressure or well productivity. However, long-term hydrocarbon extraction and the associated changes in subsurface hydrodynamic conditions are related to changes in the frequency and character of mud-volcanic activity.
- The principal novelty of the study is the integration of historical production dynamics, multiple reservoir-performance indicators, Shewhart control-chart analysis, and mud-volcano activity into a unified long-term assessment framework. Rather than considering production decline or mud-volcanic activity separately, the proposed approach identifies statistically distinguishable shifts in the development regime and evaluates them in the geological context of an active petroleum–mud-volcano system.
Overall, the Lokbatan field represents a valuable natural case study demonstrating how prolonged hydrocarbon extraction can be associated with progressive reservoir depletion, declining production, increasing water dominance, and changes in mud-volcanic behavior. The proposed integrated approach can also be applied to other mature hydrocarbon fields located in tectonically active areas affected by mud volcanism, providing a basis for long-term production monitoring and geological risk assessment.
Author Contributions
Conceptualization, Sh.G. and G.N.; methodology, Sh.G.; software, Sh.G.; validation, S.M., G.N. and M.I.; formal analysis, T.Z.; investigation, Sh.G. and G.N.; resources, S.T.,A.A., K.A.; data curation, R.S., G.J., S.G.; writing—original draft preparation, Sh.G.; writing—review and editing, Sh.G.; visualization, G.N.; supervision, M.S.B.; project administration, Sh.G. All authors have read and agreed to the published version of the manuscript.
Acknowledgments
The authors gratefully acknowledge the State Oil Company of the Republic of Azerbaijan (SOCAR) for providing the data used in this study. The authors also thank Prof. Ad.A. Aliyev for providing the photograph used in this manuscript.
Conflicts of Interest
The authors declare no conflicts of interest.:
Abbreviations
The following abbreviations are used in this manuscript:
| MVs | Mud volcanoes |
| PK | Pre-Kirmaki |
| SPC | Statistical Process Control |
| CL | Central line |
| UCL | Upper control limit |
| LCL | Lover control limit |
References
- Etiope, А.; et al. Evidence of subsurface anaerobic biodegradation of hydrocarbons and potential secondary methanogenesis in terrestrial mud volcanoes. Mar. Pet. Geol. 2009, 26(9), 1692–1703. [Google Scholar] [CrossRef]
- Yetirmishli, G.J.; Kazimova, S.E. Eruption of the mud volcano Lokbatan. Geol. Geophys. Russ. South 2023, 13(1), 22–33. [Google Scholar] [CrossRef]
- Feyzullayev, A.; Ian, L.; Gojayev, A. About the Impact of Mud Volcano Eruptions and Earthquake on Petroleum Production Rates (South Caspian Basin). Int. J. Eng. Res. Technol. 2020, 09(Issue 08). [Google Scholar] [CrossRef]
- Aliev, Ad.A.; et al. The eruption of the Lokbatan mud volcano on September 20, 2012: new evidence of the replenishment of hydrocarbon resources. Proc. Sci. Earth 2013, 2, 18–25. Available online: https://journalesgia.com/en/meqale/390/eruption-of-mud-volcano-lokbatan-20-september-2012-new-evidence-replenishment-of-hydrocarbon-resources.
- Aliyev, Ad.A.; Guliyev, I.S.; Dadashev, F.G.; Rakhmanov, R.R. Atlas of the world mud volcanoes. Baku. Nafta-Press, 2015; 321. Available online: https://retk.copat.gov.az/en/library/atlas-of-the-world-mud-volcanoes-azerbaijan-national-academy-of-sciences-institu.
- Aliyev, Ad.A.; Guliev, I.S.; Belov, I.S. Catalog of recorded eruptions of mud volcanoes (1810-2001); Nafta-Press: Baku, 2002; p. 94. [Google Scholar]
- Salmanov, A.M. Geology and indicators of oil and gas field development onshore territory of Azerbaijan, Handbook, Baku, MSV MMC Publishing House. 2023, 622. Available online: https://www.researchgate.net/publication/380297139_AZRBAYCANIN_QURU_RAZISIND_NEFT-QAZ_YATAQLARININ_GEOLOGIYASI_V_ISLNM_GOSTRICILRI.
- Rzayeva, S. M.; Abdullayeva, V. G.; Tagiyev, A. S. Geodynamic development of structures of the North Absheron uplift zone within the South Caspian megadepression and oil-gas-bearing. J. Geol. Geogr. Geoecology 2024, 33(3), 553–561. [Google Scholar] [CrossRef]
- Abdulla-zada, M. Geological significance of seismic reflections in the sedimentary cover of the Eastern part of the Absheron-Prebalkhan ridge. Bull. Taras Shevchenko Natl. Univ. Kyiv (Geology) 2022, Т. 3(98), 59–65. [Google Scholar] [CrossRef]
- Rzaeva, S.; Tagiyev, A.; Abdullayeva, V. Assessment of the potential for use of thermal waters of the Absheron peninsula as a renewable energy source. Reliab. Theory Appl. 2024, 19(SI 6 (81)), 515–523. [Google Scholar] [CrossRef]
- Alizadeh, A.A.; et al. Pliocene Hydrocarbon Sedimentary Series of Azerbaijan; Springer: Book, 2024; Available online: https://link.springer.com/book/10.1007/978-3-031-50438-9.
- Li, Bin; et al. Geochemical evidence for the origin of multiphase hydrocarbons in the deep carbonate platform margin: examples of Ordovician oil in the Yuke of the Tarim basin. Phys. Chem. Earth Parts A/B/C 2025, Volume 140, 104051. [Google Scholar] [CrossRef]
- Pogorelova, Y.; Abdulla-Zada, M.; Tagiyev, A. Geodynamic regime of formation of the Meso-Cenozoic sedimentary cover of the Absheron archipelago. Reliab. Theory Appl. 2023, 18(SI 5 (75)), 296–303. [Google Scholar] [CrossRef]
- 14. Kerimov V.Yu. et al. Mud volcanism and ultradeep hydrocarbon systems. Curr. Issues Oil Gas. 2018, 4(23), 1–9. [CrossRef]
- Konysbekova, K. K.; et al. A Review on Mud Volcanoes and Petroleum Potential of the South Caspian Basin. Int. J. Earth Sci. Knowl. Appl. 2024, 6(3), 390–396. Available online: http://www.ijeska.com/index.php/ijeska/article/view/447/522.
- Ahadov, B.; Fielding, E.; Kadirov, F. Far-Field Earthquake-Induced Crustal Deformation and Mud Volcano Activity in Azerbaijan Based on the InSAR Technique. Remote Sens. 2025, 17(8), 1421. [Google Scholar] [CrossRef]
- Shukurov, V. A Wonder of Nature: “Oil” Volcanoes of Azerbaijan; AzerTAJ: Baku, 2024; Available online: https://azertag.az/ru/xeber/chudo_prirody_neftyanye_vulkany_azerbaidzhana-3024286.
- Pogorelova, E.; Abdulla-Zada, M. Oil and gas bearing complexes and litho-stratigraphic characteristics of Pliocene deposits of the Bulla-deniz field. Visnyk Taras Shevchenko Natl. Univ. Kyiv Geol. 2024, 4(107), 31–39. [Google Scholar] [CrossRef]
- Rostamian, Auref; de Sousa Miranda, Marx Vladimir; Mirzaei-Paiaman, Abouzar; Botechia, · Vinicius Eduardo; Schioze, Denis José. Analysis of different objective functions in petroleum field development optimization. J. Pet. Explor. Prod. Technol. 2024, 14(3-4), 13–35. [Google Scholar] [CrossRef]
- Rzaeva, S.; Tagiyev, A.; Zeynalova, S. Impact of climate change on the groundwater of the Ganikh-Ayrichay foothills. Reliab. Theory Appl. 2022, 17(SI 4 (70)), 180–187. [Google Scholar] [CrossRef]
- Karimov, V.M.; Sharifov, J.J.; Zeynalova, S.A. Intensification of oil production in long-term developed offshore fields. Journal Geol. Geogr. Geoecology 2023, 32(2), 276–282. [Google Scholar] [CrossRef]
- Ganbarova, Shura A.; Zeynalova, Sevil A. Ways of Consistently Optimizing Oil and Gas Production for the Gurgan-Deniz Field. J. Geol. Geogr. Geoecology 2025, 34(3), 489–497. [Google Scholar] [CrossRef]
- Suleymanova, V.; Abdullayeva, L.; Abdulla-zade, M. On the impact of filter application on production (a case study of The Garbi Absheron field). Azerbaijan Geol. 2025, 28, 154–163. [Google Scholar]
- Mammadov, H.A.; Abdulla-zade, M.; Pogorelova, Y.Y. Caspian pioneer: structural complexity and hydrocarbon distrıbution in the neft Dashlary offshore field. Bull. Taras Shevchenko Natl. Univ. Kyiv. Geol. Kyiv Ukr. 2025, Vol 4, 111. [Google Scholar] [CrossRef]
- Rzaeva, S.; Tagiyev, A.; Abdullayeva, V. Assessment of the potential for use of thermal waters of the Absheron Peninsula as a renewable energy source. Reliab. Theory Appl. 2024, 19(SI 6 (81)), 515–523. [Google Scholar] [CrossRef]
- Huseynov, J.; Tagiyev, A.; Ismayilova, M. Characteristics of the contemporary spatiotemporal distribution of atmospheric precipitation in the southern and southeastern parts of the Greater Caucasus region. Visnyk V. N. Karazin Kharkiv Natl. Univ. Ser. Geol. Geogr. Ecol. 2025, (62), 360–371. [Google Scholar] [CrossRef]
- Gardashova, L.A.; Sultanova, A.B.; Huseynov, C.S.; Tagiyev, A.S. Assessment of Climate Changes in the Southern Part of the Lesser Caucasus Region on a Neural Network; Springer: Cham, 2025; vol 1472. [Google Scholar] [CrossRef]
- Pogorelova, Y. Y.; Abdulla-zada, M. C.; Namazli, N. E. Comprehensive classification of Red-colored Series rocks from the eastern flank of the South Caspian Basin (Jigalybek field) based on reservoir and geophysical properties. J. Geol. Geogr. Geoecology 2024, Т. 33(№. 4), 797–809. [Google Scholar] [CrossRef]
- Nasibov, A.Z.; Ibrahimova, S.I.; Aghamaliyeva, G.K. Seismic attribute analysis of the Lokbatan-Puta-Gushkhana field. Journ. Geol. Geogr. Geoecology 2024, 33(4), 773–779. [Google Scholar] [CrossRef]
- Ershov, V. Mud volcanoes on the planet Earth: Review of monograph “Atlas of the world mud volcanoes”. Geosystems Transit. Zones 2018, 2(4), 419–421. [Google Scholar] [CrossRef]
- Fenske, Caroline; Brož, Petr; Mazzini, Adriano. Mud Volcano Dynamics in Azerbaijan: The Overlooked Role of Creeping Mud Flows in Landscape Evolution; EGUsphere, 2026. [Google Scholar] [CrossRef]
- Hajiyeva, S.; Aliyeva, T.; Shakhnazarova, N.; Jafarova, N. Chemical and ecological characterization of mud volcanoes in the southern part of Gobustan. Chem. Biol. 2025, 9(135), 1–8. [Google Scholar] [CrossRef]
- Napoli, S.; Spatola, D.; Casalbore, D.; Latino Chiocci, F. Geomorphometric Analysis of Submarine Mud Volcanoes: Variability, Evolutionary Trends, and Geohazard Implications. J. Mar. Sci. Eng. (JMSE) 2025, 13(3), 622. [Google Scholar] [CrossRef]
- 34. Pavlinova N.V., Shakhova A.Yu. The role of mud volcanism in the formation of oil and gas deposits of the South Piltun area of the Piltun-Astokhskoye field on the shelf of Sakhalin Island. Bull. Peoples’ Friendsh. Univ. Russ. Ser. Eng. Res. 2016, 2, 74–81. Available online: https://journals.rudn.ru/engineering-researches/article/view/13146/12576.
- Hategekamungu, A.; Mhammdi, N.; Manar, M.A. Comparison between Mud Volcanoes from the NW Moroccan Atlantic and Moroccan Mediterranean Margins Using Seismic and Bathymetric Data. Iraqi J. Sci. 2025. [Google Scholar] [CrossRef]
- Ershov, V. V.; Nikitenko, O. A.; Aidarkozhina, A. S. Dynamics of methane flows from Gladkovsky and Oldenburgsky mud volcanoes (Crimean-Caucasian region). Earth Sci. 2025, Vol. 523(No. 2). [Google Scholar] [CrossRef]
- Khlystov, O. M.; Khabuev, A. V. Novosibirsk mud volcano and evidence of its activations (Lake Baikal). Geodyn. Tectonophys. 2024, Vol. 15(No. 1), 07–39. [Google Scholar] [CrossRef]
- Abdulla-zade, M.; Zahidova, T.; Shahbazov, R. Integrated reassessment of hydrocarbon potential in the Absheron-bank and Darwin bank fields, of the Absheron-Prebalkhan structural threshold. Bull. Taras Shevchenko Natl. Univ. Kyiv. Geol. Kyiv Ukr. 2025, 110(3), 295–298. [Google Scholar] [CrossRef]
Figure 1.
Structural map of the Lokbatan thrust block based on the top of Horizon VIII of the Productive Series [7].
Figure 1.
Structural map of the Lokbatan thrust block based on the top of Horizon VIII of the Productive Series [7].
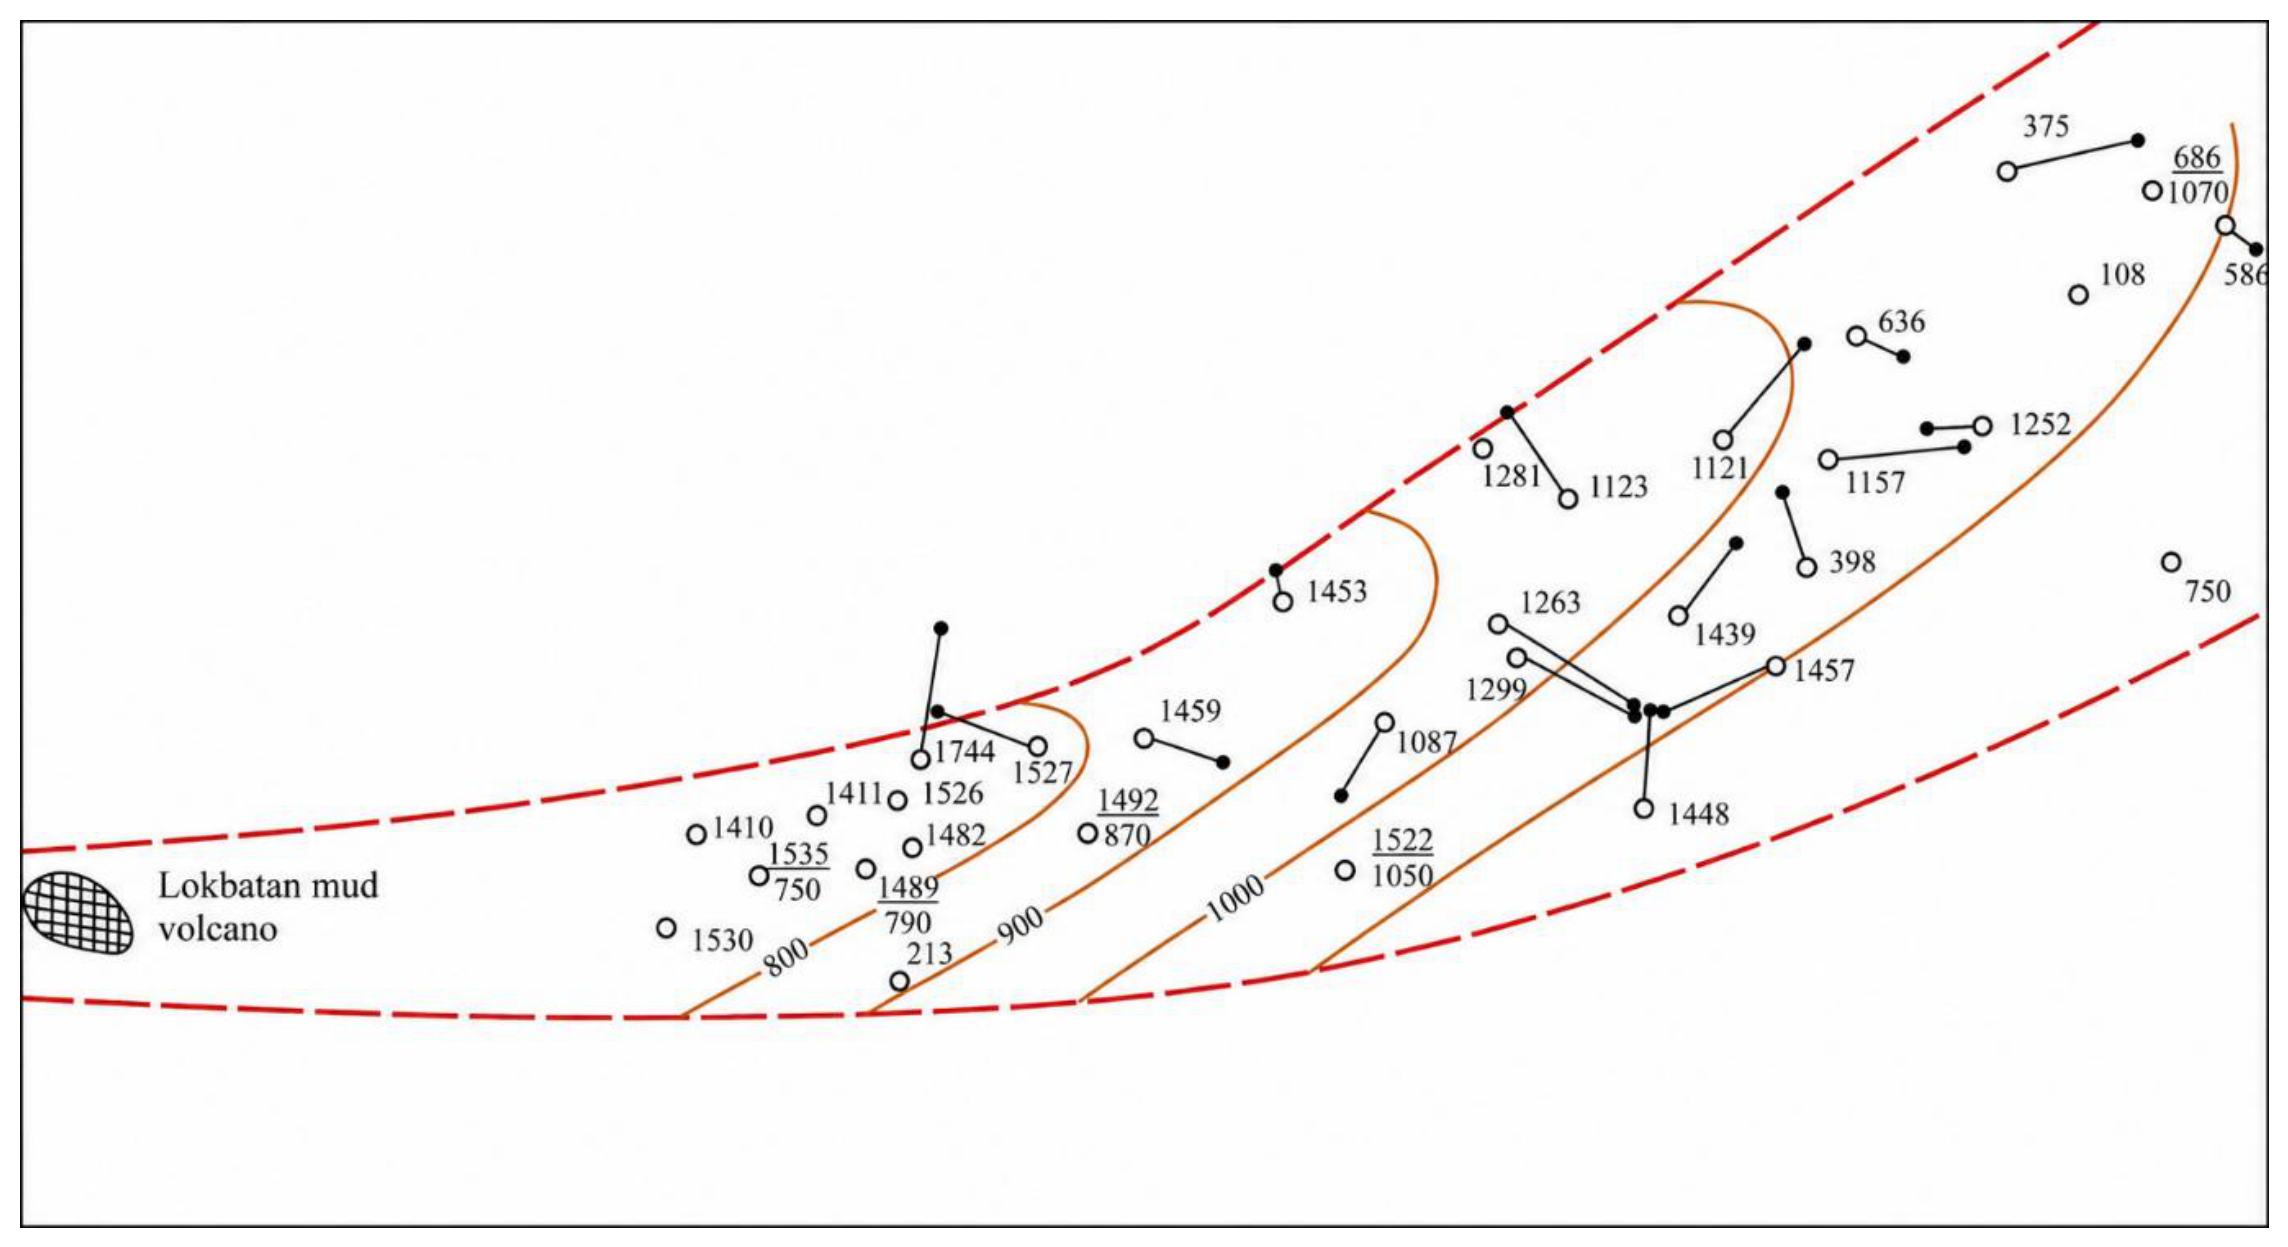
Figure 2.
The Lokbatan mud volcano (TopTourPlace.com).
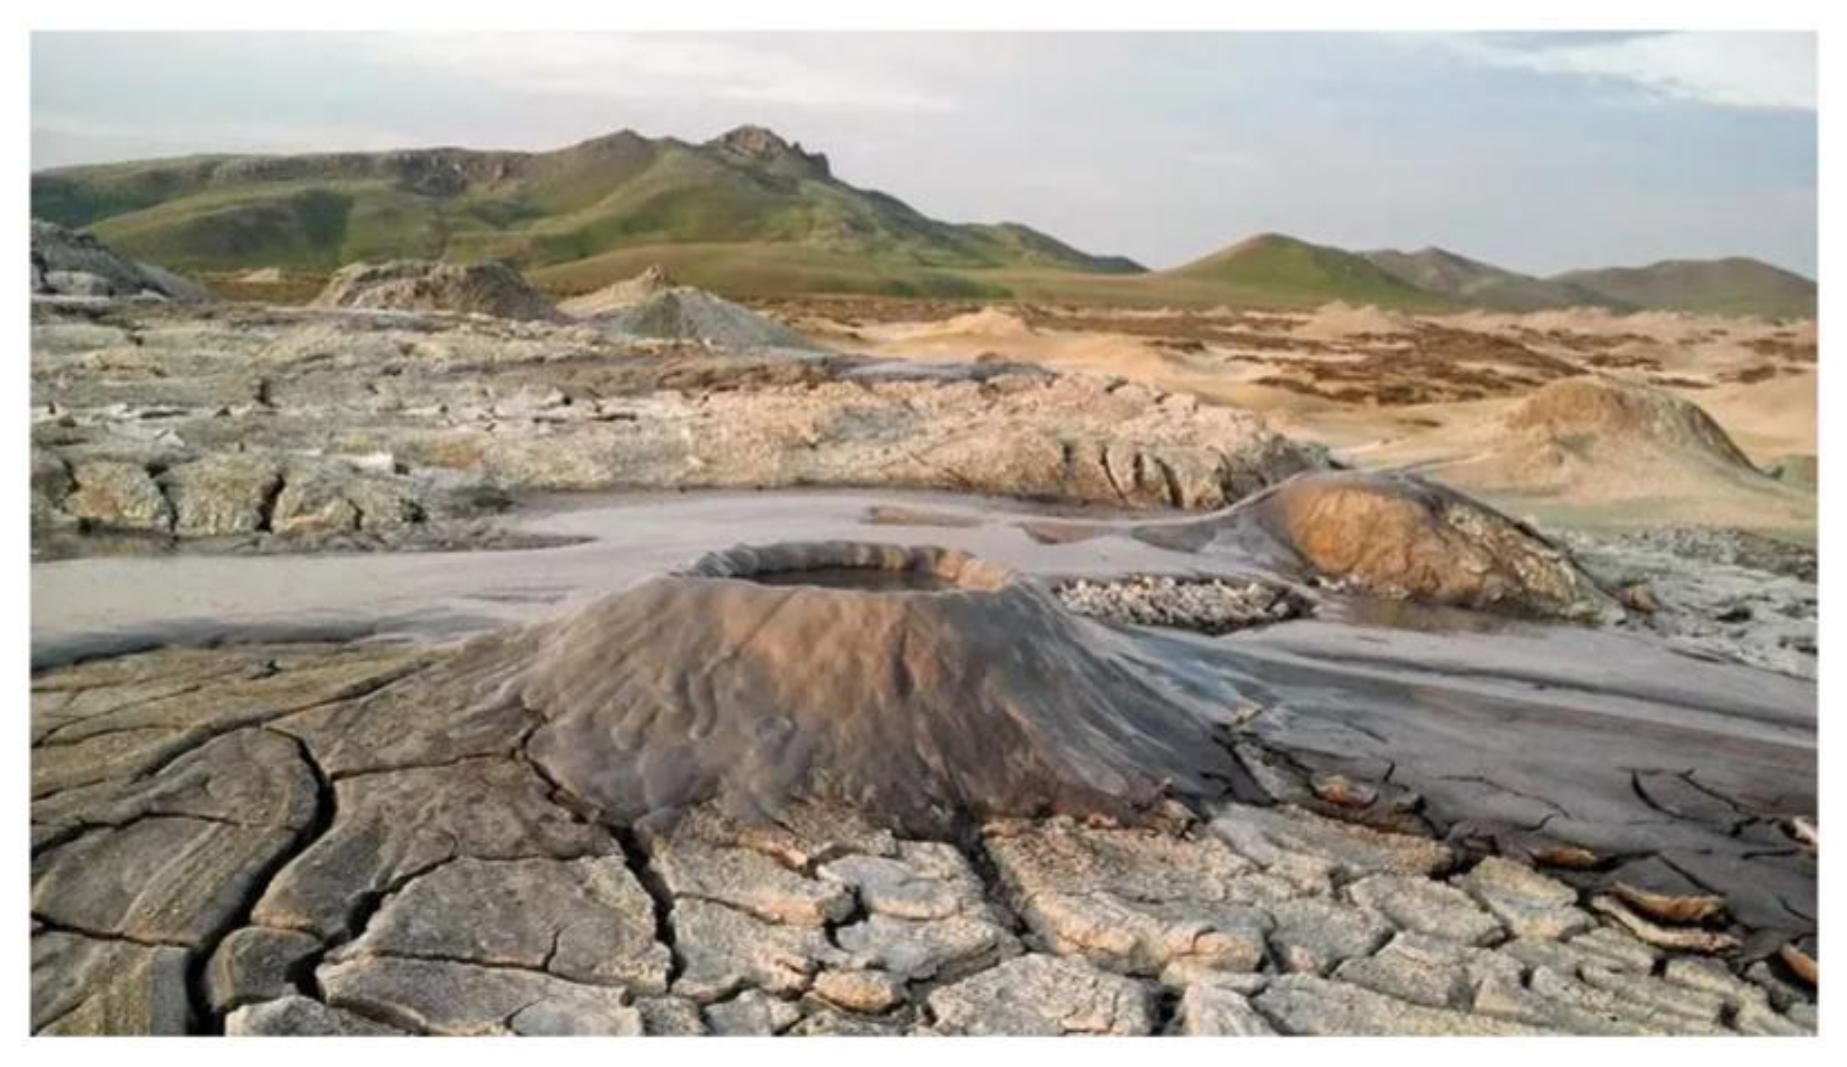
Figure 3.
The latest major mud volcano eruption at Lokbatan near Baku took place on October 10, 2001 (Photo by Dr. Adil Aliyev).
Figure 3.
The latest major mud volcano eruption at Lokbatan near Baku took place on October 10, 2001 (Photo by Dr. Adil Aliyev).
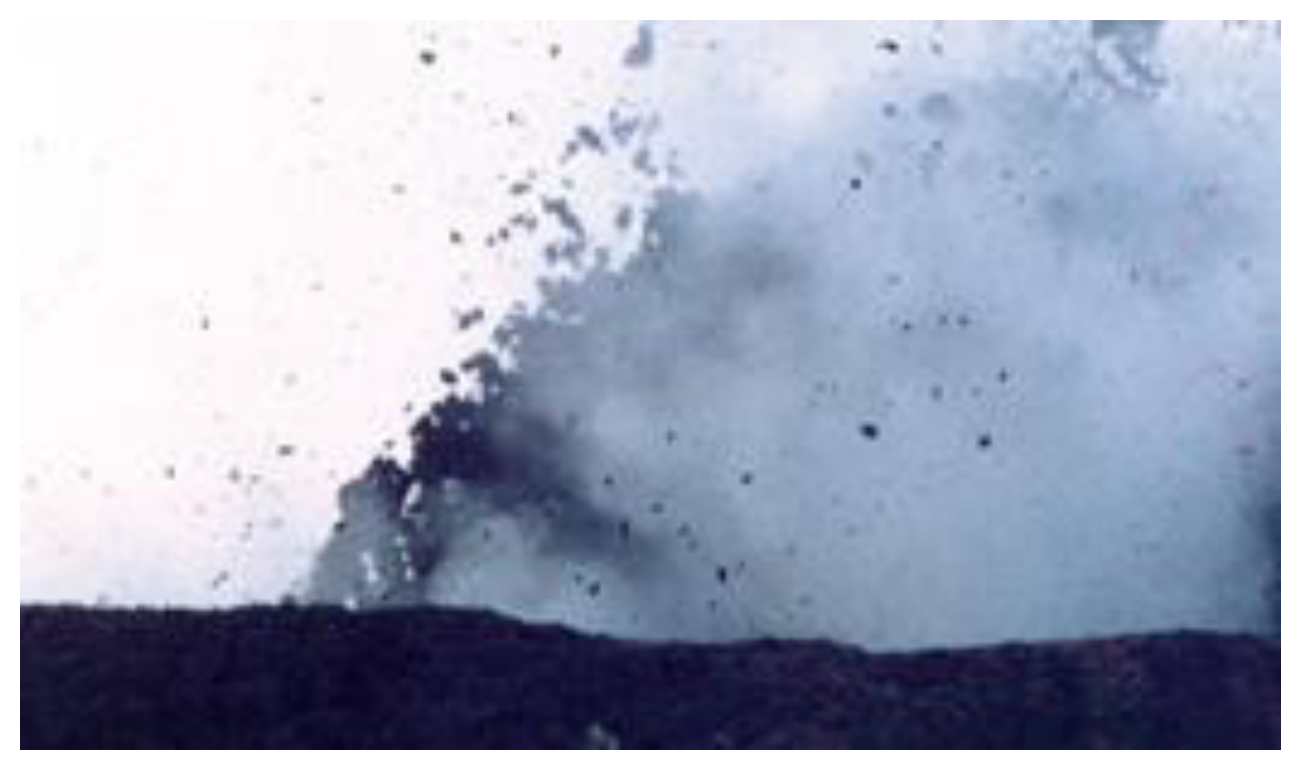
Figure 4.
Geological profile of the Lokbatan field [7].
Figure 4.
Geological profile of the Lokbatan field [7].
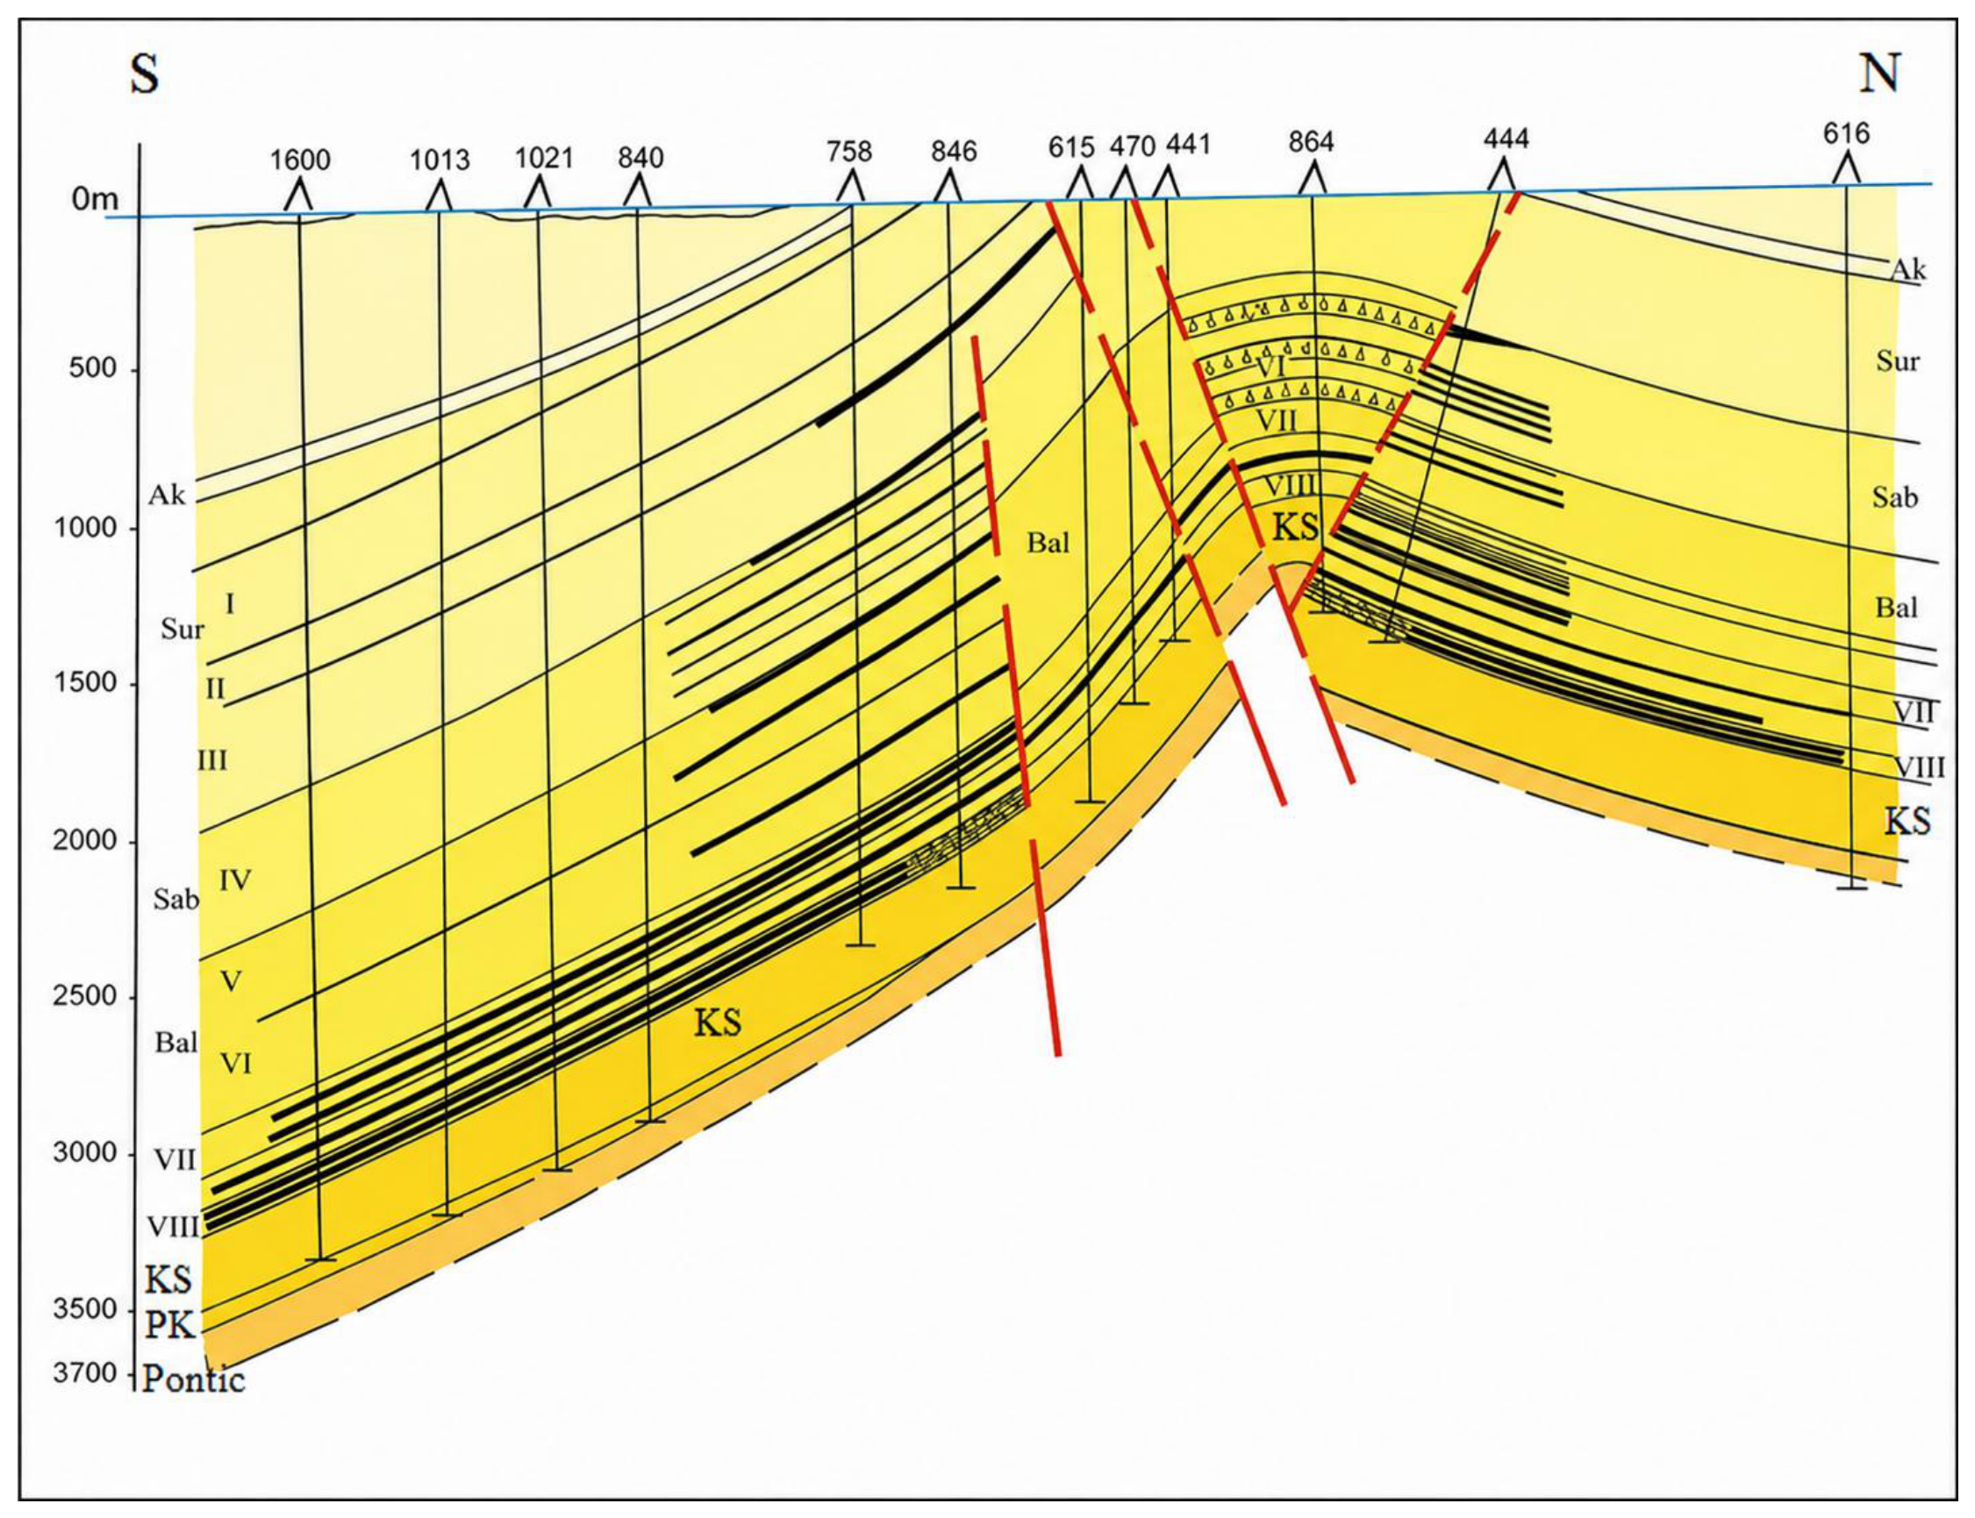
Figure 5.
a, b. Dynamics of development of the Horizon VIII of the Lokbatan field.
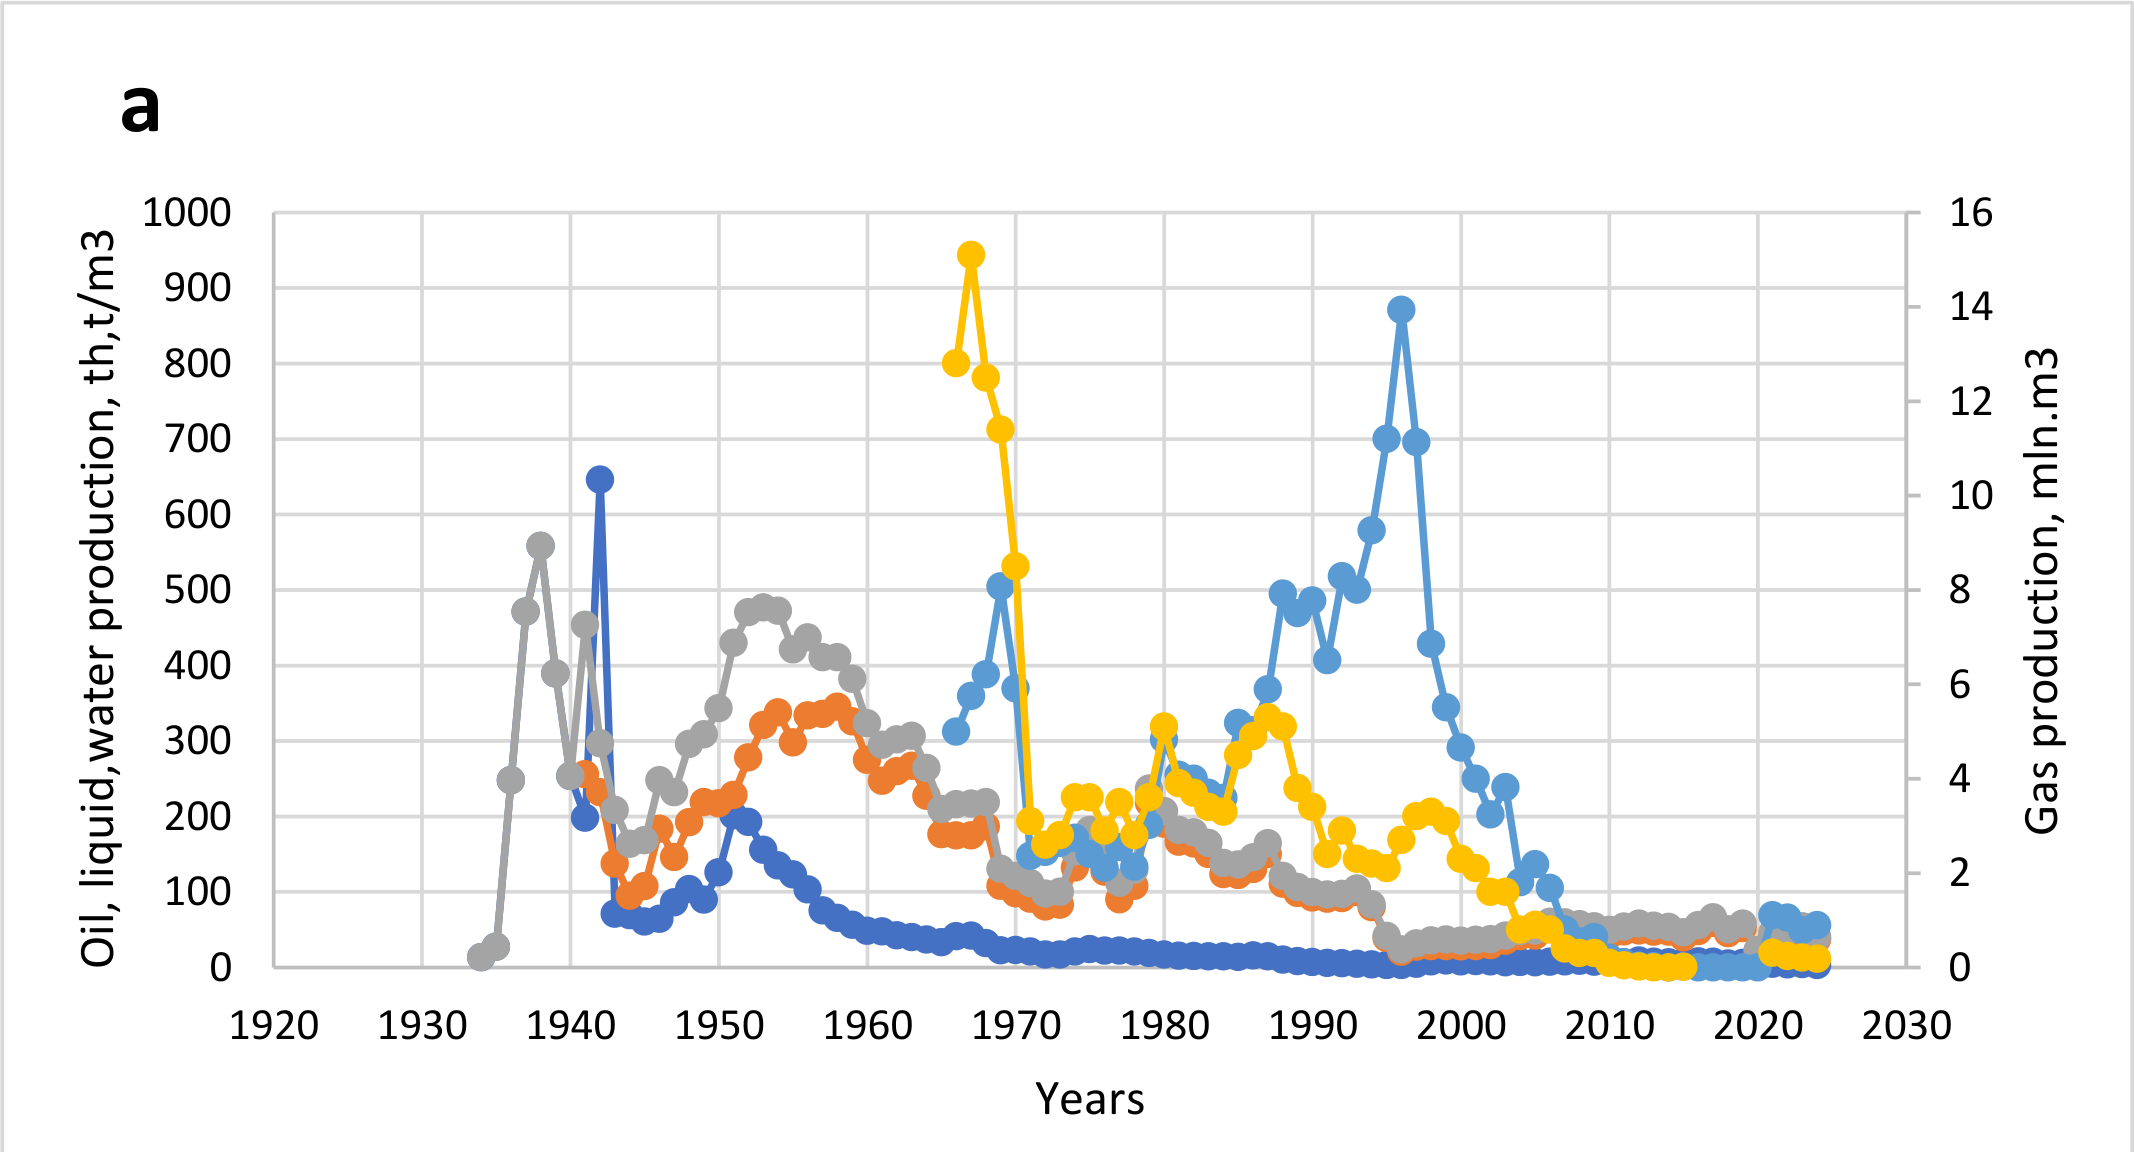
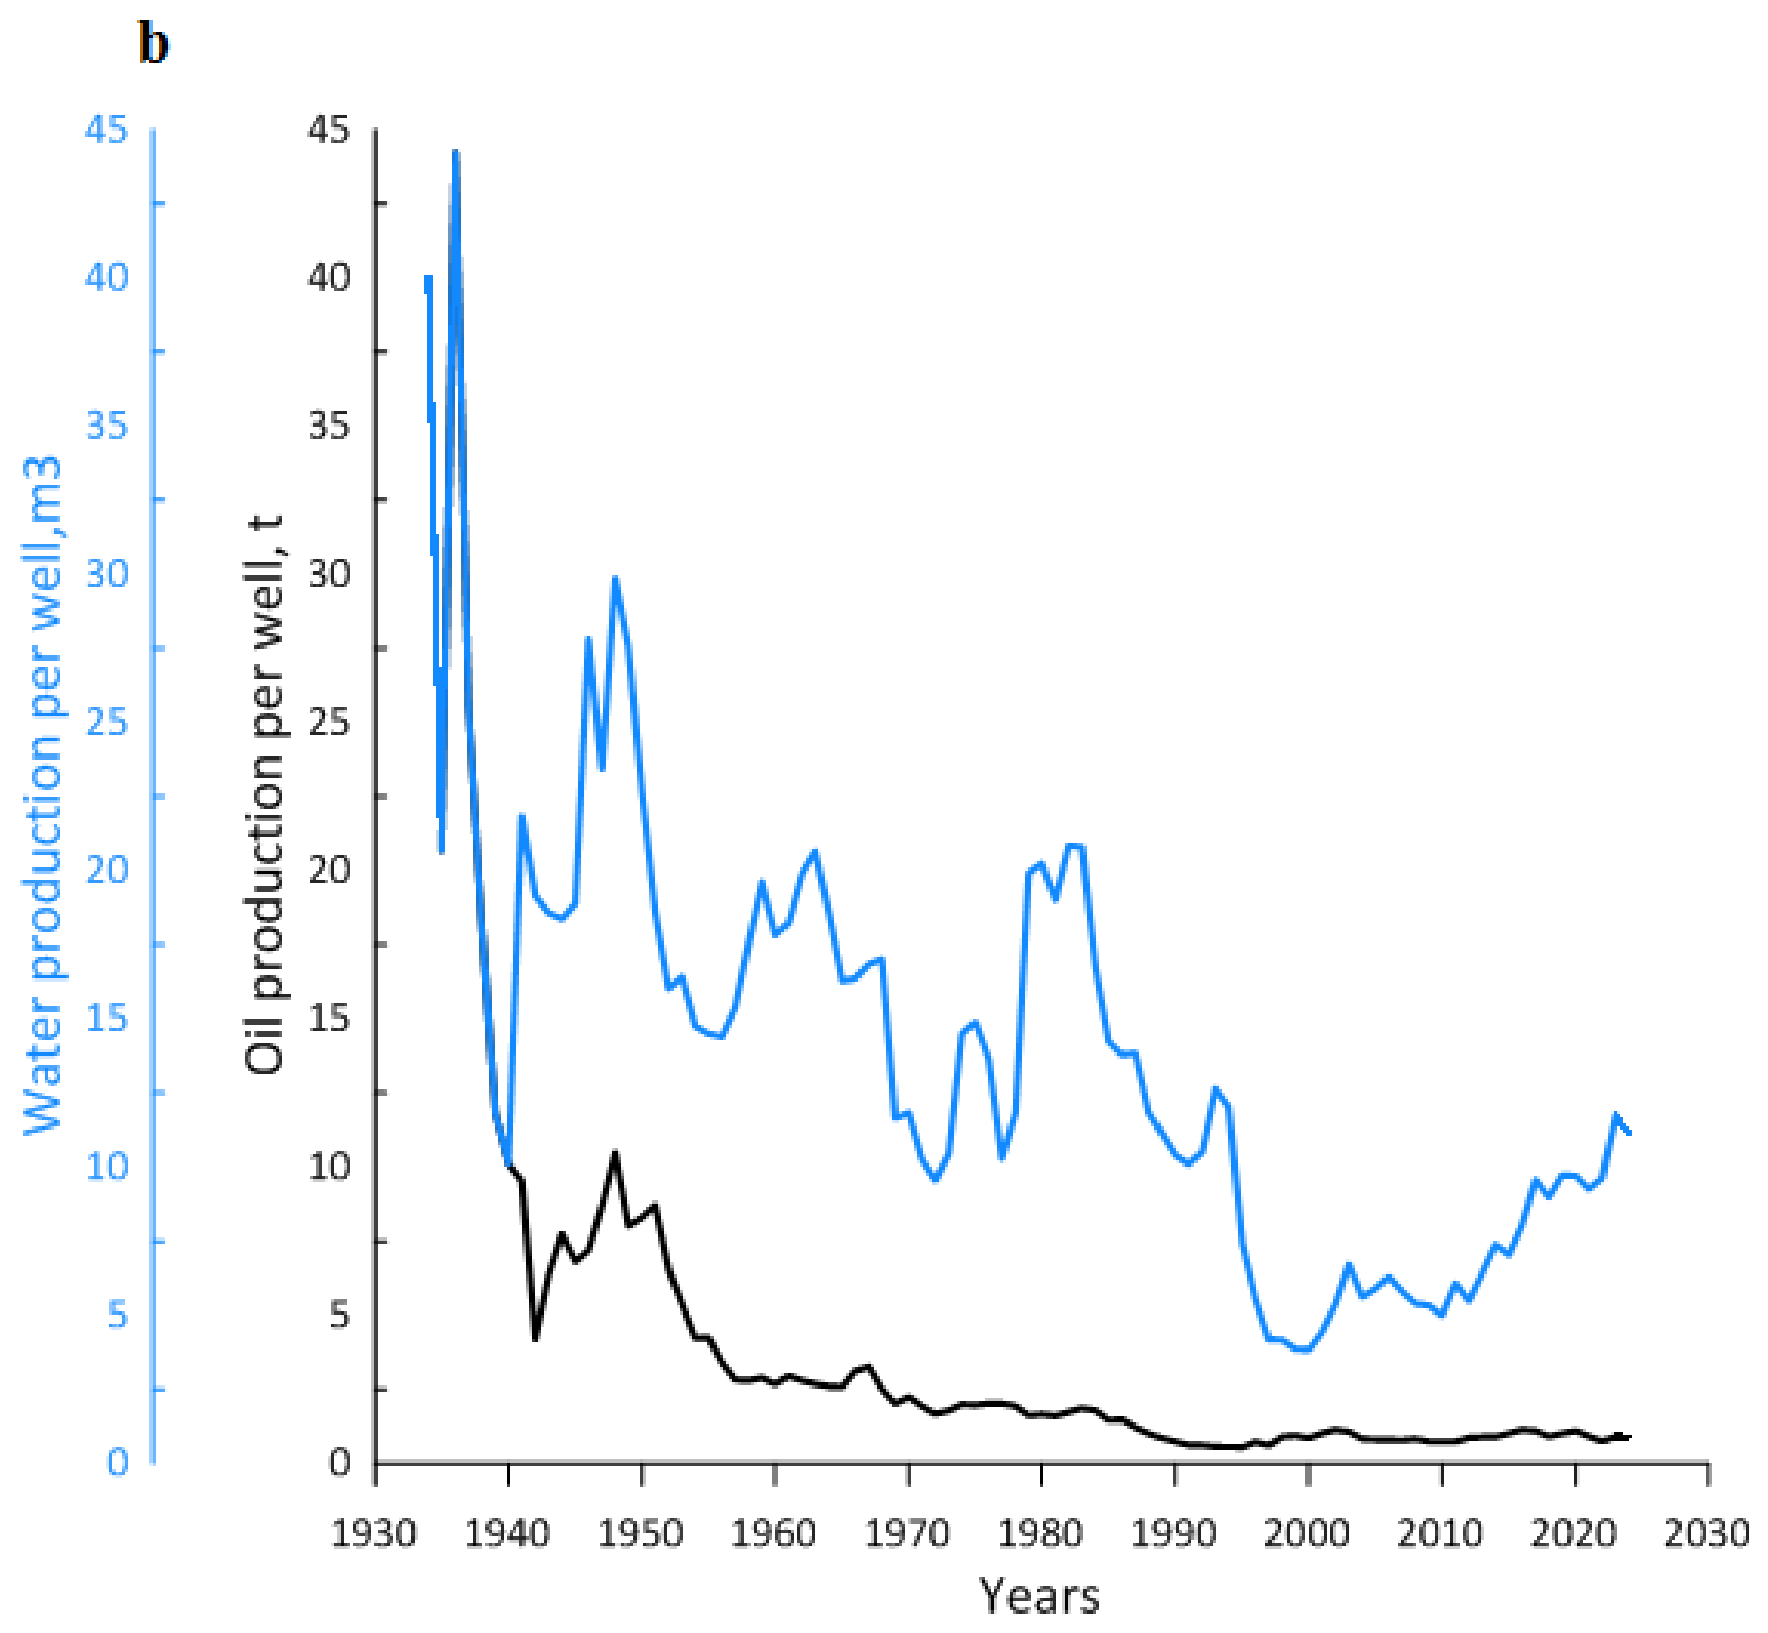
Figure 6.
Shewhart control chart showing annual oil production and control limits in Horizon VIII of the Lokbatan field, 1934-2024.
Figure 6.
Shewhart control chart showing annual oil production and control limits in Horizon VIII of the Lokbatan field, 1934-2024.
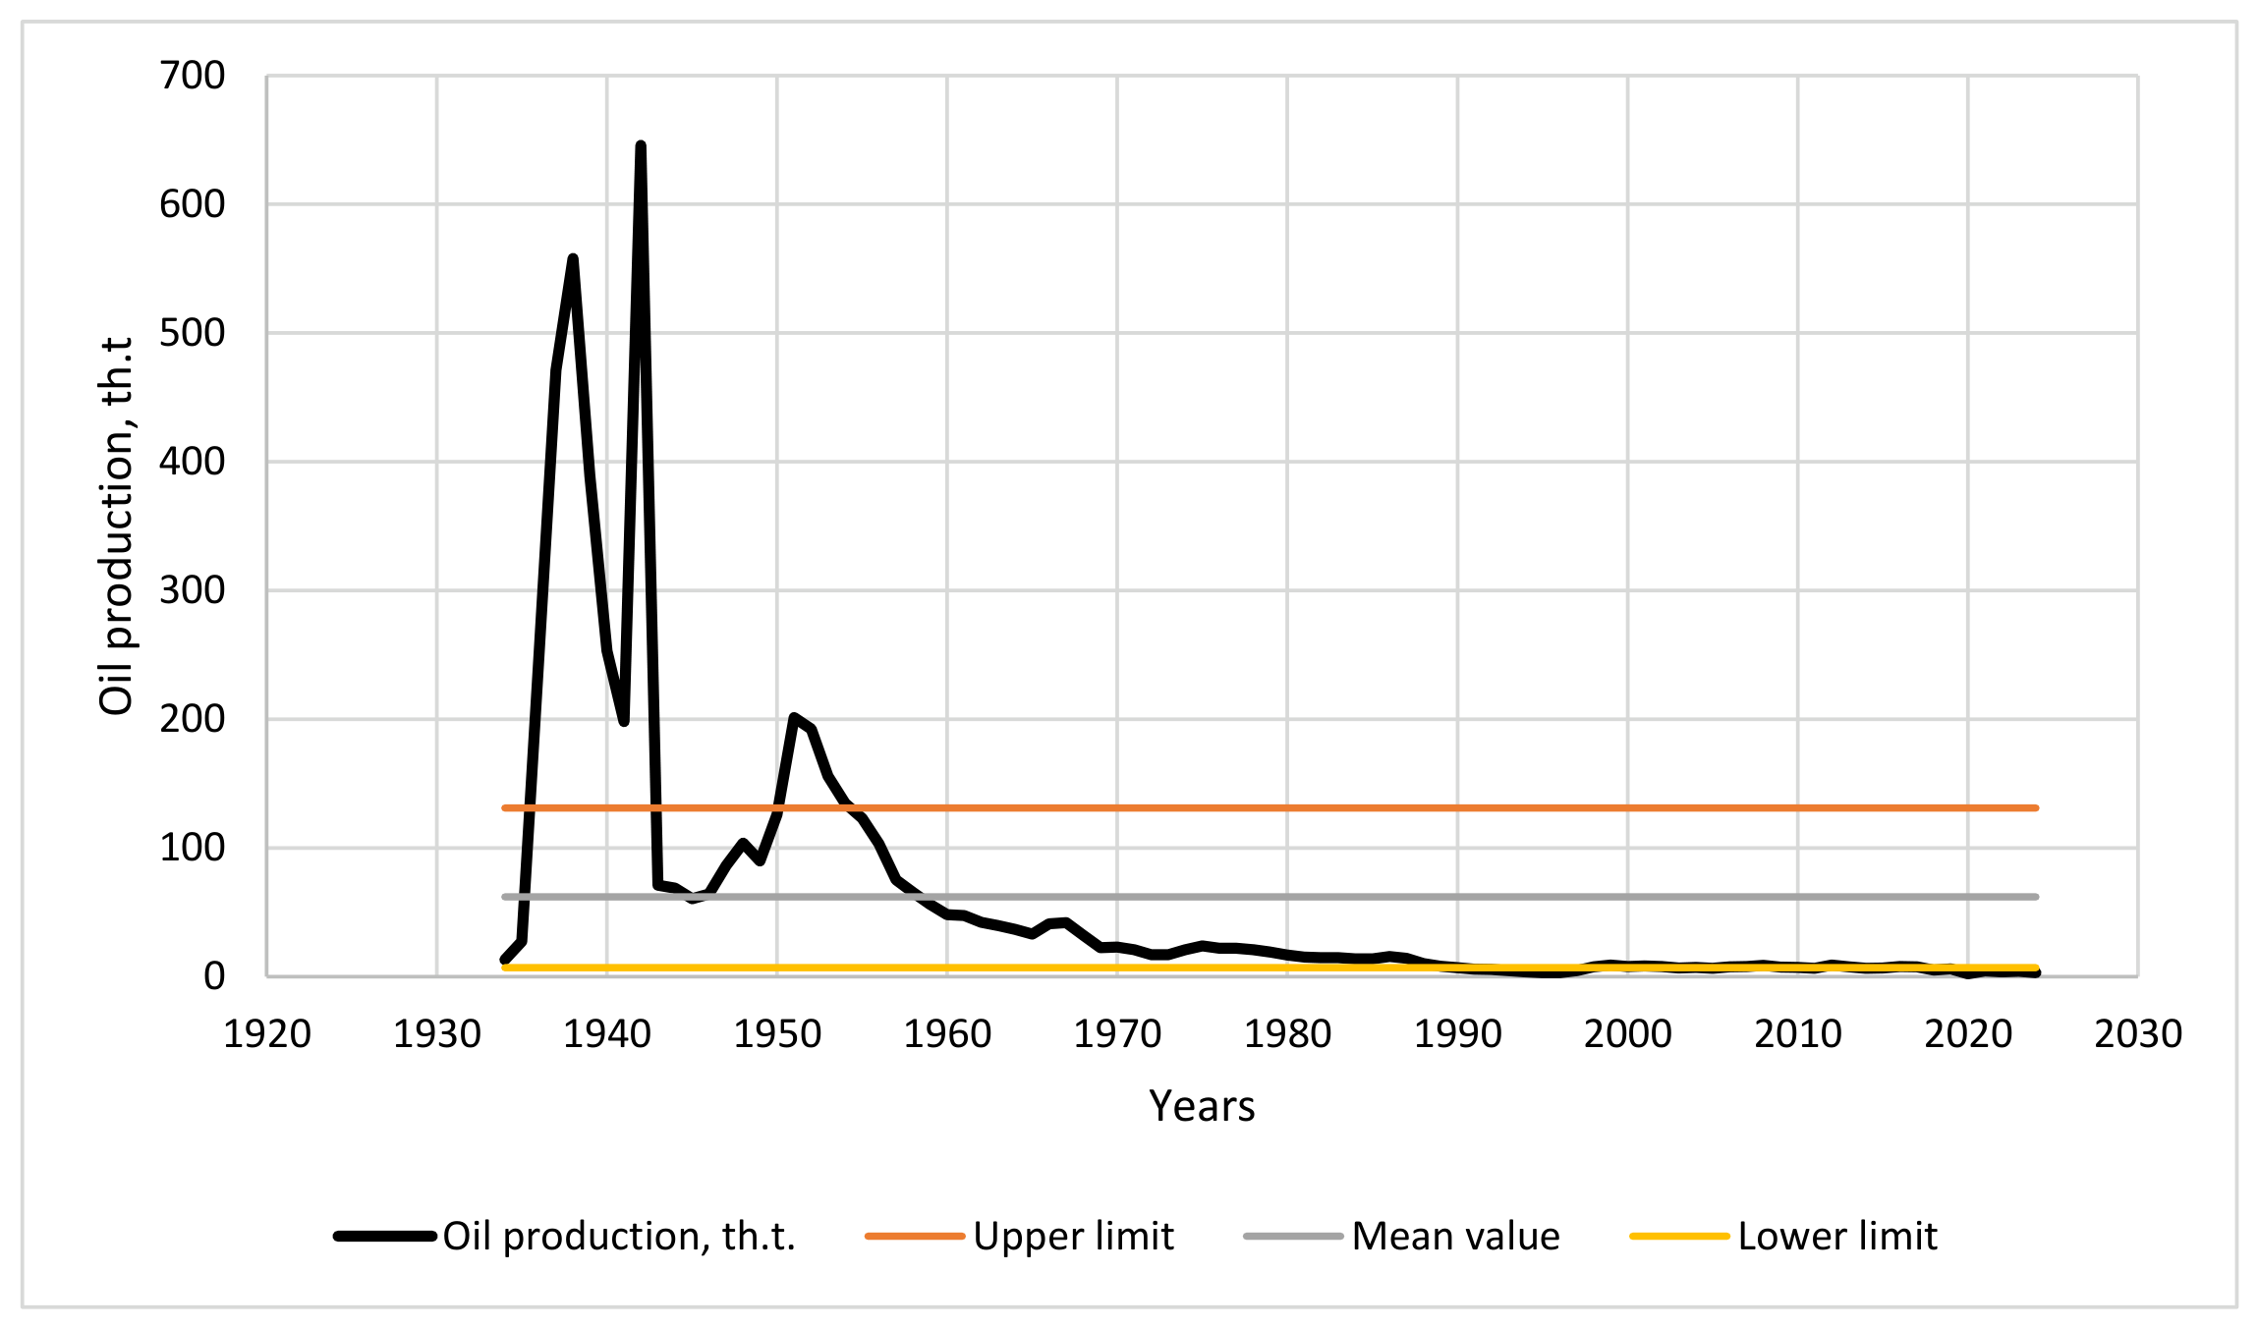
Figure 7.
Shewhart control chart showing annual water production and control limits in Horizon VIII of the Lokbatan field, 1934-2024.
Figure 7.
Shewhart control chart showing annual water production and control limits in Horizon VIII of the Lokbatan field, 1934-2024.
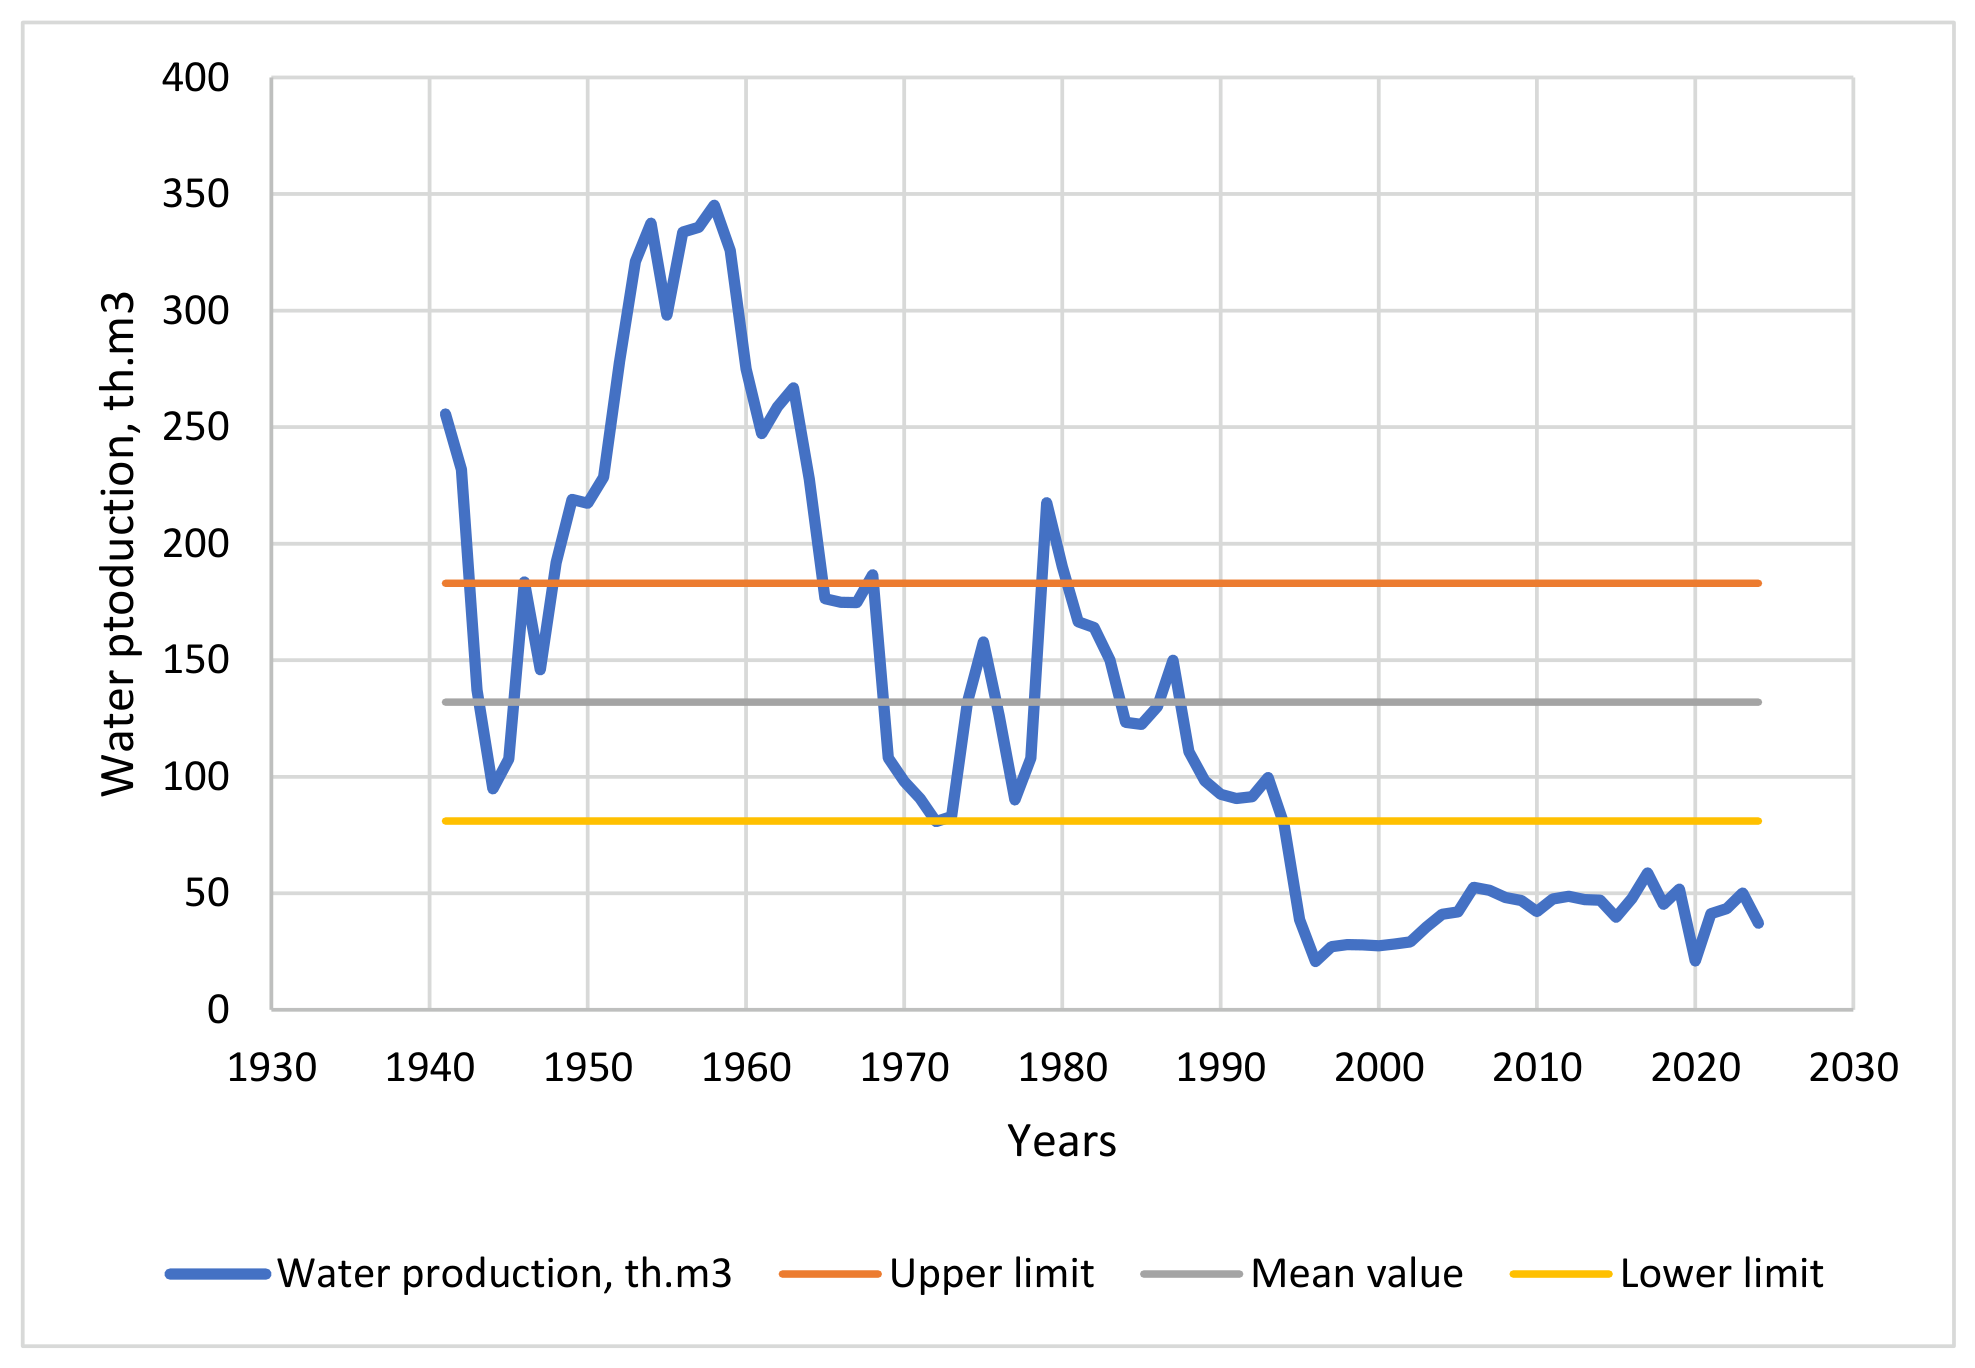
Figure 8.
Shewhart control chart showing annual liquid production and control limits in Horizon VIII of the Lokbatan field, 1934-2024.
Figure 8.
Shewhart control chart showing annual liquid production and control limits in Horizon VIII of the Lokbatan field, 1934-2024.
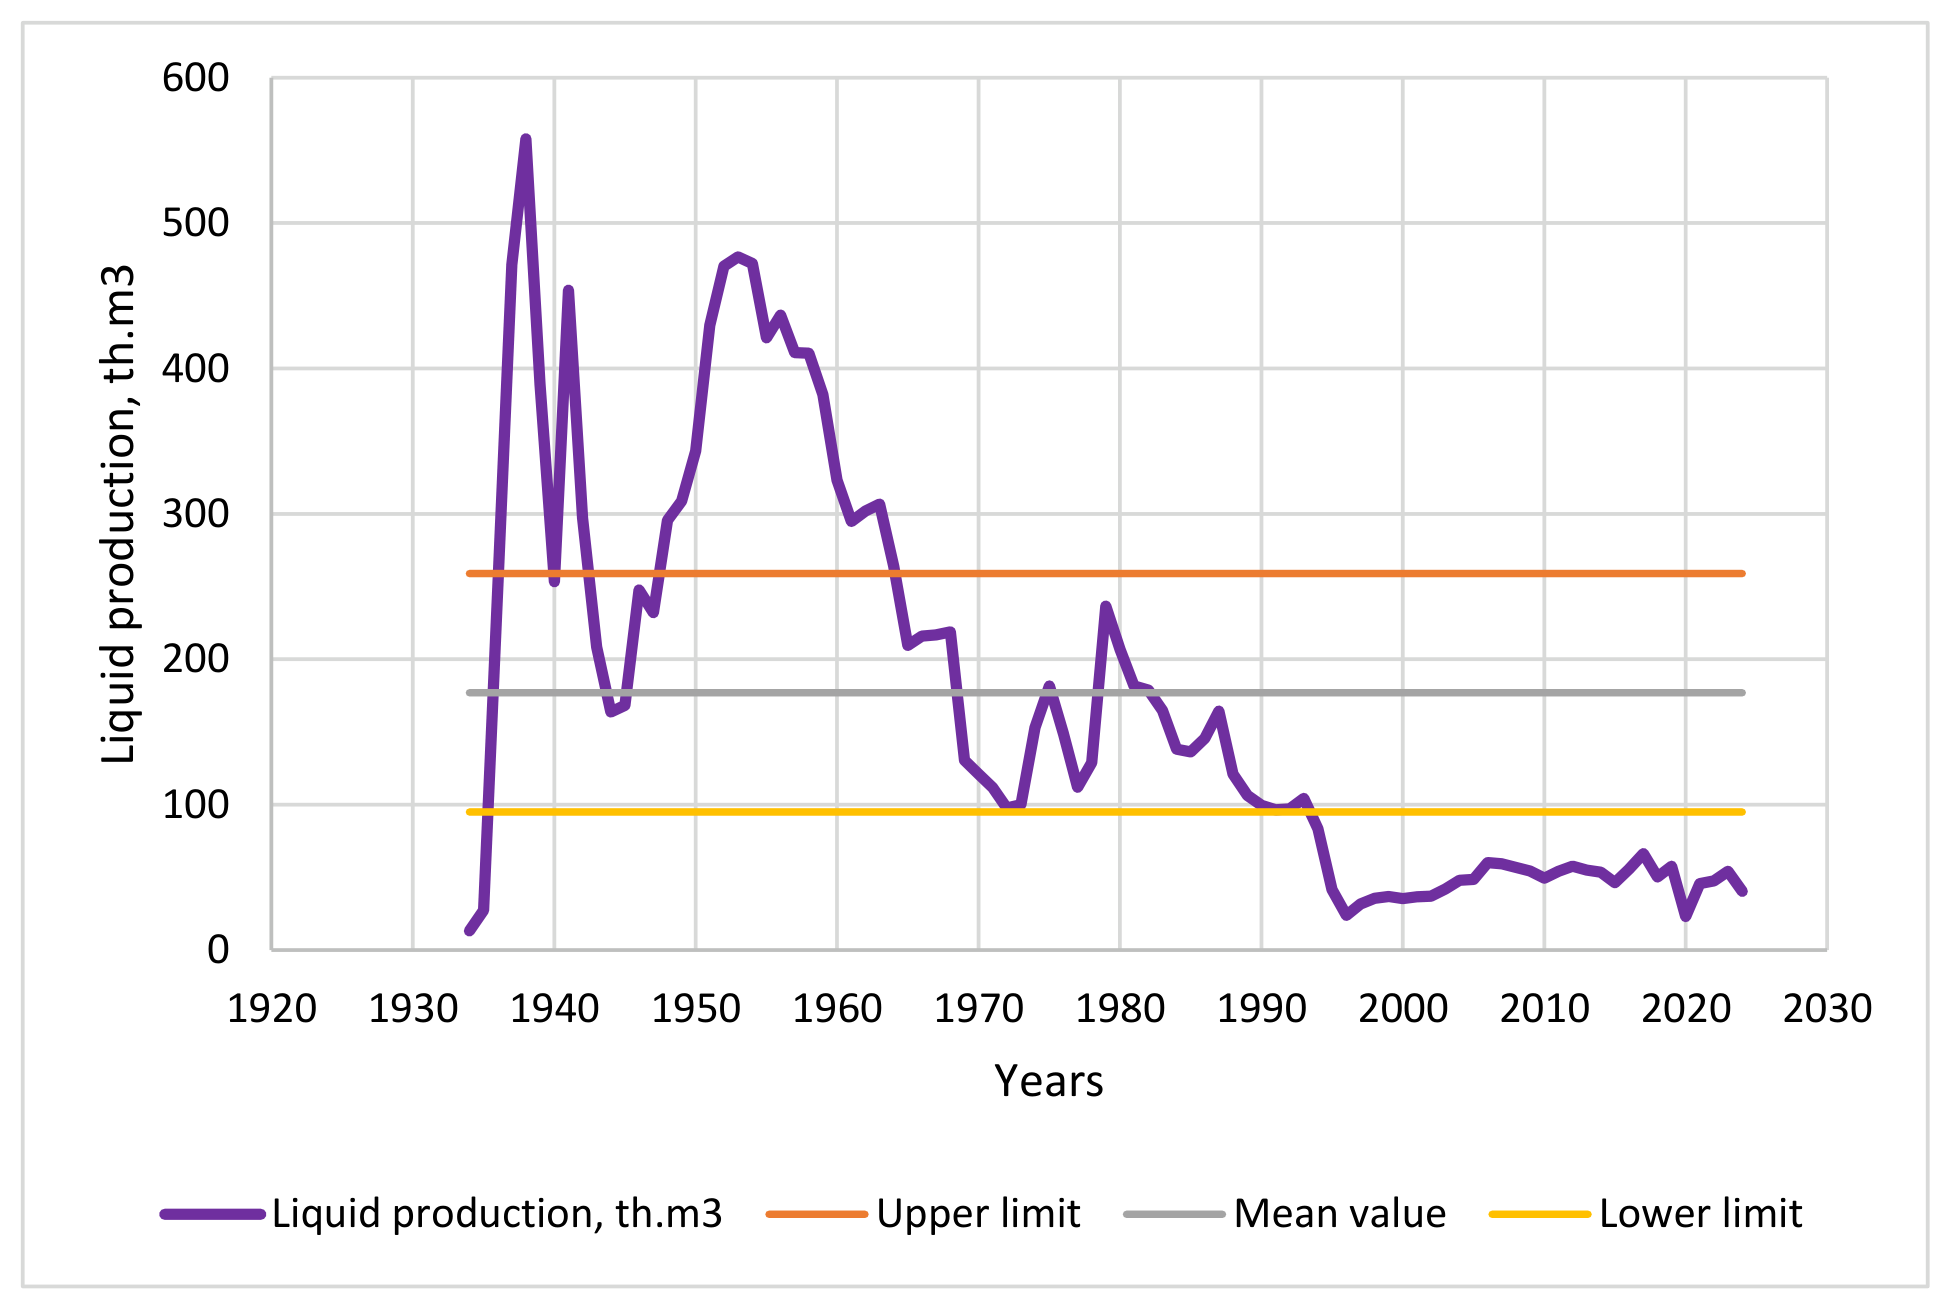
Figure 9.
Shewhart control chart showing annual gas production and control limits in Horizon VIII of the Lokbatan field, 1934-2024.
Figure 9.
Shewhart control chart showing annual gas production and control limits in Horizon VIII of the Lokbatan field, 1934-2024.
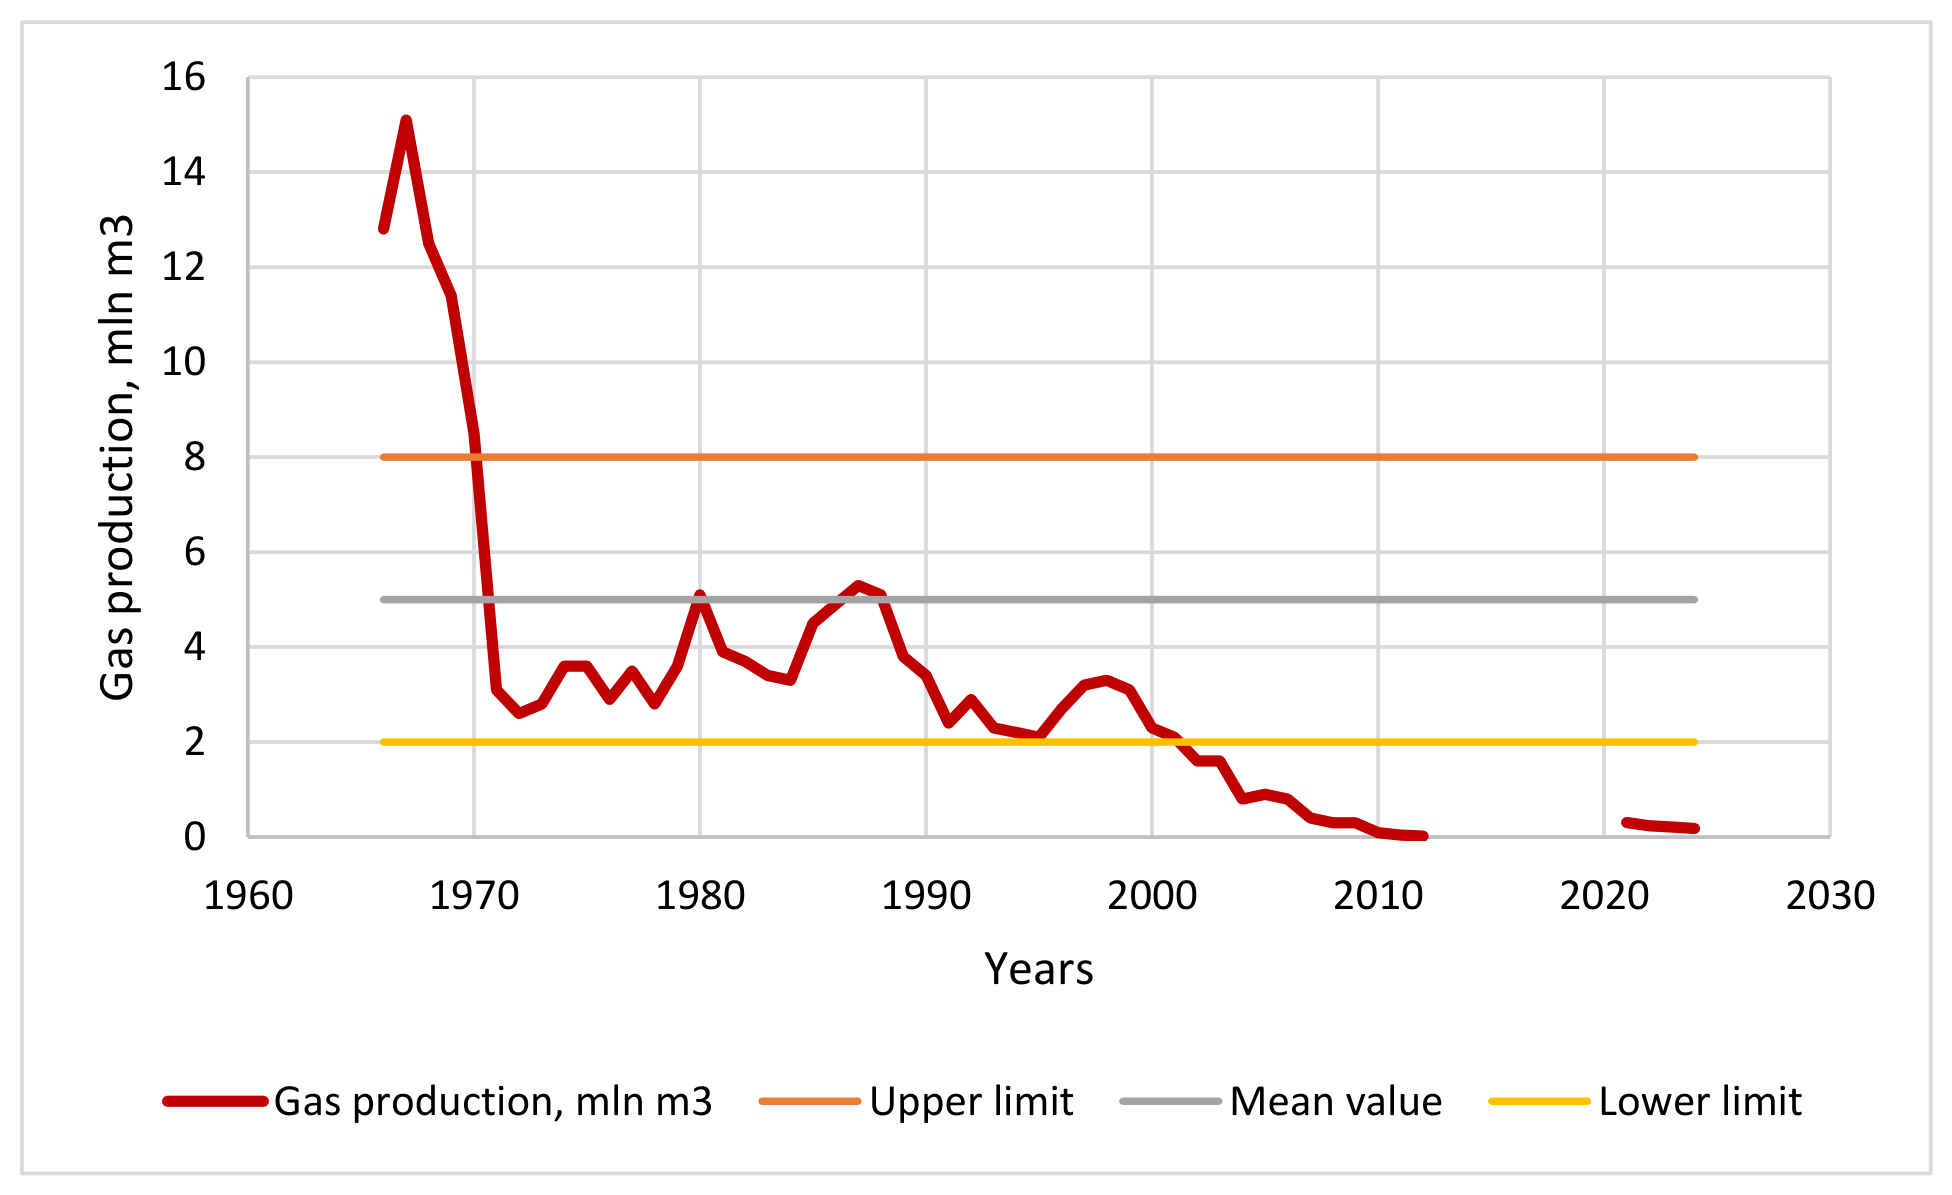
Figure 10.
Shewhart control chart showing annual gas factor related with and control limits in Horizon VIII of the Lokbatan field, 1934-2024.
Figure 10.
Shewhart control chart showing annual gas factor related with and control limits in Horizon VIII of the Lokbatan field, 1934-2024.
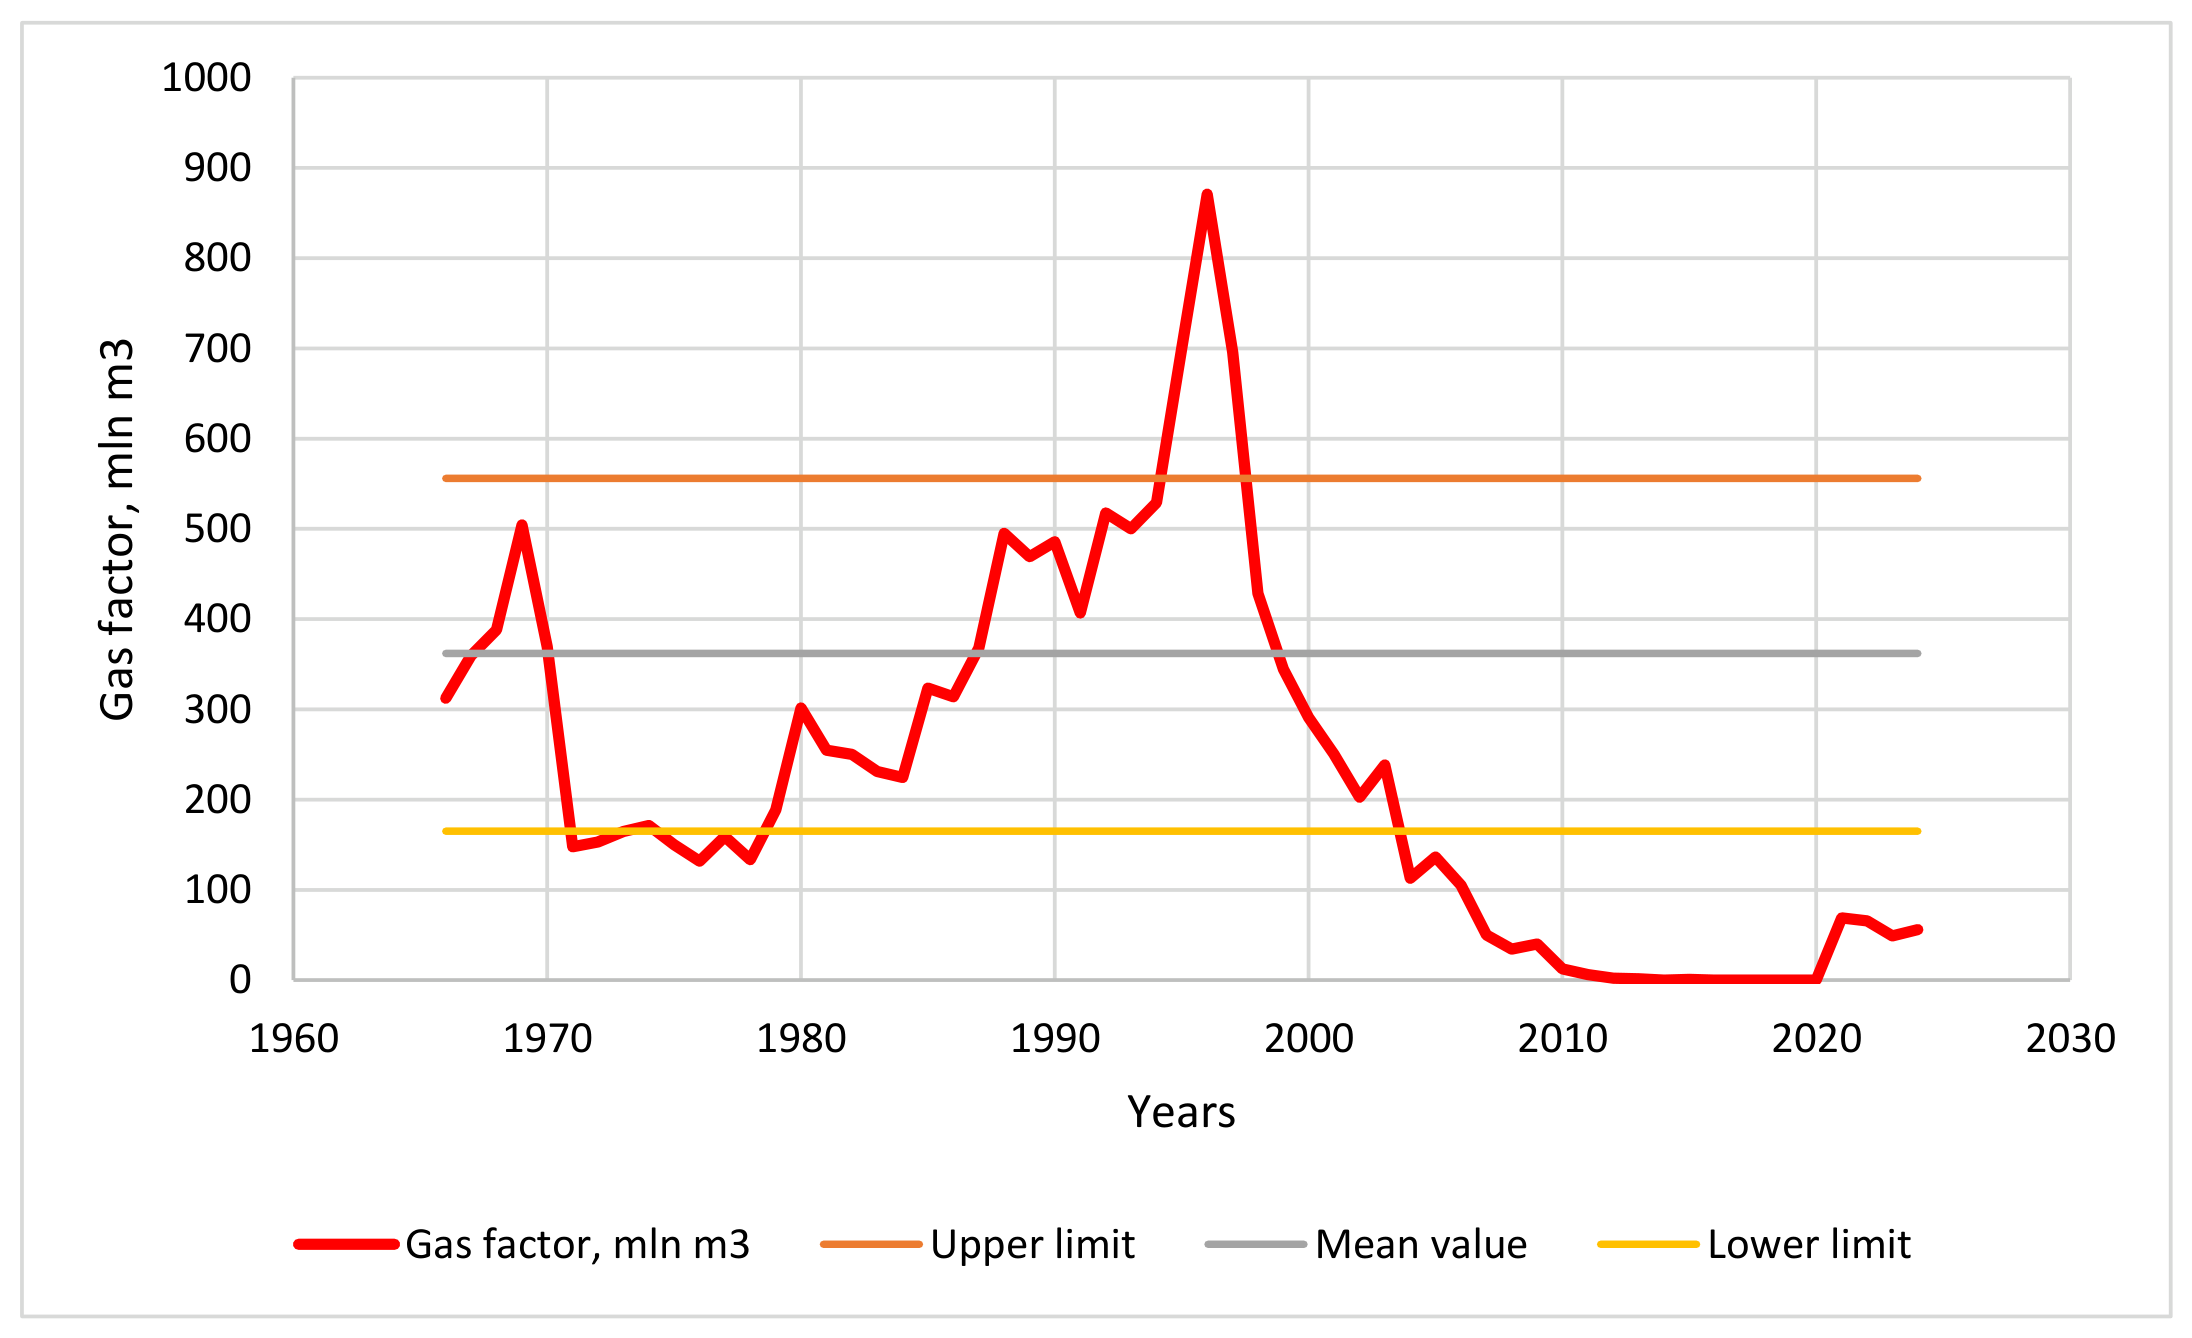
Figure 11.
Shewhart control chart showing annual water cut adjustment in Horizon VIII of the Lokbatan field, 1941-2024.
Figure 11.
Shewhart control chart showing annual water cut adjustment in Horizon VIII of the Lokbatan field, 1941-2024.
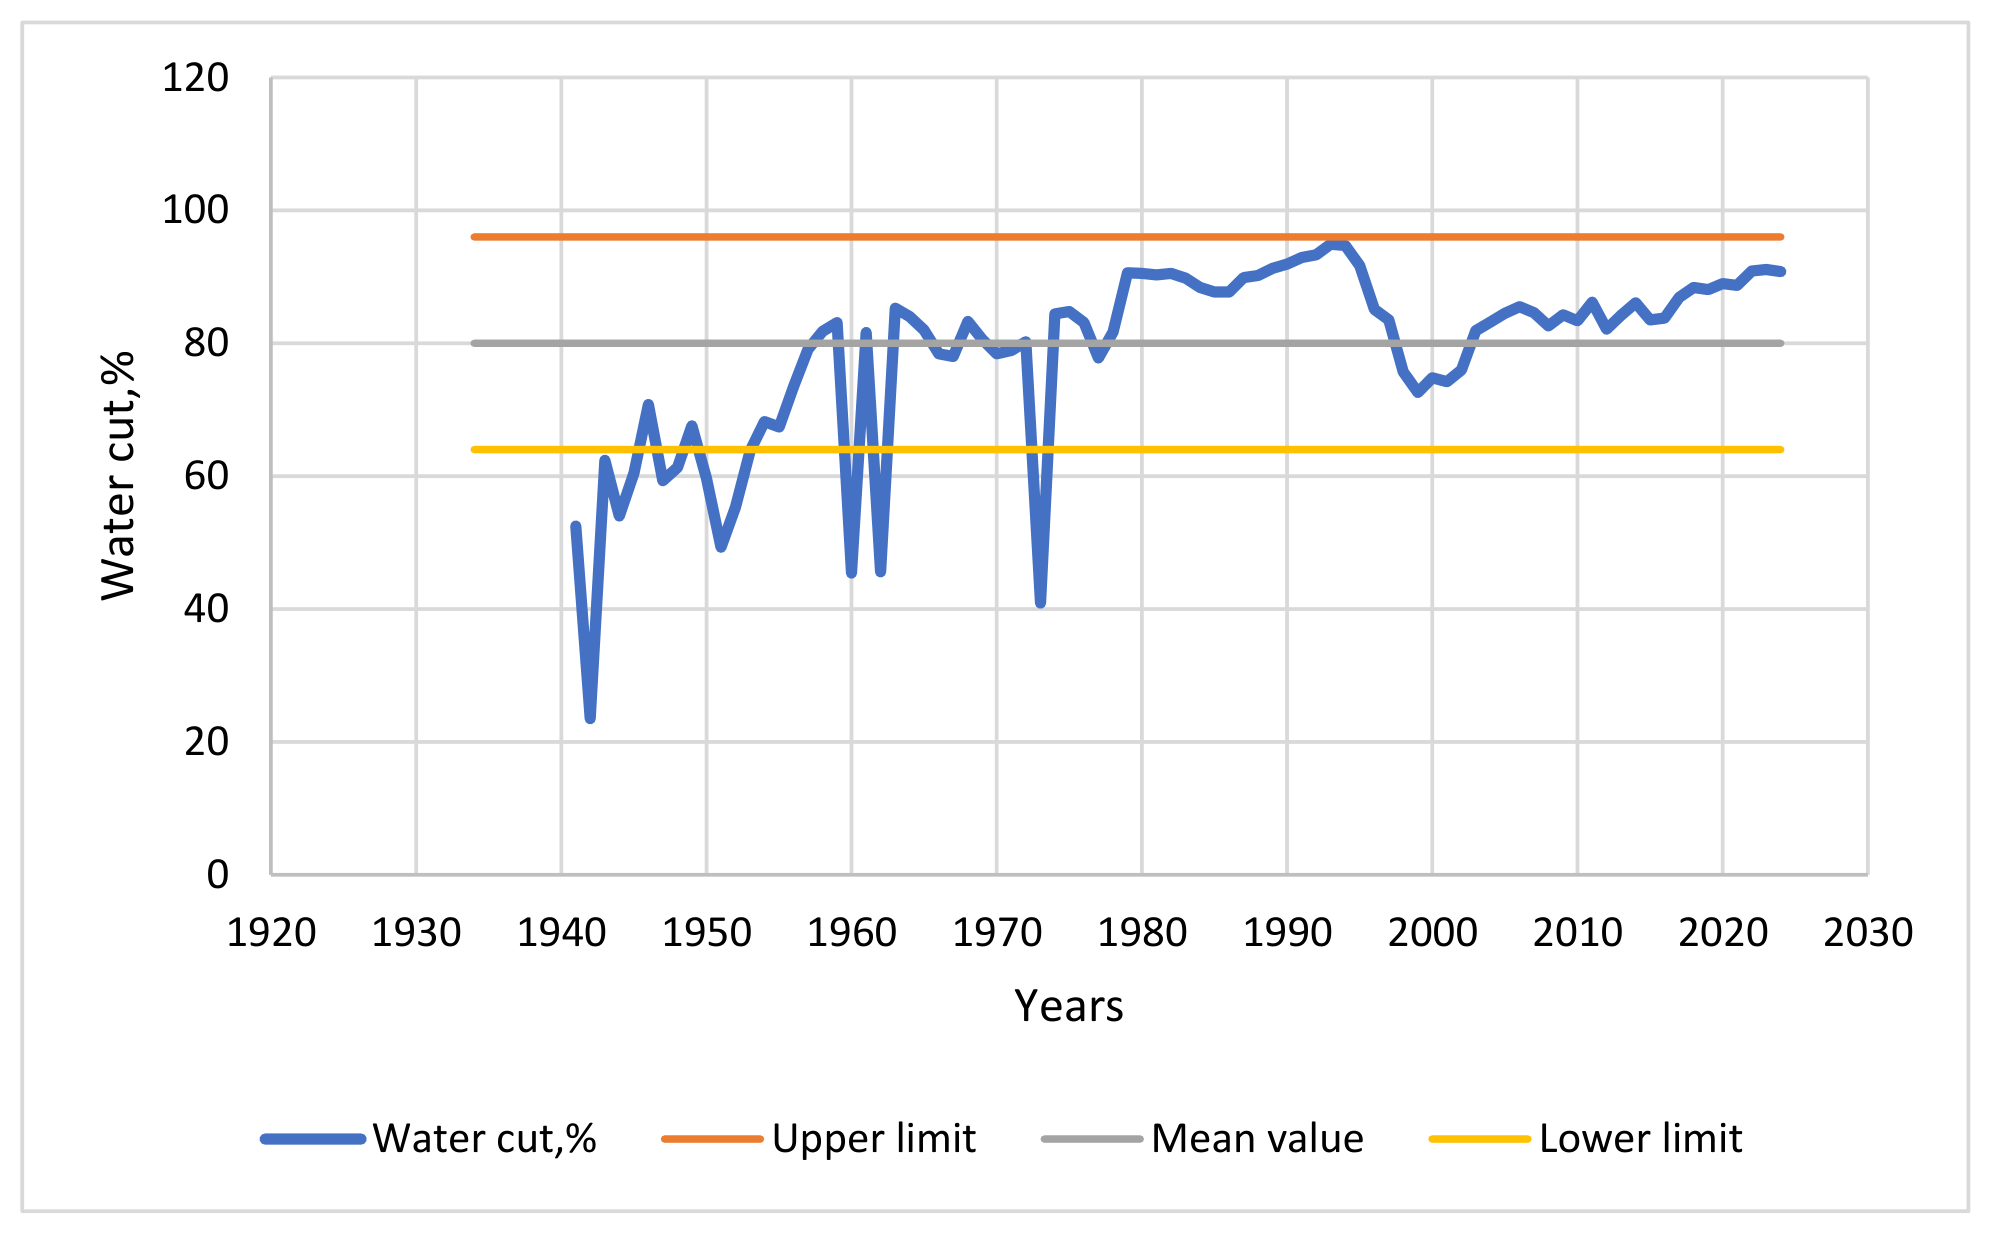
Figure 12.
Sequence of eruptions of Lokbatan volcano over last 100 years.
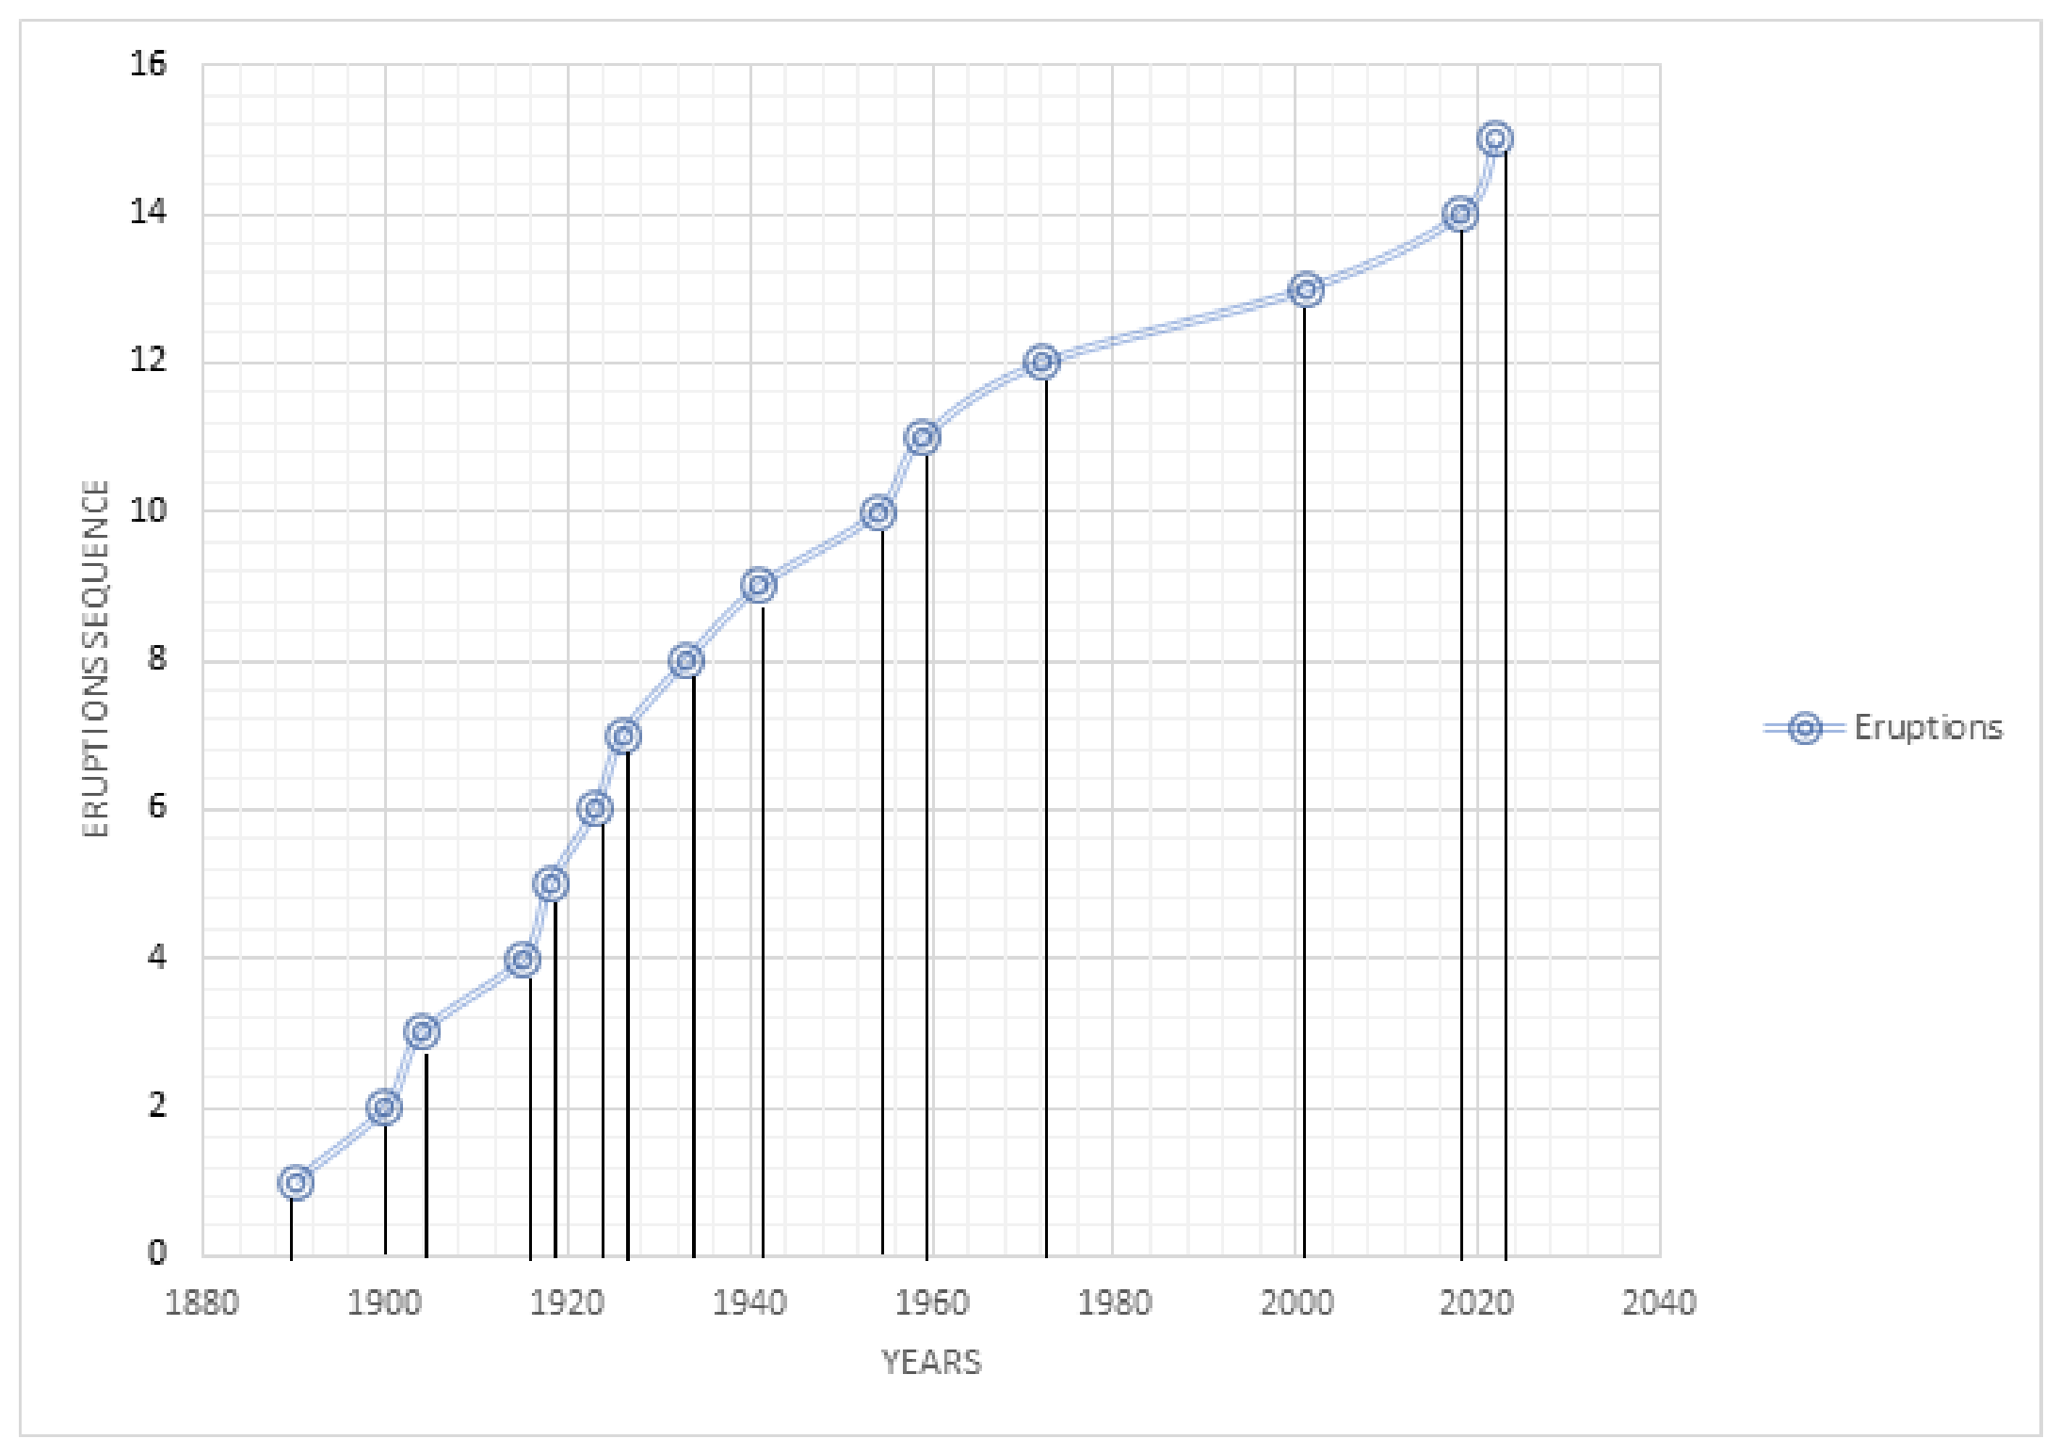
Figure 13.
Model of the dependence of Lokbatan volcano eruptions on annual oil and water production.
Figure 13.
Model of the dependence of Lokbatan volcano eruptions on annual oil and water production.
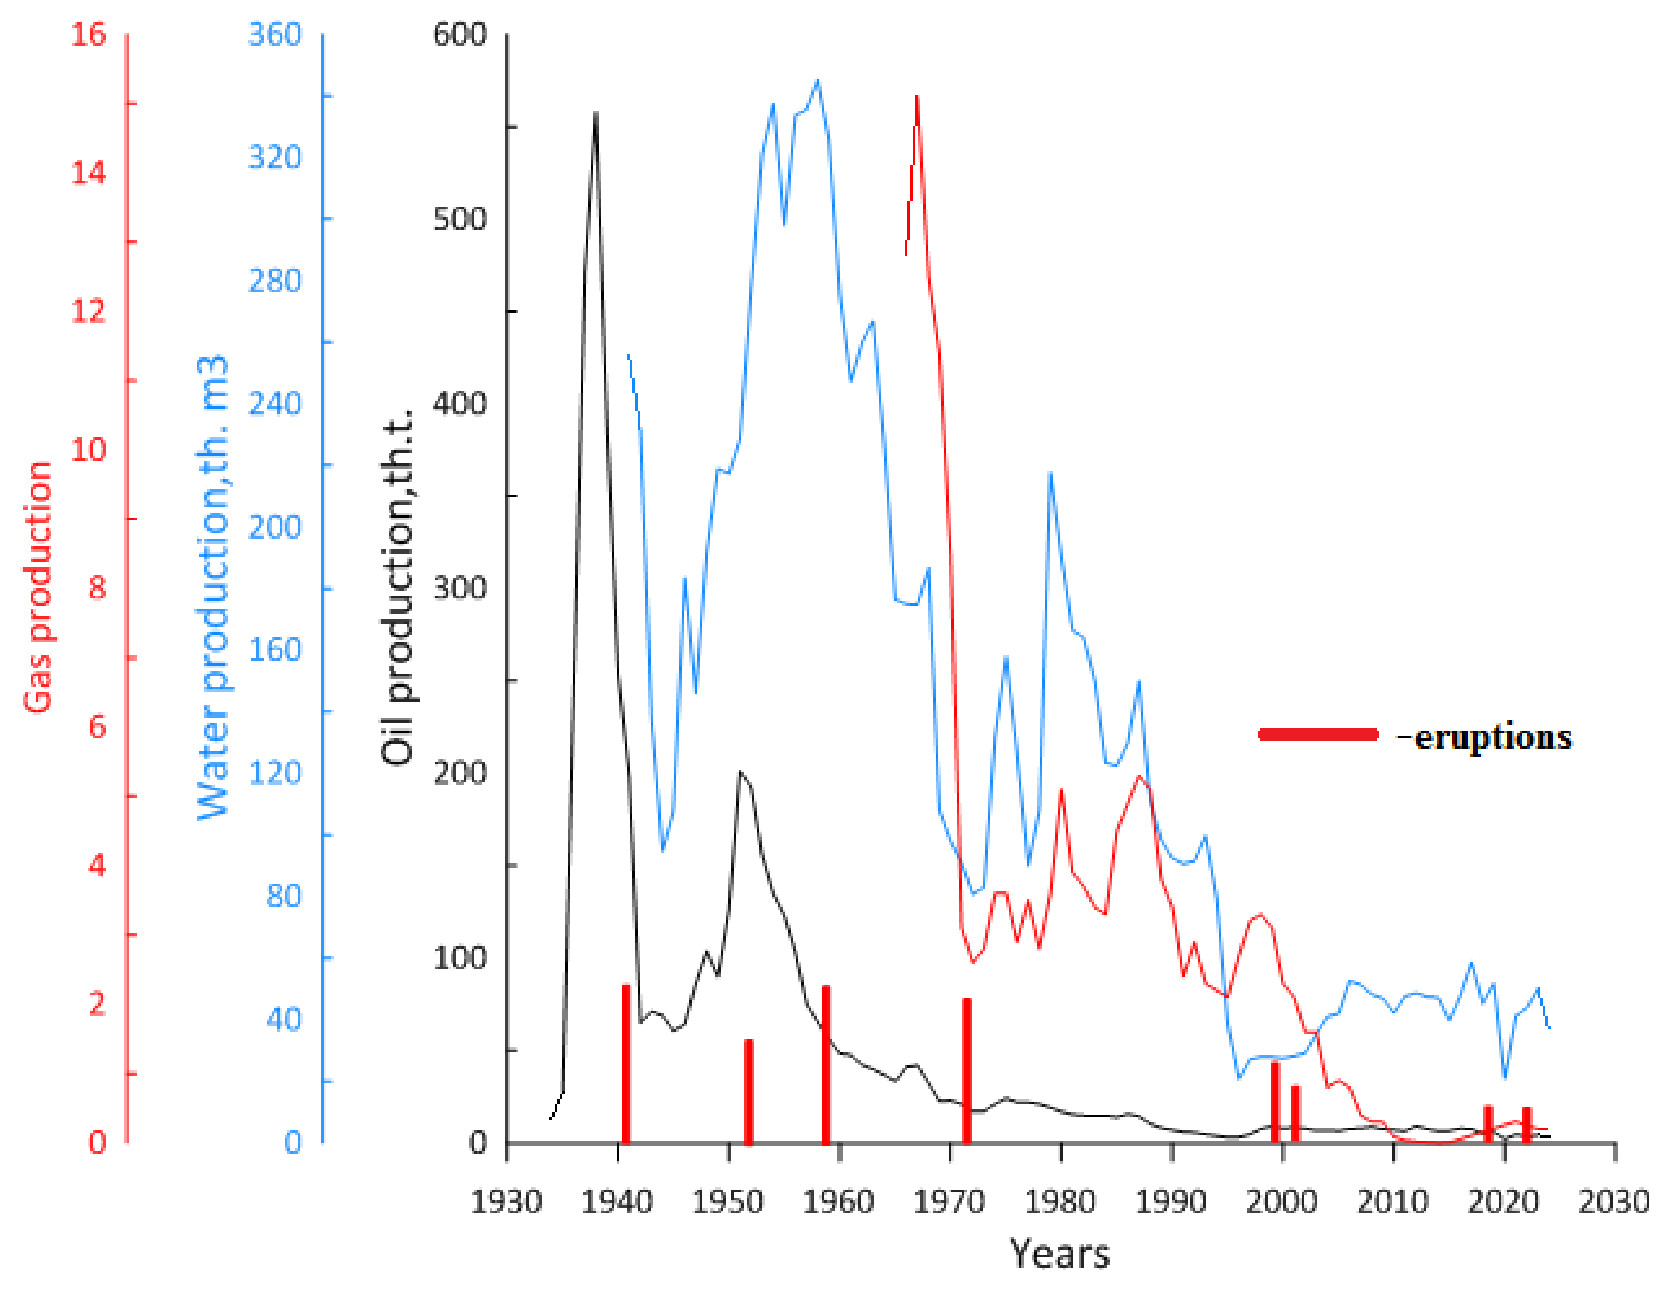

Table 1.
Eruptions of the Lokbatan mud volcano.
| Year | Duration / Character | Main Manifestations | Column Height / Flames | Intensity / Environmental Impact | Relation to Lokbatan-Puta-Gushkhana Fields |
|---|---|---|---|---|---|
| 1850 | First recorded event | Mud ejection | N/A | Low; primarily noted as the first evidence of activity | Initial indication of activity over hydrocarbon-bearing layers in the region |
| 1887 | Strong eruption | Gas release with methane ignition | Several tens of meters | Moderate; flames and smoke observed | Reflects pressure buildup in oil and gas-bearing horizons |
| 1972 | One of the most powerful | Gas and mud ejection | >300 m | Very high; significant local impact | Substantial overpressure in deep reservoirs, intensive degassing |
| 1998 | Major eruption | Formation of new mud cones | 50-100 m | Moderate; surface morphology changes | Surface expression of fluid migration from productive layers |
| 2001 | Several days | Gas and mud emissions | 30-60 m | Moderate; localized degassing | Sustained degassing and reservoir pressure effects in adjacent zones |
| 2018 | One of the most recent notable events | Gas and flame, mud ejection | 100-150 m | Medium-high; visually prominent | Confirms active petroleum system, fluid migration and pressure release |
| 2022 | ≈10 minutes | Short-lived mud and gas release, flame | 20-30 m | Low; brief event | Localized pressure release and fluid migration, reflecting dynamic hydrocarbon layers |
Disclaimer/Publisher’s Note: The statements, opinions and data contained in all publications are solely those of the individual author(s) and contributor(s) and not of MDPI and/or the editor(s). MDPI and/or the editor(s) disclaim responsibility for any injury to people or property resulting from any ideas, methods, instructions or products referred to in the content. |
© 2026 by the authors. Licensee MDPI, Basel, Switzerland. This article is an open access article distributed under the terms and conditions of the Creative Commons Attribution (CC BY) license (http://creativecommons.org/licenses/by/4.0/).
Copyright: This open access article is published under a Creative Commons CC BY 4.0 license, which permit the free download, distribution, and reuse, provided that the author and preprint are cited in any reuse.