
Submitted:
26 August 2026
Posted:
27 August 2026
You are already at the latest version
Abstract
Complex construction processes have many state variables, a lot of redundant monitoring indicators and after occurring process transitions, the relationships between monitoring indicators are not observable. In this study, a 36 dimensional state vector is created, which is an observable digital twin model of construction processes (CP-ODT) that can be used to model schedule deviations, resources loading, component orientations, equipment operating states, work environments in construction, etc. State transitions between different construction phases, such as structural construction, MEP installation, envelope construction, and interior work, are modeled through the use of phase transition matrices. The model takes the observability Gram matrix and assesses which 92 candidate indicators are contributing to identifying each state, and determines which is the minimal set of metrics and where to place sensors, given the cost of the measurements and node failure. A total of 268 days of experimental data were gathered from four building projects for the 7, 936 component hoists, 1, 824 work packages, 124 sensor nodes, and 19.86 million records. Finally, CP-ODT was able to keep 27 metrics and 46 sensor nodes with the minimum eigenvalue of observability Gram matrix improving from 0.011 to 0.058. The error in work package completing time reduced from 1.21 days to 0.54 days, the error in hoisting cycle time reduced from 79.6s to 32.8s, the error in component orientation reduced from 0.94° to 0.39° and the error in equipment load reduced from 8.6KN to 3.7KN compared with the fixed-measurement-point state model. The results show that CP-ODT is able to identify key states in complex construction processes with a small number of measurement metrics and continues to monitor processes in the transitions.
Keywords:
intelligent construction management
; observable digital twin
; minimal metric set
; sensor deployment
; state estimation
; construction monitoring
1. Introduction
Overlapping stages of construction work, coupled states, and a continuously evolving set of monitoring targets are hallmarks of complex construction processes, such that the more data on site, the less they are able to identify key states. To this end, Yamada et al. [1] (2023) based on the observability Gram matrix estimated the capability of state identification from each sensor node to provide a computational basis for the sensor node redundancy reduction problem and Zhang et al. [2] (2024) further investigated the relationship between functional observability and optimal sensor deployment, revealing the intrinsic connection between state identification capability and sensor configuration. In the meantime, Chadha et al. [3] (2025) introduced information value and monitoring cost into the configuration of sensors, shifting the focus of observation optimization from improving only the accuracy to reducing the cost of observations and improving the economy. Li and Brennan [4] (2024) highlighted the importance of real-time monitoring data and model updates from a digital twin perspective to ensure consistency between the physical and virtual states. Most of the previous research, however, are for objects which have fixed structures and stable observation relationships, but in the complex construction process, the observation relationship between measurement points and the observed object may change with the change of construction phases, the previous observation relationship between measurement points and object can be invalid. Additionally, a simple computational approach to balancing node failures while managing measurement costs and ensuring full observability from stage to stage is still not available. To solve this problem, this study proposes the Construction Process Observable Digital Twin Model (CP-ODT) where 36-dimensional construction states, stage transition matrices, Gram observability evaluation and minimum metric configuration are considered and combined in a single framework, which gives a computational foundation for state identification and sensor node optimization for complex construction processes.
2. Problem Description of Observable Digital Twins for Complex Construction Processes
There are high levels of data heterogeneity in complex construction processes. Progress records, resource scheduling information, component orientations, equipment operating parameters and environmental monitoring data have varying sampling periods, data structures and update frequencies. Thus, the activities of timestamp alignment, field mapping and state encoding must be done before entering the digital twin computation chain. Digital twin infrastructure stresses the fact that the physical object, the data interfaces and the virtual entities are always connected [5] and in the construction monitoring scenarios, the information from the various sources should be combined in process control [6]. To this end, CP-ODT maps on-site information into a 36-dimensional state vector and classifies it into five types of states: progress deviation, equipment load, component orientation, equipment operating conditions and work environment, so that data from different sources can be mapped into a common computational space. Simultaneously, the four stages of construction—structural construction, MEP installation, envelope construction, and interior construction—are in different states in relation to the government, and changes in the construction processes shift the sensitivity of observed variables to the hidden states. The 92 candidate indicators cannot be retained directly based on the fixed measurement points as well since the layout of the sensors is also limited in the process of structural monitoring by the requirements of state identification [7]. Rather, a state-to-observation mapping needs to be re-established based on the current phase, and it will be based on actual data that can be computed and used to update the observation relationships as the phases change.
3. CP-ODT Model and Minimum Metric Configuration Method
3.1. Mapping the Multi-Phase Construction State Space to the Digital Twin
CP-ODT initially writes site-specific progress, resource, component, equipment and environment data to the state cache, with common time stamps, and associates them across data sources with work package identifiers, equipment task codes, and component object IDs. Stable correspondence between observational information and the computed state is important for complex structural state identification [8]. The system is also a 36-dimensional state vector, which is the core of the digital twin and encodes the four types of phase labels: structural construction, MEP installation, envelope construction and interior work, as shown in Figure 1. If a change of phase occurs because of a task event, the computational programme changes the state transition matrix, input matrix and observation matrix at the same time so that it is not continued to be applied to construction objects that have already undergone a change of phase. Multi-phase states have the recursive relationship:
where is the construction state vector at time step ; is the external task input; is the on-site observation vector; are the state transition matrix, input matrix, and observation matrix corresponding to the current phase, respectively; and represent process disturbances and measurement noise, respectively.
Where is the state mapping matrix for the transition from phase to phase , and sk is the current construction phase label. is constructed from historical phase-transition records, state correspondence rules, and physical continuity constraints. State components that remain physically valid are retained, obsolete components are deactivated, and newly activated states are mapped according to the target phase. A simplified form can be expressed as , where denotes a retained state and denotes a deactivated state. The digital twin layer then calls the corresponding phase-specific matrices according to the current phase label.
In the case of engineering structure monitoring, continuous data acquisition and state association are also crucial for multi-source sensing [9]. Thus, while switching phases, the system does not directly clear existing states but rather retains the components of states that still have physical significance, through , while deactivating the obsolete observation channels and setting up new data mappings, thus allowing the physical states under different construction conditions to enter a unified computational space continuously.
3.2. Observability Gram Matrix and Calculation of Candidate Metric Contributions
CP-ODT creates an observation index table with 92 candidate metrics based on construction phases and produces phase observation matrices based on the mapping relationships of the metrics to the 36-dimensional state components. The observability Gramian can be directly used to determine a contribution of the measurement combination towards the reconstruction of the system state for sensor node selection. The calculation procedure has been designed to recursively calculate the state transition matrix in a finite time window, and to accumulate the observation data at every time instance to form a 36×36 dimensional observability gram matrix, then it calls an eigenvalue-decomposition routine to find out the smallest eigenvalue which can be used to characterize the distinguishability of the weakest direction of the state. Candidates' metrics are computed by an item-by-item masking:
where is the observability Gram matrix for construction phase ; is the current set of candidate metrics; is the length of the computational time window; is the phase state transition matrix; is the observation matrix corresponding to the candidate set; is the minimum eigenvalue of the matrix; and is the marginal discriminative contribution of the th metric.
It masks, each one alone, every candidate metric and reconstructs the Gram matrix, and sorts the candidate metrics as per their contribution, wise. However, because functional observability is directly related to configuration of sensors, screening process does not rely upon univariate correlation coefficients, but instead maintains information about state propagation relationships and joint observation information over multiple metrics for use as computational input for constrained metric compression.
3.3. Minimum Metric Configuration Under Measurement Cost and Node Failure Constraints
Due to events like power outages, loss of communication packets, offline nodes and others that may occur at complex construction sites, the configuration process takes into account the N−1 mode of failure of the nodes, and performs independent constraint checking for all single-node failure scenarios. The engineering decision-making process can be driven by uncertainty and risk information provided by the digital twin, via scenario-based calculations [10]. The first step is to build the measurement costs using two parts, data acquisition and node occupancy, and optimize the following objective function:
where is the total configuration cost; indicates whether the th metric is enabled; indicates whether the th node is enabled; is the metric acquisition cost; is the node deployment and communication cost; and are the weights for the two cost categories; and represent the number of metrics to be configured and the number of candidate nodes, respectively. In the experiments, the weighting coefficients were set to and 5 to balance measurement acquisition and node deployment costs. Sensitivity was further evaluated by varying from 0.3 to 0.7 while setting .
The cost reduction must not be sacrificed for the ability to recognize the state; therefore, the algorithm immediately reconstructs the Gram matrix for the current phase after each removal of a low contribution metric, and performs an observability threshold check:
In the equation, represents the observability Gram matrix recalculated after the failure of node ; represents its minimum eigenvalue; and represents the minimum allowable observability threshold under N−1 failure conditions.
If a constraint is detected by the application, it will reverse the current deletion and lock the corresponding metric; if the constraint is still valid, it will update the binary configuration vector and continue the search. Thus, metric compression, fault tolerance, and deployment costs are combined in one iteration, so that low cost configurations do not lead to information gaps in critical construction states.
3.4. Sensor Node Deployment and Online Construction Status Estimation
After the minimal metric set is determined, CP-ODT creates a correspondence between the sensing nodes and construction objects according to the “node ID—metric ID—object ID—phase ID” quadruplet, and establishes the valid measurement channels to the real-time data queue. The data acquisition service constantly checks the node status, and if this check fails, such as due to a difference in time, a failure in the communication or an object unbinding, observation channels are reconstructed so that incorrect data will not continue to be fed into the calculation of the digital twin state. A discrete Kalman state estimator (KF) is used for the online estimation. The calculation procedure is the following: First a prior state is created from the state transition relationships for the current construction phase:
where is the prior state at time ; is the corrected state from the previous time step; and are the state transition matrix and input matrix for the current phase, respectively; and is the construction task input.
As soon as the real time observation enters the calculation buffer, the system generates the observation residue on the basis of the current effective node, and uses the Kalman gain to correct the state:
where represents the corrected construction state; is the Kalman gain matrix; is the real-time observation vector; and is the observation matrix for the current stage.
As the process label changes, the computation thread re-loads the observation matrix and the node indices to correspond to the new process label, and removes channels that are no longer to be observed from the data queue so that the data references corresponding to the orientation of the construction task, the operating conditions of the equipment and the load on the resource are all consistent during the continuous sampling process.
4. Experimental Results and Analysis
4.1. Experimental Data and Parameter Settings
Experimental data were synchronized using uniform timestamps across work packages, hoisting events, sensor records, and construction-phase labels. The dataset covers structural construction, MEP installation, envelope construction, and interior work, enabling phase-transition modeling, as shown in Table 1. It contains 268 construction days, averaging 29.6 component hoists, 6.8 work packages, and 74,100 monitoring records per day. State data were represented by 36-dimensional vectors, with a 36×36 Gram matrix and a 92×36 observation-mapping relationship. In Equation (3), the cost weights were set to α=0.5 and β=0.5. All comparative calculations used identical parameters, time series, and state inputs. N−1 node-failure testing sequentially disabled individual observation channels and recalculated observability, ensuring consistent error evaluation without differences caused by data segmentation.
4.2. Minimum Metric Configuration and Observability Performance Analysis
Metric screening is a computational approach that combines a pruning of metrics with the lowest marginal contribution with constraint backtracking. As shown in Figure 2, CP-ODT reduced the original 92 candidate metrics to 27 retained metrics, eliminating 65 redundant metrics and achieving a compression rate of 70.65%. The minimum eigenvalue increased from 0.011 to 0.058, approximately 5.27 times the initial value. To examine the physical meaning of the compression, the candidate metrics were grouped into five state categories: progress deviation, equipment load, component orientation, equipment operating condition, and work environment. The retained and eliminated metrics in each category are listed in Table 2. The results indicate that the screening procedure removes highly overlapping observations while preserving metrics contributing to weakly observable state directions.
4.3. Comparison of Construction Status Estimation Errors Among Different Digital Twin Models
Figure 3 compares CP-ODT with the fixed-measurement-point model using four error target regions. CP-ODT reduced work-package completion-time error from 1.21 d to 0.54 d (55.37%), hoisting-cycle-time error from 79.6 s to 32.8 s (58.79%), component-orientation error from 0.94° to 0.39° (58.51%), and equipment-load error from 8.6 kN to 3.7 kN (56.98%). After phase transitions, the fixed model failed to converge because its observation relationships remained unchanged, whereas CP-ODT updated the observation matrix and applied Kalman correction. Mean residuals were 0.04 d, 1.72 s, 0.03°, and 0.18 kN, with RMSEs of 0.58 d, 35.21 s, 0.42°, and 4.06 kN, respectively. Residuals remained near zero, supporting the phase-wise linear approximation.
4.4. Analysis of Observability Continuity Under Process Transitions and Node Failures
Finally, CP-ODT had a node retention rate of 37.10% after going through the minimum-measurement screening process. As can be seen in Figure 4, the observability of the phases is defined by a phase-failure observability spectrum fingerprint diagram, in which a Gram matrix feature spectrum fingerprint of each phase of the construction is shown, and the locations of phase transition matrix reconstruction are marked at the three process phase transitions at the same time. The node fault-tolerance analysis is performed one by one and the 46 valid nodes are masked by using N-1 method; the computational thread removes the corresponding observation channels, and reconstructs the current Gram spectrum. Some directions have a weak local contraction where a node goes offline, but no features of the spectrum are discontinuous due to the phase switching in the normal state and the single node failure state. This shows that phase label switching, node index updating, and observation matrix reconstruction are all effective in suppressing mismatches in the fixed measurement point relationships after process changes, so that the digital twin state estimation can continuously provide inputs for state estimation in the face of process changes and the offline status of a few nodes.
5. Conclusions
To tackle the issue of observation redundancy and phase switching mismatch in the complex construction process, it could be solved uniformly by state space reconstruction, Gram observability evaluation and constrained sensor configuration. In CP-ODT, all 27 metrics and 46 nodes were continuously identified in their state, and all four types of state estimation errors were significantly reduced compared with the fixed-measurement-point model, by mapping the construction information from multiple sources into the computable states, and synchronously updating the observation relationships in the phase transition process. These results are consistent with the concepts of observability-driven sensor selection, cost-constrained deployment, and online updates of digital twins. The ability to handle concurrent multi-node failures and the generalizability to other projects still require further validation because the current data cover only four building projects, 268 construction days, and the N−1 single-node failure assumption. The 36-dimensional state vector and four-phase classification are project-specific implementations rather than universal definitions. For bridges, tunnels, or different construction methods, the state variables, phase labels, and observation mappings should be redefined, while the observability evaluation, metric compression, fault-tolerance constraints, and online state-estimation framework can remain unchanged. Dynanic graph topology and probabilistic failure models can be included in future research to further develop the adaptive observation capacity in the face of complex construction disturbances.
References
- Yamada, K.; Nagata, T.; Nakai, K.; et al. Study on Efficient Sensor Node Selection for Observability Gramian Optimization⋆[J]. IFAC-PapersOnLine 2023, 56(2), 8610–8615. [Google Scholar] [CrossRef]
- Zhang, Y.; Fernando, T.; Darouach, M. Functional observability, structural functional observability, and optimal sensor placement[J]. IEEE Trans. Autom. Control 2024, 70(3), 1592–1607. [Google Scholar] [CrossRef]
- Chadha, M.; Hu, Z.; Farrar, C. R.; et al. A value-of-information-based optimal sensor placement design framework for cost-effective structural health monitoring (with application to miter gate monitoring)[J]. Struct. Health Monit. 2025, 24(4), 2091–2124. [Google Scholar] [CrossRef]
- Li, S.; Brennan, F. Digital twin enabled structural integrity management: Critical review and framework development[J]. Proceedings of the Institution of Mechanical Engineers, Part M: Journal of Engineering for the Maritime Environment 2024, 238(4), 707–727. [Google Scholar] [CrossRef]
- Lünnemann, P.; Lindow, K.; Goßlau, L. Implementing digital twins in existing infrastructures[J]. Forsch. Im. Ingenieurwesen 2023, 87(1), 421–429. [Google Scholar] [CrossRef]
- Padala, S. P. A bibliometric review of digital twin-enabled technologies for construction project monitoring and control[J]. Built Environ. Proj. Asset Manag. 2026, 16(3), 441–460. [Google Scholar] [CrossRef]
- Kyung, J.; An, J. H.; Eun, H. C. Sensor layout design for structural health monitoring[J]. Civ. Eng. J. 2024, 10, 3986–3997. [Google Scholar] [CrossRef]
- Hernández-González, I. A.; García-Macías, E. Towards a comprehensive damage identification of structures through populations of competing models[J]. Eng. With Comput. 2024, 40(5), 3157–3174. [Google Scholar] [CrossRef]
- Pezeshki, H.; Adeli, H.; Pavlou, D.; et al. State of the art in structural health monitoring of offshore and marine structures[C]//Proceedings of the Institution of Civil Engineers-Maritime Engineering. Thomas Telford Ltd. 2023, 176(2), 89–108. [Google Scholar] [CrossRef]
- Selvaraj, Y.; Paramasivam, S. K. INTEGRATING MONTE CARLO SIMULATION AND DIGITAL TWIN TECHNOLOGY FOR ADVANCED RISK MANAGEMENT IN FAST-TRACK INFRASTRUCTURE PROJECTS[J]. J. Civ. Eng. Manag. 2026, 32(4), 534. [Google Scholar] [CrossRef]
Figure 1.
CP-ODT Construction Process Observable Digital Twin and Minimum Metric Configuration Workflow.
Figure 1.
CP-ODT Construction Process Observable Digital Twin and Minimum Metric Configuration Workflow.
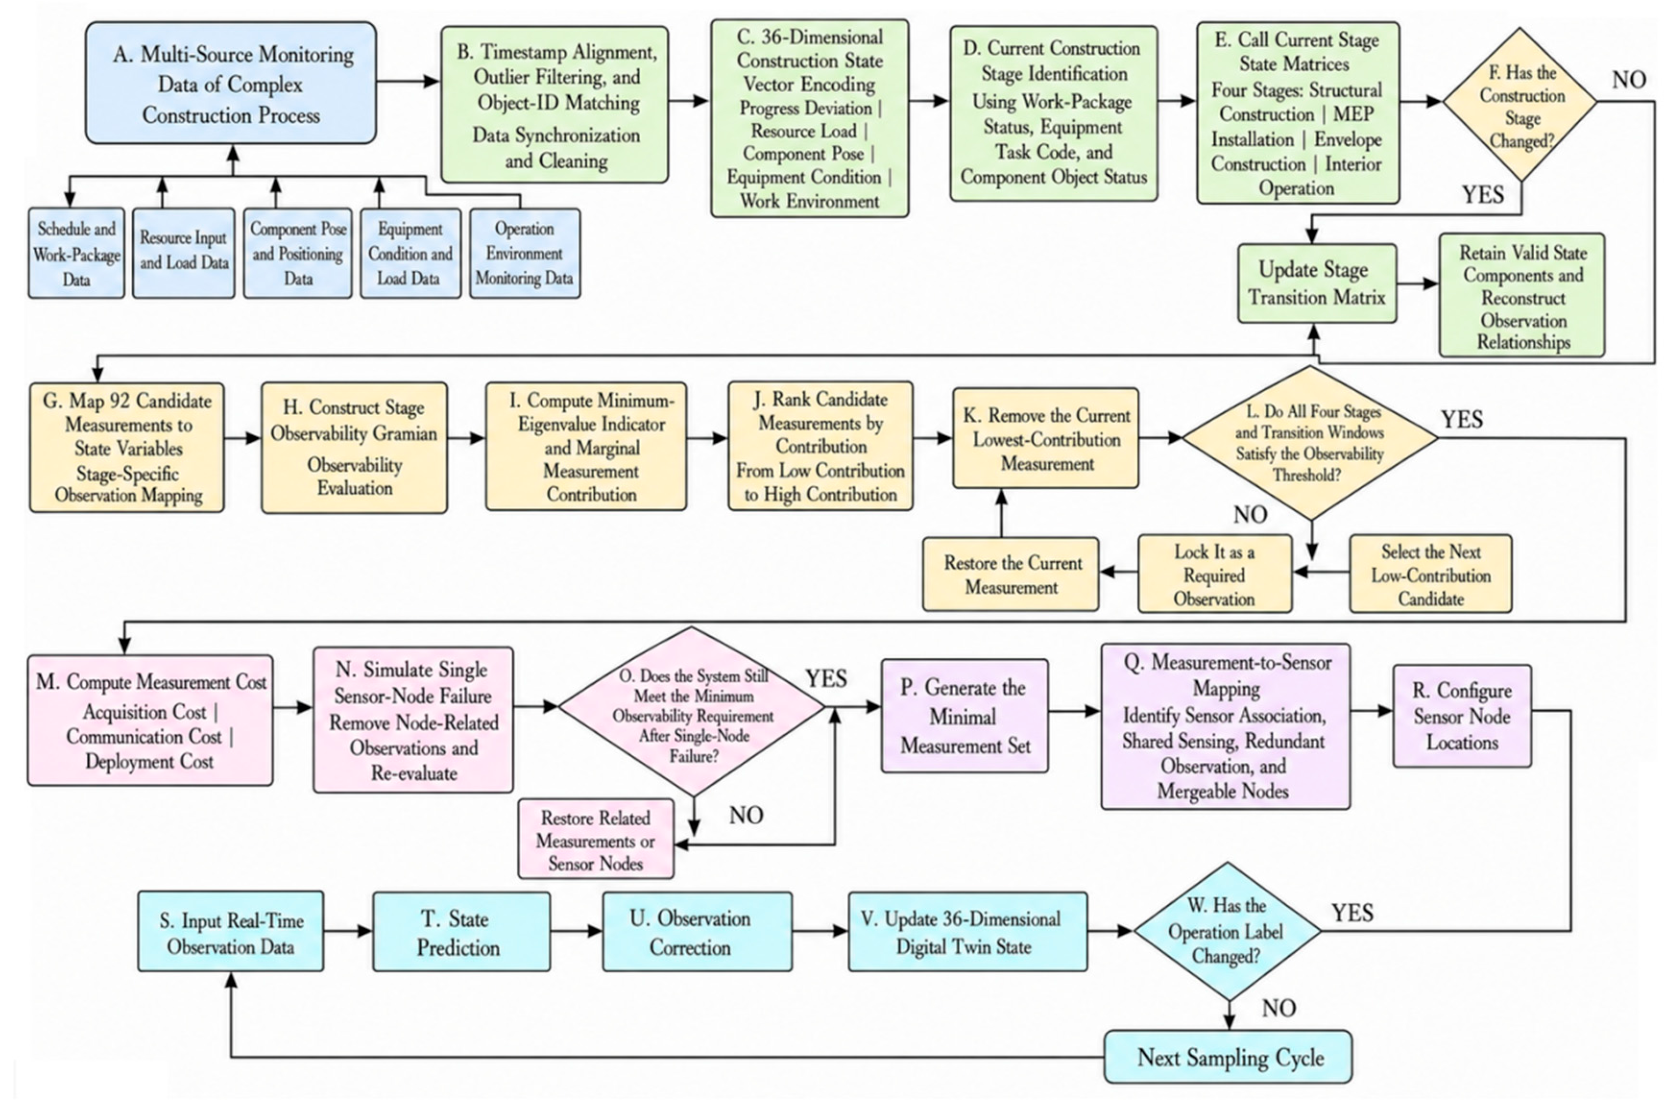
Figure 2.
Changes in Observability Performance During the Minimum Metric Screening Process.
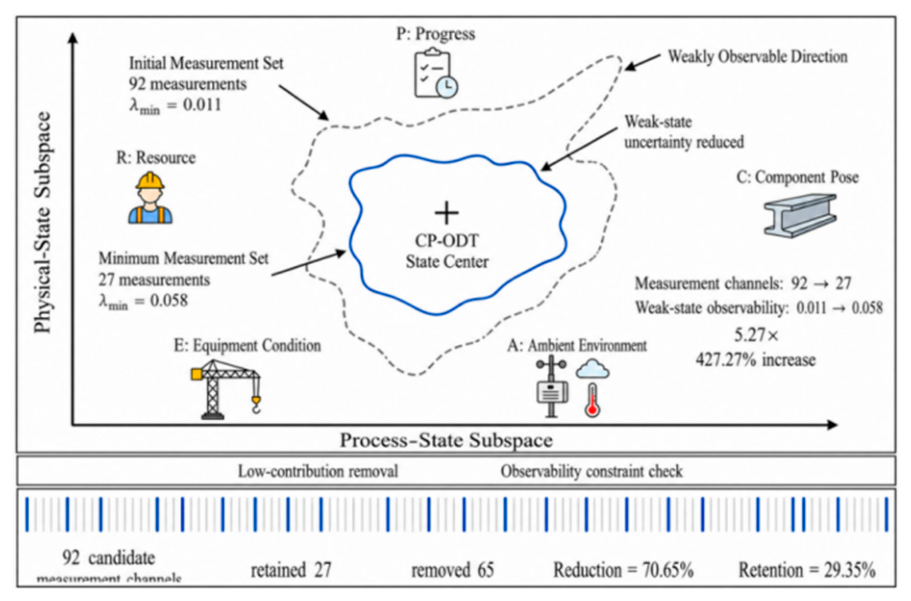
Figure 3.
Comparison of State Estimation Errors Between CP-ODT and the Fixed-Measurement-Point State Model.
Figure 3.
Comparison of State Estimation Errors Between CP-ODT and the Fixed-Measurement-Point State Model.
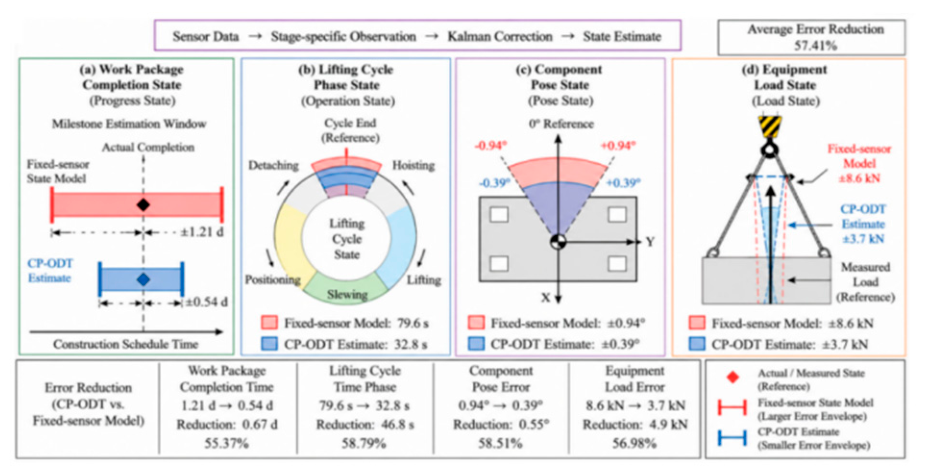
Figure 4.
Changes in State Observability Under Different Construction Phases and Node Failure Conditions.
Figure 4.
Changes in State Observability Under Different Construction Phases and Node Failure Conditions.
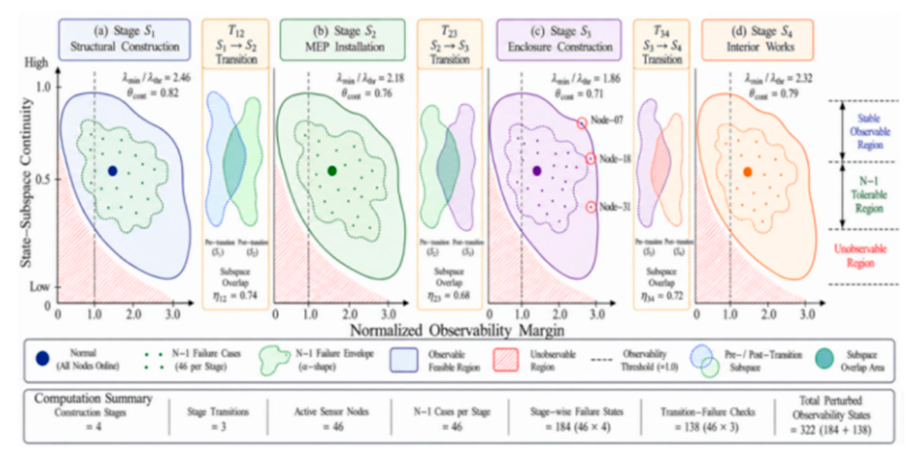

Table 1.
CP-ODT Experimental Data and State Observation Configuration.
| Configuration Items | Parameter Settings |
| Construction Project and Observation Period | 4 projects, 268 construction days |
| Component Hoisting Events | 7,936 times |
| Number of Work Packages | 1,824 |
| Original monitoring records | 19.86 million |
| Candidate sensor nodes | 124 |
| Status and construction phases | 36-dimensional status, 4 categories of construction phases |
| Candidate Observation Metrics | 92 |
Table 2.
Retained and Eliminated Metrics by State Category.
| State Category | Original Metrics | Retained Metrics | Eliminated Metrics |
|---|---|---|---|
| Progress deviation | 22 | 6 | 16 |
| Equipment load | 18 | 5 | 13 |
| Component orientation | 16 | 5 | 11 |
| Equipment operating condition | 21 | 6 | 15 |
| Work environment | 15 | 5 | 10 |
| Total | 92 | 27 | 65 |
Disclaimer/Publisher’s Note: The statements, opinions and data contained in all publications are solely those of the individual author(s) and contributor(s) and not of MDPI and/or the editor(s). MDPI and/or the editor(s) disclaim responsibility for any injury to people or property resulting from any ideas, methods, instructions or products referred to in the content. |
© 2026 by the authors. Licensee MDPI, Basel, Switzerland. This article is an open access article distributed under the terms and conditions of the Creative Commons Attribution (CC BY) license (http://creativecommons.org/licenses/by/4.0/).
Copyright: This open access article is published under a Creative Commons CC BY 4.0 license, which permit the free download, distribution, and reuse, provided that the author and preprint are cited in any reuse.