

Submitted:
25 August 2026
Posted:
27 August 2026
You are already at the latest version
Abstract
The Lycoris aurea (L’Hér.) Herb. complex—valued for its medicinal properties and horticultural applications—is characterized by extensive intraspecific dysploidy. However, a comprehensive molecular cytogenetic framework elucidating intraspecific karyotypic differentiation and the underlying evolutionary mechanisms has yet to be established. By integrating fluorochrome banding with 5S and 45S rDNA fluorescence in situ hybridization (FISH), we performed a comparative molecular cytogenetic karyotyping of 20 natural populations spanning 13 provinces in China and synthesized these results with previously published cytogenetic data to conduct a rigorous cytogeographic assessment of this species. Three distinct cytotypes were identified: cytotype A (2n = 14 = 8m + 6t/st), cytotype B (2n = 15 = 7m + 8t/st), and cytotype C (2n = 16 = 6m + 10t/st). Both multivariate karyomorphometric analyses and comparison of DAPI banding and rDNA FISH patterns revealed minimal inter-population karyotypic variation in cytotype A but pronounced intra-cytotypic karyotypic polymorphism in cytotype C. Integrated cytogenetic evidence supports Robertsonian translocation as the primary mechanism driving dysploidy in the L. aurea complex: cytotype C is inferred as the ancestral karyotype, from which cytotype A arose through double Robertsonian fusions and cytotype B through a single such fusion, establishing two parallel, evolutionarily independent lineages. The parapatric partitioning of the three cytotypes is interpreted as the outcome of synergistic effects among Quaternary climatic oscillations, topographic barriers, and ecological niche divergence.
Keywords:
Lycoris aurea
; intraspecific variation
; karyotype
; dysploidy
; ribosomal DNA (rDNA)
; fluorochrome banding
; fluorescence in situ hybridization (FISH)
; cytogeography
1. Introduction
Lycoris aurea (L’Hér.) Herb. is a perennial herbaceous plant belonging to the family Amaryllidaceae and the genus Lycoris. It is commonly referred to as the “Golden Spider Lily”, owing to its striking inflorescences characterized by vibrant golden-yellow tepals. L. aurea is native to China, Japan, India, Indonesia, Laos, Myanmar, Pakistan, Thailand and Vietnam [1]. In China, it is distributed in Fujian, Gansu, Guangdong, Guangxi, Guizhou, Henan, Hubei, Hunan, Jiangsu, Jiangxi, Shaanxi, Sichuan, Chongqing, Taiwan, Yunnan and Zhejiang provinces [1]. A recent study reported the presence of L. aurea in Shanxi Province [2]. L. aurea exhibits significant horticultural and medicinal value. Horticulturally, it serves as an effective groundcover in shaded understory environments and is widely employed in formal flower borders and alpine or rock gardens. It is also cultivated successfully as a container plant and harvested for use as a cut flower. Medicinally, its bulbs are rich in bioactive alkaloids—particularly lycorine and galanthamine—both of which demonstrate well-documented, multifaceted pharmacological activities, including acetylcholinesterase inhibition, antitumor and antiviral effects, etc. Owing to its relatively high galanthamine content and favorable biosynthetic profile, L. aurea is recognized as a promising botanical resource for the sustainable production of galanthamine, a compound approved for clinical use in Alzheimer’s disease management [1,3,4]. A comprehensive investigation into the genetic diversity and evolutionary history of L. aurea will yield critical insights to inform the conservation and sustainable utilization of Lycoris germplasm resources.
L. aurea is a morphological and cytological species complex, which includes L. aurea var. aurea, L. aurea var. surgens, L. aurea var. angustitepala, L. traubii and L. longifolia [1,5,6,7,8]. L. traubii and L. aurea are morphologically similar and closely related, but there is still debate over whether L. traubii should be included in the L. aurea species complex [1,5,6,7,8,9]. The latest research suggests that L. longifolia is a geographical population of L. aurea [7]. Among the approximately 20 recognized species of Lycoris, L. aurea displays the most extensive intraspecific variation in chromosome number, exhibiting dysploid series ranging from 2n = 12 to 2n = 16 [1,5,6,7,10,11]. Kurita established a foundational chromosomal classification system for the genus Lycoris, delineating three basic types based on arm ratio: M-type (metacentric and submetacentric chromosomes, arm ratio = 1.0–3.0), A-type (acrocentric chromosomes, arm ratio = 3.01–19.99), and T-type (telocentric chromosomes characterized by dot-like short arms and arm ratio > 20) [12]. This tripartite system has been widely adopted in cytological and taxonomic studies of Lycoris. Prior to this classification system, chromosomes in Lycoris were historically categorized into two types: rod (I)-shaped chromosomes (corresponding to the A- and T-type chromosomes) and V-shaped chromosomes (corresponding to the M-type chromosomes) [13]. The reported populations of L. aurea include five cytotypes: 2n = 12 = 10M + 2T, 2n = 13 = 9M + 4T, 2n = 14 = 8M + 6T, 2n = 15 = 7M + 8T, and 2n = 16 = 6M + 10T [5,6,10,11,14,15,16,17,18]. A recent comprehensive cytogeographic survey of the L. aurea complex across its entire distribution range in China identified four distinct cytotypes: 2n = 12, 2n = 14, 2n = 15, and 2n = 16; no population exhibited 2n = 13. Of these, 2n = 14 and 2n = 16 are the most prevalent cytotypes, whereas 2n = 12 is exceedingly rare [6].
Of the approximately 20 taxonomically recognized species in the genus Lycoris, more than half are polyploids or sterile hybrids; only nine have been cytologically verified as fertile diploids [1,5]. Lycoris displays extensive interspecific and intraspecific variation in both chromosome number (2n = 12–44) and karyotype structure, with documented basic chromosome numbers (x) of 6, 7, 8, and 11 [7,12,19]. Notably, the total number of long arms (i.e., major arms) per diploid chromosome complement is invariably a multiple of 11 across all currently recognized species—a cytogenetic invariant first documented by Inariyama [20] and subsequently confirmed in numerous studies [5,7,9,10,17,21,22,23,24,25,26,27]. Collectively, these findings indicate that hybridization, polyploidy, and dysploidy are the principal drivers of species diversification and chromosomal evolution in Lycoris [5,7,18,21,26,28,29]. Dysploidy refers to evolutionary changes in the basic chromosome number arising from chromosomal structural rearrangements—particularly chromosome fusions or fissions—that alter the number of chromosomal units without significantly changing the overall genomic content [30]. The evolutionary mechanism responsible for dysploidy in the genus Lycoris—whether attributable to Robertsonian translocations (centric fusions, associated with descending dysploidy) or centric fissions (associated with ascending dysploidy)—remains unresolved and is the subject of ongoing debate in the cytogenetic literature [5,10,17,20,26,31,32,33,34]. This uncertainty persists primarily due to the absence of cytogenetically conserved chromosomal markers that can unambiguously resolve structural rearrangements.
Karyotype analysis, a foundational cytogenetic method, enables genome characterization at the chromosomal level and facilitates interspecific evolutionary inference through karyotypic comparison, thereby contributing robustly to plant systematics [35,36,37,38]. Conventional karyotype analysis—relying solely on chromosome number and gross morphological features such as length, arm ratio, and satellite presence—is inherently constrained by the paucity of cytologically distinguishable landmarks, resulting in imprecise karyotype analysis and providing limited information about the organization of the genome. Since the 1960s, cytogenetic techniques such as Giemsa banding, fluorochrome banding, and fluorescence in situ hybridization (FISH) have been developed successively. These methods enable high-resolution mapping of heterochromatic regions and specific DNA sequences on chromosomes, thereby furnishing robust, chromosome-specific landmarks essential for accurate karyotyping and genome structural analysis. In plant chromosome characterization, dual-fluorochrome banding techniques, such as CMA (chromomycin A3)/DAPI (4,6-diamidino-2-phenylindole) staining and PI (propidium iodide)/ DAPI staining, have been widely adopted. The latter technique—termed CPD staining (combined PI and DAPI staining)—enables simultaneous visualization of AT-rich and GC-rich heterochromatic regions on chromosomes: AT-rich and GC-rich domains appear as blue DAPI-positive bands (hereinafter referred to as DAPI bands) and red CPD bands, respectively [36,39,40]. Critically, its sensitivity for detecting GC-rich 45S rDNA sites is comparable to that of FISH using a 45S rDNA-specific probe [39]. The most commonly used DNA probes in plant molecular cytogenetic analysis are 5S and 45S (18S-5.8S-26S) rDNA sequences. Comparative analysis of fluorochrome banding and rDNA FISH patterns—specifically, the number and chromosomal positions of fluorescent bands and rDNA signals—across taxa within a genus or species enables the detection of genomic differentiation. Such cytogenetic comparisons provide critical insights into evolutionary relationships among the studied taxa and facilitate inference of chromosomal evolutionary trends at the generic or specific level [36,37,38].
Assessment of karyotype asymmetry constitutes a fundamental and essential component of plant karyotypic analysis. Comparative evaluation of karyotype asymmetry across taxa provides valuable insights into karyological affinities and evolutionary trajectories. Over the past several decades, numerous researchers have proposed more than a dozen karyotype asymmetry indices to quantify structural heterogeneity within chromosome complements. Nevertheless, rigorous methodological evaluations—particularly those grounded in statistical robustness and biological interpretability—have identified the Mean Centromeric Asymmetry (MCA) index and the Coefficient of Variation of Chromosome Length (CVCL) as the most reliable and biologically informative metrics for assessing intrachromosomal asymmetry (i.e., variation in centromere position along individual chromosomes) and interchromosomal asymmetry (i.e., disparity in chromosome size across the complement), respectively [41,42]. The most robust approach for comparing the karyotype asymmetry across taxa involves generating a two-dimensional scatter plot of MCA versus CVCL. In contrast, principal coordinates analysis (PCoA) based on six karyotypic parameters—x, 2n, TCL (total length of haploid complement), CVCI (Coefficient of Variation of Centromeric Index), MCA, and CVCL—represents the most effective method for inferring karyological relationships among taxa [11,37,38,40,42,43].
Previous cytogenetic studies on L. aurea have predominantly relied on chromosome counting and conventional karyotype analysis, with most investigations restricted to a single or only a few geographically limited populations [7,10,15,16,17,19,44,45,46]. The recent comprehensive cytogeographic study by Wang et al. on the L. aurea complex—despite encompassing 46 natural populations across China—employed only conventional karyotype analysis [6]. Chang et al. first reported the physical mapping of 5S and 45S rDNA loci in a 2n = 14 population of L. aurea native to Taiwan Island [33]. To date, only four additional molecular cytogenetic studies have been published on this species: Quan et al. performed CPD staining and FISH mapping of 5S and 45S rDNA sites in a 2n = 14 population from Yuanling County, Hunan Province [18]; Zhang et al. established 5S/45S rDNA FISH-based karyotypes for two distinct populations, one 2n = 14 and another 2n = 16 [26,27]; and Jiang et al. conducted CPD staining and dual-color 5S/45S rDNA FISH across eight natural populations—comprising four 2n = 14, two 2n = 15, and two 2n = 16 [11]. In the third article, our group reported inter-population variation in fluorochrome banding and rDNA FISH patterns in L. aurea—providing the first cytological evidence of divergence associated with cytotype differentiation [11]. However, as the study prioritized methodological development and validation, and its sampling encompassed only a limited number of populations, it did not permit a comprehensive assessment of heterochromatin differentiation and the evolutionary dynamics of rDNA sites across distinct cytotypes as well as across populations sharing the same cytotype.
In this study, we performed cytogenetic characterization of 20 natural populations of the L. aurea complex—collected across diverse geographic regions of China—using CPD staining and FISH with 5S and 45S rDNA probes. By integrating quantitative data on chromosome morphology, fluorescent bands and rDNA FISH signals, we established standardized quantitative molecular cytogenetic karyotypes for each population. Karyotype asymmetry was assessed using the widely recognized asymmetry indices and inter-population karyological relationships were inferred using six karyotypic parameters. We also conducted a geographical differentiation analysis for the three most prevalent cytotypes identified in natural populations of the L. aurea complex by integrating collection site data from the present study with those reported in the literature. Our analyses comprehensively delineate chromosomal-level genomic differentiation and karyotypic diversity both among cytotypes and within cytotype-specific population lineages. Furthermore, we elucidate the mechanisms underlying dysploidy in the L. aurea complex through comparative karyotypic analysis across cytotypes, with particular attention to the patterns of AT-rich heterochromatic regions and rDNA sites. Integrating these cytogenetic findings with the geographically structured distribution of cytotypes, we identify potential biogeographic drivers of karyotypic differentiation in this species complex.
2. Results
2.1. General Karyotypic Characteristics
Eight karyotypic characteristics—including karyotype formula, the total diploid chromosome length (TDL), range of chromosome relative length (RRL), mean centromeric index (CI),CVCI,MCA,CVCL and Stebinns’ type—were determined for all 20 populations studied and are summarized in Table 1. Representative metaphase chromosomes for these populations are presented in Figure 1, Figure 2 and Figure 3, and corresponding standardized karyotype ideograms are provided in Figure 4.
Karyotype analysis of somatic metaphase cells across the 20 L. aurea populations revealed three distinct chromosome numbers (Table 1; Figure 1, Figure 2 and Figure 3): 2n = 14 in eight populations (SCXH, SCDJY, GDRY, HNYL, HNTD, CQFD, HBES, and ZJSZ), 2n = 15 in three populations (FJHA, GDGZ, and JXQN), and 2n = 16 in nine populations (JSJR, GXBM, GXTL, JSYX, SCEMS, AHHS, CQCK, SXMX, and HNTB). This intraspecific variation in somatic chromosome number constitutes dysploidy. No B chromosomes were observed in any of the 20 populations examined. For clarity and consistency in subsequent analyses and discussion, the L. aurea populations characterized by somatic chromosome numbers of 2n = 14, 2n = 15, and 2n = 16 are designated cytotype A, cytotype B, and cytotype C, respectively. The TDLs varied across populations of cytotypes A, B, and C, with respective ranges of 184.74–236.23 µm, 171.96–259.78 µm, and 164.64–273.09 µm. To assess whether the TDL differs significantly across the three cytotypes, we first evaluated the assumptions of normality and homogeneity of variance using the Shapiro–Wilk test and Levene’s test, respectively. Given that both assumptions were met, a one-way analysis of variance (ANOVA) was conducted to compare TDL among cytotypes. The analysis revealed no statistically significant difference in TDL across the three cytotypes (F (2, 16) = 3.76, p > 0.05), suggesting that TDL remains largely consistent across the cytotypes examined in this study. With respect to the RRL, SCXH exhibited the lowest value and GDRY the highest within cytotype A; GDGZ exhibited the lowest value and JXQN the highest within cytotype B; and JSYX exhibited the lowest value and CQCK the highest within cytotype C. These values represent the minimum and maximum intra-cytotype chromosomal length variation, respectively (Table 1).
The karyotypes of the L. aurea populations exhibit pronounced bimodality, characterized by a distinct size dichotomy between large metacentric chromosomes (m) and relatively smaller telocentric (t) and subtelocentric (st) chromosomes (Table 1 and Table S2; Figure 4). The centromere positions of t- and st-chromosomes in L. aurea are often ambiguous due to the absence of a clearly discernible primary constriction. Conventional karyotyping methods—based on staining with conventional dyes or DAPI—have been extensively employed in previous studies. However, the 45S rDNA sites located on the short arms of the t- and st-chromosomes [33] are GC-rich and consequently exhibit weak or absent staining under standard cytological protocols (Figure 1H3, H4 and 3I3, I4). This staining deficiency impedes reliable centromere identification and may result in systematic underestimation of short-arm length. In this study, the terminal regions of t- and st-chromosomes exhibiting red bands after CPD staining or 45S rDNA hybridization signals after FISH were incorporated into short-arm length measurements—these regions account for the predominant portion of the respective short arm. We therefore inferred that the centromere resides at the interface between the rDNA chromatin domain and the adjacent chromosome segment. This inference is supported by the clear visualization of a primary constriction at this interface in several metaphase chromosomes (e.g., Figure 1G1, and 3G1, H1, I1). For t- or st-chromosomes displaying DAPI bands, the centromere is positioned at the DAPI-band side of the DAPI–CPD band junction: specifically, a minor fraction of the DAPI signal overlaps the centromere, whereas the majority corresponds to the pericentromeric region of the long arm. In the rare cases where the short arm lacks detectable 45S rDNA, the centromere was operationally defined as the subtly constricted zone near the chromosome terminus (e.g., chromosome 7’ in Figure 1H1; chromosome 15 in Figure 2B1; chromosomes 14 and 15 in Figure 2C1). Following centromere localization and precise measurement of short- and long-arm lengths according to the criteria outlined above, we found that chromosomes with an arm ratio exceeding 20 are absent or rare across all examined populations (Table S2). Consequently, Kurita’s chromosomal classification scheme for the genus Lycoris is no longer applicable to L. aurea [12]. Accordingly, this study adopts the classical chromosome nomenclature system of Levan et al. [47] for karyotypic characterization of the L. aurea complex (Table 1 and Table S2). In cytotype A, four populations (SCXH, SCDJY, HNTD, and ZJSZ) exhibit a karyotype formula of 2n = 14 = 8m + 6t; the remaining four populations (GDRY, HNYL, CQFD, and HBES) display 2n = 14 = 8m + 1st + 5t. In cytotype B, FJHA and JXQN share the formula 2n = 15 = 7m + 8t, whereas GDGZ exhibits 2n = 15 = 7m + 2st + 6t. In cytotype C, JSJR is the sole exception, with a karyotype formula of 2n = 16 = 6m + 1st + 9t; all other eight populations (GXBM, GXTL, JSYX, SCEMS, AHHS, CQCK, SXMX, and HNTB) conform to 2n = 16 = 6m + 10t (Table 1 and Table S2).
In most populations of cytotypes A and C, the two members of certain chromosome pairs exhibit pronounced heteromorphism with respect to length and/or arm ratio: chromosome pairs 2–5 in SCXH (Figure 1A and 4A); chromosome pairs 1–4 and 6 in SCDJY (Figure 1B and 4B); chromosome pairs 1–7 in GDRY (Figure 1C and 4C); chromosome pairs 4 and 7 in CQFD (Figure 1F and 4F); chromosome pairs 5 and 7 in HBES (Figure 1G and 4G); chromosome pairs 1, 3, 6, and 7 in ZJSZ (Figure 1H and 4H); chromosome pairs 2, 3, and 8 in JSJR (Figure 3A and 4L); chromosome pair 5 in GXBM (Figure 3B and 4M); chromosome pairs 1–5 and 8 in GXTL (Figure 3C and 4N); chromosome pairs 3 and 5–7 in JSYX (Figure 3D and 4O); chromosome pairs 2, 3, and 7 in SCEMS (Figure 3E and 4P); chromosome pair 7 in AHHS (Figure 3F and 4Q); chromosome pairs 2, 4, 5, and 8 in CQCK (Figure 3G and 4R); chromosome pair 3 in SXMX (Figure 3H and 4S); and chromosome pairs 4, 7, and 8 in HNTB (Figure 3I and 4T). Chromosomal differentiation in cytotype B populations is pronounced (Figure 2A, 2B, 2C and 4I, 4J, 4K), precluding reliable chromosome pairing based on morphological similarity only. By integrating chromosome morphology with fluorescent bands and rDNA sites, we propose the following tentative pairings: FJHA: 1-2/3-4/5-6/7/8-10/9-13/11-12/14-15; GDGZ: 1-2/3-5/4-7/6/8-9/10-11/12-13/14-15; JXQN: 1-2/3-5/4-6/7/8-9/10-11/12-13/14-15. It is obvious that in all three populations, the majority of assigned chromosome pairs display conspicuous heteromorphism in chromosome length and/or arm ratio.
The mean centromere index (CI)—a quantitative metric that reflects interchromosomal variation in centromere position across a karyotype—shows only slight variation among populations sharing the same cytotype. In contrast, significant inter-cytotype divergence is observed: CI values decline progressively from cytotype A (30.20 ± 19.86 ~ 31.67 ± 19.65), through cytotype B (25.84 ± 20.98 ~ 26.89 ± 20.69), to cytotype C (22.26 ± 19.64 ~ 24.66 ± 18.81) (Table 1). This consistent gradient implies that centromere index variability is highest in cytotype C, intermediate in cytotype B, and lowest in cytotype A. The MCA value—which quantifies intrachromosomal asymmetry within a chromosome complement—the value CVCL—which reflects interchromosomal asymmetry—and the CVCI value—which measures centromere position heterogeneity—all vary among populations of the same cytotype and displayed a consistent stepwise increase from cytotype A (MCA: 36.67–39.60; CVCL: 31.23–35.78; CVCI: 57.88–69.25) to cytotype B (MCA: 46.21–48.33; CVCL: 35.78–38.32; CVCI: 76.95–81.21), and further to cytotype C (MCA: 50.67–55.48; CVCL: 39.81–44.84; CVCI: 76.25–94.09) (Table 1). According to Stebbins’ karyotype asymmetry category, the analyzed populations exhibited graded levels of karyotypic asymmetry: cytotype A was assigned to type 2B, while cytotypes B and C were both classified as type 3B —indicating a moderate to high degree of karyotypic asymmetry in the L. aurea complex (Table 1).
The two-dimensional scatter plot of MCA versus CVCL fully discriminates the karyotypic structures of all 20 populations, with no inter-population overlap (Figure 5). Furthermore, the plot partitions these populations into three well-defined, non-overlapping clusters that correspond precisely to cytotypes A, B, and C: (i) All cytotype-A samples cluster tightly in the lower-left quadrant, exhibiting the lowest MCA and CVCL values among the three cytotypes. This compact, cohesive grouping—characterized by minimal intra-cytotype variation in both parameters—reflects high karyotypic uniformity across the 2n=14 populations. (ii) The three cytotype-B samples occupy an intermediate position along both axes, situated between the cytotype-A and cytotype-C clusters. Their MCA and CVCL values are consistently moderate, yet they display marked vertical dispersion, indicating a continuous, gradient-like karyotypic differentiation within the 2n=15 populations. (iii) All cytotype-C samples localize to the upper-right quadrant, displaying the highest MCA and CVCL values, as well as the greatest parametric range and spatial spread. Their distribution forms a broad, contiguous gradient across this region, underscoring extensive karyotypic heterogeneity and the highest level of genetic diversity in the 2n = 16 populations.
Principal coordinate analysis (PCoA) based on six karyotypic parameters—x, 2n, TDL, CVCI, MCA, and CVCL—for 20 populations accounted for 96.76% of the total variation, with PCoA1 and PCoA2 explaining 61.37% and 35.39%, respectively. The resulting two-dimensional ordination plot reveals clear and statistically robust population differentiation (Figure 6). PCoA ordination separated the 20 populations into two well-delineated clusters along the PCoA1 axis (X-axis): the eight populations of cytotype A formed a distinct leftward cluster, whereas the three populations of cytotype B and nine of cytotype C jointly constituted a rightward cluster. All cytotype A samples were tightly aggregated along the negative PCoA1 axis, exhibiting complete spatial separation from cytotypes B and C; this pattern reflects a highly cohesive and genetically distinct lineage, as evidenced by minimal within-cytotype dispersion and pronounced inter-cytotype divergence. Furthermore, within cytotype A, samples exhibited consistent bimodal partitioning along the PCoA2 axis (Y-axis), resolving into two spatially discrete subclusters: an upper subcluster (Y > 0) comprising HNTD, CQFD, and ZJSZ, and a lower subcluster (Y < 0) consisting of SCXH, SCDJY, GDRY, HNYL, and HBES. The three cytotype B samples are positioned in the vicinity of the ordination origin, occupying an intermediate position between the two dominant clusters—cytotype A (left) and cytotype C (right). Along the PCoA2 axis (Y-axis), they exhibit scattered distribution with no evidence of intra-cytotype aggregation. Notably, JXQN is spatially proximal to the upper subcluster of cytotype C, FJHA resides closest to the origin, and GDGZ lies adjacent to the lower subcluster of cytotype C. All cytotype C samples are aligned along the positive PCoA1 axis, collectively occupying the overwhelming majority of the rightward ordination space. They display broad dispersion and a pronounced intra-cytotype differentiation gradient along the PCoA2 axis (Y-axis), resolving into two spatially distinct subclusters: (i) an upper subcluster (Y > 0) comprising SCEM, AHHS, CQCK, SXMX, and HNTB—where HNTB exhibits the highest Y-coordinate in the ordination and represents the most divergent population within cytotype C; and (ii) a lower subcluster (Y < 0) consisting of JSJR, GXBM, GXTL, and JSYX, with JSJR positioned proximal to the origin and exhibiting the shortest Euclidean distance to cytotype B.
In the UPGMA dendrogram constructed from the same six karyotypic parameters (Figure 7), all populations of cytotype A form a monophyletic main clade. In contrast, populations of cytotypes B and C jointly constitute a second major clade. The two primary clades diverge at an exceptionally high genetic distance (≈4.3), signifying deep, evolutionarily significant genetic divergence—consistent with a top-level differentiation event. Within the cytotype A clade, samples exhibit tight clustering (genetic distance <1.5), indicating low intra-cytotype genetic variation and high interpopulation genetic homogeneity. Within the second major clade, cytotypes B and C resolve as reciprocally monophyletic sister lineages, separating at a genetic distance of ≈2.7—indicative of secondary divergence. Within the cytotype C lineage, genetic distances among populations are predominantly below 2.0, reflecting pronounced intra-cytotype genetic differentiation and a well-resolved hierarchical substructure; notably, geographically proximate populations consistently coalesce into distinct subclades—providing strong evidence for isolation-by-distance and substantial within-cytotype genetic diversity. Within the cytotype B lineage, population JXQN represents an early-diverging branch (at a genetic distance of ≈2.5), whereas FJHA and GDGZ form a well-supported, terminal subclade—implying recent shared ancestry and their close phylogenetic affinity.
2.2. Fluorochrome Banding and rDNA FISH Patterns
Mitotic metaphase chromosomes of the investigated L. aurea populations—visualized by fluorochrome banding and rDNA mapping via FISH—are presented in Figure 1, Figure 2 and Figure 3. The number and position of fluorescent bands and rDNA sites are summarized in Table 2 and illustrated in Figure 4; notably, the number and position of 5S rDNA signal are omitted from Table 2 but are documented in Figure 4. Red CPD bands were showed on somatic chromosomes across 17 populations: fourteen populations (HNYL, HNTD, CQFD, HBES, ZJSZ, GDGZ, JXQN, GXTL, JSYX, SCEMS, AHHS, CQCK, SXMX, and HNTB) were analyzed after CPD staining performed prior to 45S rDNA FISH; the remaining three (SCXH, GDRY, and GXBM) were examined after CPD staining applied subsequent to dual-color FISH with 5S and 45S rDNA probes. DAPI bands were observed in all 20 populations; among these, 14 detected DAPI bands following pre-FISH CPD staining, whereas six detected them under alternative protocols—either post-dual-color FISH CPD staining (SCXH, GDRY, and GXBM) or DAPI counterstaining after dual-color FISH (SCDJY, FJHA, and JSJR). The results of 45S rDNA FISH mapping were obtained in 18 populations (in the post-CPD staining 45S rDNA FISH experiments, chromosomes of GXTL and JSYX failed to hybridize). 5S rDNA mapping was conducted in six populations:
SCXH, SCDJY, GDRY, FJHA, JSJR, and GXBM. Among the 15 populations exhibiting both CPD bands and 45S rDNA FISH signals, every CPD band colocalized completely with a 45S rDNA hybridization signal, confirming that the CPD bands represent the 45S rDNA sites. Consequently, in the GXTL and JSYX populations—where 45S rDNA signals failed to be detected—the observed CPD bands were interpreted as their 45S rDNA sites and included in subsequent 45S rDNA site-based analyses. A small subset of 45S rDNA sites—owing to their diminutive size—failed to yield discernible CPD bands after CPD staining (Figure 4; Table 2). For the three populations lacking CPD bands—SCDJY, FJHA, and JSIR—the proportion of rDNA chromatin (cytologically equivalent to CPD band) in the TDL was estimated by quantifying the size of 45S rDNA FISH signals. In the dual-color FISH analysis of GXBM, hybridization of the 5S rDNA probe was suboptimal, yielding only faint and sporadic signals—including a single pair of discernible signals in the interstitial regions of the long arms of chromosome pair 7—insufficient for unambiguous locus assignment; thus, 5S rDNA sites were omitted from the karyotype ideogram.
In the eight cytotype A populations, the diploid chromosome complements exhibited 5–9 DAPI bands, 8–10 CPD bands, and 9–10 45S rDNA sites (Figure 1 and Figure 4; Table 2). The cytotype A populations exhibit five consistent cytogenetic features in their fluorochrome banding and rDNA FISH patterns: (1) All three t(st)-chromosome pairs display (CEN + L-PCEN)-DAPI bands (located in both the centromere and the pericentromeric regions of the long arms) with the exception of HBES, which lacks a DAPI band on one member of chromosome pair 7. (2) One pair of m-chromosomes bears CEN- or S/L-PCEN-45S rDNA sites (located in centromere or pericentromeric regions of the short or long arms); this pair corresponds to chromosome 4 in all populations except GDRY, where it is chromosome 2. (3) 45S rDNA sites are present on the short arms of all three t(st)-chromosome pairs, except in ZJSZ, where the short arm of one member of pair 7 is devoid of such site. (4) One t(st)-chromosome pair carries L-PROX-45S rDNA sites (located in the proximal regions of the long arms); this locus is found on chromosome pair 7 in five populations, pair 6 in two populations, and pair 5 in one population. (5) Dual-color FISH analysis of SCXH, SCDJY, and GDRY reveals a conserved pattern of twelve 5S rDNA sites: ten of these co-localize with 45S rDNA sites (though 5S and 45S signals show partial, not complete, overlap; see Figure 1A2–A4, B1, B3–B4, and C2–C4), while the remaining two reside in the interstitial regions of the long arms (L-INT) of the t(st)-chromosome pair bearing the L-PROX-45S rDNA sites—serving as a diagnostic cytogenetic marker for this specific chromosome pair. Nonetheless, inter-population heterogeneity is also observed in fluorochrome banding and 45S rDNA FISH patterns: (i) The amounts of DAPI bands and CPD bands—expressed as percentages of TDL—exhibit significant variation across populations. Specifically, DAPI band coverage ranges from 1.53% to 4.66%, whereas CPD band coverage spans 1.49% to 3.02% (Table 2 and Table S2). (ii) Centromeric (CEN-) DAPI bands are detected on two to three m-chromosomes in SCXH, SCDJY, and GDRY, but are entirely absent in the remaining five populations (Figure 4A–H). (iii) Asymmetric signal intensities or sizes of 45S rDNA sites (manifesting as CPD bands) occur on the short arms of certain t(st)-chromosome pairs, reflecting intra-pair heteromorphism between homologues. (iv) As mentioned above, HBES exhibits complete loss of the DAPI band on one member of chromosome 7, while ZJSZ shows absence of 45S rDNA site on the short arm of one member of chromosome 7. Moreover, a clear geographic–cytogenetic correlation was observed: populations with close geographic proximity consistently displayed highly congruent fluorochrome banding and rDNA FISH patterns—exemplified by the SCXH and SCDJY populations (Figure 1A, 1B, 4A and 4B) and the HNYL and HNTD populations (Figure 1D, 1E, 4D and 4E).
The diploid complements of the three populations assigned to cytotype B exhibit 2–4 DAPI bands, 5–8 CPD bands, and 6–9 45S rDNA sites (Figure 2 and Figure 4; Table 2). FJHA and GDGZ display highly congruent DAPI band and 45S rDNA site patterns (Figure 2A, 2B, 4I, 4J): (1) both possess a single m-chromosome bearing a CEN-DAPI band, and two t-chromosomes each carrying a (CEN + L-PCEN)-DAPI band; (2) both harbor two S-PCEN-45S rDNA sites on two m-chromosomes—one colocalized with the CEN-DAPI band—and seven 45S rDNA sites on the short arms of seven t (st)-chromosomes, implying that one t-chromosome lacks a 45S rDNA site on its short arm. Notably, divergence is also evident between them: in FJHA, the m-chromosome bearing a CEN-DAPI band and S-PCEN-45S rDNA site additionally displays a second DAPI band in the pericentromeric region of the short arm, positioning the 45S rDNA site between the two DAPI bands (Figure 2A1, 2A2, and 4I); in contrast, GDGZ exhibits a greater total amount of 45S rDNA chromatin relative to FJHA (Table 2). JXQN exhibits marked cytogenetic divergence from both FJHA and GDGZ: (i) only a single m-chromosome and a single t-chromosome bear L-PROX- and (CEN + L-PCEN)-DAPI bands, respectively; (2) Only a single m-chromosome—lacking any DAPI band—harbors a L-PCEN-45S rDNA site, and five t-chromosomes bear 45S rDNA sites on their short arms. Dual-color FISH analysis of FJHA revealed a total of 11 5S rDNA sites (Figure 2A1, A3, A4, and 4I), distributed as follows: eight sites colocalize with 45S rDNA sites—specifically in the centromeric region of one m-chromosome and on the short arms of seven t-chromosomes—though 5S and 45S signals typically exhibit only partial overlap; one site resides on the short arm of a t-chromosome lacking any 45S rDNA site; and two sites are positioned in the interstitial regions of the long arms of two t-chromosomes (chromosomes 14 and 15). These two t-chromosomes bearing L-INT-5S rDNA sites constitute a homologous pair and correspond to the L-INT-5S rDNA-bearing chromosomes observed in cytotype A populations (Figure 4A–C). Notably, however, unlike in cytotype A, this t-chromosome pair in FJHA lacks the L-PROX-(45S + 5S) rDNA sites. Furthermore, when chromosomes are paired according to the previously established numerical correspondence, pronounced interhomolog heterogeneity is observed across the three populations with respect to DAPI bands and rDNA sites (Figure 4I-4K). Specifically: in the 11–12 pair of FJHA, chromosome 12 lacks a 45S rDNA site (while retaining the 5S rDNA site); in the 14–15 pair of GDGZ, chromosome 15 lacks a 45S rDNA site; in JXQN, chromosome 3 of the 3–5 pair lacks a DAPI band, chromosome 6 of the 4–6 pair lacks a 45S rDNA site, and within the 8–9 pair, chromosome 8 lacks a DAPI band whereas chromosome 9 lacks a 45S rDNA site.
The diploid chromosome complements of the nine populations of cytotype C exhibit 2–14 DAPI bands, 9–10 CPD bands, and 10–14 45S rDNA sites, showing greater variability in fluorochrome banding and rDNA FISH patterns compared to cytotype A (Figure 3, and 4; Table 2). A notable shared characteristic across these nine populations is the presence of a 45S rDNA site on the short arm of each of the ten t(st)-chromosomes. Variability among them manifests as follows: (1) The total amount of DAPI bands and 45S rDNA chromatin varies significantly across populations, ranging from 0.33% to 3.00% and 1.58% to 4.59%, respectively. (2) Seven populations (JSJR, GXBM, GXTL, JSYX, SCEMS, AHHS, and CQCK) have 1–4 m-chromosomes with CEN- or PCEN-DAPI bands, whereas the other two populations (SXMX and HNTB) show no DAPI bands on their m-chromosomes; the number of (CEN+L-PCEN)-DAPI bands on t(st)-chromosomes varies, including 10, 8, 4, 3, and 2. (3) JSJR has four CEN-45S rDNA sites on four m-chromosomes, CQCK, SXMX, and HTTB each have one S/L-PCEN-45S site on a m-chromosome; while none of the other populations possess such 45S sites. (4) Dual-color FISH analysis reveals that JSJR has 14 5S rDNA sites, ten of which partially overlap with the 45S rDNA sites on the same chromosome regions, and two are located at the interstitial regions of the long arms (L-INT) of a pair of t-chromosomes—similar to the corresponding chromosomes in cytotypes A and B. Notably, both 45S and 5S sites coexist at the centromere and the pericentromeric regions of the long arms of chromosome pair 3 in JSJR, identical to the corresponding chromosome pairs (chromosome 2 or 4) in cytotype A populations. (5) One t-chromosome in GXBM (a member of chromosome pair 7) carries an L-PROX-45S rDNA site—a feature absent in the other eight populations. Dual-color FISH shows this chromosome also possesses an L-INT-5S rDNA site, indicating homology with the chromosomes in cytotype A and B bearing the same rDNA FISH pattern. (6) All populations display varying degrees of heterozygosity regarding the presence/absence and size of DAPI bands and 45S rDNA sites.
2.3. Geographic Differentiation Patterns Among the Three Cytotypes
Geographic analyses of 52 cytotype A, 9 cytotype B, and 28 cytotype C populations revealed a clear cytogeographic partitioning pattern in the L. aurea complex: cytotype C dominates southwestern and southern China; cytotype A prevails in central China and the East Asian islands; and cytotype B is restricted to the Nanling transitional zone.
Cytotype A is a widely distributed taxon across central and southwestern China as well as the islands of East Asia. Within the Chinese mainland, its core distribution encompasses the entirety of Hubei and Hunan Provinces, and extends into portions of Guizhou, Sichuan, Chongqing, and Guangxi in southwestern China. Additionally, it exhibits a disjunct distribution on several East Asian islands including Taiwan Island, Ryukyu Islands and Kagoshima. Its distribution characteristics are summarized as follows: (1) It possesses the broadest latitudinal range, extending northward to northwestern Hubei and the southern edge of Shaanxi, southward to northern Guangdong and Guangxi, and eastward to eastern Zhejiang, Taiwan Island, the Ryukyu Archipelago, and Kagoshima; (2) Its distribution forms continuous zones with no prominent geographical barriers, with a consistent dispersal corridor connecting Sichuan-Chongqing region, western Hubei, western Hunan, eastern Guizhou and western Guangxi; (3) It predominantly occupies mid-to high- elevation inland mountain habitats within subtropical zones, and becomes the dominant cytotype at higher latitudes. Cytotype B is restricted to the coastal regions of southeastern South China and the eastern Nanling transitional zone, exhibiting an extremely narrow and highly fragmented distribution. Cytotype C is widely distributed across the mountainous regions of southwestern and southern China and predominates along the southern and western margins of the species’ overall distribution range. Its range encompasses three primary geographic sectors: (i) southern southwestern China—including parts of Guizhou, Sichuan, and Chongqing, and the whole territory of Yunnan Province; (ii) southern China—covering portions of Guangdong, Guangxi, and Hunan provinces, as well as Hainan Island; and (iii) eastern China—extending to localized areas in Anhui and Jiangsu provinces. Its key distribution features are as follows: (1) It predominates in low-latitude mountainous regions and along the northern margin of the tropical zone, with dense populations concentrated in Yunnan, Hainan, western Guangxi, and southern Guizhou Province; it exhibits a strong preference for low-elevation, humid–hot habitats. (2) Its distribution is disjunct along an east–west axis, comprising two major range segments: the mountainous areas of the Jianghuai region in eastern China and the Yunnan–Guizhou Plateau in southwestern China; the eastern Nanling Mountains—including Baise City (Guangxi) and Shaoguan City (Guangdong)—constitute a mosaic zone where cytotype C co-occurs with cytotypes A and B. (3) Its range extends westward to the eastern flank of the Hengduan Mountains (e.g., Mount Emei) and northward to the northern foothills of the Qinling Mountains (e.g., Mei County, Shaanxi Province), rendering it the cytotype with the westernmost, southernmost, and northernmost documented distribution limits within the L. aurea complex. (4) It primarily occupies low-latitude mountains at relatively high elevations and demonstrates broad ecological tolerance, thriving in heterogeneous habitats such as karst landscapes and the humid–hot montane environments of the Hengduan Mountains.
3. Discussion
3.1. Inter- and Intra-Cytotype Karyotypic Differentiation
In this study, molecular cytogenetic karyotyping was conducted on 20 natural populations of the L. aurea complex sampled across 13 provinces in China, comprising eight populations of cytotype A (2n = 14), three of cytotype B (2n = 15), and nine of cytotype C (2n = 16). No populations exhibiting 2n = 12 or 2n = 13 were identified. Consistent with Wang et al.’s research [6], our findings corroborate that these three cytotypes constitute the predominant karyotypic variants within the L. aurea complex. Centromere positions were determined using CPD staining and rDNA FISH, and chromosome morphology was classified according to the standardized nomenclature of Levan et al. [47]. A single st-chromosome was observed in four cytotype A populations and one cytotype C population; two st-chromosomes were detected in one cytotype B population. No statistically significant differences in TDL were detected among the three cytotypes—a finding consistent with Shu et al. [7], who reported minimal genome size divergence between 2n = 14 and 2n = 16 L. aurea populations.
Our results demonstrate a consistent, stepwise increase in MCA, CVCL, and CVCI values from cytotype A to cytotype B and finally to cytotype C—indicating a parallel elevation in intra-chromosomal asymmetry, inter-chromosomal asymmetry, and centromere position heterogeneity, respectively. This represents a canonical pattern in plant karyotype evolution: a progressive increase in overall karyotype asymmetry concomitant with a decreasing proportion of m chromosomes and a corresponding increase in t/st-chromosomes. Two-dimensional scatter plots of MCA vs. CVCL, alongside PCoA and UPGMA cluster dendrograms derived from six karyotypic parameters, collectively reveal pronounced karyotypic differentiation among the three cytotypes: cytotype A exhibits the deepest divergence from both cytotypes B and C, while cytotypes B and C show moderate, secondary differentiation from one another. Furthermore, the integrated analysis of the MCA-CVCL scatter plot, PCoA, and UPGMA dendrogram reveal pronounced differences in the extent of inter-population karyotypic variation among the three cytotypes. Specifically, cytotype C exhibits extensive intra-cytotypic karyotypic polymorphism and high genetic diversity; cytotype A shows low inter-population karyotypic variation and high genetic homogeneity; and cytotype B displays an intermediate karyotypic configuration—characterized by moderate structural differentiation yet substantial internal genetic divergence. Chromosomal heteromorphism—defined as consistent, heritable asymmetry in length and arm ratio between homologous chromosomes—was observed in multiple chromosome pairs across the majority of cytotype A and cytotype C populations. In contrast, the karyotype of cytotype B exhibits pronounced structural divergence, precluding unambiguous homologous chromosome identification based solely on morphological criteria.
Our fluorochrome banding and rDNA FISH analyses revealed pronounced variation in the number, position and size of both DAPI bands and 45S rDNA sites across the 20 studied populations—indicating extensive intra- and inter-cytotypic polymorphism in AT-rich heterochromatin organization and rDNA array architecture. The distinct DAPI banding and rDNA FISH patterns can serve as robust molecular cytogenetic markers for population discrimination within the L. aurea complex. The DAPI banding and rDNA FISH patterns are highly conserved across cytotype A populations, whereas substantial inter-population variation is observed in cytotype C. This contrast indicates low genetic or structural divergence among cytotype A populations but pronounced differentiation among cytotype C populations—a finding fully consistent with the results of karyotypic parameter analysis. Within cytotype B, populations FJHA and GDGZ exhibit nearly identical DAPI banding and rDNA FISH pattern—both of which are markedly distinct from those of JXQN. This cytogenetic pattern is congruent with the topology of the UPGMA dendrogram, in which FJHA and GDGZ cluster together in a subclade, whereas JXQN occupies a phylogenetically distant position.
Our findings demonstrate that intraspecific dysploidy serves as the primary mechanism driving karyotypic differentiation among cytotypes within the L. aurea complex, resulting in systematic variation in chromosome number and pronounced alterations in karyotype asymmetry [6,30,48]. While karyotypic diversification within cytotypes should be driven by multiple interrelated mechanisms: (1) chromosomal structural rearrangements—including pericentric inversions, unbalanced reciprocal translocations, deletions, and duplications—that directly modify chromosome length and arm ratio [24,34,49]; (2) quantitative variation in heterochromatin content, particularly the expansion or contraction of AT- and GC-rich heterochromatic blocks (e.g., 45S rDNA), which alters the cytologically apparent chromosome length [50]; notably, the st-chromosome observed in certain populations arises from localized amplification of 45S rDNA sequences on the short arm, resulting in its conspicuous elongation; (3) geographic isolation, which impedes gene flow and thereby promotes population-level karyotypic differentiation [8,49]; this factor is further discussed in Section 3 of the Discussion with respect to its differential effects on the genetic and karyotypic differentiation of the three cytotypes; and (4) the predominant asexual reproductive mode of L. aurea promotes the fixation of chromosomal structural variations [37,51]. Cytotype B—a sterile, obligately asexual lineage [6]—lacks any capacity for sexual recombination; consequently, chromosomal structural variants accumulate and become fixed more readily in this cytotype than in cytotypes A and C, which maintain facultative sexual–asexual reproductive strategies. This differential mode of inheritance underlies the heightened chromosomal heteromorphism observed in cytotype B.
The variation in DAPI band and rDNA site—both critical features of karyotypic differentiation in the L. aurea complex—arises from the dynamic evolutionary processes acting upon specific repetitive DNA sequences. DAPI bands almost exclusively correspond to constitutive heterochromatin, specifically AT-rich tandemly repeated satellite DNA arrays [52]. Consequently, interspecific and intraspecific variation in DAPI banding pattern serves as a cytological proxy for satellite DNA evolution, which is driven by molecular drive mechanisms such as unequal crossing over, transposition, rolling-circle replication, and replication slippage. These mechanisms collectively generate novel sequence variants, modulate copy number, and reshape nucleotide composition—thereby yielding extensive polymorphism across populations in the presence, relative abundance, and chromosomal distribution of DAPI-positive heterochromatic regions [53,54]. Similarly, the extensive interspecific and intraspecific variability observed in plant rDNA arrays stems from the inherent instability of tandemly repeated sequences, compounded by highly active recombination and transposition mechanisms operating under weak selective constraints [55]. The tandem organization of rDNA arrays predisposes homologous chromosomes to misalignment and then unequal crossing over during meiosis; moreover, the high sequence conservation among rDNA repeats promotes ectopic recombination between non-allelic loci—particularly within subtelomeric and telomeric chromosomal regions [55,56]. Such recombination events—including unequal crossing over and ectopic recombination—can result in the complete elimination of rDNA arrays, accounting for the absence of 45S rDNA signals on the short arms of one to three t chromosomes in ZJSZ, FJHA, GZGD, and JXQN populations. Copy number variation arising from unequal crossing over further underlies the size dimorphism of homologous 45S rDNA loci on short arms of t-chromosome observed in all the populations studied. In addition, ectopic recombination can shift rDNA sites to novel chromosomal positions or facilitate the emergence of entirely new sites; retrotransposition—predominantly involving 5S rDNA—and the re-integration of extrachromosomal circular rDNA (ecc rDNA) represent additional molecular pathways capable of generating de novo rDNA insertions [55].
3.2. Evolutionary Relationships Among the Three Cytotypes
As outlined above, cytotype C demonstrates significantly greater inter-population karyotypic differentiation compared with cytotype A. This finding is corroborated by chloroplast DNA sequence data: Wang et al. analyzed four cpDNA fragments across 42 populations of the L. aurea complex and found that cytotype IV (2n = 16 = 6m + 10T)—cytogenetically equivalent to cytotype C in this study—exhibits the highest nucleotide diversity among the four recognized cytotypes [6]. The most parsimonious explanation is that cytotype C represents the ancestral karyotype, having undergone a longer period of independent evolutionary divergence and consequently accumulated a greater number of lineage-specific mutations [57]. In contrast, cytotype A appears to be phylogenetically younger, showing comparatively lower levels of genetic differentiation and higher inter-population genetic uniformity. Moreover, geographical isolation is a well-established contributor to intraspecific genetic divergence [8], as detailed in subsequent sections.
The eight cytotype A populations consistently exhibit two diagnostic molecular cytogenetic features: (i) one pair of m-chromosomes bearing CEN- or S/L-PCEN-(45S+5S) rDNA sites, and (ii) one pair of t-chromosomes harboring both L-INT-5S rDNA site and L-PROX-(45S+5S) rDNA site. These same features are present in five previously reported 2n = 14 populations—HNYL (Yuanling, Hunan), HBFX (Fangxian, Hubei), HBBD (Badong, Hubei), GZDS (Dushan, Guizhou), and HNXN (Xinning, Hunan) [11,18]. The mitotic chromosome preparations for the HNYL population reported by Quan et al. were obtained from root tips of a bulb distinct from that sampled in the present study—thereby providing independent confirmation of intra-population uniformity for these cytogenetic markers [18]. These 12 cytotype A populations analyzed by our group using rDNA FISH were sampled across the vast majority of this cytotype’s documented geographical distribution on the Chinese mainland, with the exception of Guangxi Zhuang Autonomous Region. The foregoing evidence indicates that all 2n = 14 populations of the L. aurea complex on the Chinese mainland share a recent common ancestry, tracing back to a single ancestral lineage. The preceding analysis, based on comparative patterns of genetic differentiation among cytotypes, indicates that cytotype C predates cytotype A in the evolutionary history of the L. aurea complex. Indeed, comparative analysis of rDNA FISH patterns provides independent support for this conclusion. If cytotype A had preceded cytotype C in evolutionary origin and cytotype C subsequently arose from cytotype A via centric fission, then a majority—or at least a substantial proportion—of cytotype C populations would be expected to retain a pair of t-chromosomes bearing the L-PROX-(45S+5S) rDNA sites. However, none of the nine cytotype C populations newly examined in this study, nor the three previously reported populations (HBWF from Wufeng, Hubei; GXTL from Tianlin, Guangxi; HNZX from Zixing, Hunan), exhibit this pattern [11]. Critically, only GXBM carries a single t-chromosome with the L-PROX-(45S+5S) rDNA site, thereby failing to provide empirical support for the centric fission hypothesis.
The origin of cytotype B (2n = 15) is constrained to three mutually exclusive evolutionary scenarios, as proposed by Kurita [16]. Our rDNA FISH analysis revealed that none of the cytotype B populations examined possess t-chromosomes bearing the L-PROX-(45S+5S) rDNA sites. This finding conclusively rules out two plausible evolutionary origins of the 2n = 15 karyotype: (i) centric fission of an m-chromosome in cytotype A—which would necessarily produce progeny retaining two t-chromosomes each carrying the L-PROX-(45S+5S) rDNA site; and (ii) intraspecific hybridization between cytotype A and cytotype C—which would be expected to yield progeny possessing at least one t-chromosome bearing this rDNA site pattern. In contrast, the observed cytogenetic evidence is fully consistent with a single parsimonious explanation: Robertsonian translocation between two t-chromosomes in an ancestral 2n = 16 population with a (6m + 10t) karyotype—specifically, one having only one or two t-chromosome pairs bearing (CEN+L-PCEN)-DAPI bands—thereby generating the derived 2n = 15 karyotype (7m + 8t).
We further reject the hypothesis that cytotype A originated from cytotype B via Robertsonian fusion of two t-chromosomes. Cytotype B lacks both molecular-cytogenetic hallmarks consistently observed in cytotype A: (i) no t-chromosomes bear the L-PROX-(45S+5S) rDNA site; and (ii) only one or two t-chromosome pairs exhibit (CEN+L-PCEN)-DAPI bands—whereas in cytotype A, nearly all t-chromosomes display these bands (with the single exception of HBES, which lacks the DAPI signal on one t-chromosome). Together with prior evidence identifying cytotype C as the ancestral lineage, these findings support an independent origin of cytotype A from a distinct 2n = 16 progenitor population, involving simultaneous Robertsonian fusion of two t-chromosome pairs.
The progenitor 2n = 16 population that gave rise to cytotype A must have possessed three karyotypic features, inferred from the conserved molecular-cytogenetic signatures across all cytotype A populations: (i) at least six t-chromosomes bearing (CEN+L-PCEN)-DAPI bands; (ii) one pair of m-chromosomes harboring CEN- or S/L-PCEN-(45S+5S) rDNA sites; and (iii) one pair of t-chromosomes carrying the L-PROX-(45S+5S) rDNA sites. Among the nine cytotype C populations analyzed in this study, GXBM, GXTL, and SCEMS satisfy criterion (i); JSJR satisfies criterion (ii); however, no population fulfills all three criteria simultaneously. Notably, a single t-chromosome bearing the L-PROX-(45S+5S) site was detected in GXBM—providing direct evidence that this rDNA site is present, albeit rarely, within cytotype C. The failure to identify a cytotype C population that fully satisfies all three inferred ancestral karyotypic criteria is likely attributable to two non-exclusive factors: first, the limited geographic and taxonomic sampling—particularly the absence of cytotype C samples from Yunnan, Guizhou, and Guangdong provinces in our FISH analyses; and second, the possibility that the actual cytotype C progenitor of cytotype A has subsequently diverged and lost one or more of these diagnostic features. Resolving this ambiguity requires expanded sampling across the full distribution range of cytotype C, followed by integrated molecular cytogenetic analyses. Furthermore, as the 2n = 16 karyotype represents the earliest-diverging lineage in the L. aurea complex, its origin remains an open question. Specifically, what was the ancestral DAPI banding pattern, and where were the 45S and 5S rDNA sites localized in this foundational population? Comparative molecular cytogenetic studies of closely related Lycoris species may provide critical phylogenetic context to reconstruct these ancestral states.
In summary, comparative molecular cytogenetic karyotype analysis reveals that the three cytotypes of the L. aurea complex reflect a hierarchical evolutionary history: cytotype C (2n = 16) represents the ancestral and plesiomorphic karyotype; cytotype A (2n = 14) arose independently via Robertsonian fusion of two t-chromosome pairs; and cytotype B (2n = 15) originated independently through Robertsonian fusion of a single t-chromosome pair—both events occurring within distinct subpopulations derived from cytotype C. Thus, within the L. aurea complex there are two parallel, non-ancestral cytotype evolutionary lineages: C → A and C → B.
Dysploidy is a major evolutionary mechanism underlying both speciation and karyotypic diversification in angiosperms and ferns, generating intraspecific or intrageneric variation in base chromosome number [30,49]. Ascending dysploidy—characterized by an increase in chromosome number—is primarily driven by centric fission; descending dysploidy—marked by chromosome number reduction—arises predominantly through three types of centric fusion: Robertsonian translocations (ROB), end-to-end translocations (EET), and nested chromosomal insertions (NCI) [30]. Empirical evidence indicates that centric fusion occurs significantly more frequently than centric fission in plants [30,48]. This asymmetry stems from fundamental mechanistic constraints: centric fission requires several sequential, low-probability molecular and cytological events to yield stably inherited derivatives—including de novo telomere addition at broken chromosome ends, reconstruction of dual functional kinetochores, faithful trivalent segregation during meiosis I, production of balanced euploid gametes, and population-level fixation of the homozygous state. In contrast, centric fusion—particularly Robertsonian translocation—readily achieves meiotic stability without requiring de novo telomere synthesis or kinetochore reorganization, incurs minimal fertility costs, and may be favored by centromeric drive, thereby facilitating diploidization [30,58]. Notably, although Robertsonian translocations dominate karyotype evolution in mammals, they remain comparatively rare in flowering plants [48].
The dysploidy in Lycoris has been extensively documented and remains a subject of ongoing scholarly debate. Inariyama advanced a Robertsonian fusion hypothesis to account for karyotypic evolution within the genus, proposing that all fertile diploid karyotypes in Lycoris originated from the ancestral 2n = 22 karyotype of L. sanguinea—characterized exclusively by acrocentric (I-shaped) chromosomes—through successive centric fusions, resulting in progressively reduced chromosome numbers [20,31]. Under this model, the highly derived karyotype of L. aurea (2n = 12 = 10m + 2t) is interpreted as the outcome of repeated fusion of acrocentric chromosome pairs, thereby supporting x = 11—not x = 6—as the ancestral basic chromosome number for this genus. In contrast, Flory proposed an alternative centric fission hypothesis, suggesting that acrocentric I-shaped chromosomes originate from the fission through the centromeric region of metacentric (V-shaped) chromosomes [32]. Kurita proposed that the centric fission hypothesis is the most probable mechanism for the karyotype evolution of Lycoris, and that the karyotype comprising of M and T chromosomes may be ancestral [10], based on facts such as the DNA content of genomes composed of M and T being larger than that of genomes composed solely of A chromosomes [59]. Chang et al. proposed that T chromosomes arise from centromeric fission of M chromosomes, as FISH detected a large block of 45S rDNA and 5S rDNA adjacent to telomeric repeats at the physical ends, and the presence of abundant repetitive sequences suggests that these repeats are amplified to seal the broken ends [33]. Recently, Zhang et al. proposed that L. aurea (2n = 14 = 8m + 6t) represents the plesiomorphic state within the genus Lycoris, on the basis of karyotypic asymmetry indices and Stebbins’ widely accepted hypothesis that plant karyotype evolution proceeds from symmetry toward increasing asymmetry [26]. However, accumulating cytogenetic and phylogenetic evidence from multiple independent studies supports Robertsonian fusion as the primary mechanism of karyotypic evolution in Lycoris. Liu et al. employed FISH with rDNAs and centromeric histone H3 variant associated DNAs as probes to identify multiple chromosomal structural rearrangements in Lycoris, specifically centric fusion, pericentric inversion, ribosomal gene amplification, and segmental deletion [34]. In a detailed cytogeographic study of L. radiata, Liu et al. demonstrated that metacentric (m) and small metacentric (m’) chromosomes arise through Robertsonian fusion of two acrocentric progenitors in geographically localized populations [25]. The comprehensive cytogeographic analysis of the L. aurea complex conducted by Wang et al. revealed that the cytotype 2n = 12 is restricted to a narrow, localized area, whereas the cytotypes 2n = 14 and 2n = 16 exhibit broad geographic distributions [6]. Based on their extensive distribution and high frequency in surveyed populations, the latter two cytotypes are inferred to represent the ancestral karyotypic lineage within the species [6]. Furthermore, multiple independent molecular phylogenetic analyses consistently place species harboring the putatively ancestral all-acrocentric karyotype (2n = 22A)—including L. haywardii, L. sprengeri, and L. radiata var. pumila—at basal positions within the Lycoris phylogeny, supporting their early divergence in the evolutionary radiation of this genus [6,60,61,62]. Critically, our comparative molecular cytogenetic analysis of the three major cytotypes of the L. aurea complex provides direct cytogenetic evidence that intraspecific variation in chromosome number arises through descending dysploidy, mediated mechanistically by Robertsonian fusion.
3.3. Biogeographic Drivers of Intraspecific Karyotypic Differentiation
Cytogeographic analyses—grounded in comparative assessment of chromosomal variation across geographically structured populations—facilitate inference of putative centers of origin, divergence chronologies, and historical range expansion routes [6,25,63]. Such integrative studies clarify how ploidy shifts and structural chromosomal rearrangements contribute to ecological niche differentiation and biogeographic patterning in plants, thereby providing mechanistic insights into present-day distributional limits and range disjunctions [25]. When synthesized with paleogeographic reconstructions and paleoclimatic data, cytogeographic patterns enable a temporally calibrated, spatially explicit reconstruction of species evolutionary history—including its tempo, mode of range dynamics, abiotic and biotic drivers, and lineage-specific genomic responses [8].
Paleoclimatic ecological niche modeling (ENM) of the East Asian L. aurea complex, as conducted by Meng et al. yielded four key findings [8]: (1) Precipitation predominantly shapes the distribution of cytotype A (2n = 14), whereas temperature serve as the primary climatic determinant for cytotype C (2n = 16), indicating that the two cytotypes exhibit different climatic sensitivities. (2) Temporal analysis of habitat suitability indicates a pronounced contraction during the Last Interglacial (LIG), confining suitable habitats to refugia located in southwestern and southern China, Taiwan Island, and the Ryukyu Islands. A subsequent range expansion took place during the Last Glacial Maximum (LGM), characterized by westward and northward shifts of continental populations. The current distribution pattern was largely established by the Mid-Holocene. (3) Three historically significant migration corridors were identified: (i) the Central Sichuan–Chongqing–Hubei corridor, characterized by high gene flow and sympatric distribution of cytotypes A and C; (ii) the Yunnan Plateau corridor, where dispersal is restricted exclusively to cytotype C; and (iii) the Nanling Mountains corridor—situated at the tri-provincial junction of Guangdong, Guangxi, and Hunan—where cytotypes A, B and C co-occur and localized, short-distance genetic differentiation is ongoing. (4) Taiwan Island and the Ryukyu Archipelago functioned as stable, long-term insular refugia exclusively inhabited by cytotype A. During glacial periods, the exposed East China Sea continental shelf constituted a filter corridor dominated by arid, open-habitat conditions—effectively restricting the dispersal of cytotypes B and C to these offshore islands. Integrating these findings with the karyotypic evolutionary pathways—namely, C→A and C→B—and the geographically structured patterns of cytotype differentiation revealed in this study provides critical insights into the spatiotemporal dynamics underlying cytotype evolution in the L. aurea complex, as well as the multilevel drivers governing its current distribution.
Paleoclimatic ENM corroborates the long-term persistence of ancestral cytotype C (2n = 16) populations within low-latitude tropical and subtropical montane systems of Southwest and South China [8], thereby identifying the Yunnan–Guizhou Plateau and southern China as the primary evolutionary cradle of the L. aurea complex. Cytotype C experienced prolonged independent evolution, driven by extreme topographic fragmentation and persistent geographic isolation across its range—factors that severely constrained interpopulation gene flow. Consequently, disjunct populations accumulated lineage-specific microstructural chromosomal variants, including positional shifts and copy-number variations in rDNA sites, gains or losses of DAPI-stained heterochromatic blocks, and minor chromosomal rearrangements. Moreover, pronounced habitat heterogeneity across microhabitats imposes divergent selective pressures, thereby accelerating karyotypic differentiation among geographically isolated populations. During the LIG, suitable habitats for L. aurea underwent severe contraction, confining ancestral cytotype C (2n = 16) to low-latitude refugia in Southwest and South China—regions where prolonged isolation fostered the accumulation of extensive karyotypic polymorphism [8]. Subsequent cooling during the LGM expanded overall habitat suitability [64], and triggered northward range expansion of ancestral cytotype C populations along the three major corridors [8]. Within the Sichuan–Chongqing–Hubei corridor, these populations underwent double Robertsonian fusions, giving rise to cytotype A (2n = 14). This cytotype subsequently dispersed rapidly eastward and northward along the topographically continuous Wuling–Yangtze mid-mountain corridor, ultimately colonizing Taiwan Island and the Ryukyu Archipelago. In contrast to cytotype C, uninterrupted gene flow across the contiguous low-elevation hills and basins of Central China constrained the emergence of novel karyotypic variation, thereby maintaining high chromosomal homogeneity across cytotype A populations. Cytotype C populations isolated in the eastern Nanling refugia underwent a single Robertsonian fusion event, giving rise to the narrowly endemic cytotype B (2n = 15). East–west-oriented topographic barriers associated with the Nanling Mountains and fragmented coastal hills impeded large-scale range expansion of cytotype B, which remains restricted to the transitional ecotone between cytotypes A and C. The Yunnan Plateau corridor permitted only intraspecific dispersal of cytotype C; in contrast, persistent isolation—driven by the region’s highly fragmented topography—accelerated the accumulation of karyotypic microvariants and intensified interpopulation differentiation. During the LGM, the arid, exposed continental shelf of the East China Sea functioned as a dispersal filter [64], enabling colonization of Taiwan Island and the Ryukyu Archipelago exclusively by the ecologically generalist cytotype A, whereas humidity-sensitive cytotypes C were excluded. Postglacial sea-level rise submerged the East China Sea land bridge, establishing permanent oceanic vicariance. Following colonization, insular cytotype A populations experienced independent karyotypic differentiation, resulting in the rDNA FISH patterns that are distinct from those observed in their continental conspecifics [33]. Furthermore, recurrent secondary Robertsonian fusions within island lineages led to the emergence of rare karyomorphs characterized by with 2n = 13 and 2n = 12 [9,10].
Persistent climatic niche filtering drives the parapatric spatial segregation of the two dominant cytotypes, A and C [8]. The distribution of cytotype A is primarily constrained by precipitation-related climatic variables, conferring higher fitness in temperate mid-latitude inland mountain regions characterized by pronounced seasonal variability in temperature and moisture. In contrast, cytotype C is primarily governed by temperature-related climatic variables and predominates in warm, humid karst landscapes and high-elevation plateaus across southwestern and southern China. Although their fundamental climatic niches exhibit substantial overlap, divergent sensitivities to thermal and hydrological gradients drive pronounced spatial partitioning: cytotype A predominates in central and northern subtropical continental zones; cytotype C prevails in low-elevation regions of southern and southwestern China; and the Nanling Mountains constitute a broad ecotonal transition zone supporting cytotypes A, B and C.
In summary, intraspecific karyotypic differentiation in the L. aurea complex results from the synergistic interplay between intrinsic chromosomal structural variation—specifically, independent Robertsonian fusions occurring in geographically isolated subpopulations of ancestral cytotype C—and extrinsic drivers including Quaternary climatic oscillations, topographic barriers, and ecological niche divergence. Prolonged climatic niche filtering has stabilized the contemporary cytogeographic pattern: northern cytotype A, southern cytotype C, and the Nanling Mountains–restricted transitional cytotype B. This dysploid species complex constitutes an exemplary model system for investigating the combined effects of Robertsonian translocations and paleoclimatic fluctuations on cytogeographic divergence in East Asian subtropical geophytic herbs.
4. Materials and Methods
4.1. Plant Materials
Twenty natural populations of the L. aurea complex were collected from 20 counties across 13 provinces in China (Table 1) and maintained under standardized ex situ conditions in the Germplasm Resource Garden of Huaihua University. Detailed collection information—including the administrative divisions of collection location, and precise geographical coordinates—is provided in Table S1. Population identifiers were systematically assigned using a four (five)-character alphanumeric code: the first two characters represent the provincial abbreviation (e.g., “HN” for Hunan Province), and the final two (three) characters denote the county-level administrative unit (e.g., “YL” for Yuanling County).
4.2. Chromosome Preparation
Remove the bulbs of L. aurea from soil, transfer them to conical flasks for hydroponic root induction, and incubate under controlled conditions. Upon emergence of adventitious roots reaching approximately 2.0 cm in length, excise ~0.3 cm root tips. Rinse thoroughly with double-distilled water (ddH₂O), followed by treatment with a saturated aqueous solution of α-bromonaphthalene at 28°C for 3.5 h. Subsequently, fix the samples overnight at 4°C in freshly prepared fixative composed of methanol and glacial acetic acid (3:1, v/v). Chromosome slide preparation followed the enzymatic cell wall digestion and flame-drying protocol described by She et al. [36]. The slides exhibiting high mitotic index and well-spread metaphase chromosomes were selected using an Olympus BX51 phase-contrast microscope and stored at −20°C until use.
4.3. CPD Staining
Of the 20 populations used in this study, CPD staining was performed sequentially with 45S rDNA FISH on 14 populations, and CPD staining was conducted following dual-color FISH with 5S and 45S rDNA probes on three additional populations. In the former experiment, the CPD staining was carried out in accordance with the protocol described by She et al. [39]. Briefly, chromosome spreads were first incubated with RNase A (100 µg·mL⁻¹ in 2 × SSC, 37 °C, 1 h), followed by pepsin digestion (50 µg·mL⁻¹ in 0.01 mol L⁻¹HCl, 37 °C, 10 min). Subsequently, slides were stained with a fluorochrome mixture containing PI (0.6 µg·mL⁻¹) and DAPI (3 µg·mL⁻¹) dissolved in 30% (v/v) Vectashield H100 mounting medium (Vector Laboratories, Burlingame, CA, USA) for about 45 min at room temperature in the dark. The CPD staining following dual-color FISH is conducted as follows: following removal of the coverslip from the hybridized slide, the slide was washed twice with 2 × SSC buffer (10 min per wash). Subsequently, the slide was subjected to graded ethanol dehydration (70%, 90%, and 100%, each pre-chilled to −20 °C), with a 5-minute incubation at each concentration. The slide is air-dried thoroughly and then stained with the aforementioned PI and DAPI mixture under the same conditions. Fluorescence imaging was performed using an Olympus BX60 epifluorescence microscope equipped with appropriate UV (for DAPI) and green (for PI) excitation/emission filter sets. Digital images were acquired using a QImaging Retiga R6 CCD camera controlled by Ocular software (Teledyne Photometrics, Tucson, AZ, USA).
4.4. DNA Probes and FISH
The 45S rDNA probe for mono-color FISH—applied across 14 populations—was a 9.04-kb genomic fragment isolated from Solanum lycopersicum [39], labeled with biotin-16-dUTP via nick translation using a commercial nick translation kit (Roche Diagnostics, Mannheim, Germany). The dual-color FISH probes targeting both 5S and 45S rDNA repeats were the oligonucleotide probes developed by Han et al. [65], and were applied to the metaphase chromosomes from 6 populations. The 5S rDNA probes, designated as 5S-1 and 5S-2, along with the 35S rDNA probes, designated as 35S-1, 35S-2 and 35S-3, were synthesized by Sangon Biotech (Shanghai) Co., Ltd. (Shanghai, China). 5S-1 and 5S-2 were labeled at the 5’-terminus with 6-carboxyl fluorescein (6-FAM) and mixed together to make the 5S rDNA probe solution. 35S-1, 35S-2, and 35S-3 were labeled at the 5’-terminus with 6-carboxyl-tetramethyl rhodamine (TAMRA) and mixed together to make the 35S rDNA probe solution.
FISH with the 45S rDNA probe was performed on slides previously stained with CPD. The slides were washed twice with 2× SSC buffer for 15 minutes each at room temperature under lighting condition, dehydrated through a cold graded ethanol series (70%, 90%, and 100%; each pre-chilled to −20 °C), and air-dried at room temperature. In situ hybridization was carried out following the protocol described by She et al. [39]. Biotin-labeled probes were detected using fluorescein-conjugated avidin D (Vector Laboratories, Burlingame, CA, USA).
FISH using both 5S and 45S rDNA oligonucleotide probes was performed according to the protocol described by Wei et al. [37]. Briefly, chromosome slides were baked at 65 °C for 45 min, allowed to cool to room temperature, and then denatured in 70% deionized formamide at 85 °C for 2.5 min. Subsequently, slides were immediately dehydrated through a cold ethanol series (70%, 90%, and 100%, each pre-chilled to −20 °C), followed by air drying in the dark. Hybridization mixture was applied to each slide, which was then sealed and incubated overnight at 37 °C in a humidified chamber. Post-hybridization, slides were washed twice with 2× SSC buffer at room temperature (5 min per wash), and air-dried in the dark.
Following hybridization and post-hybridization washes, chromosomes were counterstained with 3 µg mL⁻¹ DAPI dissolved in Vectashield H-1000 antifade mounting medium, diluted to 30% (v/v) in double distilled water. Specimens were then coverslipped and examined under the epifluorescence microscope specified above. Digital images were acquired using a QImaging Retiga R6 CCD camera operated through Ocular imaging software. Fluorescence detection was performed using UV, blue, and green excitation/emission filters for DAPI, Fluorescein/6-FAM, and TAMRA, respectively. Raw images were processed using Adobe Photoshop CS8.0.1 (Adobe Systems Inc., San Jose, CA, USA).
4.5. Karyomorphological Analysis
Karyotype analysis was performed according to the standardized protocol outlined by She et al. [40]. For each population, a single high-quality metaphase spread exhibiting minimal chromosome overlap and optimal condensation was selected for morphometric analysis using Adobe Photoshop CS8.0.1. The following linear measurements were obtained for each chromosome: long arm length (L), short arm length (S), fluorescent band (or FISH signal) length, and the distance from the centromere to the center of FISH signal that is located in the proximal or interstitial chromosomal regions. Based on these measurements, the following karyotypic parameters were computed (calculating metrics separately for individual chromosome instead of each chromosome pair): (i) relative chromosome length (RL), expressed as a percentage of TDL; (ii) arm ratio (AR = L/S); (iii) TDL; (iv) proportional representation of each fluorescent band within the diploid complement, expressed as a percentage of the TDL; (v) mean centromeric index (CI) [41]; (vi) four quantitative indices of karyotype asymmetry—CVCI [41], CVCL [41], MCA [42], and Stebbins’ asymmetry category [66]; and (vii) the percent distance from centromere to DNA site (di = d × 100/a; d = the distance of the center of the FISH signal to the centromere, a = the length of the corresponding chromosome arm). Chromosomes were classified into four structural types—metacentric (m; AR = 1.00–1.70), submetacentric (sm; AR = 1.71–3.00), subtelocentric (st; AR = 3.01–7.00), and telocentric (t; AR > 7.00)—following the nomenclature system proposed by Levan et al. [47]. Chromosome numbering and arrangement in karyotype are standardized based on descending order of chromosome length: for populations with 2n = 14 or 2n = 16, homologous chromosome pairs are ordered and numbered from longest to shortest; in contrast, for populations with 2n = 15, individual chromosomes—rather than pairs—are arranged and numbered sequentially by decreasing length. Ideograms are drawn using quantitative morphometric data combined with position and length information of fluorescent bands and rDNA FISH signals. All 2n chromosomes are displayed in the ideograms to enable direct comparison of homologous chromosomes with respect to morphology, as well as fluorochrome banding and rDNA FISH patterns—thereby facilitating the identification of structural heterozygosity and chromosomal rearrangements.
To visualize karyotype asymmetry patterns across the analyzed populations, a bidimensional scatter plot of MCA versus CVCL was generated. To elucidate karyological relationships among the 20 populations, principal coordinate analysis (PCoA) was conducted using Gower’s similarity coefficient, computed from six quantitative karyotypic parameters—x, 2n, TDL, CVCI, MCA and CVCL —following the methodology outlined by Peruzzi and Altınordu [43]. A character matrix was constructed using the six karyotypic parameters derived from the 20 populations examined. Pairwise Euclidean distances were computed to generate a distance matrix, and hierarchical cluster analysis was conducted using the unweighted pair-group method with arithmetic mean (UPGMA) to produce a dendrogram depicting inter-population karyotypic differentiation.
4.6. Cytogeographic Analysis
We compiled all documented collection localities for populations of the L. aurea complex exhibiting chromosome numbers of 2n = 14, 2n = 15, and 2n = 16—encompassing both newly identified localities from this study and previously published records (Table S3) [6,9,10,11,16,17,18,19,33,44,45,67,68,69,70]—and performed a cytogeographic analysis using GenAI Doubao. Populations of L. traubii with 2n = 14—whose taxonomic status remains controversial—were incorporated into the analysis [6,8,9]. Populations lacking documented collection localities or verifiable provenance were excluded. Previously reported South Korean population of L. aurea with 2n = 16 [71] were subsequently reclassified as L. chinensis [72], and thus were not included in the analysis.
5. Conclusions
This study provides a systematic molecular cytogenetic characterization of the three predominant natural cytotypes—A (2n = 14 = 8m + 6t/st), B (2n = 15 = 7m + 8t/st), and C (2n = 16 = 6m + 10t/st)—within the L. aurea complex. Karyotype asymmetry increases progressively from cytotype A to B to C, and PCoA and UPGMA dendrograms based on six karyotypic parameters consistently resolve deep divergence between cytotype A and the other two cytotypes. Multivariate karyomorphometric analyses and comparative assessment of DAPI banding and rDNA FISH patterns reveal that cytotype A exhibits high interpopulational karyotypic uniformity, cytotype C displays extensive intra-cytotypic karyotypic polymorphism, and cytotype B shows intermediate differentiation with pronounced homologous heteromorphism. Integrated cytogenetic evidence supports Robertsonian translocation as the primary mechanism driving dysploidy in the L. aurea complex. Cytotype C is inferred as the ancestral karyotype. Two independent Robertsonian centric fusions—each originating from ancestral cytotype C—gave rise to derived cytotype A (via double fusion) and cytotype B (via single fusion), establishing two parallel descending dysploidy evolutionary lineages. Quaternary climatic oscillations, topographic barriers, and ecological niche divergence jointly shaped the current parapatric partitioning: cytotype C dominates low-latitude montane regions of Southwest and South China; cytotype A prevails in central subtropical inland mountains and East Asian offshore islands; and cytotype B is restricted to the Nanling transitional zone. This work provides the first molecular cytogenetic reconstruction of karyotypic diversification within the L. aurea complex, offering foundational cytogenetic knowledge essential for conservation strategies targeting genetic resources and for advancing evolutionary research in the genus Lycoris.
Supplementary Materials
The following supporting information can be downloaded at the website of this paper posted on Preprints.org, Table S1: The plant materials; Table S2: Chromosome measurements of 20 populations of the Lycoris aurea complex; Table S3: Geographical distribution of documented populations of the Lycoris aurea complex.
Author Contributions
Conceptualization, C.S. and M.Q.; methodology, C.S. and X.J.; software, X.J.; validation, W.K., Y.T., Y.Y., J.W., Z.Z. and J.Z.; formal analysis, C.S. and X.J.; investigation, W.K., Y.T., Y.Y., J.W., Z.Z. and J.Z; resources, M.Q.; data curation, C.S. and X.J.; writing—original draft preparation, C.S.; writing—review and editing, C.S., M.Q. and X.J.; visualization, X.J. and C.S.; supervision, C.S. and M.Q.; project administration, M.Q. and C.S.; funding acquisition, M.Q. All authors have read and agreed to the published version of the manuscript.
Funding
This work was supported by National Natural Science Foundation of China (32070367) and the Natural Science Foundation of Hunan Province, China (2019JJ40231).
Data Availability Statement
Data are contained within the article and Supplementary Materials. Further inquiries can be directed to the corresponding authors.
Conflicts of Interest
The authors declare no conflicts of interest.
Abbreviations
The following abbreviations are used in this manuscript:
| FISH | Fluorescence In Situ Hybridization |
| CPD | Combined PI (propidium iodide) and DAPI (4,6-diamidino-2-phenylindole) |
| TDL | the Total Diploid Chromosome Length |
| TCL | the Total Length of Haploid Complement |
| CI | Mean Centromeric Index |
| RRL | Range of Chromosome Relative Length |
| MCA | Mean Centromeric Asymmetry |
| CVCL | Coefficient of Variation of Chromosome Length |
| CVCI | Coefficient of Variation of Centromeric Index |
| LIG | Last Interglacial |
| LGM | Last Glacial Maximum |
References
- Ji, Z.H.; Meerow, A.W. Amaryllidaceae. In Flora of China; Wu, Z.Y., Raven, P.H., Hong D.Y., Eds.; Science Press: Beijing, China, 2000; Volume 24, pp. 264-273.
- Pei, S.L.; Wang, G.S.; Lei, S.H.; Liang, L.F. Lycoris aurea (L’Hér.) Herb., a new record species of Amaryllidaceae from Shanxi, China. J. Shanxi Univ. 2017, 40, 892–894. [CrossRef]
- Tian, C., Wang P.; Qin, J.; Liu, X.; Song, K.; Xiao, Z. Enzyme-assisted extraction and enrichment of galanthamine from Lycoris aurea. Chin Herb. Med. 2016, 8, 182–188.
- Cahlíková, L.; Breiterová, K.; Opletal, L. Chemistry and biological activity of alkaloids from the genus Lycoris (Amaryllidaceae). Molecules 2020, 25, 4797. [CrossRef]
- Hsu, P.S.; Kurita, S.; Yu, Z.Z.; Lin, J.Z. Synopsis of the genus Lycoris (Amaryllidaceae). Sida 1994, 16, 301–31.
- Wang, J.; Sun, L.; Zhu, H.; Lv, Y.; Meng, W.; Lv, G.; Zhang, D.; Liu, K. Aneuploidy promotes intraspecific diversification of the endemic East Asian herb Lycoris aurea complex. Front. Plant Sci. 2022, 13, 955724. [CrossRef]
- Shu, X.; Lu, R.; Heslop-Harrison, P.; Schwarzacher, T.; Wang, Z.; Qin, Y.; Wang, N.; Zhang, F. Unraveling the evolutionary complexity of Lycoris: Insights into chromosomal variation, genome size, and phylogenetic relationships. Plant Divers. 2025, 47, 931-943. [CrossRef]
- Meng, W., Zhang, X.; Zhang, H.; Hou, G.; Sun, L.; Han, X.; Liu, K. Evolutionary patterns under climatic influences on the distribution of the Lycoris aurea complex in East Asia: historical dynamics and future projections. Plants 2026, 16, 15(2): 272. [CrossRef]
- Kurita, S. Variation and evolution in the karyotype of Lycoris, Amaryllidaceae III. Intraspecific variation in the karyotype of L. traubii Hayward. Cytologia 1987, 52, 117–128.
- Kurita S. Variation and evolution in the karyotype of Lycoris, Amaryllidaceae VII. Modes of karyotype alteration within species and probable trend of karyotype evolution in the genus. Cytologia 1988, 53, 323–335.
- Jiang, X.; Quan, M.; She, C. Comparative karyotype analysis of Lycoris aurea Herb. populations using fluorochrome banding and 45S and 5S rDNA-FISH. J. Vis. Exp. 2024, (213), e67363. [CrossRef]
- Kurita, S. Variation and evolution in the karyotype of Lycoris, Amaryllidaceae I. General karyomorphological characteristics of the genus. Cytologia 1986, 51, 803–815.
- Inariyama, S. Cytological studies in the genus Lycoris. Bot. Mag. Tokyo. 1932, 46, 426–434.
- Bose, S. Cytological investigation in Lycoris 2. Cytological similarity between L. aurea and L. traubii. Plant Life 1958, 14, 33-37.
- Bose, S.; Flory, W.S. A study of phylogeny and karyotype evolution in Lycoris. Nucleus 1963, 6, 141-156.
- Kurita, S. Variation and evolution on the karyotype of Lycoris, Amaryllidaceae II. Karyotype analysis of ten taxa among which seven are native in China. Cytologia 1987, 52, 19–40.
- Liu, Y.; Hsu, P.S. A study on karyotypes of the genus Lycoris. J. Syst. Evol. 1989, 27, 257-264.
- Quan, M.; Jiang, X.; Xiao, L.; Li, J.; Liang, J.; Liu, G. Reciprocal natural hybridization between Lycoris aurea and Lycoris radiata (Amaryllidaceae) identified by morphological, karyotypic and chloroplast genomic data. BMC Plant Biol. 2024, 24, 14. [CrossRef]
- Huang, X.; Dong, M.; Wang, X.; Shang, F.D. Chromosome report of Lycoris herb. (Amaryllidaceae) J. Syst. Evol. 2011, 49, 164. [CrossRef]
- Inariyama, S. Cytological studies in the genus Lycoris (I). Sci. Rep. Tokyo Bunrika Daigaku, Sect.B 1951, 7, 75–100.
- Kurita, S. Variation and evolution in the karyotype of Lycoris, Amaryllidaceae IV Intraspecific variation in the karyotype of L. radiata Herb. and the origin of this triploid species. Cytologia 1987, 52, 137–149.
- Kurita, S. Variation and evolution in the karyotype of Lycoris, Amaryllidaceae VI. Intrapopulational and/or intraspecific variation in the karyotype of L. sanguinea Max. var. kiushiana and L. sanguinea Max. var. koreana (Nakai) Koyama. Cytologia 1988, 53, 307–321.
- Kurita, S. Variation and evolution in the karyotype of Lycoris (Amaryllidaceae) V. Chromosomal variation in L. sanguinea Maxim. Plant Species Biol. 1989, 4, 47–60. [CrossRef]
- Liu, K.; Zhou, S.B.; Huang, Y.J.; Tang, C.F.; Zhang, D.; Huang, Z.Z. Chromosomal variation and evolution in Lycoris (Amaryllidaceae) I. Intraspecific variation in the karyotype of Lycoris chinensis Traub. Plant Syst. Evol. 2012, 298, 1493–1502. [CrossRef]
- Liu, K.; Meng, W.; Zheng, L.; Wang, L.; Zhou, S. Cytogeography and chromosomal variation of the endemic East Asian herb Lycoris radiata. Ecol. Evol. 2019, 9, 6849–6859. [CrossRef]
- Zhang, Y.; Zhou, S.; Chen, Y.; Zhang, P.; Zhang, Y.; Cai, J.; Nie, Z.; Zhang, L. New insights into interspecies relationships, chromosomal evolution, and hybrid identification in the Lycoris Herb. BMC Plant Biol. 2025, 25, 78. [CrossRef]
- Zhang, Y.; Wang, X.D.; Wu, Y.Y.; Cai, J.H.; Zhang, L. Karyotype analysis of seven Lycoris species based on fluorescence in situ hybridization. Mol. Plant Breed. 2025, 23, 1586-1593. [CrossRef]
- Meng, W.; Zhang, D.; Qin, H.; Wang, L.; Zheng, L.; Xia, Q.; Liu, K. Hybrid origin of Lycoris shaanxiensis revealed by karyotype survey. Cytologia 2018, 83, 133–136. [CrossRef]
- Meng, W.Q.; Zheng, L.; Shao, J.W.; Zhou, S.B.; Liu, K. A new natural allotriploid, Lycoris × hubeiensis hybr. nov. (Amaryllidaceae), identified by morphological, karyological and molecular data. Nord. J. Bot. 2018, 36, e01780/1-e01780/6. [CrossRef]
- Mayrose, I.; Lysak, M.A. The evolution of chromosome numbers: mechanistic models and experimental approaches. Genome Biol. Evol. 2021, 13, evaa220. [CrossRef]
- Inariyama, S. Cytological studies in the genus Lycoris (II). Sci. Rep. Tokyo Bunrika Daigaku, Sect.B. 1951, 7, 103–156.
- Flory, W.S. Overview of chromosome evolution in the Amaryllidaceae. Nucleus 1977, 20, 70-88.
- Chang, Y.; Shii, C.T.; Chung, M. Variations in ribosomal RNA gene loci in spider lily (Lycoris spp.). J. Am. Soc. Hort. Sci. 2009, 134, 567–73.
- Liu, M.S.; Tseng, S.H.; Tsai, C.C.; Chen, T.C.; Chung, M.C. Chromosomal variations of Lycoris species revealed by FISH with rDNAs and centromeric histone H3 variant associated DNAs. PLoS One 2021, 16, e0258028. [CrossRef]
- Peruzzi, L.; Leitch, I.J.; Caparelli, K.F. Chromosome diversity and evolution in Liliaceae. Ann. Bot. 2009, 103, 459–475. [CrossRef]
- She, C.W.; Jiang, X.H.; Ou, L.J.; Liu, J.; Long, K.L.; Zhang, L.H.; Duan, W.T.; Zhao, W.; Hu, J.C. Molecular cytogenetic characterisation and phylogenetic analysis of the seven cultivated Vigna species (Fabaceae). Plant Biology 2015, 17, 268-280. [CrossRef]
- Wei, Y.F.; Jiang, X.H.; Song, R.; She, C.W. Molecular cytogenetic characterization of 9 populations of four species in the genus Polygonatum (Asparagaceae). Comp. Cytogenet. 2024, 18, 73–95. [CrossRef]
- Yang, Y.D.; Jiang, XH.; Zhang, B.Y.; She, C.W. Comparative karyotype analysis of eleven species of Lilium from China using FISH with rDNA oligo-probes. Sci. Rep. 2026, 16, 9446. [CrossRef]
- She, C.W.; Liu, J.Y.; Song, Y.C. CPD staining is an effective technique for detection of NORs and other GC-rich chromosomal regions in plants. Biotech. Histochem. 2006, 81, 13-21. [CrossRef]
- She, C.W.; Jiang, X.H.; He, C.P. Comparative karyotype analysis of eight Cucurbitaceae crops using fluorochrome banding and 45S rDNA-FISH. Comp. Cytogenet. 2023, 17, 31–58. [CrossRef]
- Paszko, B. A critical review and a new proposal of karyotype asymmetry indices. Plant Syst. Evol. 2006, 258, 39-48. [CrossRef]
- Peruzzi, L.; Eroglu, H. Karyotype asymmetry: again, how to measure and what to measure? Comp. Cytogenet. 2013, 7, 1-9. [CrossRef]
- Peruzzi, L.; Altınordu, F. A proposal for a multivariate quantitative approach to infer karyological relationships among taxa. Comp. Cytogenet. 2014, 8, 337-349. [CrossRef]
- Shii, C.T.; Lee, J.F.; Yuan, M.S.; Chin, S.W. Nucleotype remodeling in interspecific hybridization of Lycoris aurea Herb. and Lycoris radiata Herb. Acta Hort. 1997, 430, 521–528. [CrossRef]
- Ma, B.; Tarumoto, I. Speciation of polyploid Lycoris species estimated from cytological studies in selfed progeny. J. Japan. Soc. Hort. Sci. 2002, 71, 780-782.
- Ogawa, T.; Tarumoto, I.; Ma, B.; Ueno, M.; Kurita, S. Genome differentiation in Lycoris species (Amaryllidaceae) identified by genomic in situ hybridization. Breeding Sci. 2005, 55, 265–269.
- Levan, A.; Fredga, K.; Sandberg, A. Nomenclature for centromeric position in chromosomes. Hereditas 1964, 52, 201–220. [CrossRef]
- Jones, K. Robertsonian fusion and centric fission in karyotype evolution of higher plants. Bot. Rev. 1998, 64, 273–289. [CrossRef]
- Benítez-Benítez, C.; Mohan, A.V.; Sánchez-Villegas, R.; Gómez-Ramos, I.; Valdés-Florido, A.; Lucek, K.; Slovák, M.; Kolář, F.; Leitch, I.J.; Luceño, M.; et al. Bridging micro and macroevolution: insights from chromosomal dynamics in plants. Front. Plant Sci. 2025, 16, 1606450. [CrossRef]
- Schubert, I. Chromosome evolution. Curr. Opin. Plant Biol. 2007, 10, 109-115. [CrossRef]
- Wang, X.; Feng, Q.H.; Zeng, Z.H.; Zhang, Z.Q.; Cai, J.; Chen, G.; Li, D.Z.; Wang, H.; Zhou, W. Effects of mode of reproduction on genetic polymorphism and divergence in wild yams (Dioscoreaceae: Dioscorea). Plant Divers. 2024, 47, 136-147. [CrossRef]
- González, M. L.; Chiapella, J.O.; Urdampilleta, J.D. Chromosomal differentiation of Deschampsia (Poaceae) based on four satellite DNA families. Front. Genet. 2021, 12, 728664. [CrossRef]
- Sharma, S.; Raina, S.N. Organization and evolution of highly repeated satellite DNA sequences in plant chromosomes. Cytogenet. Genome Res. 2005, 109, 15–26. [CrossRef]
- Raskina, O.; Barber, J.C.; Nevo, E.; Belyayev, A. Repetitive DNA and chromosomal rearrangements: speciation-related events in plant genomes. Cytogenet. Genome Res. 2008, 120, 351–357. [CrossRef]
- Sims, J.; Rabanal, F.A.; Elgert, C.; von Haeseler, A.; Schlögelhofer, P. It is just a matter of time: balancing homologous recombination and non-homologous end joining at the rDNA locus during meiosis. Front. Plant Sci. 2021, 12: 773052. [CrossRef]
- Pedrosa-Harand, A.; de Almeida, C.C.S.; Mosiolek, M.; Blair, M.W.; Schweizer, D.; Guerra, M. Extensive ribosomal DNA amplification during Andean common bean (Phaseolus vulgaris L.) evolution. Theor. Appl. Genet. 2006, 112, 924-933. [CrossRef]
- Liu, Z.; Zhu, H.; Zhou, J.; Jiang, S.; Wang, Y.; Kuang, J.; Ji, Q.; Peng, J.; Wang, J.; Gao, L.; et al. Resequencing of 296 cultivated and wild lotus accessions unravels its evolution and breeding history. Plant J. 2020, 104, 1673-1684. [CrossRef]
- Lysak, M.A. Celebrating Mendel, McClintock, and Darlington: On end-to-end chromosome fusions and nested chromosome fusions. Plant Cell 2022, 34, 2475–2491. [CrossRef]
- Nishikawa, K.; Furuta, Y.; Endo, H. Consideration of the chromosome evolution on the basis of nuclear DNA content and total chromosome length in Lycoris. Genes Genet. Syst. 1979, 54, 387–396. [CrossRef]
- Hori, T.A.; Hayashi, A.; Sasanuma, T.; Kurita, S. Genetic variations in the chloroplast genome and phylogenetic clustering of Lycoris species. Genes Genet. Syst. 2006, 81, 243-53. [CrossRef]
- Zhang, F.; Wang, T.; Shu, X.; Wang, N.; Zhuang, W.; Wang, Z. Complete chloroplast genomes and comparative analyses of L. chinensis, L. anhuiensis, and L. aurea (Amaryllidaceae). Int. J. Mol. Sci. 2020, 21, 5729. [CrossRef]
- Zhang, F.; Wang, N.; Cheng, G.; Shu, X.; Wang, T.; Zhuang, W.; Lu, R.; Wang, Z. Comparative chloroplast genomes of four Lycoris species (Amaryllidaceae) provides new insight into interspecific relationship and phylogeny. Biology 2021, 10, 715. [CrossRef]
- do Pico, G.M.V.; Perez, Y.J.; Angulo, M.B.; Dematteis, M. Cytotaxonomy and geographic distribution of cytotypes of species of the South American genus Chrysolaena (Vernonieae, Asteraceae). J. Syst. Evol. 2019, 57, 451–467. [CrossRef]
- Qiu, Y.X.; Fu, C.X.; Comes, H.P. Plant molecular phylogeography in China and adjacent regions: Tracing the genetic imprints of Quaternary climate and environmental change in the world’s most diverse temperate flora. Mol. Phylogenet. Evol. 2011, 59, 225–244. [CrossRef]
- Han, Y.L.; Tian, D.K.; Fu, N.F.; Xiao, Y.; Li, Z.Y.; Han, Y.H. Comparative analysis of rDNA distribution in 29 species of Begonia sect. Coelocentrum Irmsch. Phytotaxa 2018, 381, 141–152. [CrossRef]
- Stebbins, G.L. Chromosomal evolution in higher plants; Addison-Wesley: London, UK, 1971; pp.220.
- Takemura, E. Morphological and cytological studies on artificial hybrids in the genus Lycoris III. An artificial hybrid having four V-shaped chromosomes. Bot. Mag. Tokyo 1962, 75, 324-330.
- Cheng, X.L. Fluorescence in situ hybridization in Lycoris radiata and Lycoris aurea. Master's Thesis, Nanjing Forestry University, Nanjing, China, June 2006.
- Shu, H.S. Identification of different populations of Lycoris aurea. Ph.D Thesis, Nanjing Forestry University, Nanjing, China, June 2010.
- Ren, Z.; Wang, J.; Huang, N.; Fu, H.; Liu, B.; Xia, Y. Meiosis in bulbous flower species Lycoris: dances underground. Front. Plant Sci. 2026, 16, 1691599. [CrossRef]
- Tae, K.; Ko, S.; Kim, Y. A cytotaxonomic study on genus Lycoris in Korea. Kor. J. Plant Tax. 1987, 17, 135-145. [CrossRef]
- Kim, M.Y.; Lee, S.T. A taxonomical study of the Korean Lycoris (Amaryllidaceae) Korean J. Pl. Taxon. 1991, 21, 123-139. https:// doi.org/10.11110/kjpt.1991.21.2.123.
Figure 1.
Mitotic metaphase chromosomes of 2n = 14 (cytotype A) populations within the L. aurea complex, visualized by fluorochrome banding and FISH with rDNA probes. A–H denote the SCXH, SCDJY, GDRY, HNYL, HNTD, CQFD, HBES, and ZJSZ populations, respectively. A1, C1, D1, E1, F1, G1, and H1 illustrate chromosomes subjected to CPD staining, revealing red CPD bands and blue DAPI bands. A2, B1, and C2 depict chromosomes hybridized with dual-color FISH using 5S rDNA (green) and 45S rDNA (red) oligonucleotide probes; total DNA was counterstained with DAPI. A3, B3, and C3 are grayscale micrographs displaying 5S rDNA hybridization signals; A4, B4, and C4 are grayscale micrographs displaying 45S rDNA hybridization signals; and B2 shows the DAPI-stained chromosomes as a grayscale micrograph. D2, E2, F2, G2, and H2 represent chromosomes hybridized with mono-color FISH using 45S rDNA probe (green); total DNA was counterstained with DAPI. H3 and H4 are grayscale micrographs showing DAPI- and PI-stained chromosomes, respectively, following CPD staining. Chromosome numbering follows karyotype analysis. Bar = 10 µm.
Figure 1.
Mitotic metaphase chromosomes of 2n = 14 (cytotype A) populations within the L. aurea complex, visualized by fluorochrome banding and FISH with rDNA probes. A–H denote the SCXH, SCDJY, GDRY, HNYL, HNTD, CQFD, HBES, and ZJSZ populations, respectively. A1, C1, D1, E1, F1, G1, and H1 illustrate chromosomes subjected to CPD staining, revealing red CPD bands and blue DAPI bands. A2, B1, and C2 depict chromosomes hybridized with dual-color FISH using 5S rDNA (green) and 45S rDNA (red) oligonucleotide probes; total DNA was counterstained with DAPI. A3, B3, and C3 are grayscale micrographs displaying 5S rDNA hybridization signals; A4, B4, and C4 are grayscale micrographs displaying 45S rDNA hybridization signals; and B2 shows the DAPI-stained chromosomes as a grayscale micrograph. D2, E2, F2, G2, and H2 represent chromosomes hybridized with mono-color FISH using 45S rDNA probe (green); total DNA was counterstained with DAPI. H3 and H4 are grayscale micrographs showing DAPI- and PI-stained chromosomes, respectively, following CPD staining. Chromosome numbering follows karyotype analysis. Bar = 10 µm.
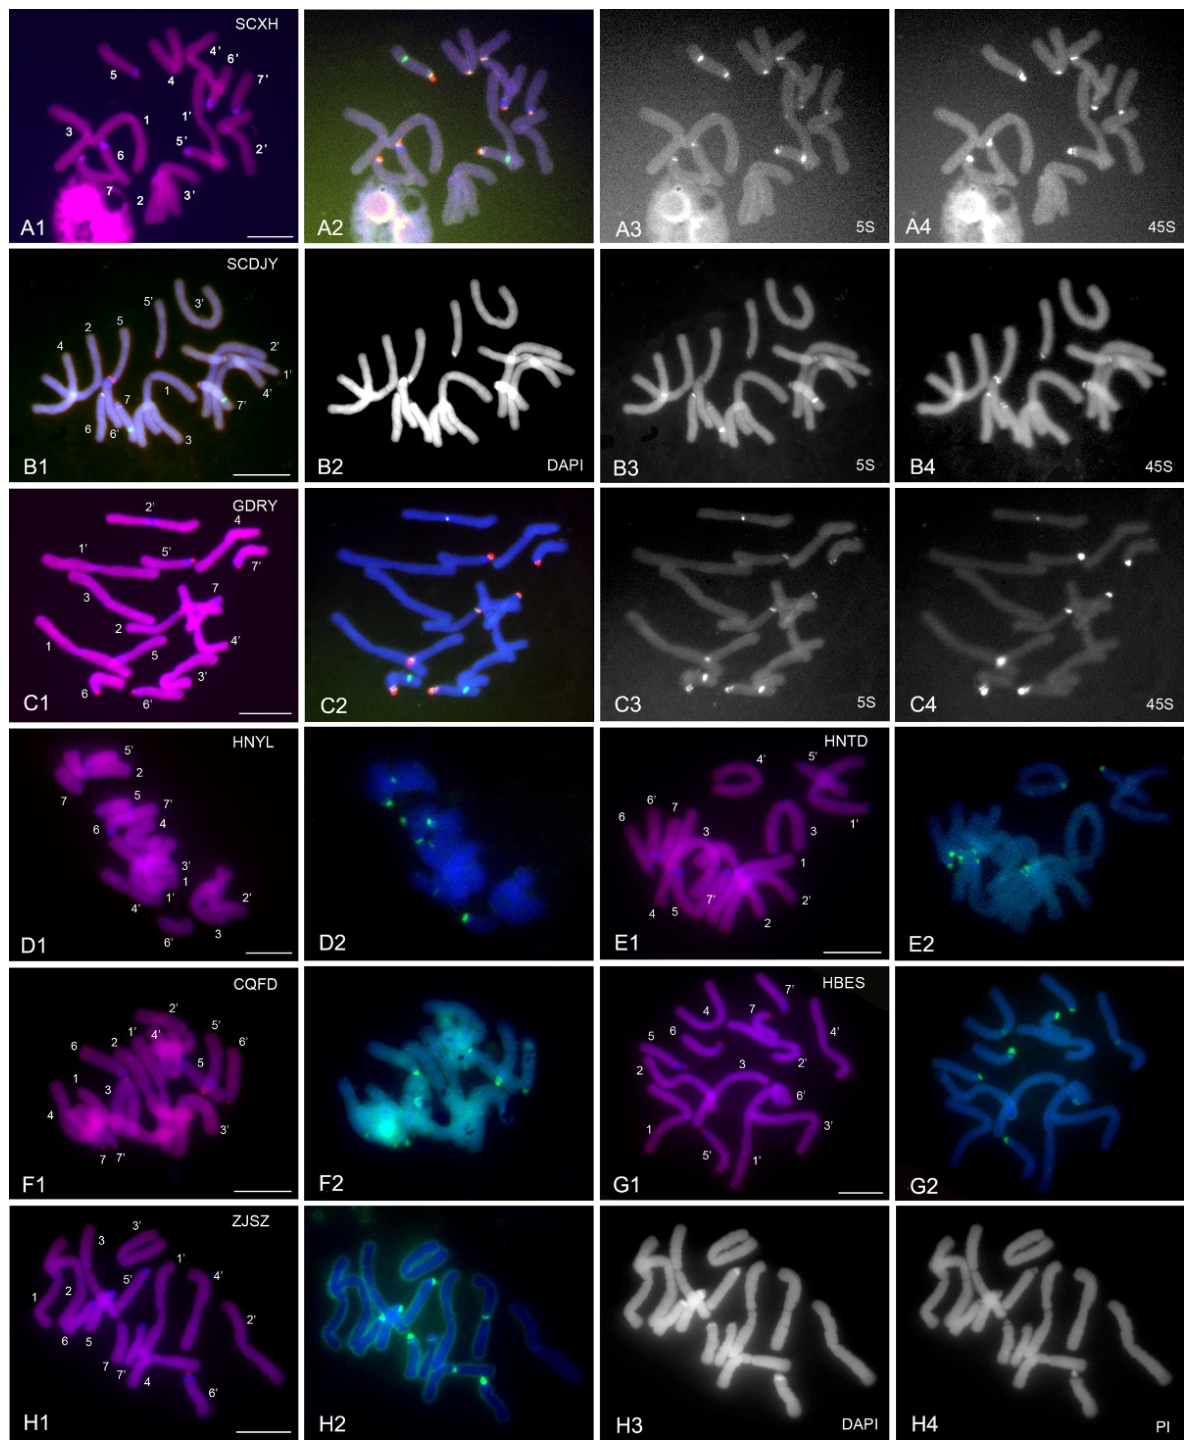
Figure 2.
Mitotic metaphase chromosomes of 2n = 15 (cytotype B) populations within the L. aurea complex, visualized by fluorochrome banding and FISH with rDNA probes. A, B, and C denote the FJHA, GDGZ, and JXQN populations, respectively. A1 shows chromosomes hybridized with dual-color FISH using 5S rDNA (green) and 45S rDNA (red) oligonucleotide probes; total DNA was counterstained with DAPI. A2, A3, and A4 are grayscale micrographs displaying DAPI-stained chromosomes, 5S rDNA hybridization signals, and 45S rDNA hybridization signals, respectively. B1 and C1 illustrate chromosomes subjected to CPD staining, revealing red CPD bands and blue DAPI bands. B2 and C2 depict chromosomes hybridized with mono-color FISH using 45S rDNA probe (green); total DNA was counterstained with DAPI. Chromosome numbering follows karyotypic analysis. Bar = 10 µm.
Figure 2.
Mitotic metaphase chromosomes of 2n = 15 (cytotype B) populations within the L. aurea complex, visualized by fluorochrome banding and FISH with rDNA probes. A, B, and C denote the FJHA, GDGZ, and JXQN populations, respectively. A1 shows chromosomes hybridized with dual-color FISH using 5S rDNA (green) and 45S rDNA (red) oligonucleotide probes; total DNA was counterstained with DAPI. A2, A3, and A4 are grayscale micrographs displaying DAPI-stained chromosomes, 5S rDNA hybridization signals, and 45S rDNA hybridization signals, respectively. B1 and C1 illustrate chromosomes subjected to CPD staining, revealing red CPD bands and blue DAPI bands. B2 and C2 depict chromosomes hybridized with mono-color FISH using 45S rDNA probe (green); total DNA was counterstained with DAPI. Chromosome numbering follows karyotypic analysis. Bar = 10 µm.
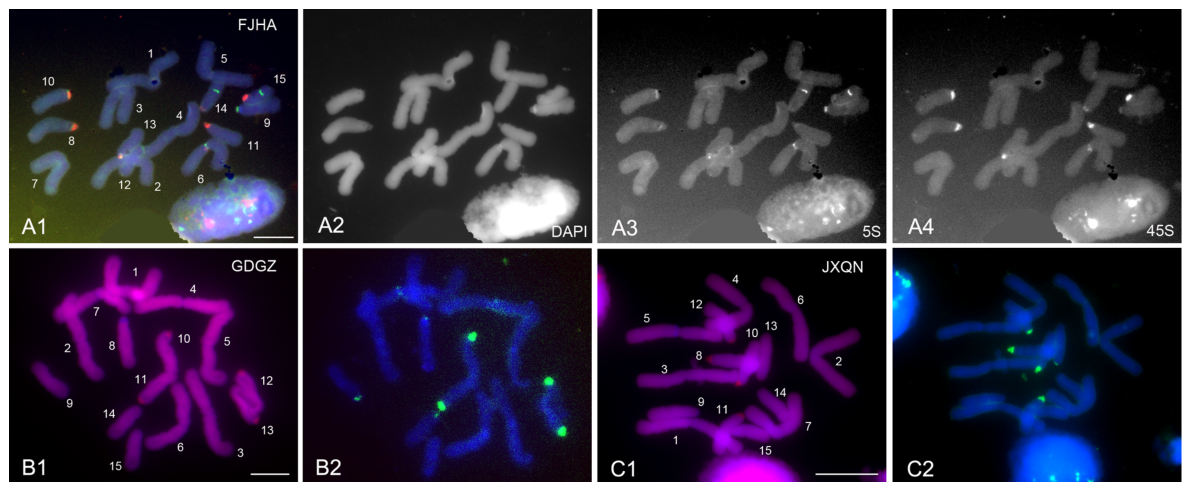
Figure 3.
Mitotic metaphase chromosomes of 2n = 16 (cytotype C) populations within the L. aurea complex, visualized by fluorochrome banding and FISH with rDNA probes. A–I denote the JSJR, GXBM, GXTL, JSYX, SCEMS, AHHS, CQCK, SXMX, and HNTB populations, respectively. B1, C, D, E1, F1, G1, H1, and I1 illustrate chromosomes subjected to CPD staining, revealing red CPD bands and blue DAPI bands. A1 and B2 depict chromosomes hybridized with dual-color FISH using 5S rDNA (green) and 45S rDNA (red) oligonucleotide probes; total DNA was counterstained with DAPI. A2, A3, and A4 are grayscale micrographs displaying DAPI-stained chromosomes, 5S rDNA hybridization signals, and 45S rDNA hybridization signals, respectively. E2, F2, G2, H2, and I2 represent chromosomes hybridized with mono-color FISH using 45S rDNA probe (green); total DNA was counterstained with DAPI. I3 and I4 are grayscale micrographs showing DAPI- and PI-stained chromosomes, respectively, following CPD staining. Chromosome numbering follows karyotype analysis. Bar = 10 µm.
Figure 3.
Mitotic metaphase chromosomes of 2n = 16 (cytotype C) populations within the L. aurea complex, visualized by fluorochrome banding and FISH with rDNA probes. A–I denote the JSJR, GXBM, GXTL, JSYX, SCEMS, AHHS, CQCK, SXMX, and HNTB populations, respectively. B1, C, D, E1, F1, G1, H1, and I1 illustrate chromosomes subjected to CPD staining, revealing red CPD bands and blue DAPI bands. A1 and B2 depict chromosomes hybridized with dual-color FISH using 5S rDNA (green) and 45S rDNA (red) oligonucleotide probes; total DNA was counterstained with DAPI. A2, A3, and A4 are grayscale micrographs displaying DAPI-stained chromosomes, 5S rDNA hybridization signals, and 45S rDNA hybridization signals, respectively. E2, F2, G2, H2, and I2 represent chromosomes hybridized with mono-color FISH using 45S rDNA probe (green); total DNA was counterstained with DAPI. I3 and I4 are grayscale micrographs showing DAPI- and PI-stained chromosomes, respectively, following CPD staining. Chromosome numbering follows karyotype analysis. Bar = 10 µm.
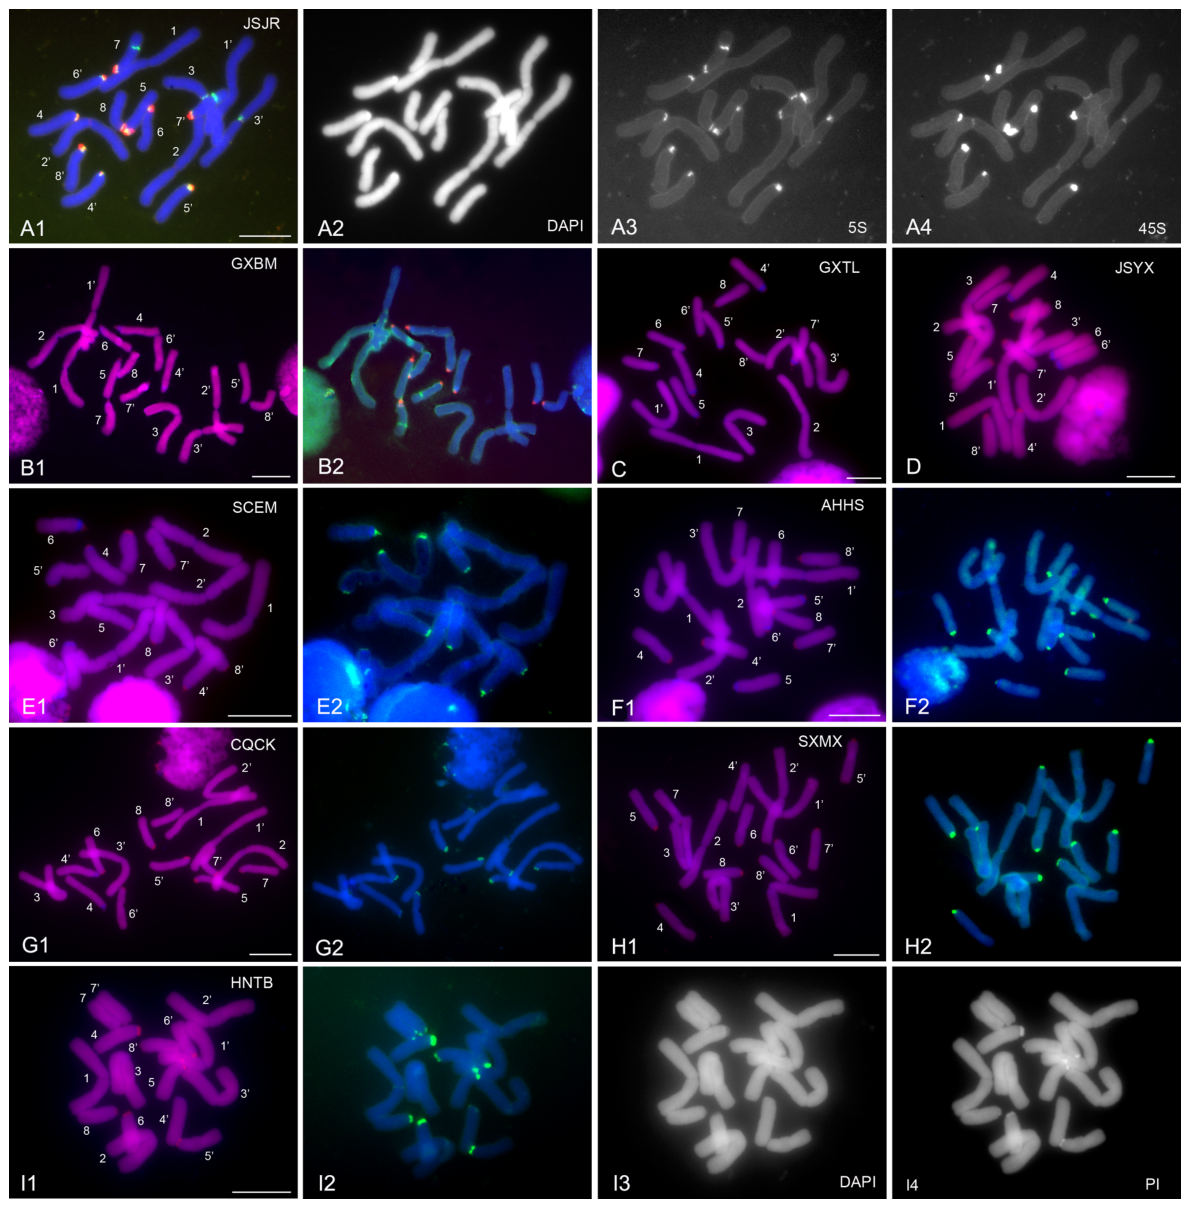
Figure 4.
Idiograms of twenty populations of the L. aurea complex, illustrating the chromosome measurements, and the position and size of fluorescent bands and rDNA FISH signals. The left ordinate indicates relative chromosome length as a percentage of the total diploid chromosome length (TDL). Chromosome serial numbers are annotated at the base of each idiogram. Chromosomes are arranged in descending order of length: for 2n = 14 and 2n = 16 populations, homologous pairs are ordered by decreasing pair length; for 2n = 15 populations, chromosomes are ordered individually by decreasing length. The name of each population is showed in the upper-left corner of its corresponding ideogram.
Figure 4.
Idiograms of twenty populations of the L. aurea complex, illustrating the chromosome measurements, and the position and size of fluorescent bands and rDNA FISH signals. The left ordinate indicates relative chromosome length as a percentage of the total diploid chromosome length (TDL). Chromosome serial numbers are annotated at the base of each idiogram. Chromosomes are arranged in descending order of length: for 2n = 14 and 2n = 16 populations, homologous pairs are ordered by decreasing pair length; for 2n = 15 populations, chromosomes are ordered individually by decreasing length. The name of each population is showed in the upper-left corner of its corresponding ideogram.
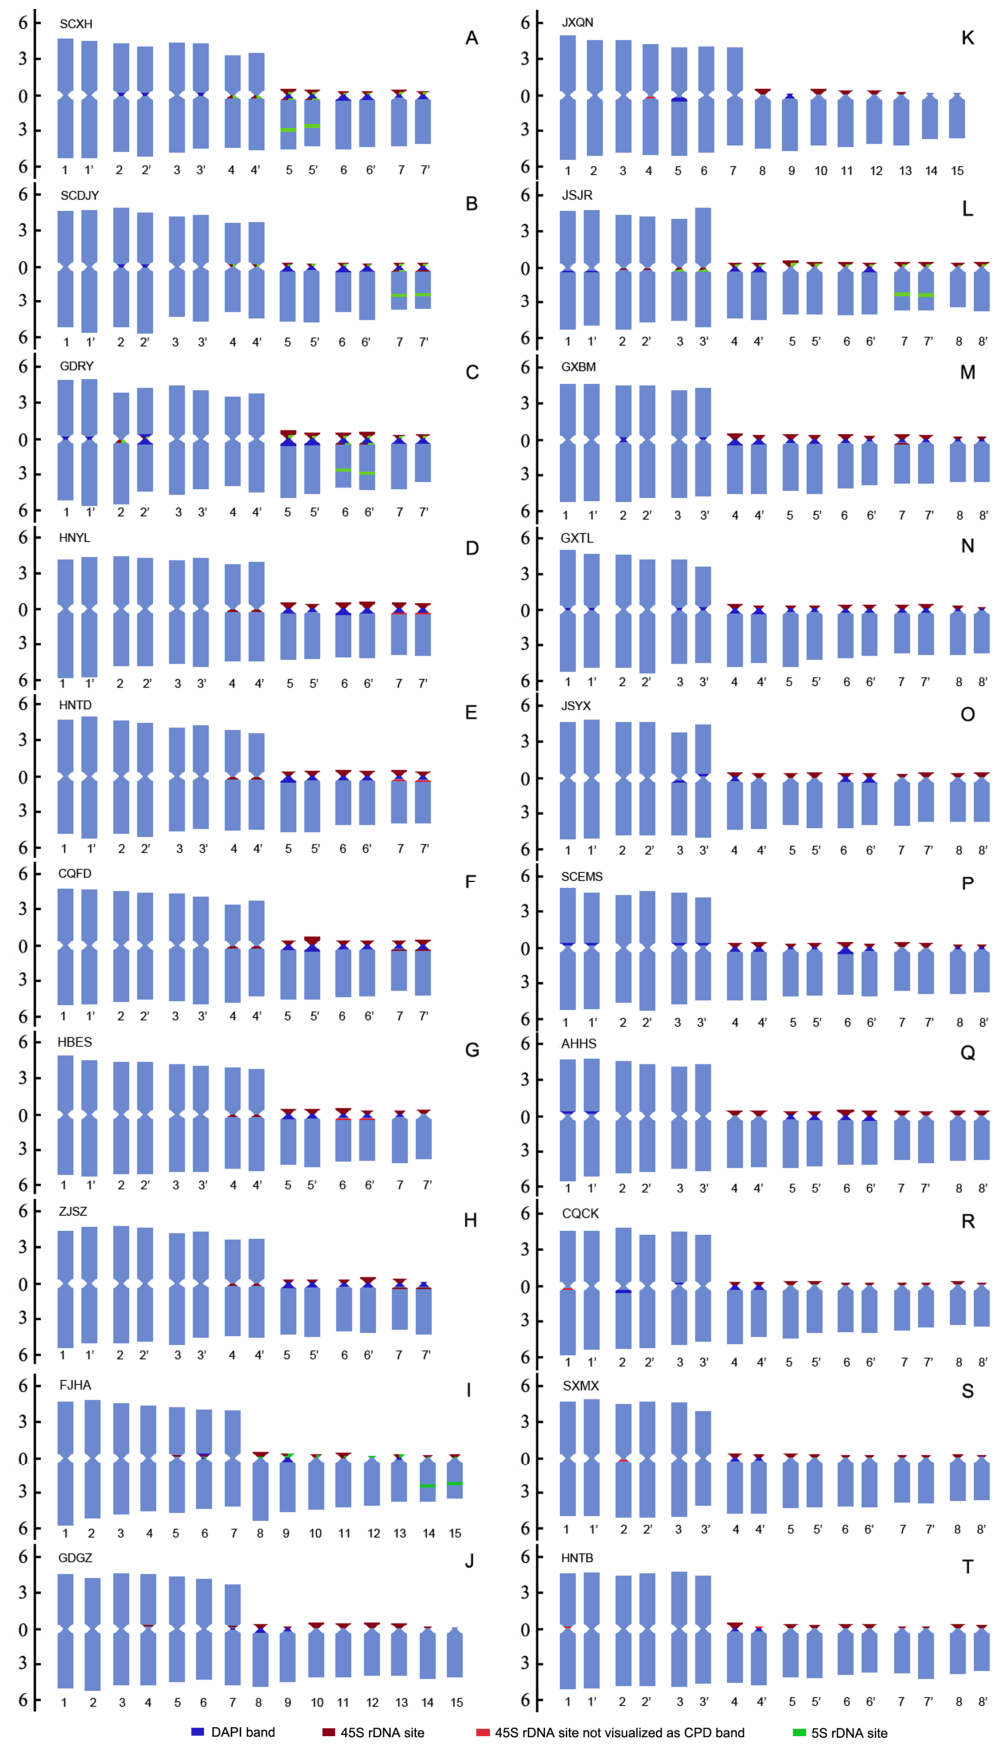
Figure 5.
Bidimensional scatter plot of MCA versus CVCL for 20 populations of the L. aurea complex. A1–A8 denote the SCXH, SCDJY, GDRY, HNYL, HNTD, CQFD, HBES, and ZJSZ populations, respectively, all belonging to cytotype A (2n = 14). B1–B3 denote the FJHA, GDGZ, and JXQN populations, respectively, all belonging to cytotype B (2n = 15). C1–C9 denote the GXBM, JSJR, GXTL, SCEM, AHHS, JSYX, CQCK, SXMX, and HNTB populations, respectively, all belonging to cytotype C (2n = 16).
Figure 5.
Bidimensional scatter plot of MCA versus CVCL for 20 populations of the L. aurea complex. A1–A8 denote the SCXH, SCDJY, GDRY, HNYL, HNTD, CQFD, HBES, and ZJSZ populations, respectively, all belonging to cytotype A (2n = 14). B1–B3 denote the FJHA, GDGZ, and JXQN populations, respectively, all belonging to cytotype B (2n = 15). C1–C9 denote the GXBM, JSJR, GXTL, SCEM, AHHS, JSYX, CQCK, SXMX, and HNTB populations, respectively, all belonging to cytotype C (2n = 16).
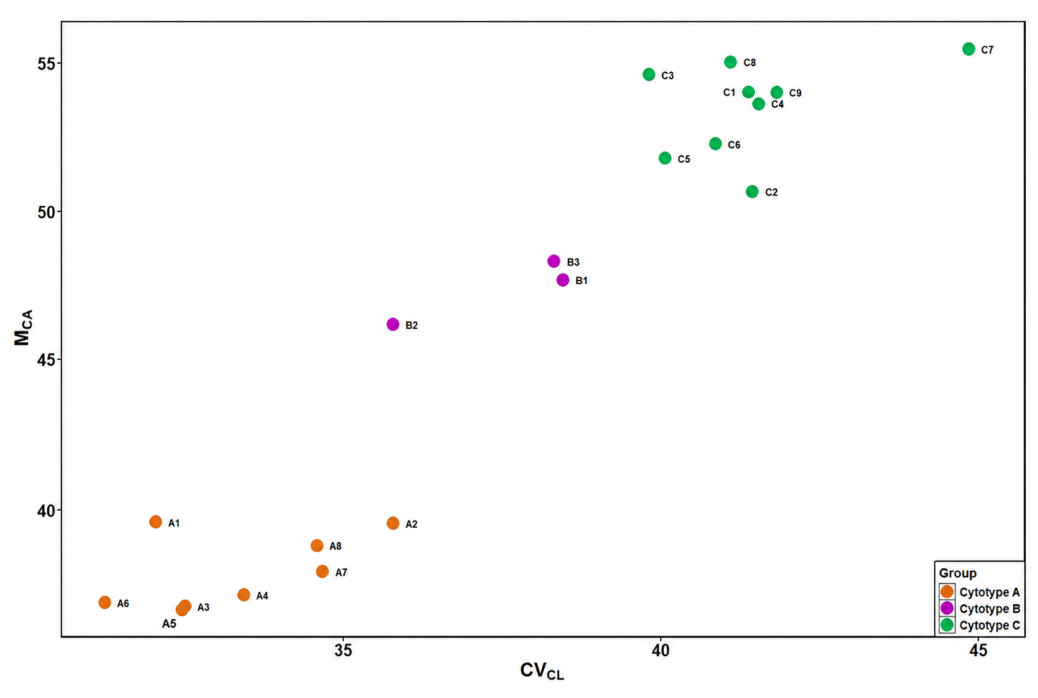
Figure 6.
Principal coordinate analysis (PCoA) of 20 populations of the L. aurea complex based on six karyotypic parameters: x, 2n, TDL, MCA, CVCL and CVCI. Population labels correspond to those in Figure 5. The first principal coordinate (PCoA1) explains 61.37% of the total variance and captures the dominant pattern of karyotypic differentiation; the second principal coordinate (PCoA2) accounts for an additional 35.39%, reflecting secondary axes of divergence. Together, PCoA1 and PCoA2 cumulatively explain 96.76% of the total variance, indicating that the two-dimensional ordination effectively retains the major structuring signals of the original multivariate karyotypic dataset.
Figure 6.
Principal coordinate analysis (PCoA) of 20 populations of the L. aurea complex based on six karyotypic parameters: x, 2n, TDL, MCA, CVCL and CVCI. Population labels correspond to those in Figure 5. The first principal coordinate (PCoA1) explains 61.37% of the total variance and captures the dominant pattern of karyotypic differentiation; the second principal coordinate (PCoA2) accounts for an additional 35.39%, reflecting secondary axes of divergence. Together, PCoA1 and PCoA2 cumulatively explain 96.76% of the total variance, indicating that the two-dimensional ordination effectively retains the major structuring signals of the original multivariate karyotypic dataset.
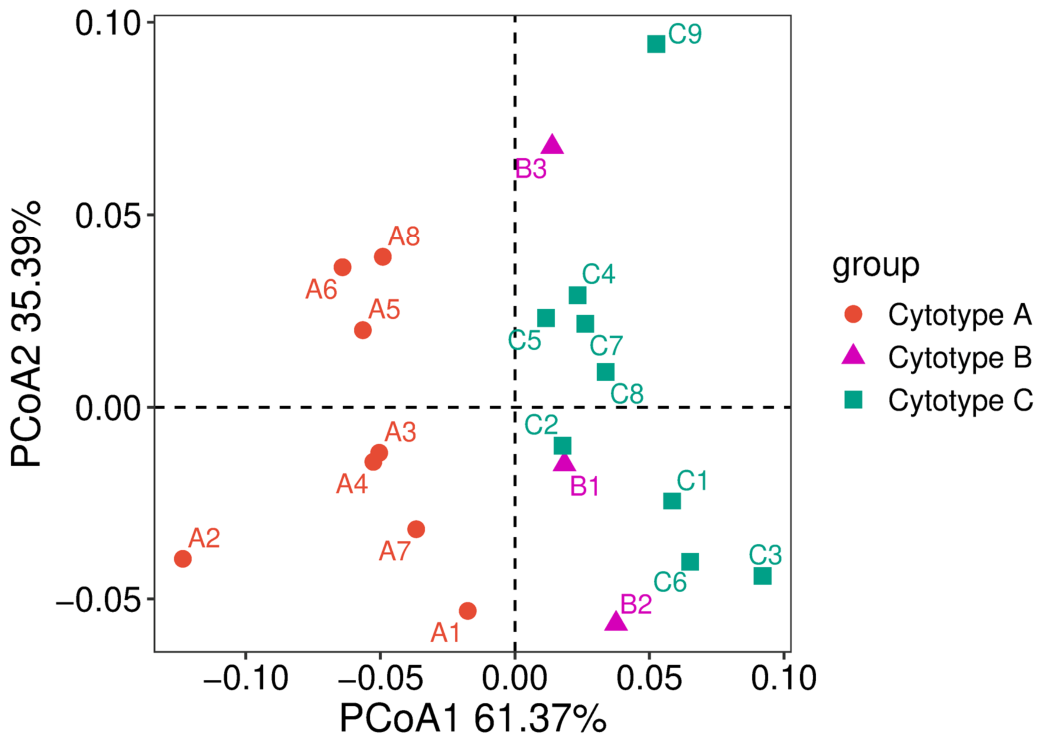
Figure 7.
UPGMA dendrogram depicting genetic relationships among 20 populations of the L. aurea complex, constructed using six karyotypic parameters: x, 2n, TDL, MCA, CVCL, and CVCI.
Figure 7.
UPGMA dendrogram depicting genetic relationships among 20 populations of the L. aurea complex, constructed using six karyotypic parameters: x, 2n, TDL, MCA, CVCL, and CVCI.
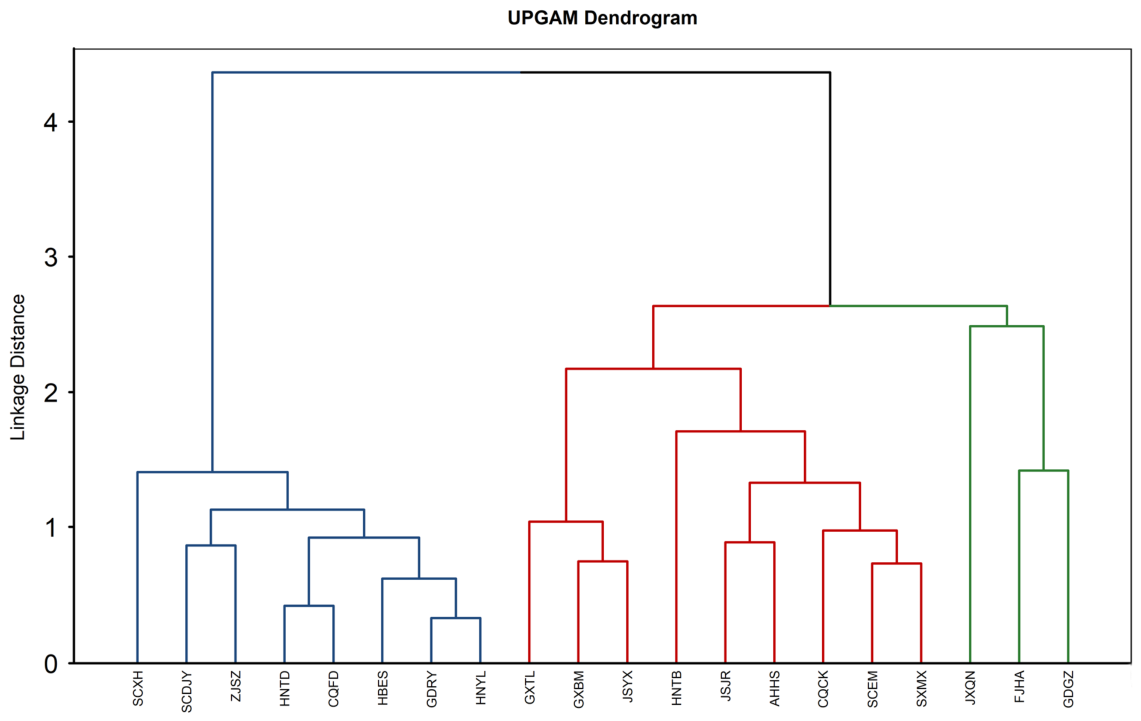

Table 1.
Karyotypic characteristics of 20 populations of the Lycoris aurea complex.
| Population | Karyotype formula | TDL ± SE (μm) | RRL | CI ± SE | CVCI | MCA | CVCL | Stebinns’ type |
|---|---|---|---|---|---|---|---|---|
| SCXH | 2n = 14 = 8m + 6t | 236.23 | 4.36-9.96 | 30.20 ± 19.86 | 65.75 | 39.60 | 32.04 | 2B |
| SCDJY | 2n = 14 = 8m + 6t | 206.54 | 3.84-10.32 | 30.23 ± 20.93 | 69.25 | 39.55 | 35.78 | 2B |
| GDRY | 2n = 14 = 8m + 1st + 5t | 209.62 | 3.99-10.66 | 31.61 ± 19.18 | 60.68 | 36.78 | 32.50 | 2B |
| HNYL | 2n = 14 = 8m + 1st + 5t | 210.09 | 4.32-10.10 | 31.42 ± 18.19 | 57.88 | 37.16 | 33.43 | 2B |
| HNTD | 2n = 14 = 8m + 6t | 194.95 | 4.23-10.17 | 31.67 ± 19.65 | 62.06 | 36.67 | 32.45 | 2B |
| CQFD | 2n = 14 = 8m + 1st + 5t | 187.26 | 4.24-9.77 | 31.55 ± 19.10 | 60.55 | 36.91 | 31.23 | 2B |
| HBES | 2n = 14 = 8m + 1st + 5t | 220.85 | 4.05-10.01 | 31.03 ± 18.98 | 61.17 | 37.94 | 34.67 | 2B |
| ZJSZ | 2n = 14 = 8m + 6t | 184.74 | 4.12-9.79 | 30.59 ± 20.16 | 65.90 | 38.81 | 34.58 | 2B |
| FJHA | 2n = 15 = 7m + 8t | 224.91 | 3.73-10.39 | 26.58 ± 21.13 | 79.48 | 46.84 | 37.71 | 3B |
| GDGZ | 2n = 15 = 7m + 2st + 6t | 259.78 | 4.12-9.58 | 26.89 ± 20.69 | 76.95 | 46.21 | 35.78 | 3B |
| JXQN | 2n = 15 = 7m + 8t | 171.96 | 3.67-10.40 | 25.84 ± 20.98 | 81.21 | 48.33 | 38.32 | 3B |
| JSJR | 2n = 16 = 6m + 1st + 9t | 220.79 | 3.66-9.92 | 24.66 ± 18.81 | 76.25 | 50.67 | 41.44 | 3B |
| GXBM | 2n = 16 = 6m + 10t | 242.62 | 3.45-9.88 | 22.98 ± 19.69 | 85.68 | 54.03 | 41.38 | 3B |
| GXTL | 2n = 16 = 6m + 10t | 273.09 | 3.79-10.22 | 22.69 ± 20.15 | 88.80 | 54.61 | 39.81 | 3B |
| JSYX | 2n = 16 = 6m + 10t | 259.03 | 3.99-9.87 | 23.86 ± 19.30 | 80.87 | 52.28 | 40.86 | 3B |
| SCEMS | 2n = 16 = 6m + 10t | 200.08 | 3.99-10.18 | 23.19 ± 20.35 | 87.78 | 53.63 | 41.54 | 3B |
| AHHS | 2n = 16 = 6m + 10t | 199.97 | 4.06-10.26 | 24.10 ± 19.41 | 80.56 | 51.80 | 40.06 | 3B |
| CQCK | 2n = 16 = 6m + 10t | 204.74 | 3.57-10.39 | 22.26 ± 19.64 | 88.21 | 55.48 | 44.84 | 3B |
| SXMX | 2n = 16 = 6m + 10t | 213.18 | 3.69-9.83 | 22.48 ± 21.15 | 94.09 | 55.04 | 41.10 | 3B |
| HNTB | 2n = 16 = 6m + 10t | 164.64 | 3.79-9.73 | 22.99 ± 20.97 | 91.21 | 54.01 | 41.82 | 3B |
Notes: TDL, the total diploid chromosome length; RRL, range of chromosome relative length; CI, mean centromeric index; CVCI, coefficient of variation of centromeric index; MCA, mean centromeric asymmetry; CVCL, coefficient of variation of chromosome lengths; Stebbins’ types, karyotype asymmetry category of Stebbins.
Table 2.
The number and position of fluorescent bands and 45S rDNA sites in 20 populations of the Lycoris aurea complex.
Table 2.
The number and position of fluorescent bands and 45S rDNA sites in 20 populations of the Lycoris aurea complex.
| Population | DAPI band | CPD band/45S rDNA site | ||||
|---|---|---|---|---|---|---|
| Number | position# | Amount (%)* |
Number† | position# | Amount (%)* |
|
| SCXH | 9 | CENs of pair 2 and one member of pair 3; (CENs + L-PCENs) of pairs 5-7 | 3.11 | 8/10 | L-PCENs of pair 4; S of pairs 5-7; L-PROXs of pair 5※ | 2.43 |
| SCDJY | 8 | CENs of pair 2; (CENs + L-PCENs) of pairs 5-7 | 2.24 | /10 | S-PCENs of pair 4; S of pairs 5-7; L-PROXs of pair 7※ | 1.78§ |
| GDRY | 9 | CENs of pair1 and one member of pair 2; (CENs + L-PCENs) of pairs 5-7 | 4.66 | 10/10 | L/S-PCENs of pair 2; S of pairs 5-7; L-PROXs of pair 6 | 3.02 |
| HNYL | 6 | (CENs + L-PCENs) of pairs 5-7 | 2.21 | 8/10 | L-PCENs of pair 4; S of pairs 5-7; L-PROXs of pair 7※ | 2.66 |
| HNTD | 6 | (CENs + L-PCENs) of pairs 5-7 | 2.07 | 8/10 | L-PCENs of pair 4; S of pairs 5-7; L-PROXs of pair 7※ | 2.21 |
| CQFD | 6 | (CENs + L-PCENs) of pairs 5-7 | 2.21 | 10/10 | L-PCENs of pair 4; S of pairs 5-7; L-PROXs of pair 7 | 2.56 |
| HBES | 5 | (CENs + L-PCENs) of pairs 5, 6 and one member of pair 7 | 1.53 | 8/10 | L-PCENs of pair 4; S of pairs 5-7; L-PROXs of pair 6※ | 2.15 |
| ZJSZ | 6 | (CENs + L-PCENs) of pair 5-7 | 2.16 | 9/9 | L-PCEN of pair 4; S of pairs 5, 6 and one member of pair 7; L-PROXs of pair 7 | 1.49 |
| FJHA | 4 | CEN and S-PCEN of chr. 6; (CENs + L-PCENs) of chr. 9, 13 | 0.82 | /9 | S-PCEN of chr. 5, 6; S of chr. 8-11, 13-15 | 2.06§ |
| GDGZ | 3 | CEN of chr. 7; (CENs + L-PCENs) of chr. 8, 9 | 0.64 | 8/9 | S-PCENs of chr. 4※, 7; S of chr. 8-14 | 2.68 |
| JXQN | 2 | L-PCEN of chr. 5; (CEN + L-PCEN) of chr. 9 | 0.56 | 5/6 | L-PCENs of chr. 4※; S of chr. 8, 10-13 | 1.78 |
| JSJR | 5 | L-PCEN of pair 1; (CENs + L-PCENs) of pair 4 and one member of pair 6 | 1.40 | /14 | CENs of pair 2, 3; S of pairs 4-8 | 4.59§ |
| GXBM | 12 | CENs of one member of pairs 2 and one member of pair 3; (CENs + L-PCENs) of pairs 4-8 | 3.18 | 10/11 | S of pairs 4-8; L-PROX of one member of pair 7※ | 3.00 |
| GXTL | 14 | CENs of pairs 1, 3; (CENs + L-PCENs) of pairs 4-8 | 2.99 | 10/ | S of pairs 4-8 | 2.10 |
| JSYX | 5 | S/L-PCEN of pair 3; (CENs + L-PCENs) of pair 6 and one member of pair 4 | 1.17 | 10/ | S of pairs 4-8 | 3.13 |
| SCEMS | 12 | S-PCENs of pairs 1, 3; (CENs + L-PCENs) of pairs 4-6, 8 | 2.20 | 10/10 | S of pairs 4-8 | 2.50 |
| AHHS | 6 | S-PCEN of pair 1; (CENs + L-PCENs) of pairs 5, 6 | 1.48 | 10/10 | S of pairs 4-8 | 3.23 |
| CQCK | 4 | L-PCEN of one member of pair 2, S-PCEN of one member of pair 3; (CENs + L-PCENs) of pair 4 | 0.84 | 10/11 | L-PCEN of one member of pair 1※; S of pairs 4-8 | 1.98 |
| SXMX | 2 | (CENs + L-PCENs) of pair 4 | 0.38 | 10/11 | L-PCEN of one member of pair 2※; S of pairs 4-8 | 2.31 |
| HNTB | 2 | (CENs + L-PCENs) of pair 4 | 0.33 | 9/11 | S-PCEN of one member of pair 1※; S of pairs 5-8 , one member of pair 4, and another member of pair 4※ | 2.36 |
#S and L represent the short and long arms, respectively; CEN, PCEN, PROX represent the centromeric, pericentromeric, and proximal positions, respectively; for populations with 2n = 14 and 2n = 16 chromosomes are arranged by homologous pairs (designated as pair); for the 2n = 15 populations, chromosomes were sorted individually (designated as chr.). *Amount of DAPI bands and CPD bands (45S rDNA) in the genome, expressed as a percentage of the total diploid chromosome length (TDL). †The numbers to the left and right of the slash represent the counts of CPD bands and 45S rDNA sites, respectively. ※45S rDNA sites that failed to resolve as distinct CPD bands following CPD staining. §The assay quantifies the 45S rDNA hybridization signal, not the CPD band.
Disclaimer/Publisher’s Note: The statements, opinions and data contained in all publications are solely those of the individual author(s) and contributor(s) and not of MDPI and/or the editor(s). MDPI and/or the editor(s) disclaim responsibility for any injury to people or property resulting from any ideas, methods, instructions or products referred to in the content. |
© 2026 by the authors. Licensee MDPI, Basel, Switzerland. This article is an open access article distributed under the terms and conditions of the Creative Commons Attribution (CC BY) license (http://creativecommons.org/licenses/by/4.0/).
Copyright: This open access article is published under a Creative Commons CC BY 4.0 license, which permit the free download, distribution, and reuse, provided that the author and preprint are cited in any reuse.