

Submitted:
26 August 2026
Posted:
26 August 2026
You are already at the latest version
Abstract
Yellow leaf disease (YLD) is a major threat to the areca palm (Areca catechu L.) industry. Accumulating evidence indicates that areca palm velarivirus 1 (APV1) is a key pathogen associated with YLD. In addition, areca palm latent totivirus 1 (APLTV1) and areca palm yellow leaf-associated ormycovirus (APYLaoMV) are two recently reported viruses that frequently co-infect areca palms. These three viruses can infect betel palms either individually or in combination, and their associated symptoms cannot be reliably distinguished by visual observation alone. In this study, LAMP primer sets were designed based on the conserved sequences of the three viruses. Through primer screening and optimization of key factors affecting amplification efficiency, including Mg²⁺ concentration, dNTP concentration, and outer-to-inner primer ratio, independent LAMP assay systems were separately established for each virus. The optimal LAMP conditions for APYLaoMV were 12 mM Mg²⁺, 1.7 mM dNTPs, an outer-to-inner primer ratio of 2:1, and a reaction temperature of 65 °C, with a detection limit of 10-3 dilution of the template cDNA. For APV1, the optimal system contained 10 mM Mg²⁺, 1.0 mM dNTPs, an outer-to-inner primer ratio of 4:1 at 65 °C, yielding a detection limit of 10-5 dilution. For APLTV1, the optimum conditions were 10 mM Mg²⁺, 0.8 mM dNTPs, an outer-to-inner primer ratio of 8:1, and a reaction temperature of 63 °C, giving a detection limit of 10-4 dilution. Together, these results demonstrate that the developed RT-LAMP assays are sensitive and practical tools for routine molecular diagnosis and epidemiological investigation of APV1, APLTV1, and APYLaoMV in areca palms.
Keywords:
YLD
; APV1
; APYLaoMV
; APLTV1
; RT-LAMP
; optimal LAMP conditions
1. Introduction
The areca palm (Areca catechu L.) is an economically important cash crop, with large-scale cultivation distributed across South and Southeast Asia, the Pacific Islands, and parts of Africa [1]. However, areca palm production is severely threatened by yellow leaf disease (YLD), a destructive disorder first documented in India in 1914 [2]. Typical symptoms of YLD include gradual leaf chlorosis, bunchy top, and declining plant vitality, which result in drastic losses in both areca nut yield and quality [1,3]. Accumulating evidence confirms that areca palm velarivirus 1 (APV1) serves as the dominant pathogenic agent responsible for YLD on Hainan island, China [4,5,6,7,8]. Subsequently, multiple viruses infecting areca palm have been successively identified, including areca palm necrotic ringspot virus (Arepavirus arecae, ANRSV) [9,10], areca palm necrotic spindle-spot virus (Arepavirus arecamaculatum, ANSSV) [11], areca palm latent totivirus 1 (APLTV1) [12], areca palm yellow leaf-associated ormycovirus (APYLaoMV) [13], and tobacco streak virus (TSV) [14].
Among a total of 544 areca palm yellowing leaf samples collected from 18 cities and counties across Hainan Province, the average detection rates of APV1, APLTV1, and APYLaoMV were 77.77%, 29.32%, and 33.98%, respectively. While the maximum detection rates of APYLaoMV and APLTV1 were 63.34% and 40.17%, respectively, the incidence rate of APV1 was consistent with previous reports [15]. These viruses may occur as single or co-infections, causing a decline in areca palm quality and commercial value, which consequently leads to substantial economic losses. Among the 544 areca palm leaf samples, the co-infection rates were 6.62% for APYLaoMV and APV1, 8.64% for APV1 and APLTV1, and 9.19% for APLaoMV and APLTV1, with 4.41% of the samples co-infected by all three viruses [13]. It is worth nothing that no distinct symptomatic differences were observed among areca palms infected with these three viruses. In particular, infection with APLTV1 does not lead to apparent phenotypic changes in areca palms, and these viruses can also be occasionally detected in asymptomatic leaves, which is consistent with the latent infection characteristic typical of plant viruses. The interaction mechanisms among the three viruses remain uncharacterized to date. These viruses may occur either as single or mixed infections, leading to a decline in areca palm quality and commercial value, and consequently causing substantial economic losses. As the disease progresses, plant growth is markedly inhibited, newly emerging leaves remain underdeveloped, and individual leaves become shorter.
Currently, the detection of these viruses in areca palm mainly relies on enzyme-linked immunosorbent assay (ELISA) and reverse transcription polymerase chain reaction (RT-PCR) techniques [16,17]. While these conventional approaches offer reliable diagnostic performance, they generally require specialized laboratory equipment (e.g., thermal cyclers, real-time PCR instruments), sophisticated cold-chain logistics for sample transport, and trained technical personnel. These requirements restrict the capacity for timely, effective on-site detection of plant viruses, particularly in resource-limited agricultural settings.
Benefiting from the rapid advances in molecular diagnostic technology, various isothermal amplification strategies have been established for field testing. Among them, loop-mediated isothermal amplification (LAMP) has emerged as a well-established detection system [19]. This method employs four to six specifically designed primers to ensure outstanding detection specificity. Incubation in a simple water bath or heat block enables LAMP to generate approximately 10³-fold more amplicons within a short reaction period compared with conventional PCR, conferring remarkable advantages in time efficiency and cost control. Owing to such favorable properties, LAMP has been validated as a reliable and robust tool for the detection and identification of viral and microbial pathogens [19,21,22,23]. This technique offers high efficiency, straightforward operation, no requirement for complex instruments, rapid detection, and easily visualized results, making it particularly suitable for basic-level research and field disease diagnosis. RT-LAMP has been successfully applied to detect ANSSV and ANRSV [19], two areca palm viruses with readily distinguishable symptomatic manifestations. Therefore, it is critical to develop rapid, sensitive, and user-friendly viral detection methods to facilitate virological research, disease surveillance, seedling quarantine, and integrated disease management.
However, given that APV1, APYLaoMV, and APLTV1 frequently co-infect areca palms and induce indistinguishable symptoms, rapid and field-deployable detection approaches are urgently required. LAMP represents a promising candidate method to bridge this diagnostic gap. In this study, independent RT-LAMP assay systems were successfully established and validated for the rapid and sensitive detection of APV1, APLTV1, and APYLaoMV. Specifically, conserved target regions were identified by aligning the spliced whole-genome sequence of APYLaoMV, and the capsid protein (CP) gene sequences of APLTV1 and APV1 using DNAMAN 8. Following the systematic optimization of key reaction parameters, these assays provide robust molecular tools for the detection of APV1, APYLaoMV, and APLTV1 infecting areca palms.
2. Results
2.1. Screening of LAMP Primers for the Three Viruses
According to the amplification curves and visual detection results shown in Figure 1, Figure 2 and Figure 3, the optimal primer set for each virus was determined as follows. For APYLaoMV, Primer set 1 (APYLaoMV-P1) exhibited the earliest peak appearance, high amplification efficiency, and a positive color reaction; therefore, it was selected as the optimal primer set for subsequent experiments. For APV1, Primer set 2 (APV1-P2) produced peaks at the earliest time with high amplification efficiency and a positive color reaction; thus, APV1-P2 was chosen as the optimal primer set. For APLTV1, Primer set 1 (APLTV1-P1) showed the earliest peak, Primer set 2 had a delayed peak appearance, and no peak was observed for Primer set 3. Accordingly, APLTV1-P1 was determined as the optimal primer set.
2.2. Optimization of LAMP Amplification Temperature for the Three Viruses
As shown in the amplification curves and color development results in Figure 4, Figure 5 and Figure 6, the optimal reaction temperatures varied among the three viruses under different temperature gradients. For LAMP amplification of APYLaoMV and APV1, the earliest peak emergence and highest amplification efficiency were observed at 65 °C. By contrast, the optimal reaction temperature for APLTV1 was 63 °C, at which it achieved the earliest peak and optimal amplification efficiency.
2.3. Optimization of Mg²⁺ Concentration for LAMP Assay of the Three Viruses
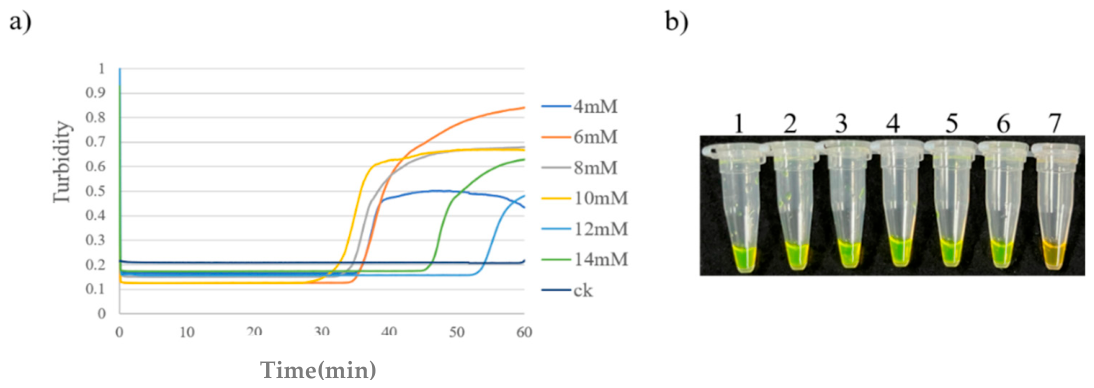
The Mg²⁺ concentrations in the reaction system were set at 4, 6, 8, 10, 12, and 14 mM for LAMP amplification of the three viruses. According to the experimental results, no amplification curve was observed for APYLaoMV at 4 mM Mg²⁺. At 12 and 14 mM Mg²⁺, this virus showed early peak emergence and high amplification efficiency. To reduce reagent costs without compromising assay performance, 12 mM was selected as the optimal Mg²⁺ concentration. For APV1 and APLTV1, the earliest peak appearance and the highest amplification efficiency were achieved at 10 mM Mg²⁺. Therefore, 10 mM was determined as the optimal Mg²⁺ concentration for both viruses.
Figure 7.
Mg2+ concentration optimization of RT-LAMP assay for APYLaoMV. (a) Amplification curve. (b) Visual detection. 1: 4 mM; 2: 6 mM; 3: 8 mM; 4: 10 mM; 5: 12 mM; 6: 14 mM; 7: blank control.
Figure 7.
Mg2+ concentration optimization of RT-LAMP assay for APYLaoMV. (a) Amplification curve. (b) Visual detection. 1: 4 mM; 2: 6 mM; 3: 8 mM; 4: 10 mM; 5: 12 mM; 6: 14 mM; 7: blank control.
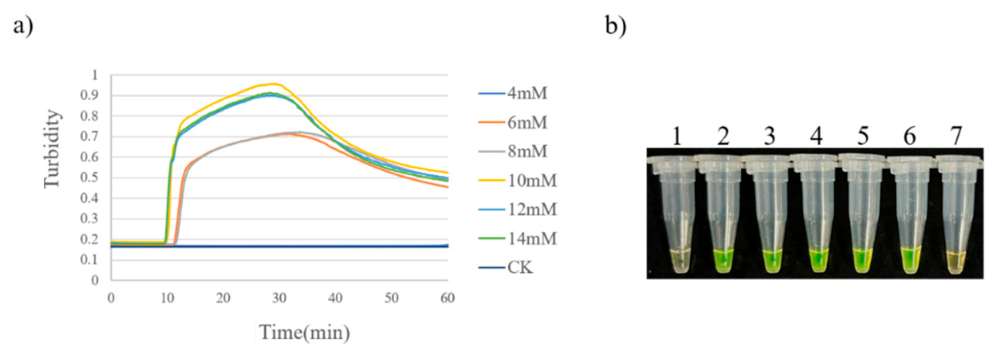
Figure 8.
Mg²⁺ concentration optimization of LAMP assay for APV1. (a) Amplification curve. (b) Visual detection. 1: 4 mM; 2: 6 mM; 3: 8 mM; 4: 10 mM; 5: 12 mM; 6: 14 mM; 7: blank control.
Figure 8.
Mg²⁺ concentration optimization of LAMP assay for APV1. (a) Amplification curve. (b) Visual detection. 1: 4 mM; 2: 6 mM; 3: 8 mM; 4: 10 mM; 5: 12 mM; 6: 14 mM; 7: blank control.
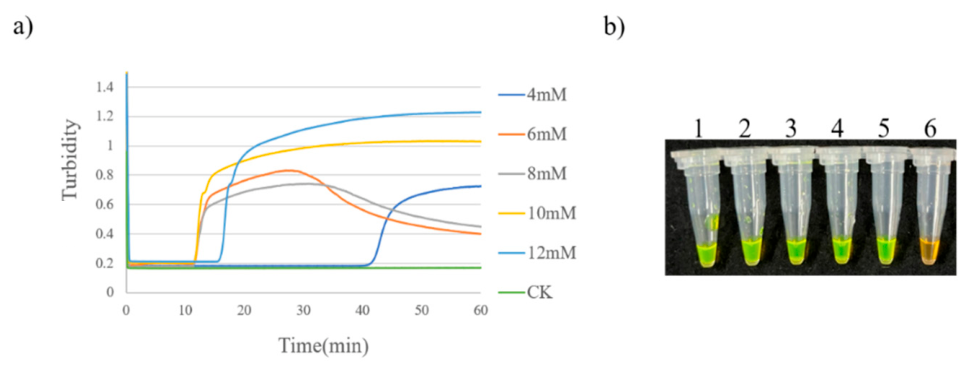
Figure 9.
Mg2+ concentration optimization of LAMP assay for APLTV1. (a) Amplification curve. (b) Visual detection.1: 4 mM; 2: 6 mM; 3: 8 mM; 4: 10 mM; 5: 12 mM; 6: 14 mM; 7: blank control.
Figure 9.
Mg2+ concentration optimization of LAMP assay for APLTV1. (a) Amplification curve. (b) Visual detection.1: 4 mM; 2: 6 mM; 3: 8 mM; 4: 10 mM; 5: 12 mM; 6: 14 mM; 7: blank control.
2.4. Optimization of dNTPs Concentration for LAMP Assay of the Three Viruses
As shown in the amplification curves and color development results in Figure 10, Figure 11 and Figure 12, after adjusting the dNTPs concentration in the reaction system in a gradient manner, the optimal concentrations were determined for each virus. For APYLaoMV, the peak appeared earlier and the amplification efficiency was higher at a dNTPs concentration of 1.7 mM; thus, 1.7 mM was selected as the optimal dNTPs concentration. For APV1 and APLTV1, the concentrations yielding the earliest peak appearance and the highest amplification efficiency were 1.0 mM and 0.8 mM, respectively.
2.5. Optimization of LAMP Primer Concentration Ratios for the Three Viruses
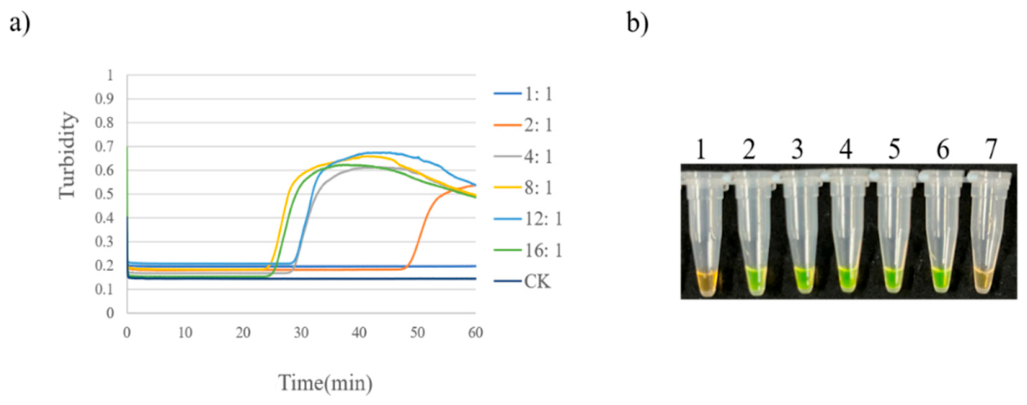
For APYLaoMV and APLTV1, LAMP amplification was performed at different outer-to-inner primer (FIP/BIP:F3/B3) concentration ratios (1:1, 2:1, 4:1, 8:1, and 16:1). As shown in Figure 13, the 2:1 ratio gave the earliest peak and highest amplification efficiency for APYLaoMV, making it the optimal ratio. For APLTV1 (Figure 15), the 8:1 ratio showed the best performance and was thus selected. For APV1, ratios of 2:1, 4:1, 8:1, 16:1, and 24:1 were tested; based on the results shown in Figure 14, the 4:1 ratio was chosen as optimal due to its shortest time-to-peak and highest amplification efficiency.
Figure 15.
Primer concentration ratio optimization of LAMP assay for APLTV1. (a) Amplification curve. (b) Visual detection.1: 1:1; 2: 2:1; 3: 4:1; 4: 8:1; 5: 12:1; 6: 16:1; 7: blank control.
Figure 15.
Primer concentration ratio optimization of LAMP assay for APLTV1. (a) Amplification curve. (b) Visual detection.1: 1:1; 2: 2:1; 3: 4:1; 4: 8:1; 5: 12:1; 6: 16:1; 7: blank control.
2.6. Sensitivity of the LAMP Assays for the Three Viruses
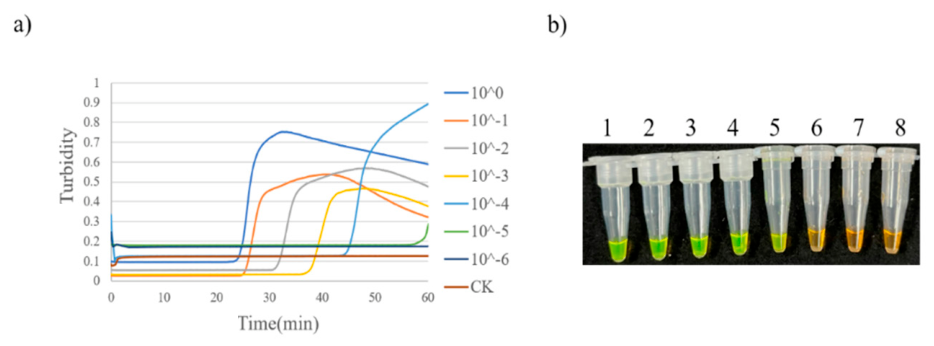
The cDNAs of the three viruses were serially diluted at a 10-fold intervals and used as templates for LAMP amplification. The results revealed that the amplification curve of APYLaoMV was detectable down to a dilution of 10⁻³, indicating a detection limit of 10⁻³. For APV1, the curve was observed at a dilution of 10⁻⁵; thus, its detection limit was determined to be 10⁻⁵. Although an amplification curve was obtained for APLTV1 at the 10⁻⁵ dilution, no valid Tt value could be generated for this curve; consequently, the detection limit of APLTV1 was defined as 10⁻⁴ dilution.
Figure 16.
Sensitivity test of LAMP assay for APYLaoMV. (a) Amplification curve. (b) Visual detection.1: 10⁰; 2: 10⁻¹; 3: 10⁻²; 4: 10⁻³; 5: 10⁻⁴; 6: 10⁻⁵; 7: 10⁻⁶; 8: blank control.
Figure 16.
Sensitivity test of LAMP assay for APYLaoMV. (a) Amplification curve. (b) Visual detection.1: 10⁰; 2: 10⁻¹; 3: 10⁻²; 4: 10⁻³; 5: 10⁻⁴; 6: 10⁻⁵; 7: 10⁻⁶; 8: blank control.
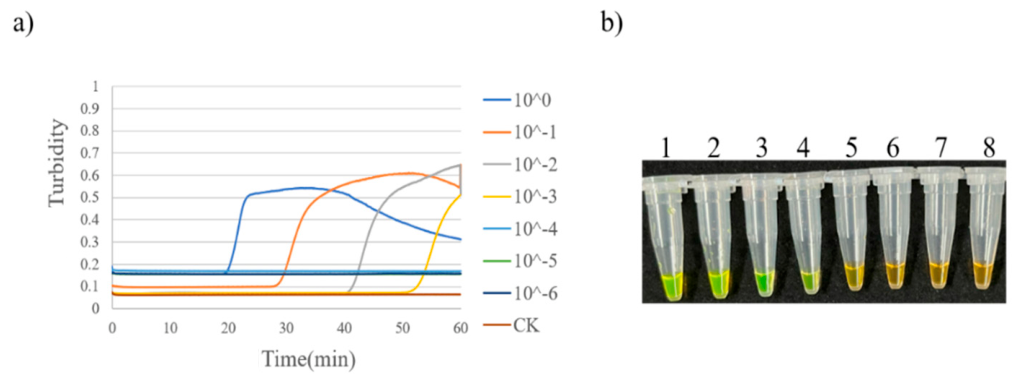
Figure 17.
Sensitivity test of LAMP assay for APV1. (a) Amplification curve. (b) Visual detection.1: 10⁰; 2: 10⁻¹; 3: 10⁻²; 4: 10⁻³; 5: 10⁻⁴; 6: 10⁻⁵; 7: 10⁻⁶; 8: blank control.
Figure 17.
Sensitivity test of LAMP assay for APV1. (a) Amplification curve. (b) Visual detection.1: 10⁰; 2: 10⁻¹; 3: 10⁻²; 4: 10⁻³; 5: 10⁻⁴; 6: 10⁻⁵; 7: 10⁻⁶; 8: blank control.
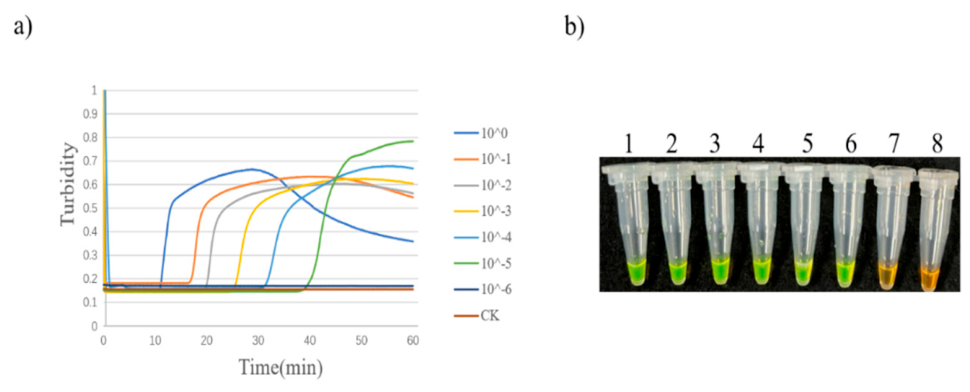
Figure 18.
Sensitivity test of LAMP assay for APLTV1. (a) Amplification curve. (b) Visual detection.1: 10⁰; 2: 10⁻¹; 3: 10⁻²; 4: 10⁻³; 5: 10⁻⁴; 6: 10⁻⁵; 7: 10⁻⁶; 8: blank control.
Figure 18.
Sensitivity test of LAMP assay for APLTV1. (a) Amplification curve. (b) Visual detection.1: 10⁰; 2: 10⁻¹; 3: 10⁻²; 4: 10⁻³; 5: 10⁻⁴; 6: 10⁻⁵; 7: 10⁻⁶; 8: blank control.
2.7. Specificity Analysis of LAMP Assays for the Three Viruses
The LAMP assays for the three viruses were performed using their respective optimized reaction systems. The cDNAs of APYLaoMV, APV1, APLTV1, ANSSV, and ANRSV were used as templates for cross-reactivity testing. The results showed that amplification curves and distinct positive color reactions were observed only for the target virus in each assay, while no cross-reactivity was detected with non-target viruses. These results demonstrated that the established LAMP methods possessed good specificity for the three target viruses (Figure 19, Figure 20 and Figure 21).
2.8. Application of the LAMP Detection Method
The established LAMP assay was compared with RT-PCR using a total of 26 samples collected from different regions of Hainan Province for the detection of three viruses. The results showed that the total number of positive detections by LAMP was higher than that by RT-PCR, which was consistent with its lower limit of detection. For APYLaOMV, the detection rate of RT-PCR was 84.6 %, while that of LAMP was 80.8 %(Table 1). This discrepancy may be attributed to the higher limit of detection of the RT-PCR assay (10⁻³ diluted cDNA), or it could be affected by the quality of cDNA. In summary, the LAMP assay exhibited stable performance. Negative controls were included in all runs to exclude aerosol contamination and guarantee the accuracy of experimental results.
3. Discussion
YLD is the most destructive disease of betel palm, and a strong association between this disorder and APV1 has been demonstrated by multiple studies [4,5,6,7,8]. Furthermore, it is a systemic infection disease mainly transmitted by the mealybugs Ferrisia virgata and Pseudococcus cryptus [6], while the vectors of APLTV1 and APYLaoMV remain unknown. Currently, six viruses (APV1, APLTV1, APYLaoMV, TSV, ANSSV, and ANRSV) associated with betel palm have been identified. The symptoms induced by ANSSV, ANRSV, and TSV can be distinguished visually. In contrast, symptoms caused by APV1 are frequently confused with nutrient deficiency disorders and are difficult to differentiate from those triggered by APLTV1 and APYLaoMV. Moreover, APLTV1 infection does not produce apparent phenotypic changes, further complicating field diagnosis. The primary and most widely adopted approach for containing disease outbreaks is to interrupt natural and human-mediated pathogen dissemination from infection sources. Therefore, it is critical to develop rapid, efficient, and user-friendly viral detection methods for virological research, disease surveillance, seedling quarantine, and integrated disease management.
Loop-mediated isothermal amplification (LAMP) exhibits unique advantages over quantitative real-time PCR (qPCR) for nucleic acid detection. While qPCR requires thermal cycling to drive template denaturation, primer annealing, and strand extension, LAMP proceeds isothermally at 60-65 °C. This feature shortens the reaction time to 30-60 min and greatly reduces instrumental complexity. Owing to its isothermal amplification mechanism, LAMP eliminates the requirement for costly thermocyclers, rendering this method cost-effective and highly applicable to decentralized testing or resource-limited environments [21,22]. Moreover, LAMP achieves remarkable amplification efficiency, generating up to 10⁹-10¹⁰ DNA copies within one hour, in sharp contrast to the typical yield of 10⁶-107 copies from qPCR [23]. Furthermore, the established LAMP assay was compared against standard RT-PCR using 26 samples. LAMP yielded more positive detections than RT-PCR, consistent with its lower limit of detection. For APYLaOMV, the RT-PCR detection rate reached 84.6 %, whereas LAMP achieved 80.8 % (Table 1). This discrepancy might result from the higher detection limit of the RT-PCR assay (10-3 dilution) or potential variations in cDNA quality. Overall, the LAMP assay performed stably. Negative controls were included in every run to rule out aerosol contamination and ensure result accuracy.
For plant viruses that cannot be cultured in vitro, superior primer design constitutes a key advantage of LAMP. LAMP utilizes four to six primers that recognize six to eight discrete regions of the target sequence, conferring extraordinary specificity and substantially reducing non-specific amplification [23]. In this study, three sets of LAMP primers were designed based on the spliced whole-genome sequence of APYLaoMV and the CP gene sequences of APLTV1 and APV1, respectively. All acquired sequences were aligned using DNAMAN 8 software to identify conserved regions and determine the final amplified target regions. The optimal primer set for each virus was selected based on the earliest peak appearance time. For APYLaoMV, APV1, and APLTV1, the primer sets APYLaoMV-P1, APV1-P2, and APLTV1-P1 exhibited the earliest peak appearance, high amplification efficiency, and positive color reactions compared to other primer sets (Table 1, Table 2 and Table 3, Figure 1, Figure 2 and Figure 3). Notably, the selection of different target regions (whole genome for APYLaoMV versus CP gene for APV1 and APLTV1) reflects the need to identify sufficiently conserved and specific sequences for each virus, ensuring both broad detection coverage and minimal cross-reactivity.
Various methods can be used to interpret LAMP reaction results, including turbidity assay, fluorescence-based detection (SYBR Green), hydroxynaphthol blue (HNB), calcein assay, and gel electrophoresis [27]. Among these, the SYBR Green fluorescence-based assay offers multiple advantages for LAMP result interpretation. SYBR Green I can specifically bind to double-stranded DNA amplicons and generate intense fluorescent signals with low background noise, allowing reliable detection of trace amplification products and improved assay sensitivity. Additionally, it is a commercially accessible, cost-effective, and versatile reagent compatible with most conventional LAMP systems without strict reagent matching requirements [27]. Furthermore, it simplifies the detection procedure by eliminating cumbersome steps such as gel preparation, electrophoresis, and staining, thereby shortening the experimental duration and enhancing overall efficiency. In this study, a dual-readout approach was employed: real-time fluorescence monitoring via a turbidimeter provided quantitative amplification curves, while post-amplification SYBR Green I staining enabled visual colorimetric discrimination. This combination ensures both analytical rigor and field-deployable simplicity.
Systematic optimization of LAMP reaction parameters is essential for achieving maximal amplification efficiency and assay reproducibility. In this study, amplification temperature, Mg²⁺concentration, dNTPs concentration, and outer-to-inner primer ratio were optimized for each virus. The optimal reaction temperature was 65 °C for both APYLaoMV and APV1, whereas 63 °C was optimal for APLTV1. This difference may be attributed to variations in the GC content and melting temperatures of the respective primer sets, which influence primer-template stability under isothermal conditions. Regarding Mg²⁺concentration, the earliest peak appearance and highest amplification efficiency were achieved at 12 mM for APYLaoMV and 10 mM for both APV1 and APLTV1. Mg²⁺serves as an essential cofactor for Bst DNA polymerase and influences primer annealing stability; the higher Mg²⁺requirement of APYLaoMV may reflect the specific base composition of its target region. The optimal dNTPs concentrations were 1.7 mM for APYLaoMV, 1.0 mM for APV1, and 0.8 mM for APLTV1, and the optimal outer-to-inner primer ratios were 2:1, 4:1, and 8:1, respectively. The divergent optimal ratios likely reflect differences in the relative binding efficiencies of inner and outer primers across the three target sequences, underscoring the necessity of empirical optimization for each LAMP assay.
The sensitivity of the established LAMP assays was evaluated using 10-fold serial dilutions of viral cDNAs. The detection limits were 10-3dilution for APYLaoMV, 10-5 for APV1, and 10-4 for APLTV1. These detection limits are comparable to or exceed those of conventional RT-PCR methods routinely used for these viruses [12,13,16], demonstrating the high analytical sensitivity of the LAMP platform. The variation in detection limits among the three viruses may be attributed to differences in initial cDNA concentration, primer binding efficiency, and target sequence accessibility. Specificity testing confirmed that each LAMP assay reacted exclusively with its target virus and showed no cross-reactivity with other areca palm viruses (ANSSV and ANRSV), further validating the reliability of the established assays for species-specific detection.
Compared with the RT-LAMP assay previously developed for ANSSV and ANRSV [19], the present study extends LAMP-based detection to three additional areca palm viruses that are particularly challenging to identify based on symptoms alone. The establishment of LAMP assays for APV1, APLTV1, and APYLaoMV complements the existing diagnostic toolkit for areca palm viruses and enables comprehensive virological surveillance. Furthermore, the visual colorimetric readout allows field-based diagnosis without specialized equipment, which is especially valuable for disease monitoring in remote areca palm plantations.
Despite these advantages, several limitations of the present study should be acknowledged. First, the LAMP assays were validated using field samples with single infections only; mixed infections of the three viruses were not included in the confirmation panel. Future studies should evaluate the performance of these assays on samples with mixed infections to ensure reliable detection under complex field conditions. Second, the vectors and transmission mechanisms of APLTV1 and APYLaoMV remain unknown, which limits our understanding of viral spread dynamics and the development of targeted disease management strategies. Third, the sample size for field validation (26 samples per field) was relatively limited; larger-scale field surveys across diverse geographical regions and seasons would strengthen the robustness of these assays. Finally, integration of these LAMP assays into a multiplex format capable of simultaneously detecting all three viruses in a single reaction would further enhance diagnostic throughput and practical utility.
In conclusion, this study successfully established independent RT-LAMP assays for the detection of three major areca palm viruses (APV1, APLTV1, and APYLaoMV). These assays exhibit high diagnostic sensitivity and specificity, providing powerful tools for routine virus identification, especially during periods of increased YLD incidence. By enabling visual colorimetric readout, these methods circumvent the need for specialized laboratory equipment, rendering them particularly valuable for disease monitoring in remote plantations. These findings establish a solid technical and theoretical foundation for the efficient quarantine and control of YLD in areca palm production.
4. Materials and Methods
4.1. Plant Materials
Healthy and infected leaves were collected from areca palm-growing regions of various cities and counties on Hainan Island. Positive samples of APV1, APLTV1, or APYLaoMV, identified via RT-PCR and sequencing, were used to establish and optimize the LAMP assays, with virus-free healthy samples serving as negative controls. Subsequently, field samples of areca palms were collected from plantations; a total of 26 samples were collected from each field, immediately frozen in liquid nitrogen, and transported to the laboratory for further analysis. These confirmation samples included those with single infections (APV1, APLTV1, or APYLaoMV); double and triple mixed infections of the three viruses were not included in this study.
4.2. RNA Extraction and Reverse Transcription
Total RNA was isolated from areca leaf samples as previously described [24]. First-strand cDNA was synthesized from 5 µg total RNA using a RevertAid First Strand cDNA Synthesis Kit (#K1622, Thermo Fisher Scientific, Shanghai, China) in a 20 µL reaction mixture with random primers, according to the manufacturer’s protocol.
4.3. Design and Synthesis of LAMP Primers for the Three Viruses
LAMP primer sets were designed using the online primer design software PrimerExplorer V5.0 (http://primerexplorer.jp/lampv5e/index.html) and synthesized by Sangon Biotech (Shanghai) Co., Ltd., as shown in Table 2, Table 3 and Table 4. The target nucleotide sequences utilized in this study included the spliced whole-genome sequence of APYLaoMV (Accession No. OR204700), the CP gene sequence of APLTV1 isolate TCWP531 (Accession No. PX244090.1), and the CP gene sequence of APV1 isolate QZWL1 (Accession No. MN296265.1). All acquired sequences were aligned using DNAMAN 8 software to determine the final amplified target regions. Each LAMP primer set comprised a forward outer primer (F3), a reverse outer primer (B3), a forward inner primer (FIP, consisting of F1c + F2), and a reverse inner primer (BIP, consisting of B1c + B2).
4.4. Optimization of LAMP Reaction System and Conditions
The initial LAMP reaction system was prepared to a total volume of 20 µL, containing 10× Bst 2.0 Buffer with Mg²⁺ (2.0 µL), MgSO₄ (100 mM, 0.8 µL), FIP/BIP (40 µM, 0.8 µL), F3/B3 (10 µM, 0.8 µL), Bst 2.0 DNA Polymerase (0.8 µL), cDNA (2.0 µL), and deionized water to a final volume of 20 µL. The mixture was incubated at 65 °C for 1 h in a LA-500C real-time turbidimeter (Eiken Chemical Co., Ltd.), followed by inactivation at 85 °C for 5 min. After the reaction, 1.0 µL of SYBR Green I nucleic acid stain was added to the products. The amplification results were evaluated based on the amplification curves recorded by the turbidimeter and the color changes of the products after staining. A positive control (P+) and a negative control (N−) from a LAMP kit (Eiken Chemical Co., Ltd.) were used as experimental controls, and each experiment was repeated three times.
4.4.1. Evaluation of LAMP Amplification Products
Two approaches were used to assess the results of the LAMP assay. In the first method, reaction tubes were placed in a real-time constant-temperature fluorescence detector to monitor fluorescence signals continuously. An S-shaped amplification curve indicated a positive result, confirming the presence of the target virus in the sample; conversely, the absence of an S-shaped curve was defined as negative. For the second approach, fluorescent visual detection reagent (SYBR Green I) was added after incubation. The results were judged by color change: an emerald green color of the reaction mixture indicated a positive result, while an orange color indicated a negative result.
4.4.2. Screening of LAMP Primers for APYLaoMV, APLTV1, and APV1
Using the cDNAs of APYLaoMV, APLTV1, and APV1 as templates, three sets of LAMP primers were designed based on their respective target sequences for LAMP amplification. The optimal primer set was selected according to the peak appearance time.
4.4.3. Optimization of LAMP Amplification Temperature for the Three Viruses
LAMP amplification for APV1 and APLTV1 was performed at 59, 61, 63, 65, and 67 °C. For APYLaoMV, the reaction temperatures were set at 59, 62, 65, and 68 °C. The temperature yielding the earliest peak emergence was selected as the optimal reaction temperature.
4.4.4. Optimization of Mg²⁺Concentration for APYLaoMV, APLTV1, and APV1 LAMP Assays
The amount of MgSO₄ was adjusted to set the Mg²⁺ concentration in the reaction system at 4, 6, 8, 10, 12, and 14 mM for LAMP amplification. The optimal Mg²⁺ concentration was selected based on peak emergence time of amplification curves and reagent cost.
4.4.5. Optimization of dNTPs Concentration in the LAMP Assay for the Three Viruses
The amount of dNTPs was adjusted to set the concentrations at 0.5, 0.8, 1.1, 1.4, 1.7, and 2.0 mM for LAMP amplification of APYLaoMV. For APV1 and APLTV1, dNTPs concentrations were set to 0.4, 0.6, 0.8, 1.0, 1.2, and 1.4 mM, respectively. The optimal dNTPs concentration was selected based on peak emergence time.
4.4.6. Optimization of LAMP Primer Concentration Ratio for APYLaoMV, APLTV1, and APV1
The concentration ratios of inner primers (FIP/BIP) to outer primers (F3/B3) were set at 2:1, 4:1, 8:1, 16:1, and 24:1 for LAMP amplification of APV1. For APYLaoMV and APLTV1, the ratios were adjusted to 1:1, 2:1, 4:1, 8:1, and 16:1, respectively. The optimal primer ratio was determined according to the peak emergence time.
4.4.7. Sensitivity and Specificity Analysis of the Three Viruses LAMP Assays
The cDNAs of APV1, APYLaoMV, and APLTV1 were serially diluted 10-fold and used as templates for LAMP amplification. The highest dilution factor that still generated an amplification curve was defined as the detection limit. For specificity testing, LAMP amplification was performed using the cDNAs of APV1, APLTV1, APYLaoMV, ANSSV, and ANRSV as templates. Positive signals were expected only for the target virus in each assay, confirming the specificity of the LAMP method.
Author Contributions
Conceptualization, X.N. and F.G.; formal analysis, X.N. and F.G.; data curation, X.N., J.S., H.Z., and Y.T.; writing—original draft preparation, X.N. and Y.T.; writing—review and editing, H.Z., X.N., and J.S.; funding acquisition, X.N. and F.G. All authors have read and agreed to the published version of the manuscript.
Funding
This research was funded by the Scientific Research Project of Academician Innovation Platforms in Hainan Province (grant number YSPTZX202151).
Data Availability Statement
All data used in this study are publicly available on NCBI. The CP gene sequences obtained in this study have been deposited in GenBank under the accession numbers PX243804–PX244167.
Conflicts of Interest
.The authors declare no conflicts of interest. The funders had no role in the design of the study; in the collection, analyses, or interpretation of data; in the writing of the manuscript; or in the decision to publish the results.
References
- Khan, L.U.; Zhao, R.; Wang, H.; Huang, X. The recent advances of the causal agent of yellow leaf disease (YLD) on areca palm (Areca catechu L.). Trop. Plants 2023, 2. [Google Scholar] [CrossRef]
- Bhat, K.; GI, P.; Bavappa, K. Preliminary observations on the yellow leaf disease of arecanut palm. Arecanut J. 1957, 8, 61–62. [Google Scholar]
- Wang, C.; Yin, Z.; Luo, R.; Qian, J.; Fu, C.; Wang, Y.; Xie, Y.; Liu, Z.; Qiu, Z.; Pei, H. Spatiotemporal evolution and impact mechanisms of areca palm plantations in China (1987–2022). Forests 2024, 15, 1679. [Google Scholar] [CrossRef]
- Yu, H.; Qi, S.; Chang, Z.; Rong, Q. Complete genome sequence of a novel velarivirus infecting areca palm in China. Arch. Virol. 2015, 160, 2367–2370. [Google Scholar] [CrossRef] [PubMed]
- Wang, H.; Zhao, R.; Zhang, H.; Cao, X.; Li, Z.; Zhang, Z.; Zhai, J.; Huang, X. Prevalence of yellow leaf disease (YLD) and its associated areca palm velarivirus 1 (APV1) in betel palm (Areca catechu) plantations in Hainan, China. Plant Dis. 2020, 104, 2556–2562. [Google Scholar] [CrossRef] [PubMed]
- Zhang, H.; Zhao, X.; Cao, X.; Khan, L.U.; Zhao, R.; Wang, H.; Huang, X. Transmission of areca palm velarivirus 1 by mealybugs causes yellow leaf disease in betel palm (Areca catechu). Phytopathology 2022, 112, 700–707. [Google Scholar] [CrossRef] [PubMed]
- Cao, X.; Gao, B.; Lu, J.; Wang, H.; Zhao, R.; Huang, X. Areca palm velarivirus 1 infection caused disassembly of chloroplast and reduction of photosynthesis in areca palm. Front. Microbiol. 2024, 15, 1424489. [Google Scholar] [CrossRef]
- Khan, L.U.; Cao, X.; Zhao, R.; Tan, H.; Xing, Z.; Huang, X. Effect of temperature on yellow leaf disease symptoms and its associated areca palm velarivirus 1 titer in areca palm (Areca catechu L.). Front. Plant Sci. 2022, 13, 1023386. [Google Scholar] [CrossRef] [PubMed]
- Yang, K.; Shen, W.; Li, Y.; Li, Z.; Miao, W.; Wang, A.; Cui, H. Areca palm necrotic ringspot virus, classified within a recently proposed genus Arepavirus of the family Potyviridae, is associated with necrotic ringspot disease in areca palm. Phytopathology 2019, 109, 887–894. [Google Scholar] [CrossRef] [PubMed]
- Pandian, R.T.P.; Bhavishya; Sidharthan, V.K.; Rajesh, M.K.; Babu, M.; Sharma, S.K.; Kumar, B.J.N.; Chaithra, M.; Hegde, V. From the discovery of a novel arepavirus in diseased arecanut palms (Areca catechu L.) in India to the identification of known and novel arepaviruses in bee and plant transcriptomes through data-mining. Virology 2024, 600, 110256. [Google Scholar] [CrossRef] [PubMed]
- Yang, K.; Ran, M.; Li, Z.; Hu, M.; Zheng, L.; Liu, W.; Jin, P.; Miao, W.; Zhou, P.; Shen, W.; et al. Analysis of the complete genomic sequence of a novel virus, areca palm necrotic spindle-spot virus, reveals the existence of a new genus in the family Potyviridae. Arch. Virol. 2018, 163, 3471–3475. [Google Scholar] [CrossRef] [PubMed]
- Tan, H.; Zhao, R.; Wang, H.; Huang, X. Identification and molecular characterization of a novel member of the genus Totivirus from Areca catechu L. Arch. Virol. 2023, 168, 247. [Google Scholar] [CrossRef] [PubMed]
- Niu, X.; Xu, Z.; Tian, Y.; Xiao, S.; Xie, Y.; Du, Z.; et al. A putative ormycovirus that possibly contributes to the yellow leaf disease of areca palm. Forests 2024, 15, 1025. [Google Scholar] [CrossRef]
- Wang, X.; Wu, Q.; Zou, L.; Jiang, X.; Li, Z.; Hu, W.; Xian, S.; et al. Molecular characterization of an isolate of tobacco streak virus naturally infecting Areca catechu L. in China-a first case in the family Arecaceae. Plants 2026, 15, 1864. [Google Scholar] [CrossRef] [PubMed]
- Niu, X.; Lin, Z.; Yang, D.; Meng, X.; et al. Investigation and symptom analysis of areca palm leaf yellowing virus disease in Wanning, Hainan, China. Chin. J. Trop. Crops 2021, 42, 3073–3078. [Google Scholar] [CrossRef]
- Peng, C.; Fan, B.; Zhu, H.; Liu, L.; Zhao, Z.; Huang, L. Establishment of dual reverse transcriptase-polymerase chain reaction detection system for areca palm velarivirus 1. PLoS ONE 2024, 19, e0303941. [Google Scholar] [CrossRef] [PubMed]
- Lu, J.; He, W.; Liu, Y.; Li, S.; Huang, X.; Wang, H.; Cao, X. Development of a colloidal gold-based immunochromatographic strip for rapid detection of areca palm velarivirus 1. Front. Microbiol. 2025, 16, 1533170. [Google Scholar] [CrossRef] [PubMed]
- Sun, K.; Zhang, L.; Li, Z.; Zhao, P.; Wan, S. Development of a multiplex RT-PCR assay for simultaneous detection of Velarivirus arecae, Arepavirus arecae and Arepavirus arecamaculatum. Plants 2025, 14, 3683. [Google Scholar] [CrossRef] [PubMed]
- Zhao, G.; Shen, W.; Tuo, D.; Cui, H.; Yan, P.; Tang, Q.; Zhu, G.; Li, X.; Zhou, P.; Zhang, Y. Rapid detection of two emerging viruses associated with necrotic symptoms in Areca catechu L. by reverse transcription loop-mediated isothermal amplification (RT-LAMP). J. Virol. Methods 2020, 281, 113795. [Google Scholar] [CrossRef] [PubMed]
- Lin, Z.; Niu, X.; Tang, Q.; Song, W.; Meng, X.; et al. Development of a TaqMan real-time fluorescent quantitative PCR method for detection of areca palm velarivirus 1. Chin. J. Trop. Crops 2021, 42, 3087–3092. [Google Scholar] [CrossRef]
- Amaral, C.; Antunes, W.; Moe, E.; Duarte, A.G.; Lima, L.M.P.; Santos, C.; Gomes, I.L.; Afonso, G.S.; Vieira, R.; Teles, H.S.S.; et al. A molecular test based on RT-LAMP for rapid, sensitive and inexpensive colorimetric detection of SARS-CoV-2 in clinical samples. Sci. Rep. 2021, 11, 16430. [Google Scholar] [CrossRef] [PubMed]
- Regal, P.; Doval, A.; García-Ramos, I.; Cepeda, A.; Garrido-Maestu, A.; Lamas, A. Loop-mediated isothermal amplification-based workflow for the detection and serotyping of Salmonella spp. in environmental poultry flock samples. Foods 2024, 13, 4069. [Google Scholar] [CrossRef] [PubMed]
- Garg, N.; Ahmad, F.J.; Kar, S. Recent advances in loop-mediated isothermal amplification (LAMP) for rapid and efficient detection of pathogens. Curr. Res. Microb. Sci. 2022, 3, 100120. [Google Scholar] [CrossRef] [PubMed]
- Rolando, J.C.; Jue, E.; Barlow, J.T.; Ismagilov, R.F. Real-time kinetics and high resolution melt curves in single-molecule digital LAMP to differentiate and study specific and non-specific amplification. Nucleic Acids Res. 2020, 48, e42. [Google Scholar] [CrossRef] [PubMed]
- Soroka, M.; Wasowicz, B.; Rymaszewska, A. Loop-mediated isothermal amplification (LAMP): the better sibling of PCR? Cells 2021, 10, 1931. [Google Scholar] [CrossRef] [PubMed]
- Yang, Y.; Yang, R.; Luo, C.; Wang, X.; Ma, F. Loop-mediated isothermal amplification (LAMP): current progress and future directions in rapid nucleic acid detection. Sens. Actuator. Rep. 2026, 11, 100440. [Google Scholar] [CrossRef]
- Alhamid, G.; Tombuloglu, H.; Al-Suhaimi, E. Development of loop-mediated isothermal amplification (LAMP) assays using five primers reduces the false-positive rate in COVID-19 diagnosis. Sci. Rep. 2023, 13, 5066. [Google Scholar] [CrossRef] [PubMed]
Figure 1.
LAMP results of three primer sets for APYLaoMV. (a) Amplification curve.(b) Visual detection.1: APYLaoMV-P1; 3: APYLaoMV-P2; 5: APYLaoMV-P3; 2, 4, 6: blank control.
Figure 1.
LAMP results of three primer sets for APYLaoMV. (a) Amplification curve.(b) Visual detection.1: APYLaoMV-P1; 3: APYLaoMV-P2; 5: APYLaoMV-P3; 2, 4, 6: blank control.
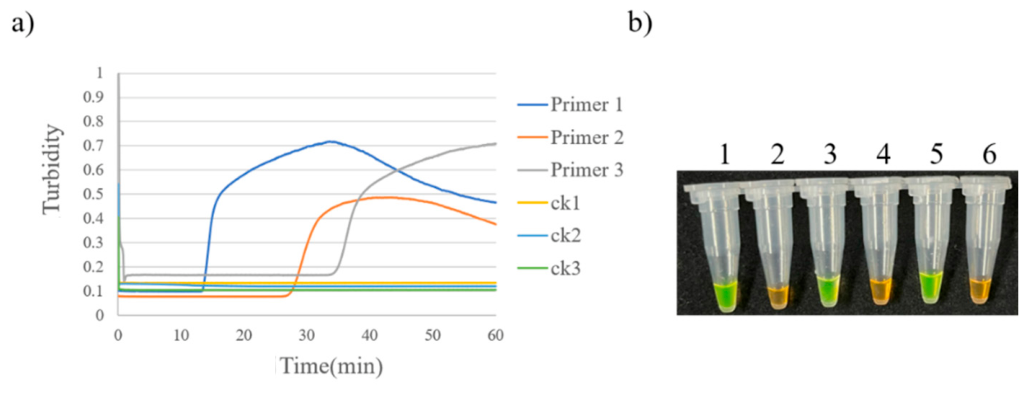
Figure 2.
LAMP results of three primer sets for APV1.(a) Amplification curve. (b) Visual detection.1: APV1-P1; 3: APV1-P2; 5: APV1-P3; 2, 4, 6: blank control.
Figure 2.
LAMP results of three primer sets for APV1.(a) Amplification curve. (b) Visual detection.1: APV1-P1; 3: APV1-P2; 5: APV1-P3; 2, 4, 6: blank control.
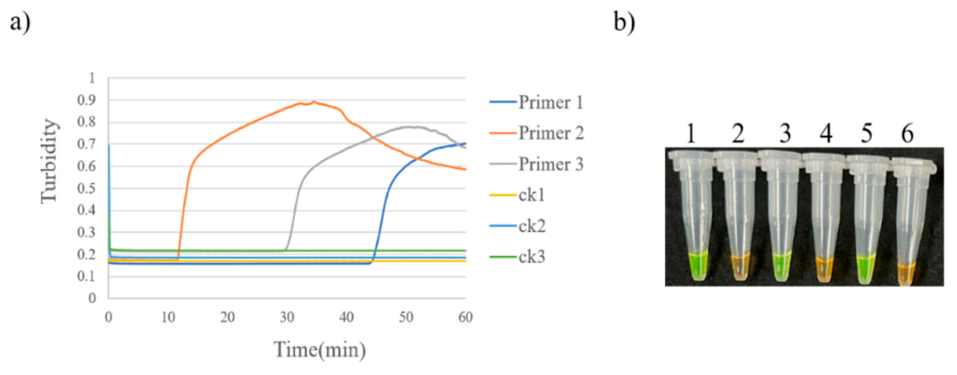
Figure 3.
LAMP results of three primer sets for APLTV1.(a) Amplification curve. (b) Visual detection.1: APLTV1-P1; 4: APLTV1-P2; 7: APLTV1-P3; 2, 3, 5, 6, 8: blank control.
Figure 3.
LAMP results of three primer sets for APLTV1.(a) Amplification curve. (b) Visual detection.1: APLTV1-P1; 4: APLTV1-P2; 7: APLTV1-P3; 2, 3, 5, 6, 8: blank control.
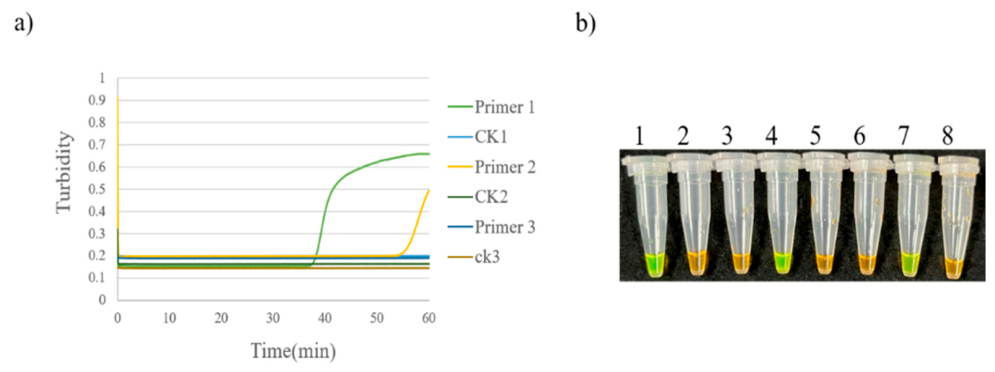
Figure 4.
Temperature optimization of LAMP assay for APLTV1. (a) Amplification curve. (b) Visual detection. 1: 59 °C; 2: 61 °C; 3: 63 °C; 4: 65 °C; 5: 67 °C; 6: blank control.
Figure 4.
Temperature optimization of LAMP assay for APLTV1. (a) Amplification curve. (b) Visual detection. 1: 59 °C; 2: 61 °C; 3: 63 °C; 4: 65 °C; 5: 67 °C; 6: blank control.
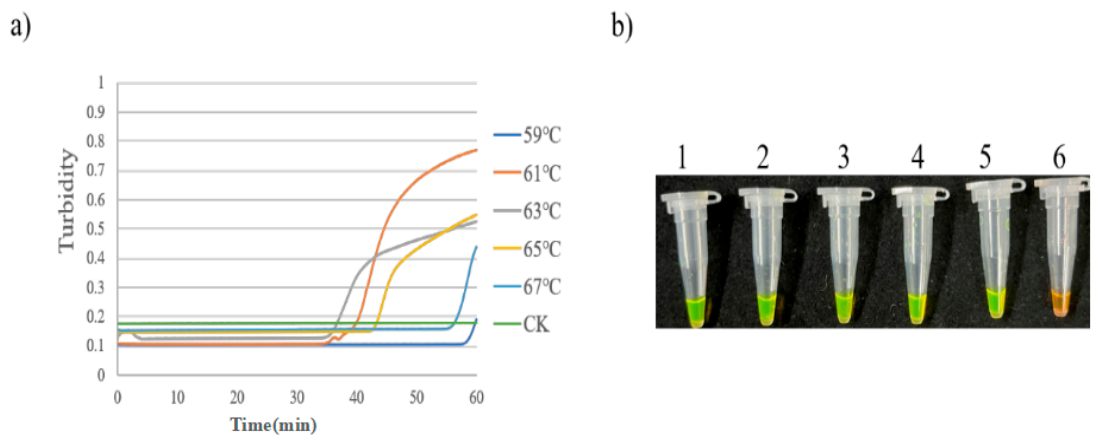
Figure 5.
Temperature optimization of LAMP assay for APV1. (a) Amplification curve. (b) Visual detection. 1: 59 °C; 2: 61 °C; 3: 63 °C; 4: 65 °C; 5: 67 °C; 6: blank control.
Figure 5.
Temperature optimization of LAMP assay for APV1. (a) Amplification curve. (b) Visual detection. 1: 59 °C; 2: 61 °C; 3: 63 °C; 4: 65 °C; 5: 67 °C; 6: blank control.
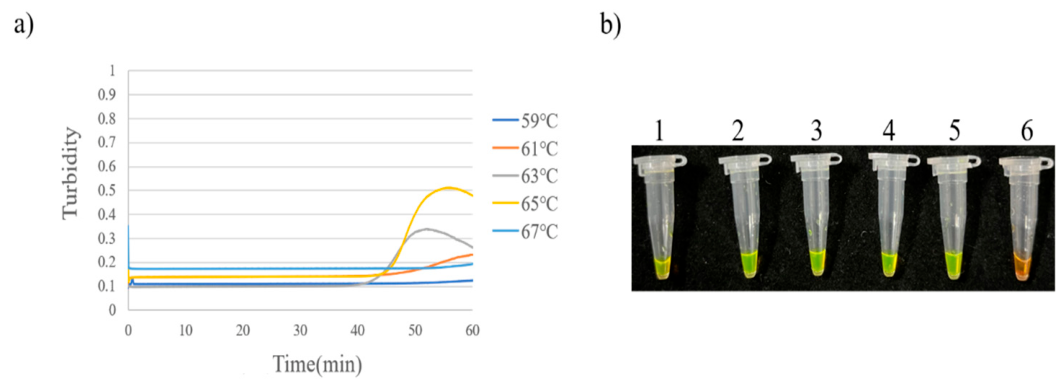
Figure 6.
Temperature optimization of LAMP assay for APYLaoMV. (a) Amplification curve. (b) Visual detection.1: 59 °C; 2: 62 °C; 3: 65 °C; 4: 68 °C; 5: blank control.
Figure 6.
Temperature optimization of LAMP assay for APYLaoMV. (a) Amplification curve. (b) Visual detection.1: 59 °C; 2: 62 °C; 3: 65 °C; 4: 68 °C; 5: blank control.
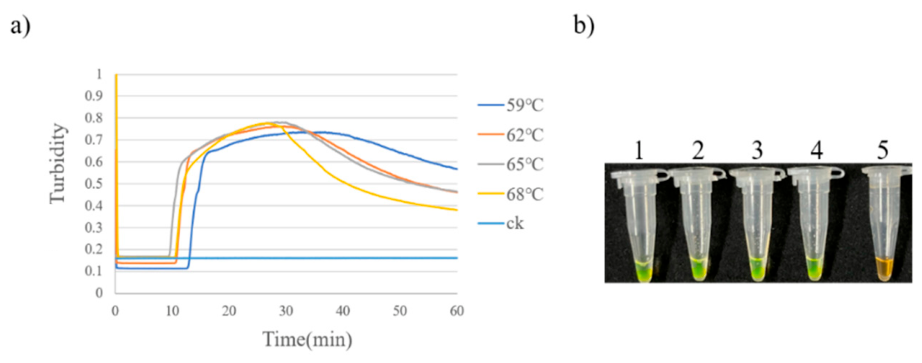
Figure 10.
dNTPs concentration optimization of LAMP assay for APYLaoMV. (a) Amplification curve. (b) Visual detection.1: 0.5 mM; 2: 0.8 mM; 3: 1.1 mM; 4: 1.4 mM; 5: 1.7 mM; 6: 2.0 mM; 7: blank control.
Figure 10.
dNTPs concentration optimization of LAMP assay for APYLaoMV. (a) Amplification curve. (b) Visual detection.1: 0.5 mM; 2: 0.8 mM; 3: 1.1 mM; 4: 1.4 mM; 5: 1.7 mM; 6: 2.0 mM; 7: blank control.
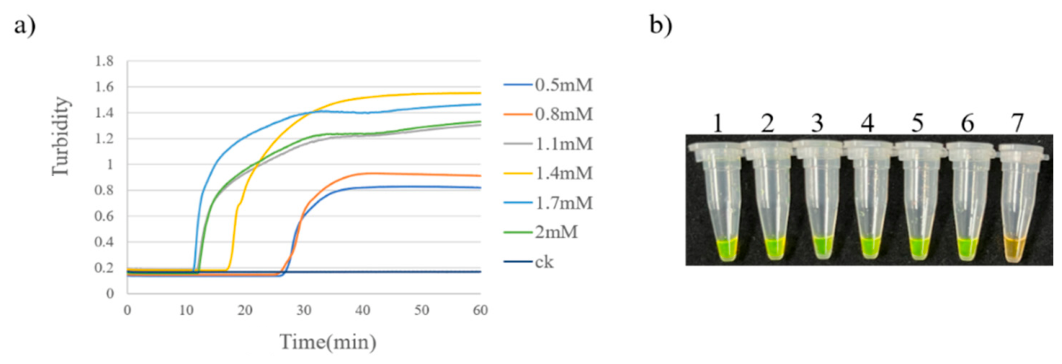
Figure 11.
dNTPs concentration optimization of LAMP assay for APV1. (a) Amplification curve. (b) Visual detection.1: 0.4 mM; 2: 0.6 mM; 3: 0.8 mM; 4: 1.0 mM; 5: 1.2 mM; 6: 1.4 mM; 7: blank control.
Figure 11.
dNTPs concentration optimization of LAMP assay for APV1. (a) Amplification curve. (b) Visual detection.1: 0.4 mM; 2: 0.6 mM; 3: 0.8 mM; 4: 1.0 mM; 5: 1.2 mM; 6: 1.4 mM; 7: blank control.
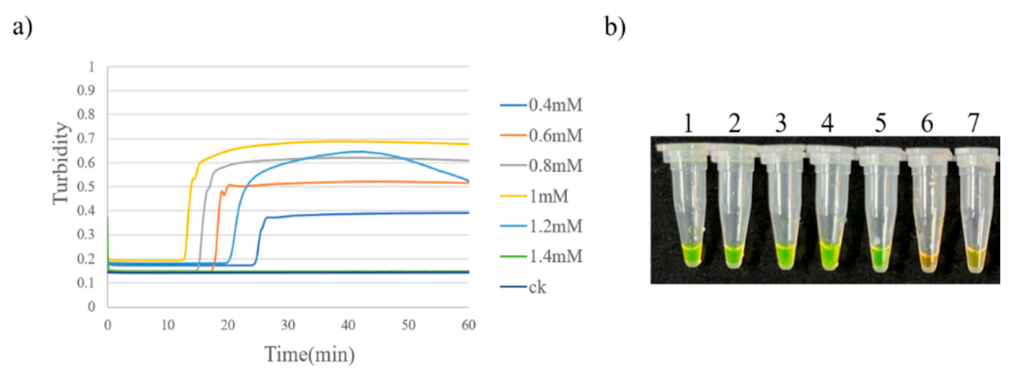
Figure 12.
dNTPs concentration optimization of LAMP assay for APLTV1. (a) Amplification curve. (b) Visual detection.1: 0.4 mM; 2: 0.6 mM; 3: 0.8 mM; 4: 1.0 mM; 5: 1.2 mM; 6: 1.4 mM; 7: blank control.
Figure 12.
dNTPs concentration optimization of LAMP assay for APLTV1. (a) Amplification curve. (b) Visual detection.1: 0.4 mM; 2: 0.6 mM; 3: 0.8 mM; 4: 1.0 mM; 5: 1.2 mM; 6: 1.4 mM; 7: blank control.
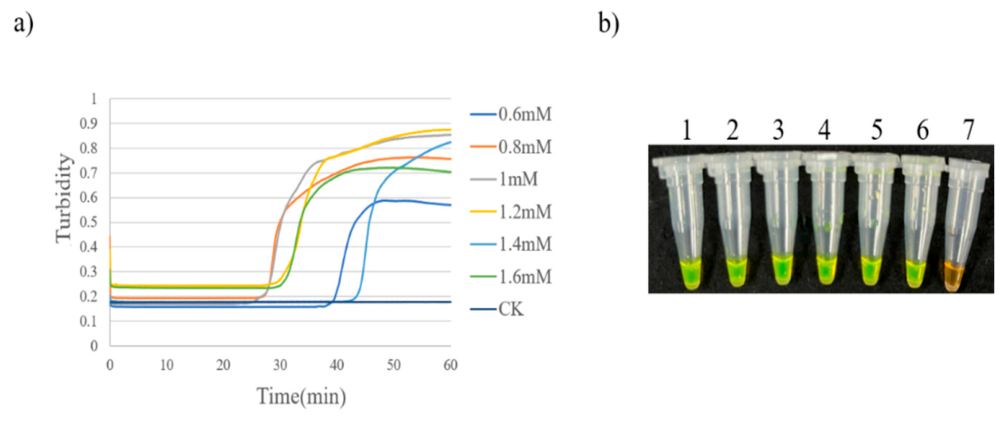
Figure 13.
Primer concentration ratio optimization of LAMP assay for APYLaoMV. (a) Amplification curve. (b) Visual detection.1: 1:1; 2: 2:1; 3: 4:1; 4: 8:1; 5: 16:1; 6: blank control.
Figure 13.
Primer concentration ratio optimization of LAMP assay for APYLaoMV. (a) Amplification curve. (b) Visual detection.1: 1:1; 2: 2:1; 3: 4:1; 4: 8:1; 5: 16:1; 6: blank control.
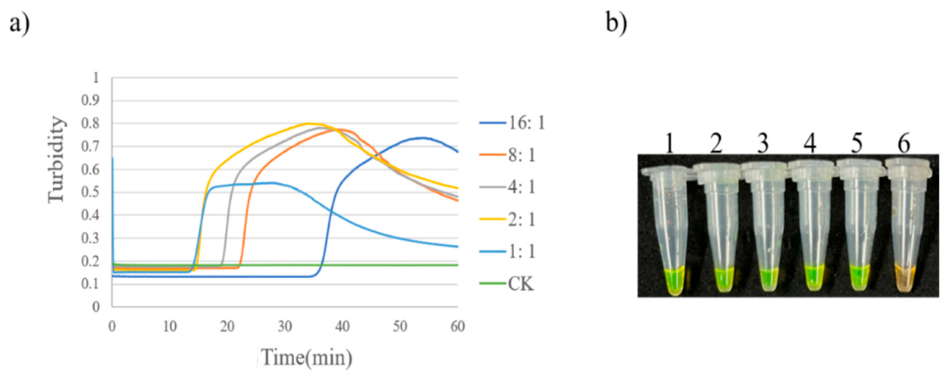
Figure 14.
Primer concentration ratio optimization of LAMP assay for APV1. (a) Amplification curve. (b) Visual detection.1: 2:1; 2: 4:1; 3: 8:1; 4: 16:1; 5: 24:1; 6: blank control.
Figure 14.
Primer concentration ratio optimization of LAMP assay for APV1. (a) Amplification curve. (b) Visual detection.1: 2:1; 2: 4:1; 3: 8:1; 4: 16:1; 5: 24:1; 6: blank control.
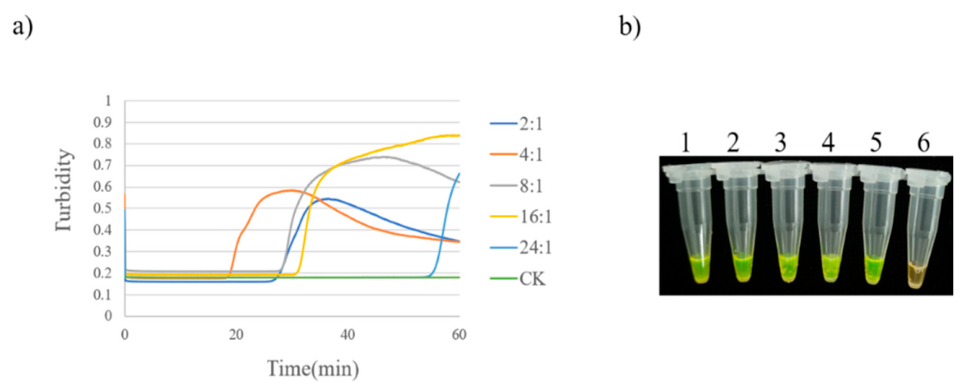
Figure 19.
Specificity test of the LAMP assay for APYLaoMV. (a) Amplification curve. (b) Visual detection.1: APYLaoMV; 2: APV1; 3: APLTV1; 4: ANSSV; 5: ANRSV; 6: blank control.
Figure 19.
Specificity test of the LAMP assay for APYLaoMV. (a) Amplification curve. (b) Visual detection.1: APYLaoMV; 2: APV1; 3: APLTV1; 4: ANSSV; 5: ANRSV; 6: blank control.
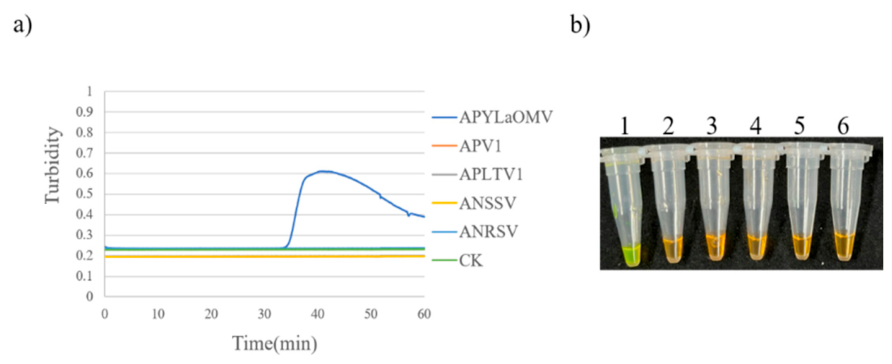
Figure 20.
Specificity test of the LAMP assay for APV1(a) Amplification curve. (b) Visual detection.1: APV1; 2: APYLaoMV; 3: APLTV1; 4: ANSSV; 5: ANRSV; 6: blank control.
Figure 20.
Specificity test of the LAMP assay for APV1(a) Amplification curve. (b) Visual detection.1: APV1; 2: APYLaoMV; 3: APLTV1; 4: ANSSV; 5: ANRSV; 6: blank control.
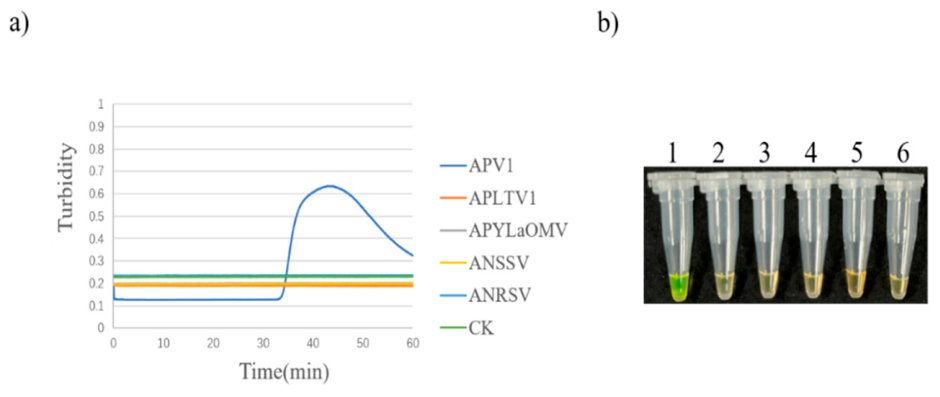
Figure 21.
Specificity test of the LAMP assay for APLTV1. (a) Amplification curve. (b) Visual detection. 1: APLTV1; 2: APV1; 3: APYLaoMV; 4: ANSSV; 5: ANRSV; 6: blank control.
Figure 21.
Specificity test of the LAMP assay for APLTV1. (a) Amplification curve. (b) Visual detection. 1: APLTV1; 2: APV1; 3: APYLaoMV; 4: ANSSV; 5: ANRSV; 6: blank control.
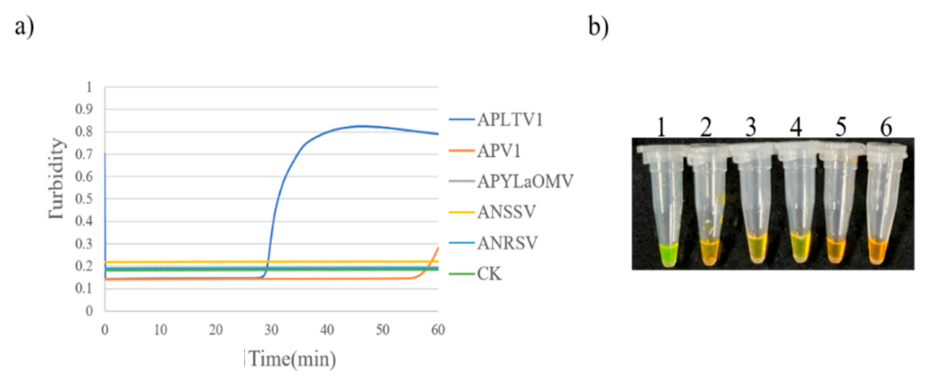

Table 1.
RT-PCR and LAMP Detection of Three Areca palm viruses in Hainan.
| Virus species | APYLaOMV | APV1 | APLTV1 | |||
|---|---|---|---|---|---|---|
| Sample No. | RT-PCR | RT-LAMP | RT-PCR | RT-LAMP | RT-PCR | RT-LAMP |
| LG3 | + | + | + | - | - | + |
| LG4 | + | + | + | + | - | - |
| LD3-4 | + | + | + | + | - | + |
| WC1-4 | + | + | + | + | - | - |
| SL3-7 | - | - | - | - | - | - |
| PL1-4 | + | + | + | + | + | |
| QY2-1 | + | + | + | + | + | |
| BY4-2 | - | - | - | - | - | - |
| XZ1-5 | + | + | + | + | + | |
| TM1-5 | + | + | + | + | + | + |
| LMS3-4 | + | + | + | + | + | + |
| NK4-4 | + | + | + | + | + | |
| XZ1-6 | + | + | + | + | + | |
| QJ4-1 | - | - | - | - | - | - |
| SD3-2 | + | + | + | + | + | + |
| DF1-4 | + | + | + | + | + | |
| SL3-2 | + | + | + | + | + | + |
| DL2-5 | + | + | + | |||
| NF1-5 | + | + | + | + | ||
| HL3-5 | + | + | + | + | + | + |
| YL5-3 | + | + | - | - | - | + |
| HK25 | + | - | + | - | - | - |
| HZ5-5 | + | + | + | + | + | + |
| HKHQ | - | - | + | + | - | - |
| DZP1-1 | + | + | + | + | + | - |
| YZ2-1 | + | + | + | + | + | + |
| Detection rate | 84.6% | 80.8% | 69.2% | 76.9% | 50.0% | 57.7% |
Note: “+” instead of positive sample; “-” instead of negative samples.
Table 2.
Primer sequences used in LAMP for APYLaoMV.
| Primer Group | Primer Name | Primer Sequence (5′-3′) |
|---|---|---|
| APYLaoMV-P1 | P7-1-F3 | CATTACACAGACAATTGAGGAG |
| P7-1-B3 | CGCGTATTTCATTCTTTGATCC | |
| P7-1-FIP | GGTAGAATTCCCATCCCCAGTGATTACCGTTCAGGTATTCATCG | |
| P7-1-BIP | TAAACCATTCCTATTTGGAGGCTGGGTGAAATACCGGAGAGAAG | |
| APYLaoMV-P2 | P7-2-F3 | ATATCAACCCTGTAGGAAAGT |
| P7-2-B3 | CCGTTCTTGTAAATTTCTTCAAG | |
| P7-2-FIP | GACTGGAGGCGTGGGTAATTATTTACAGCATTCAATGATGACT | |
| P7-2-BIP | GGACCAGAACGTGTGGGATATGAAACCATCACGGCATAC | |
| APYLaoMV-P3 | P7-3-F3 | AGGAGATTACCGTTCAGGTA |
| P7-3-B3 | TTGACGGTCATATTCGCG | |
| P7-3-FIP | CCAGCCTCCAAATAGGAATGGTTTACGCAATTGAACAAGTAATTCG | |
| P7-3-BIP | GGCTTAGATTCTTCTCTCCGGTTTAAAGCCGGTTACAGCT |
Table 3.
Primer sequences used in LAMP for APV1.
| Primer Group | Primer Name | Primer Sequence (5′-3′) |
|---|---|---|
| APV1-P1 | APV1-1-F3 | CGATACACACAACAGTTTCA |
| APV1-1-B3 | CATTCTTTGCAGCTAATCGA | |
| APV1-1-FIP | GCCTTAAGTGCATTGACCGAATTTAAGTAGATAATAGGTCTTATGATTGG | |
| APV1-1-BIP | CAACGTGTTGCGAAGGTATGGCCTGATGGTACATAATTAATCTCA | |
| APV1-P2 | APV1-2-F3 | AGATTAATTATGTACCATCAGGTC |
| APV1-2-B3 | TGCACAATTGTTTTACCCAT | |
| APV1-2-FIP | CGACGGAGTGAAATCTGTGATATTTGATTAGCTGCAAAGAATGGATC | |
| APV1-2-BIP | TTCTCTACTGCAGAAGAACAAAGTTCCACTTTTCGTGATCGCATA | |
| APV1-P3 | APV1-3-F3 | AGGAGATTACCGTTCAGGTA |
| APV1-3-B3 | CGAATTTATATAATCCCAAAGAGCT | |
| APV1-3-FIP | GCTCAGAAATGGAAATGCATAATGAAAATGAATTGTCAACTAAGATGTGG | |
| APV1-3-BIP | ATGGACGTCGAAAACTAACGCTTTGAGTCCAATCATAAGACCTA |
Table 4.
Primer sequences used in LAMP for APYLaoMV.
| Primer Group | Primer Name | Primer Sequence (5′-3′) |
|---|---|---|
| APLTV1-P1 | APLTV1-1-F3 | GGCGATCTAAATTGCGATT |
| APLTV1-1-B3 | GCGTTACATACTGTTTAATTGC | |
| APLTV1-1-FIP | CTAGCCACGCATCTAAATTAGGAATTTCTCTACACCAAAATTAGTAGAGG | |
| APLTV1-1-BIP | CAGAGCCAGTACCAGGTGAGCCAGCAAATATCAGAAGTAGG | |
| APLTV1-P2 | APLTV1-2-F3 | GGCATGTTTGACTGGTCTA |
| APLTV1-2-B3 | ATTCGCATAAATATAAACCCCT | |
| APLTV1-2-FIP | TCCATCTCCGATGTGTATAGATCTTGCTATTCGTAGTATACGAAAGG | |
| APLTV1-2-BIP | CAAACGAGTAATTTCTATTCAGCCGATACCAGGTAATGGGACTTCA | |
| APLTV1-P3 | APLTV1-3-F3 | CCGAAGACTTATCTTACCCAA |
| APLTV1-3-B3 | ATCATAGCGTCAGCTCGA | |
| APLTV1-3-FIP | CCTGATTCTGAGTCATACCTCTCAGATATTTAAGTGAGAGTGTACCTACC | |
| APLTV1-3-BIP | AGGTTCACGTTACTTATGCTAGCTATCCTCTACTAATTTTGGTGTAG |
Disclaimer/Publisher’s Note: The statements, opinions and data contained in all publications are solely those of the individual author(s) and contributor(s) and not of MDPI and/or the editor(s). MDPI and/or the editor(s) disclaim responsibility for any injury to people or property resulting from any ideas, methods, instructions or products referred to in the content. |
© 2026 by the authors. Licensee MDPI, Basel, Switzerland. This article is an open access article distributed under the terms and conditions of the Creative Commons Attribution (CC BY) license (http://creativecommons.org/licenses/by/4.0/).
Copyright: This open access article is published under a Creative Commons CC BY 4.0 license, which permit the free download, distribution, and reuse, provided that the author and preprint are cited in any reuse.