
Submitted:
26 August 2026
Posted:
26 August 2026
You are already at the latest version
Abstract
Dependency distance is a key measure of syntactic complexity and processing constraints, but as a scalar cannot capture how information is distributed between a head and dependent. We analyze dependency spans—the endpoints and intervening words—as position-aligned units. Interveners lie outside the binary dependency but constitute its sequential processing context. Using Universal Dependencies treebanks and XGLM-2.9B, we estimated word-level surprisal for distances 4–10 across 22 languages, yielding 154 mean curves. Dynamic time warping and clustering identified an approximately monotonic decline and a nonmonotonic contour with an initial decline, stable middle, and final rise. Membership was stable across distances in 20 languages; Russian had three Type 1 and four Type 2 curves, whereas German had six Type 1 and one Type 2 curve. Segmented models favored three stages for both types, differing mainly in the final stage. Principal component analyses revealed a more dispersed latent structure in the middle stage and concentration around fewer variables at the edges. The final-stage contrast was associated with dependency direction and verb roles. Dependency-span analysis thus complements dependency syntax with a position-sensitive account of linear realization, revealing cross-linguistic information patterns that dependency length alone cannot recover.
Keywords:
dependency distance
; surprisal
; information distribution
; dynamic time warping
; cross-linguistic variation
1. Introduction
In dependency grammar, syntactic structure is organized through dependency relations between words. A syntactic dependency is typically represented as an asymmetric binary relation between a head and a dependent, and the difference between their positions in the linear sequence is referred to as dependency distance [1]. Dependency distance provides a concise measure of how far apart two directly related words occur and has been widely used in cross-linguistic comparisons of syntactic structure and in research on linguistic complexity [2,3,4]. Previous research has established a close relationship between dependency distance and syntactic processing demands: longer dependencies generally require comprehenders to maintain more unresolved structural information in working memory. The widespread tendency toward dependency length minimization in natural language has therefore often been interpreted as evidence that linguistic structure adapts to constraints on cognitive resources [5,6,7].
Dependency distance is, however, fundamentally a measure of length. Formally, it reduces the head, the dependent, and the complete linear interval between them to a single distance value, thereby providing a scalar representation of how a dependency unfolds in the linear sequence. Linear intervals containing different lexical items, part-of-speech sequences, and local dependency configurations may have the same dependency distance. Dependency distance thus constitutes a many-to-one mapping: it indicates how far apart two syntactically related items occur but does not preserve the specific sequential composition of the interval between them. Previous studies have recognized the limitations of measuring dependency length solely by the number of intervening words and have incorporated the syntactic properties of the intervening material. In particular, the Intervener Complexity Measure supplements conventional dependency length by quantifying the number of syntactic heads in the intervening region [8,9]. Because dependency distance is frequently used to discuss syntactic processing and cognitive load, it remains important to ask whether length alone adequately characterizes the linear realization of a dependency.
This question can be approached through the contextual predictability of individual words. The probability of a word depends on the preceding context. Psycholinguistic evidence shows that syntactic and semantic information jointly supports the prediction of upcoming words [10], while lexical surprisal, defined in terms of conditional probability, is a robust predictor of reading time [11]. Recent work has also directly linked dependency length to surprisal. Xu and Futrell [12] found that, in most of the languages they examined, the surprisal of the linearly first endpoint of a dependency was positively correlated with dependency length. This result suggests that a less predictable antecedent may receive a more robust memory representation and may consequently support a longer dependency. More recently, Jin and Liu [13] examined the association between dependency distance and surprisal across 34 languages. Their preprint reports that the association varies with dependency direction and relation type: positive associations are more consistent in head-final dependencies, weaker and more variable in head-initial dependencies, and stronger for content dependencies than for functional dependencies. Together, these findings indicate that the linear length of a dependency and the contextual predictability of its component words are not independent, but may reflect a systematic coupling between memory-related and prediction-related demands. They also leave a more fine-grained question open: if the complete interval between a head and its dependent is aligned by relative position, how does surprisal unfold across all the words in that interval, and do stable cross-linguistic distributional patterns emerge?
From an information-theoretic perspective, the surprisal of a word given its preceding context provides a measure of contextual predictability [14,15]. Surprisal has been consistently associated with reading times, eye movements, and neurocognitive measures and is therefore widely used as an index of incremental processing difficulty in language comprehension [16,17,18,19,20]. Previous studies have further shown that information is not distributed uniformly across the linear positions of a sentence: sentence-initial, medial, and final positions may display systematic differences [21,22]. Although the precise information contour of an individual sentence depends on its semantic content and lexical choices, averaging across many observations may therefore reveal relatively stable positional regularities.
Analyses based on whole sentences cannot, however, determine directly whether such regularities are associated with syntactic structure. Most existing studies use absolute sentence position as their reference frame, even though words at the same sentence position may have different syntactic roles and instances of the same dependency relation may occur at different positions. Sentence-based positional analyses consequently have difficulty separating general effects of linear position from syntactically conditioned effects. The present study instead uses the two endpoints of each dependency as structural anchors and aligns the continuous interval between them. This makes it possible to test whether surprisal varies systematically with relative position within a dependency span. The central question is whether the surprisal values across a span merely reflect an accidental aggregation of local lexical properties or form reproducible distributional patterns when many dependencies are considered together.
Answering this question has two main implications. First, it extends the analysis of dependency relations from endpoint distance to the way information unfolds between the endpoints. Second, a cross-linguistic comparison can reveal both the stability of this organization and the sources of its variation. Languages may share a basic framework for the linear distribution of information while producing different contours because of differences in head direction, part-of-speech composition, and structural roles.
We therefore adopt the dependency span as the unit of analysis. A dependency span is defined here as the continuous interval comprising a directly related head and dependent together with every word occurring between them in the linear sequence. Our concern is not whether every individual span follows a fixed trajectory, but whether stable information-distribution patterns emerge after large numbers of comparable spans have been aligned by relative position and statistically averaged.
Using a large pretrained language model, we estimate word-level surprisal and calculate mean surprisal at each position in dependency spans with dependency distances from 4 to 10 in 22 languages. We first test whether the resulting contours display reproducible distributional patterns. We then use clustering and segmented analysis to characterize their overall shapes and internal organization and compare similarities and differences across languages and dependency distances. Finally, on the basis of the principal patterns identified in these analyses, we examine lexical and syntactic variables that may be associated with them.
The study addresses three research questions:
- Does mean surprisal exhibit stable distributional patterns within dependency spans, and are these patterns consistent across dependency distances and languages?
- If stable distributional patterns exist, what structural properties characterize them, and what similarities and differences occur across languages?
- Which lexical and syntactic factors may be associated with the shared properties and cross-linguistic differences in the information distributions of dependency spans?
By addressing these questions, this study evaluates whether the interval defined by a dependency relation provides a structural reference frame for information distribution that differs from absolute sentence position. It further investigates whether the region traversed by a dependency exhibits statistically organized information patterns and how these patterns relate to syntactic structure, thereby establishing a closer connection between research on dependency distance and information-theoretic approaches to language.
2. Materials and Methods
2.1. Corpus Data
The syntactic data were obtained from version 2.14 of the Universal Dependencies (UD) treebanks [23]. The set of languages was determined jointly by the availability of UD treebanks and the pretraining coverage of XGLM [24], because all surprisal values were subsequently estimated with XGLM-2.9B. Candidate languages therefore had to meet two criteria: they had to be included in the pretraining data of XGLM and have at least one usable treebank in UD v2.14. When multiple UD treebanks were available for a language, all eligible treebanks were combined, and corpus size was calculated from the resulting number of sentences and word tokens.
All treebanks were downloaded from the UD website (https://universaldependencies.org). They provide annotated dependency structures together with word forms, parts of speech, and dependency relations. Table 1 reports the corpus sizes for the 22 languages.
2.2. Surprisal Estimation
We use surprisal to quantify the conditional predictability of a word in its preceding context. For the word at position in a sentence, surprisal is defined as the negative logarithm of its conditional probability given the preceding sequence:
In information-theoretic terms, lower surprisal corresponds to a higher conditional probability and hence to greater model-estimated contextual predictability [14,15,25]. In this study, probabilities are estimated by the multilingual autoregressive language model XGLM from distributions learned during pretraining. The resulting surprisal values primarily represent model-level contextual predictability; they should not be equated directly with human linguistic knowledge, the inherent information value of a word, or real-time human processing load.
Model-derived surprisal is nevertheless relevant to human processing. Previous studies have shown that language-model surprisal explains part of the variation in reading times and eye-movement measures during naturalistic reading, and the relationship between surprisal and reading time has been tested across multiple languages [19,20,26]. These findings provide external-validity evidence for using model surprisal as an estimate of contextual predictability. At the same time, the correspondence is incomplete and model-dependent: lower perplexity or a larger model does not necessarily produce surprisal estimates that better predict human reading behavior, and knowledge acquired from massive training corpora may exceed the experience available to an average human reader [27]. We therefore treat XGLM surprisal as a computational approximation of contextual predictability and restrict our conclusions accordingly. Its relationship to human online processing must ultimately be evaluated with behavioral and neurocognitive data.
Word-level surprisal was estimated with XGLM-2.9B [24], a decoder-only causal Transformer that assigns a conditional probability to the current token on the basis of the preceding token sequence. Its left-to-right objective is therefore directly compatible with the definition in Equation (1). When a word was segmented into multiple subword tokens, the surprisal values of its subwords were summed to obtain word-level surprisal. XGLM was selected both because its autoregressive objective matches the required measure and because it was pretrained under a common architecture on data from 30 languages, allowing the languages in the present study to be analyzed without introducing methodological differences from separate monolingual models. Our sample was drawn from the intersection of the languages covered by XGLM pretraining and those represented by usable UD v2.14 treebanks, thereby limiting additional uncertainty from out-of-coverage inference.
2.3. Data Filtering
To reduce the influence of nonlinguistic material on dependency-distance and surprisal estimates, we excluded spans containing any token whose Universal Part-of-Speech tag was PUNCT, SYM, or X. A dependency span was retained only when its head, dependent, and all intervening tokens fell outside these three categories. We excluded the entire span rather than deleting individual tokens and reindexing the remainder, because the latter procedure would shift token positions and break the correspondence between relative positions, part-of-speech distributions, and mean surprisal.
We then retained only dependencies with distances from 4 to 10. Dependency distance was calculated as the absolute difference between the sentence indices of the head and dependent, . The lower bound was set to 4 because shorter spans contain too few positional observations to support an analysis of internal information distributions and stage structure. The upper bound was set to 10 because the number of dependencies decreases rapidly as distance increases, leaving insufficient observations for stable estimates at greater distances. Cross-linguistic research has repeatedly shown that natural languages favor shorter dependencies [2,28,29,30,31,32,33]. In our data, dependencies of length 10 or less accounted for more than 95% of all dependencies in every language. The range from 4 to 10 thus provides enough internal positions for analysis while preserving adequate cross-linguistic sample sizes and stable estimates.
2.4. Principal Component Analysis
Principal component analysis (PCA) [34] was used to reduce the dimensionality of a set of linguistic variables that might be associated with information distribution inside dependency spans. The selection and standardization of these variables and the criterion used to retain principal components are described in Section 3.3.
3. Results
3.1. Basic Information-Distribution Patterns and Cluster Identification
To characterize the distribution of information within dependency spans, we calculated mean surprisal at each relative position for each of the 22 languages and each dependency distance from 4 to 10. Every language contributed one information-distribution curve at each of the seven distances, yielding 154 curves in total. Because curves associated with different dependency distances contained different numbers of positional observations, we used dynamic time warping (DTW) [35] to quantify pairwise differences in curve shape and clustered the curves on the basis of the resulting distance matrix. To select the number of clusters, we compared solutions with through using the silhouette coefficient [36]. The results are reported in Table 2.
The silhouette coefficient was highest for (0.4161) and was lower for every solution with more clusters. A two-cluster solution therefore provided the best balance of within-cluster cohesion and between-cluster separation in the present data and was adopted for the subsequent analyses. The value of 0.4161 nevertheless indicates only moderate separation. The two clusters should accordingly be interpreted as broad summaries of the principal differences in curve shape rather than as completely discrete categories.
The solution assigned 65 curves to Type 1 and 89 curves to Type 2, corresponding to 42.2% and 57.8% of the full set, respectively. Both types thus accounted for substantial proportions of the data, which indicates that neither resulted from a small number of anomalous curves. Figure 1 presents their representative DTW-aligned mean contours.
Type 1 curves show an approximately monotonic decline. Mean surprisal is comparatively high at the beginning of the span and then decreases progressively across the linear sequence. Curves within this type differ in their rate of decline and degree of local fluctuation, but their overall downward direction is relatively consistent.
Type 2 curves display a nonmonotonic pattern. Mean surprisal typically drops sharply near the beginning of the span, enters a comparatively stable interval, and then rises or fluctuates locally near the end. Their most distinctive feature relative to Type 1 is therefore the reversal in the direction of change at the end of the span.
Cluster membership was highly stable across dependency distances. Of the 22 languages, 20 were assigned to the same curve type at every distance from 4 to 10. Eight languages had all seven curves assigned to Type 1, and 12 had all seven assigned to Type 2. Only Russian and German displayed mixed membership. Three of the seven Russian curves were assigned to Type 1 and four to Type 2, whereas six of the seven German curves were assigned to Type 1 and one to Type 2. Table 3 summarizes these patterns; complete language-by-distance assignments are provided in Appendix A.
Both types therefore accounted for substantial numbers of curves, and most languages retained the same membership across dependency distances. The two patterns cannot be attributed solely to individual languages, particular distances, or a small set of outliers; rather, they represent two recurrent shapes in the information distributions of dependency spans. Both types also show changes in slope across relative position, suggesting that they may contain a further stage structure. The following section evaluates this possibility with segmented models and breakpoint estimation.
3.2. Segmented Structure and Statistical Validation
The clustering analysis revealed visually apparent changes across the course of both curve types. Curve shape alone, however, is insufficient to determine whether those changes constitute a stable stage structure. We therefore compared segmented linear models to test whether the two curve types could be characterized by a common number of stages.
Before fitting the models, we specified a reasonable upper bound on their complexity. Adding segments generally improves fit, but excessive segmentation reduces interpretability and makes it difficult to define a common comparison framework across curves of different lengths. We limited the maximum to three segments for two reasons. First, curves for a given language were generally assigned to the same type across dependency distances, suggesting that spans of different lengths follow the same or a closely related organization. A common segmentation scheme is therefore preferable to distance-specific numbers of segments. Second, the shortest curves, representing dependency distance 4, contain only five sampled relative positions. A model with four or more segments would leave only one or two observations per segment, preventing stable estimation of segment slopes and severely limiting interpretation. Three segments thus constitute the largest defensible model at the resolution of the present data.
We fitted one-, two-, and three-segment linear models and compared them with the Bayesian information criterion (BIC) [37]. As shown in Table 4, the three-segment model produced the lowest BIC for both curve types and clearly outperformed the one- and two-segment alternatives. Both types can therefore be represented more adequately as three continuous stages than as a uniform trend or a simple two-stage pattern.
After selecting the three-segment model, we estimated the two breakpoints and the slope of each segment. The results are shown in Figure 2 and Table 5.
The two curve types have broadly comparable stage boundaries but differ markedly in how surprisal changes within the stages. During Stage 1, surprisal decreases in both types, with a substantially steeper decline in Type 2. In Stage 2, the slopes of both types approach zero and the change in surprisal becomes much more gradual. The two types diverge in Stage 3: Type 1 continues to decline, whereas Type 2 changes from a negative to a positive slope. This final-stage reversal constitutes the principal morphological distinction between the two curve types.
To determine whether the type-level mean curves adequately represented their members, we mapped the estimated breakpoints onto every individual curve and calculated the consistency of slope direction within each segment. Table 6 reports the resulting counts.
Within-type consistency was high. All Type 1 curves had negative slopes in Stages 1 and 2, and more than 95% continued to decline during Stage 3. Type 2 curves likewise showed high agreement, with the great majority displaying an increase during Stage 3. The three-stage structure is therefore not merely an artifact of averaging but captures shared patterns across the member curves. In summary, both types can be divided reliably into three continuous stages with broadly similar boundaries, while their principal difference lies in the direction of change during the final stage.
3.3. Latent Variable Structure Across Stages
The preceding analyses showed a stable three-stage organization and localized the principal cross-linguistic difference to Stage 3. We next used the three stages as the units of analysis to identify latent linguistic dimensions associated with changes in surprisal and to compare the two final-stage patterns.
The PCA input consisted of linguistic variables measured at each relative position within the dependency spans. These included word-length measures (mean word length, standard deviation of word length, mean content-word length, and mean function-word length) and proportional measures (the proportion of content words and the proportion of each part of speech). The complete set is listed in Appendix B. Before analysis, we removed sparse variables that showed insufficient variation because low-frequency categories such as INTJ were zero at most observations. We retained proportional and mean-value variables but excluded raw counts, which are jointly affected by sample size and language-specific structure and therefore provide less stable indicators for cross-linguistic comparison.
To remove differences in overall surprisal levels and variable ranges across languages, every variable was standardized within language using a score:
Here, and denote the language-specific mean and standard deviation of the relevant variable. All subsequent PCA calculations used these standardized values.
Rather than pooling the entire dataset in a single PCA, we performed separate analyses at the level of curve type by stage. Curves were first assigned to Type 1 or Type 2 on the basis of the DTW clustering results and then divided into three stages using the breakpoint locations estimated for the corresponding type-level prototype. This procedure yielded six analysis units: Type 1 × Stages 1–3 and Type 2 × Stages 1–3. PCA was conducted separately within each unit. Components were retained until cumulative explained variance reached at least 80%, providing a common criterion across units while preserving most of the information in the original variables.
Table 7 summarizes the results. Between four and nine principal components were required to exceed 80% cumulative explained variance, indicating that the reduced representations preserved most of the original variation. The number of retained components nevertheless varied substantially across stages. The Stage 2 units for Types 1 and 2 required nine and eight components, respectively, whereas each of the other four units required only four or five. The variable structure of Stage 2 is consequently more dispersed and appears to reflect a larger number of latent dimensions than that of Stages 1 and 3.
The proportion of variance explained by PC1 reinforces this difference. For Type 1, PC1 accounted for 32.57%, 18.03%, and 48.79% of the variance in Stages 1, 2, and 3, respectively; the corresponding values for Type 2 were 45.25%, 30.62%, and 56.56%. For both types, PC1 explained the smallest share in Stage 2 and the largest share in Stage 3. Information change in the initial and final stages can therefore be described to a greater extent by a small set of dominant variables, whereas the middle stage requires a more distributed set of latent factors.
To identify the latent dimension most closely associated with mean surprisal, we calculated Spearman correlations between each retained component and mean surprisal in every analysis unit. PC1 showed the strongest absolute correlation in all six units and was therefore selected as the primary target for linguistic interpretation. The remaining components continue to represent secondary variation in the original variables; complete correlations are provided in Appendix C.

Table 8.
Spearman correlations between PC1 and mean surprisal in the six analysis units.
| Curve type | Stage 1 | Stage 2 | Stage 3 |
| Type 1 | -0.64 | 0.52 | -0.56 |
| Type 2 | 0.89 | 0.59 | 0.70 |
Across the six units, the absolute PC1–surprisal correlations ranged from 0.52 to 0.89 and exceeded those of all other retained components. Correlations involving secondary components were generally weak. With the exception of PC2 in Type 2 Stage 2 (), the absolute value of every secondary-component correlation was no greater than 0.29. Thus, although the number of retained components differs across stages, PC1 is consistently the latent dimension most closely associated with changes in surprisal.
The stages therefore differ not only in their surprisal contours but also in their latent variable structure. Stage 2 requires more components to reach the 80% threshold and assigns a smaller proportion of total variance to PC1, indicating a comparatively dispersed structure. Stages 1 and 3 require fewer components and have higher PC1 shares, indicating more concentrated dominant dimensions. Importantly, even in the more dispersed middle stage, PC1 remains the component most strongly associated with mean surprisal. We therefore examine its variable composition in the following section.
3.4. Composition of PC1 and Cross-Stage Comparison
For each of the six analysis units, we extracted the ten variables with the largest absolute loadings on PC1 and counted how often each variable occurred in these top-ten sets. Full PC1 loadings are provided in Appendices D and E. Table 9 lists the six variables that occurred most frequently.
Both content_ratio and VERB_ratio appeared among the ten largest loadings in all six analysis units. The variables avg_word_length, DET_ratio, AUX_ratio, and ADP_ratio each appeared in five units, whereas no other variable appeared more than four times. Although the precise ranking of variables therefore differs across units, the recurring core is relatively concentrated. It comprises the proportions of content words and verbs, mean word length, and the proportions of three function-word categories: determiners, auxiliaries, and adpositions.
To compare how these six variables relate to surprisal across stages, we calculated their Spearman correlations with mean surprisal. Complete values are reported in Appendix F and summarized in Figure 3.
Type 1 Stage 1, Type 2 Stage 1, and Type 2 Stage 3 exhibit a relatively clear shared pattern. The content-word ratio, verb ratio, and mean word length are generally positively correlated with surprisal, whereas the determiner, adposition, and auxiliary ratios are generally negatively correlated. In most stages, higher proportions of content words, longer words, and more verbs are therefore associated with higher surprisal, whereas larger proportions of structurally oriented function words are associated with lower surprisal.
The correlation pattern is weaker and more heterogeneous in Stage 2. This mixture of directions is consistent with the dispersed variable structure observed in the PCA and suggests that change during the middle stage cannot readily be reduced to a single stable combination of variables.
Type 1 Stage 3 is markedly different. In this unit, the correlations of the content-word ratio, verb ratio, and mean word length with surprisal reverse direction, while those of the determiner, adposition, and auxiliary ratios shift from negative to positive. The largest difference between the two curve types is therefore concentrated in the final stage, whereas their initial and middle stages remain broadly similar.
To assess the cross-linguistic consistency of this reversal, we calculated language-specific correlations between the six core variables and surprisal in Type 1 Stage 3. We then compared these values with the ratio between the frequencies of dependents and heads at the beginning of a span (Dep/Head). The correlations are reported in Table 10.
Note. Values are Spearman correlation coefficients. * ; coefficients without an asterisk are not statistically significant.
The degree of cross-linguistic consistency differs across the six variables. The content-word and verb ratios are negatively correlated with surprisal in most languages, whereas the determiner and adposition ratios are usually positively correlated, and these relationships reach significance in a majority of cases. By contrast, mean word length and the auxiliary ratio vary more substantially in direction across languages. The final-stage reversal is therefore supported primarily by the first four variables and should not be interpreted as a uniform reversal of all six variables in every language.
We next tested whether the reversal in Type 1 Stage 3 was associated with dependency direction. For each language, we calculated the ratio between the frequency with which a dependent versus a head occupied the beginning of a dependency span. A ratio greater than 1 means that the left endpoint was more often a dependent and is therefore associated with a head-final tendency; a ratio below 1 indicates that the left endpoint was more often a head and is associated with a head-initial tendency. Figure 4 displays the log-transformed ratios.
All eight languages consistently assigned to Type 1 had Dep/Head ratios greater than 1. Of the 12 languages consistently assigned to Type 2, all except Japanese had ratios below 1. Russian and German, which contained both curve types, displayed mixed characteristics. Type 1 curves therefore tend to co-occur with spans that begin with a dependent and place the head toward the right endpoint. The results for Japanese, Chinese, and the mixed-membership languages nevertheless show that curve type and directionality do not stand in a strict one-to-one relationship. Complete language-specific ratios are reported in Appendix G.
Finally, to control more directly for part of speech, we selected VERB tokens in Type 1 Stage 3 and divided them into three structural roles within the current dependency span: Head, Dependent, and Internal. Figure 5 compares their surprisal distributions; language-specific means, medians, and standard deviations are provided in Appendix H.
Most languages display a relatively stable gradient: verbs functioning as heads have the lowest surprisal, span-internal verbs have the highest, and verbs functioning as dependents generally fall between the two. This pattern occurs not only in languages consistently assigned to Type 1 but also, to varying degrees, in the mixed-membership languages Russian and German.
In summary, PC1 is composed primarily of a limited set of recurring linguistic variables across stages, but these variables operate differently in the final stage. Cross-linguistic comparisons and the analysis controlling for verbal part of speech both localize the principal difference to Type 1 Stage 3, while Stages 1 and 2 remain comparatively similar across curve types. The following discussion considers the linguistic mechanisms and typological implications of these stage-specific patterns.
4. Discussion
4.1. The Three-Stage Pattern of Information Distribution
The clustering and segmented analyses identify a relatively stable three-stage structure in both curve types. Surprisal decreases during Stage 1, changes more gradually during Stage 2, and diverges during Stage 3: Type 1 continues to decline, whereas Type 2 turns upward. The two types thus share a comparable stage framework and differ primarily in the magnitude of change and, most notably, in the direction of the final stage.
The PCA results further show that the underlying variable structure differs across stages. Stages 1 and 3 require fewer principal components to reach 80% cumulative explained variance and assign a relatively large share of variance to PC1. Stage 2 requires more components, and PC1 explains a smaller share. Covariation among the measured variables is therefore more concentrated at the beginning and end of the span and more dispersed in the middle.
During Stage 1, the content-word ratio, verb ratio, and mean word length are generally positively correlated with surprisal, whereas the determiner, adposition, and auxiliary ratios are generally negatively correlated. This pattern is consistent with a span beginning that contains a relatively high concentration of information-rich content words, followed by an increase in function-word proportions. By contrast, the flatter contour of Stage 2 is accompanied by weaker and less consistent correlations. No single variable dominates this stage, and its relative stability may arise from the combined variation of multiple lexical and syntactic features.
4.2. Final-Stage Divergence and Dependency Directionality
Stage 3 contains the largest difference between the two curve types. In Type 2, the content-word ratio, verb ratio, and mean word length remain positively correlated with surprisal, while the determiner, adposition, and auxiliary ratios remain negatively correlated, and surprisal rises toward the endpoint. The final stage of Type 2 therefore preserves the usual association between lexical informativeness and lower predictability: a larger share of content-bearing material tends to coincide with greater prediction difficulty.
Type 1 Stage 3 shows a different pattern. The curve continues to decline, the content-word and verb ratios are generally negatively correlated with surprisal, and the determiner and adposition ratios are generally positively correlated; mean word length and the auxiliary ratio vary more substantially across languages. This pattern occurs most often in languages with a strong tendency toward head-final dependencies. One possible explanation is that, in head-final structures, preverbal or pre-head material supplies accumulating cues that strengthen expectations for the upcoming head, thereby increasing its conditional probability and reducing its surprisal. Research on Japanese indicates that comprehenders maintain expectations for a later syntactic head before it appears [38], while work on German verb-final structures shows that additional preverbal constituents can facilitate the subsequent verb under certain conditions [39,40]. Expectation-based facilitation is not limited to head-final structures, however, because antilocality effects can also occur in nonargument–verb dependencies [41]. Head-finality should therefore not be treated as a necessary condition for predictive facilitation, but as one structural configuration in which its effect may become concentrated near the end of a dependency span.
All eight languages consistently assigned to Type 1 had a Dep/Head ratio above 1 at span onset, indicating an overall tendency for the head to occur toward the right endpoint. This pattern is compatible with the hypothesis that preceding material progressively constrains a later head. The weak reversal in Chinese and the mixed pattern in German nevertheless show that dependency direction is one contributor to final-stage shape rather than a sufficient explanation.
4.3. Verb Role and Predictive Constraint
To determine whether the low surprisal in Type 1 Stage 3 could be attributed solely to part-of-speech composition, we held part of speech constant and compared VERB tokens functioning as heads, dependents, or span-internal elements. Verbs were selected because they carry substantial semantic content and frequently serve as dependency heads, making them suitable for testing structural-role differences while controlling lexical category.
The results generally show the lowest surprisal for heads, the highest for internal verbs, and intermediate values for dependents. Even within a single part of speech, information uncertainty therefore varies with a token’s structural role in the current dependency span. An internal verb does not close the focal dependency; when it occurs, the structure is still unfolding and the space of possible continuations remains comparatively open. A head verb, by contrast, often provides the governing center for preceding dependents and integrates structural constraints that have accumulated across the span, making it more predictable. Although a dependent occupies an endpoint, it generally does not govern the preceding structure and therefore tends to fall between the other two roles.
The continuing decline of Type 1 curves during Stage 3 cannot consequently be explained by lexical informativeness alone. It is also associated with the progressive accumulation of predictive constraints within dependency structure.
4.4. Implications and Limitations
The results show that a dependency span has not only a length but also a position-sensitive information profile. Dependency distance indicates how far apart two syntactically related words occur, whereas the three-stage contours reveal how information unfolds across that interval. Dependency-span analysis therefore provides a more direct bridge between dependency-distance research and information-theoretic approaches to language.
At the same time, the patterns reported here emerge from statistical averages across large numbers of spans and do not imply that every individual span follows the same trajectory. The maximum complexity of the segmented model was constrained by the fact that the shortest curves contained only five positions. Exceptions also remain in the relationship between dependency directionality and final-stage shape. Future work should control more finely for dependency-relation type, morphological marking, and word-order flexibility and should combine corpus-derived contours with reading-time, eye-tracking, or neurocognitive evidence to determine whether these statistical patterns have a corresponding processing basis.
5. Conclusions
This study used dependency spans as its unit of analysis and examined the distribution of information across their linear positions at dependency distances from 4 to 10. The analysis combined dependency treebanks from 22 languages with word surprisal estimated by XGLM. Instead of representing a dependency only through its endpoints and their distance, we included the complete interval between them and asked whether the traversed region displays a stable organization of information in the aggregate.
The information distributions within dependency spans exhibit a robust three-stage organization. Although the cross-linguistic contours cluster into two principal types, both types share a similar stage framework and broadly comparable boundaries. They are therefore better understood as distinct realizations of a common stage structure than as wholly independent organizational mechanisms. Descriptively, Stage 1 is characterized by rapid adjustment in surprisal, Stage 2 by relative maintenance, and Stage 3 by either continued decline or terminal reorganization. These labels should be treated as functional hypotheses derived from the observed contours rather than as directly demonstrated processing mechanisms.
The PCA results show that the three stages have different latent variable structures. PC1 explains a relatively large share of the variance in Stages 1 and 3, where changes are concentrated in a smaller set of core variables. Stage 2 requires more retained components and has the lowest PC1 share, indicating a more strongly distributed contribution from multiple factors. The content-word, verb, determiner, auxiliary, and adposition ratios, together with mean word length, recur as core variables across stages. Information organization within dependency spans is therefore associated with the relationship between lexical informativeness and the structural functions of syntactic categories.
Type 1 Stage 3 displays a distinctive reversal in correlation direction: the typically positive correlations of the content-word and verb ratios with surprisal become negative, while the determiner and adposition ratios become positive. Cross-linguistic comparison indicates that this reversal occurs mainly in languages with high Dep/Head ratios at span onset and a strong tendency toward head-final dependencies. The verb-role analysis further shows that most languages have the lowest surprisal for heads, the highest for span-internal verbs, and intermediate values for dependents. Low final-stage surprisal is therefore difficult to explain through part-of-speech composition alone. A plausible account is that, as the internal context of a span unfolds, constraints on the conditional probability of a later head accumulate and make the endpoint increasingly predictable. This interpretation is compatible with expectation-based incremental processing [15] but requires direct behavioral and neurocognitive testing.
Overall, the interval traversed by a dependency relation is not merely a linear gap connecting a head and its dependent; in the aggregate, it exhibits stable patterns of information organization. Dependency distance reveals how far apart syntactically related words occur, while dependency-span analysis additionally reveals how information unfolds within that distance. These findings extend the analytical scope of dependency-distance research and provide new cross-linguistic evidence concerning the relationship between dependency structure and information distribution. Future research can evaluate the cognitive mechanisms behind the three-stage pattern by integrating corpus analysis with reading experiments, eye movements, and neurocognitive measures.
Author Contributions
X.K. and S.Y. conceived and designed the study. X.K. collected the dataset, implemented the computational pipeline, performed the data processing and experiments, and drafted the initial manuscript. S.Y. supervised the research, refined the methodology, provided domain-specific critical revisions, and finalized the manuscript. All authors have read and agreed to the published version of the manuscript.
Funding
This research received no external funding.
Institutional Review Board Statement
.
Data Availability Statement
Publicly available datasets were analyzed in this study. The raw UD treebank data can be accessed directly from the Universal Dependencies project. All custom datasets, processed corpora, and analysis scripts developed during this study are openly available on OSF at https://osf.io/qf8h9/files/osfstorage.
Conflicts of Interest
The authors declare no conflicts of interest.
Appendix A. Cluster Assignments Across Dependency Distances 4–10
Table A1.
Number of information-distribution curves assigned to each type by language.
| Language | Type 1 () | Type 2 () |
| Urdu | 7/7 | 0/7 |
| Russian | 3/7 | 4/7 |
| Bulgarian | 0/7 | 7/7 |
| Catalan | 0/7 | 7/7 |
| Hindi | 7/7 | 0/7 |
| Indonesian | 0/7 | 7/7 |
| Turkish | 7/7 | 0/7 |
| Basque | 7/7 | 0/7 |
| Greek | 0/7 | 7/7 |
| German | 6/7 | 1/7 |
| Italian | 0/7 | 7/7 |
| Japanese | 0/7 | 7/7 |
| Chinese | 7/7 | 0/7 |
| French | 0/7 | 7/7 |
| Estonian | 7/7 | 0/7 |
| Finnish | 7/7 | 0/7 |
| English | 0/7 | 7/7 |
| Portuguese | 0/7 | 7/7 |
| Spanish | 0/7 | 7/7 |
| Vietnamese | 0/7 | 7/7 |
| Arabic | 0/7 | 7/7 |
| Korean | 7/7 | 0/7 |
Note. Each language contributed seven curves, one for each dependency distance from 4 to 10. The entries indicate how many of the seven curves were assigned to each type.
Appendix B. Variables Included in the Principal Component Analyses
Table A2.
PCA variables.
| Variable class | Variable |
| Word-length measure | avg_word_length |
| std_word_length | |
| content_avg_word_length | |
| function_avg_word_length | |
| Proportional measure | content_ratio |
| ADJ_ratio | |
| ADP_ratio | |
| ADV_ratio | |
| AUX_ratio | |
| CCONJ_ratio | |
| DET_ratio | |
| NOUN_ratio | |
| NUM_ratio | |
| PART_ratio | |
| PRON_ratio | |
| PROPN_ratio | |
| SCONJ_ratio | |
| VERB_ratio |
Appendix C. Correlations Between Retained Principal Components and Mean Surprisal
Table A3.
Spearman correlations between retained principal components and mean surprisal by curve type and stage.
Table A3.
Spearman correlations between retained principal components and mean surprisal by curve type and stage.
| Curve type | Stage | Principal component | Spearman |
| Type 1 | 1 | PC1 | -0.64 |
| PC2 | 0.13 | ||
| PC3 | 0.07 | ||
| PC4 | -0.04 | ||
| PC5 | 0.11 | ||
| Type 1 | 2 | PC1 | 0.52 |
| PC2 | 0.13 | ||
| PC3 | 0.07 | ||
| PC4 | -0.08 | ||
| PC5 | -0.23 | ||
| PC6 | -0.07 | ||
| PC7 | -0.19 | ||
| PC8 | 0.29 | ||
| PC9 | -0.11 | ||
| Type 1 | 3 | PC1 | -0.56 |
| PC2 | 0.19 | ||
| PC3 | 0.11 | ||
| PC4 | 0.03 | ||
| PC5 | -0.19 | ||
| Type 2 | 1 | PC1 | 0.89 |
| PC2 | -0.21 | ||
| PC3 | -0.02 | ||
| PC4 | 0.07 | ||
| PC5 | 0.04 | ||
| Type 2 | 2 | PC1 | 0.59 |
| PC2 | -0.42 | ||
| PC3 | -0.11 | ||
| PC4 | 0.19 | ||
| PC5 | 0.09 | ||
| PC6 | -0.02 | ||
| PC7 | -0.06 | ||
| PC8 | 0.09 | ||
| Type 2 | 3 | PC1 | 0.70 |
| PC2 | -0.24 | ||
| PC3 | 0.18 | ||
| PC4 | -0.11 |
Note. Values displayed as 0.00 in the source results denote absolute values smaller than 0.01.
Appendix D. Variables with the Ten Largest Absolute PC1 Loadings
Table A4.
Top-ten PC1 loadings by curve type and stage.
| Curve type | Stage | Variable | Loading |
| 1 | 1 | DET_ratio | 0.369794 |
| 1 | 1 | ADP_ratio | 0.339799 |
| 1 | 1 | ADJ_ratio | 0.329325 |
| 1 | 1 | NUM_ratio | 0.295931 |
| 1 | 1 | content_ratio | -0.294190 |
| 1 | 1 | avg_word_length | -0.291540 |
| 1 | 1 | VERB_ratio | -0.288540 |
| 1 | 1 | AUX_ratio | 0.268658 |
| 1 | 1 | SCONJ_ratio | -0.247250 |
| 1 | 1 | PART_ratio | 0.234966 |
| 1 | 2 | avg_word_length | 0.489001 |
| 1 | 2 | content_avg_word_length | 0.368746 |
| 1 | 2 | PROPN_ratio | 0.343171 |
| 1 | 2 | std_word_length | 0.341602 |
| 1 | 2 | function_avg_word_length | 0.266573 |
| 1 | 2 | NUM_ratio | 0.238438 |
| 1 | 2 | PRON_ratio | 0.218517 |
| 1 | 2 | AUX_ratio | -0.197400 |
| 1 | 2 | content_ratio | 0.193839 |
| 1 | 2 | VERB_ratio | -0.185940 |
| 1 | 3 | VERB_ratio | 0.330397 |
| 1 | 3 | content_ratio | 0.324925 |
| 1 | 3 | ADV_ratio | -0.296850 |
| 1 | 3 | NUM_ratio | -0.293090 |
| 1 | 3 | ADP_ratio | -0.286640 |
| 1 | 3 | DET_ratio | -0.277930 |
| 1 | 3 | PRON_ratio | -0.273970 |
| 1 | 3 | AUX_ratio | -0.262220 |
| 1 | 3 | std_word_length | -0.255380 |
| 1 | 3 | ADJ_ratio | -0.232610 |
| 2 | 1 | content_ratio | 0.349698 |
| 2 | 1 | avg_word_length | 0.349149 |
| 2 | 1 | ADP_ratio | -0.345950 |
| 2 | 1 | VERB_ratio | 0.326221 |
| 2 | 1 | DET_ratio | -0.319530 |
| 2 | 1 | NOUN_ratio | 0.314822 |
| 2 | 1 | function_avg_word_length | 0.292765 |
| 2 | 1 | ADJ_ratio | -0.239570 |
| 2 | 1 | std_word_length | 0.229094 |
| 2 | 1 | ADV_ratio | -0.195580 |
| 2 | 2 | content_ratio | 0.400754 |
| 2 | 2 | avg_word_length | 0.377134 |
| 2 | 2 | NOUN_ratio | 0.370967 |
| 2 | 2 | std_word_length | 0.355466 |
| 2 | 2 | AUX_ratio | -0.314880 |
| 2 | 2 | content_avg_word_length | 0.267327 |
| 2 | 2 | ADV_ratio | -0.263720 |
| 2 | 2 | VERB_ratio | 0.210949 |
| 2 | 2 | PRON_ratio | -0.203050 |
| 2 | 2 | ADP_ratio | -0.199030 |
| 2 | 3 | content_ratio | 0.334185 |
| 2 | 3 | avg_word_length | 0.331597 |
| 2 | 3 | AUX_ratio | -0.318900 |
| 2 | 3 | DET_ratio | -0.312570 |
| 2 | 3 | VERB_ratio | 0.310657 |
| 2 | 3 | ADV_ratio | -0.303150 |
| 2 | 3 | PRON_ratio | -0.300560 |
| 2 | 3 | NOUN_ratio | 0.277917 |
| 2 | 3 | ADP_ratio | -0.246500 |
| 2 | 3 | content_avg_word_length | 0.242033 |
Appendix E. Frequency of Variables Among the Top-Ten PC1 Loadings
Table A5.
Number of occurrences by variable.
| Variable | Occurrences |
| VERB_ratio | 6 |
| content_ratio | 6 |
| DET_ratio | 5 |
| avg_word_length | 5 |
| AUX_ratio | 5 |
| ADP_ratio | 5 |
| std_word_length | 4 |
| PRON_ratio | 4 |
| ADV_ratio | 4 |
| NUM_ratio | 3 |
| NOUN_ratio | 3 |
| ADJ_ratio | 3 |
| function_avg_word_length | 2 |
| SCONJ_ratio | 1 |
| PROPN_ratio | 1 |
| PART_ratio | 1 |
| content_avg_word_length | 1 |
Appendix F. Correlations of the Six Most Frequent PC1 Variables with Surprisal
Table A6.
Spearman correlations by curve type and stage.
| Curve type | Stage | Variable | Spearman |
| 1 | 1 | ADP_ratio | -0.63 |
| 1 | 1 | avg_word_length | 0.62 |
| 1 | 1 | DET_ratio | -0.60 |
| 1 | 1 | content_ratio | 0.56 |
| 1 | 1 | VERB_ratio | 0.54 |
| 1 | 1 | AUX_ratio | -0.46 |
| 1 | 2 | avg_word_length | 0.37 |
| 1 | 2 | DET_ratio | 0.30 |
| 1 | 2 | ADP_ratio | -0.24 |
| 1 | 2 | VERB_ratio | -0.15 |
| 1 | 2 | content_ratio | 0.15 |
| 1 | 2 | AUX_ratio | 0.03 |
| 1 | 3 | VERB_ratio | -0.58 |
| 1 | 3 | DET_ratio | 0.56 |
| 1 | 3 | ADP_ratio | 0.56 |
| 1 | 3 | content_ratio | -0.40 |
| 1 | 3 | AUX_ratio | 0.32 |
| 1 | 3 | avg_word_length | -0.09 |
| 2 | 1 | avg_word_length | 0.87 |
| 2 | 1 | content_ratio | 0.86 |
| 2 | 1 | ADP_ratio | -0.84 |
| 2 | 1 | VERB_ratio | 0.83 |
| 2 | 1 | DET_ratio | -0.77 |
| 2 | 1 | AUX_ratio | -0.34 |
| 2 | 2 | avg_word_length | 0.56 |
| 2 | 2 | content_ratio | 0.55 |
| 2 | 2 | AUX_ratio | -0.47 |
| 2 | 2 | ADP_ratio | -0.40 |
| 2 | 2 | VERB_ratio | 0.38 |
| 2 | 2 | DET_ratio | 0.23 |
| 2 | 3 | ADP_ratio | -0.75 |
| 2 | 3 | avg_word_length | 0.71 |
| 2 | 3 | content_ratio | 0.70 |
| 2 | 3 | DET_ratio | -0.69 |
| 2 | 3 | AUX_ratio | -0.64 |
| 2 | 3 | VERB_ratio | 0.62 |
Appendix G. Dep/Head Ratios at Span Onset
Table A7.
Language-specific Dep/Head ratios.
| Language | Curve type | Dep/Head ratio |
| Urdu | 1 | 6.235294 |
| Russian | 1/2 | 1.220810 |
| Bulgarian | 2 | 0.856053 |
| Catalan | 2 | 0.456809 |
| Hindi | 1 | 7.874581 |
| Indonesian | 2 | 0.496526 |
| Turkish | 1 | 9.092060 |
| Basque | 1 | 1.937330 |
| Greek | 2 | 0.472080 |
| German | 1/2 | 2.268246 |
| Italian | 2 | 0.497732 |
| Japanese | 2 | 5.508409 |
| Chinese | 1 | 2.047877 |
| French | 2 | 0.485538 |
| Estonian | 1 | 1.305268 |
| Finnish | 1 | 1.057139 |
| English | 2 | 0.599356 |
| Portuguese | 2 | 0.508779 |
| Spanish | 2 | 0.425067 |
| Vietnamese | 2 | 0.853178 |
| Arabic | 2 | 0.192935 |
| Korean | 1 | 9.145104 |
Appendix H. Surprisal of Verbs by Structural Role in Type 1 Stage 3
Table A8.
Language-specific descriptive statistics for verbs functioning as dependents, heads, or span-internal tokens.
Table A8.
Language-specific descriptive statistics for verbs functioning as dependents, heads, or span-internal tokens.
| Language | Role | Mean | Median | SD |
| Urdu | Dependent | 3.942812 | 2.31835 | 5.275481 |
| Urdu | Head | 3.677830 | 2.15230 | 4.988733 |
| Urdu | Internal | 4.437271 | 3.41800 | 3.834541 |
| Russian | Dependent | 9.253487 | 8.81250 | 4.965416 |
| Russian | Head | 8.416138 | 7.89060 | 5.041735 |
| Russian | Internal | 11.415670 | 11.03910 | 6.505292 |
| Hindi | Dependent | 3.228153 | 2.06050 | 3.408229 |
| Hindi | Head | 2.922260 | 1.83590 | 3.135426 |
| Hindi | Internal | 4.580265 | 3.85060 | 3.703645 |
| Turkish | Dependent | 8.762692 | 7.71480 | 6.635300 |
| Turkish | Head | 9.032972 | 8.03910 | 5.987770 |
| Turkish | Internal | 10.417000 | 9.41410 | 6.561027 |
| Basque | Dependent | 7.577669 | 6.68555 | 5.335429 |
| Basque | Head | 7.040064 | 6.27730 | 4.900072 |
| Basque | Internal | 9.987586 | 9.05860 | 6.066148 |
| German | Dependent | 6.339810 | 5.72270 | 4.780028 |
| German | Head | 5.545633 | 4.60550 | 4.622201 |
| German | Internal | 7.376872 | 6.88280 | 5.085907 |
| Chinese | Dependent | 9.266514 | 8.25780 | 5.756522 |
| Chinese | Head | 9.000419 | 8.15620 | 5.384238 |
| Chinese | Internal | 9.290173 | 8.71090 | 6.026201 |
| Estonian | Dependent | 7.756107 | 7.33200 | 5.301765 |
| Estonian | Head | 6.899522 | 6.16410 | 5.211822 |
| Estonian | Internal | 10.445930 | 9.76955 | 6.769743 |
| Finnish | Dependent | 8.912225 | 8.26250 | 5.467778 |
| Finnish | Head | 7.783794 | 7.14550 | 5.083853 |
| Finnish | Internal | 8.002450 | 6.65895 | 6.187429 |
| Korean | Dependent | 7.896049 | 6.91995 | 5.182354 |
| Korean | Head | 8.226301 | 7.19140 | 5.382332 |
| Korean | Internal | 8.732069 | 7.82810 | 5.697386 |
References
- Liu, H. Dependency distance as a metric of language comprehension difficulty. J. Cogn. Sci. 2008, 9(2), 159–191. [Google Scholar] [CrossRef]
- Futrell, R.; Mahowald, K.; Gibson, E. Large-scale evidence of dependency length minimization in 37 languages. Proc. Natl. Acad. Sci. 2015, 112(33), 10336–10341. [Google Scholar] [CrossRef] [PubMed]
- Jing, Y.; Liu, H. Mean hierarchical distance augmenting mean dependency distance. In Proceedings of the Third International Conference on Dependency Linguistics (Depling 2015), 2015; pp. 161–170. Available online: https://aclanthology.org/W15-2119/.
- Liu, H.; Xu, C.; Liang, J. Dependency distance: A new perspective on syntactic patterns in natural languages. Phys. Life Rev. 21 2017, 171–193. [Google Scholar] [CrossRef] [PubMed]
- Gibson, E. Linguistic complexity: Locality of syntactic dependencies. Cognition 1998, 68(1), 1–76. [Google Scholar] [CrossRef] [PubMed]
- Gibson, E. The dependency locality theory: A distance-based theory of linguistic complexity. In Image, language, brain; Marantz, A., Miyashita, Y., O’Neil, W., Eds.; MIT Press, 2000; pp. 95–126. [Google Scholar]
- Grodner, D.; Gibson, E. Consequences of the serial nature of linguistic input for sentential complexity. Cogn. Sci. 2005, 29(2), 261–290. [Google Scholar] [CrossRef] [PubMed]
- Yadav, H.; Mittal, S.; Husain, S. A reappraisal of dependency length minimization as a linguistic universal. Open Mind 6 2022, 147–168. [Google Scholar] [CrossRef] [PubMed]
- Dyer, A. T. Revisiting dependency length and intervener complexity minimisation on a parallel corpus in 35 languages. In Proceedings of the 5th Workshop on Research in Computational Linguistic Typology and Multilingual NLP, 2023; Association for Computational Linguistics; pp. 110–119. [Google Scholar] [CrossRef]
- Kamide, Y.; Scheepers, C.; Altmann, G. T. M. Integration of syntactic and semantic information in predictive processing: Cross-linguistic evidence from German and English. J. Psycholinguist. Res. 2003, 32(1), 37–55. [Google Scholar] [CrossRef] [PubMed]
- Monsalve, I. F.; Frank, S. L.; Vigliocco, G. Lexical surprisal as a general predictor of reading time. In Proceedings of the 13th Conference of the European Chapter of the Association for Computational Linguistics, 2012; pp. 398–408. Available online: https://aclanthology.org/E12-1041/.
- Xu, W.; Futrell, R. Syntactic dependency length shaped by strategic memory allocation. In Proceedings of the 6th Workshop on Research in Computational Linguistic Typology and Multilingual NLP, 2024; Association for Computational Linguistics; pp. 1–9. [Google Scholar] [CrossRef]
- Jin, H.; Liu, H. Memory–prediction coupling in syntactic dependencies: An investigation of the relationship between dependency distance and surprisal across 34 languages [Preprint]. SSRN 2026. [Google Scholar] [CrossRef]
- Hale, J. A probabilistic Earley parser as a psycholinguistic model. In Proceedings of the Second Meeting of the North American Chapter of the Association for Computational Linguistics, 2001; Available online: https://aclanthology.org/N01-1021/.
- Levy, R. Expectation-based syntactic comprehension. Cognition 2008, 106(3), 1126–1177. [Google Scholar] [CrossRef] [PubMed]
- Demberg, V.; Keller, F. Data from eye-tracking corpora as evidence for theories of syntactic processing complexity. Cognition 2008, 109(2), 193–210. Available online: https://psycnet.apa.org/doi/10.1016/j.cognition.2008.07.008. [PubMed]
- Frank, S. L.; Otten, L. J.; Galli, G.; Vigliocco, G. The ERP response to the amount of information conveyed by words in sentences. Brain Lang. 140 2015, 1–11. [Google Scholar] [CrossRef] [PubMed]
- Henderson, J. M.; Choi, W.; Lowder, M. W.; Ferreira, F. Language structure in the brain: A fixation-related fMRI study of syntactic surprisal in reading. NeuroImage 132 2016, 293–300. [Google Scholar] [CrossRef] [PubMed]
- Smith, N. J.; Levy, R. The effect of word predictability on reading time is logarithmic. Cognition 2013, 128(3), 302–319. [Google Scholar] [CrossRef] [PubMed]
- Wilcox, E. G.; Pimentel, T.; Meister, C.; Cotterell, R.; Levy, R. P. Testing the predictions of surprisal theory in 11 languages. Trans. Assoc. Comput. Linguist. 11 2023, 1451–1470. [Google Scholar] [CrossRef]
- Klafka, J.; Yurovsky, D. Characterizing the typical information curves of diverse languages. Entropy 2021, 23(10), 1300. [Google Scholar] [CrossRef] [PubMed]
- Yu, S.; Cong, J.; Liang, J.; Liu, H. The distribution of information content in English sentences. In arXiv; 2016; Available online: https://arxiv.org/abs/1609.07681.
- de Marneffe, M.-C.; Manning, C. D.; Nivre, J.; Zeman, D. Universal Dependencies. Comput. Linguist. 2021, 47(2), 255–308. [Google Scholar] [CrossRef]
- Lin, X. V.; Artetxe, M.; Ott, M.; Shleifer, S.; Koura, K.; Stoyanov, V.; Li, X.; Zettlemoyer, L.; Goyal, N. Few-shot learning with multilingual generative language models. In Proceedings of the 2022 Conference on Empirical Methods in Natural Language Processing, 2022; Association for Computational Linguistics; pp. 9019–9052. [Google Scholar] [CrossRef]
- Shannon, C. E. A mathematical theory of communication. Bell Syst. Tech. J. 1948, 27(3), 379–423. [Google Scholar] [CrossRef]
- Goodkind, A.; Bicknell, K. Predictive power of word surprisal for reading times is a linear function of language model quality. In Proceedings of the 8th Workshop on Cognitive Modeling and Computational Linguistics, 2018; pp. 10–18. [Google Scholar] [CrossRef]
- Oh, B.-D.; Schuler, W. Why does surprisal from larger Transformer-based language models provide a poorer fit to human reading times? Trans. Assoc. Comput. Linguist. 11 2023, 336–350. [Google Scholar] [CrossRef]
- Chen, X.; Gerdes, K. The relation between dependency distance and frequency. In Proceedings of the First Workshop on Quantitative Syntax (Quasy, SyntaxFest 2019), 2019; Association for Computational Linguistics; pp. 75–82. [Google Scholar] [CrossRef]
- Ferrer-i-Cancho, R. Euclidean distance between syntactically linked words. Phys. Rev. E 2004, 70(5), 056135. [Google Scholar] [CrossRef] [PubMed]
- Liu, H. Probability distribution of dependency distance. Glottometrics 15 2007, 1–12. Available online: https://www.semanticscholar.org/paper/Probability-distribution-of-dependency-distance-Liu/eb5f82d8735672ac110c694189ca88596cefd079.
- Liu, H. Probability distribution of dependencies based on a Chinese dependency treebank. J. Quant. Linguist. 2009, 16(3), 256–273. [Google Scholar] [CrossRef]
- Lu, Q.; Liu, H. Does dependency distance distribute regularly? J. Zhejiang Univ. (Humanities and Social Sciences) 2016, 46(4), 65–76. [Google Scholar] [CrossRef]
- Petrini, S.; Ferrer-i-Cancho, R. The distribution of syntactic dependency distances. Glottometrics 58 2025, 35–94. [Google Scholar] [CrossRef]
- Jolliffe, I. T.; Cadima, J. Principal component analysis: A review and recent developments. Philos. Trans. R. Soc. A Math. Phys. Eng. Sci. 2016, 374(2065), 20150202. [Google Scholar] [CrossRef] [PubMed]
- Sakoe, H.; Chiba, S. Dynamic programming algorithm optimization for spoken word recognition. IEEE Trans. Acoust. Speech Signal Process. 1978, 26(1), 43–49. [Google Scholar] [CrossRef]
- Rousseeuw, P. J. Silhouettes: A graphical aid to the interpretation and validation of cluster analysis. J. Comput. Appl. Math. 20 1987, 53–65. [Google Scholar] [CrossRef]
- Schwarz, G. Estimating the dimension of a model. Ann. Stat. 1978, 6(2), 461–464. [Google Scholar] [CrossRef]
- Nakatani, K.; Gibson, E. Distinguishing theories of syntactic expectation cost in sentence comprehension: Evidence from Japanese. Linguistics 2008, 46(1), 63–86. [Google Scholar] [CrossRef]
- Konieczny, L. Locality and parsing complexity. J. Psycholinguist. Res. 2000, 29(6), 627–645. [Google Scholar] [CrossRef] [PubMed]
- Levy, R. P.; Keller, F. Expectation and locality effects in German verb-final structures. J. Mem. Lang. 2013, 68(2), 199–222. [Google Scholar] [CrossRef] [PubMed]
- Schwab, J.; Xiang, M.; Liu, M. Antilocality effect without head-final dependencies. J. Exp. Psychol. Learn. Mem. Cogn. 2022, 48(3), 446–463. [Google Scholar] [CrossRef] [PubMed]
Figure 1.
DTW-aligned mean information-distribution curves for Type 1 () and Type 2 ().
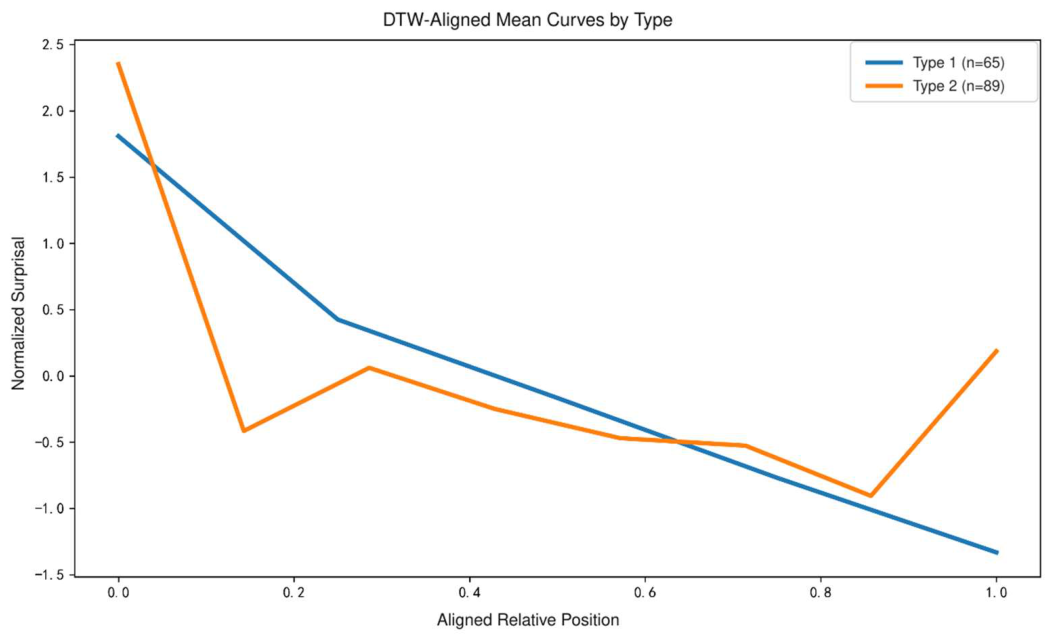
Figure 2.
Breakpoint projection and three-segment fits for (a) Type 1 and (b) Type 2 curves. Thin lines represent individual aligned curves; thick lines represent the type-level aligned mean and segmented fit.
Figure 2.
Breakpoint projection and three-segment fits for (a) Type 1 and (b) Type 2 curves. Thin lines represent individual aligned curves; thick lines represent the type-level aligned mean and segmented fit.
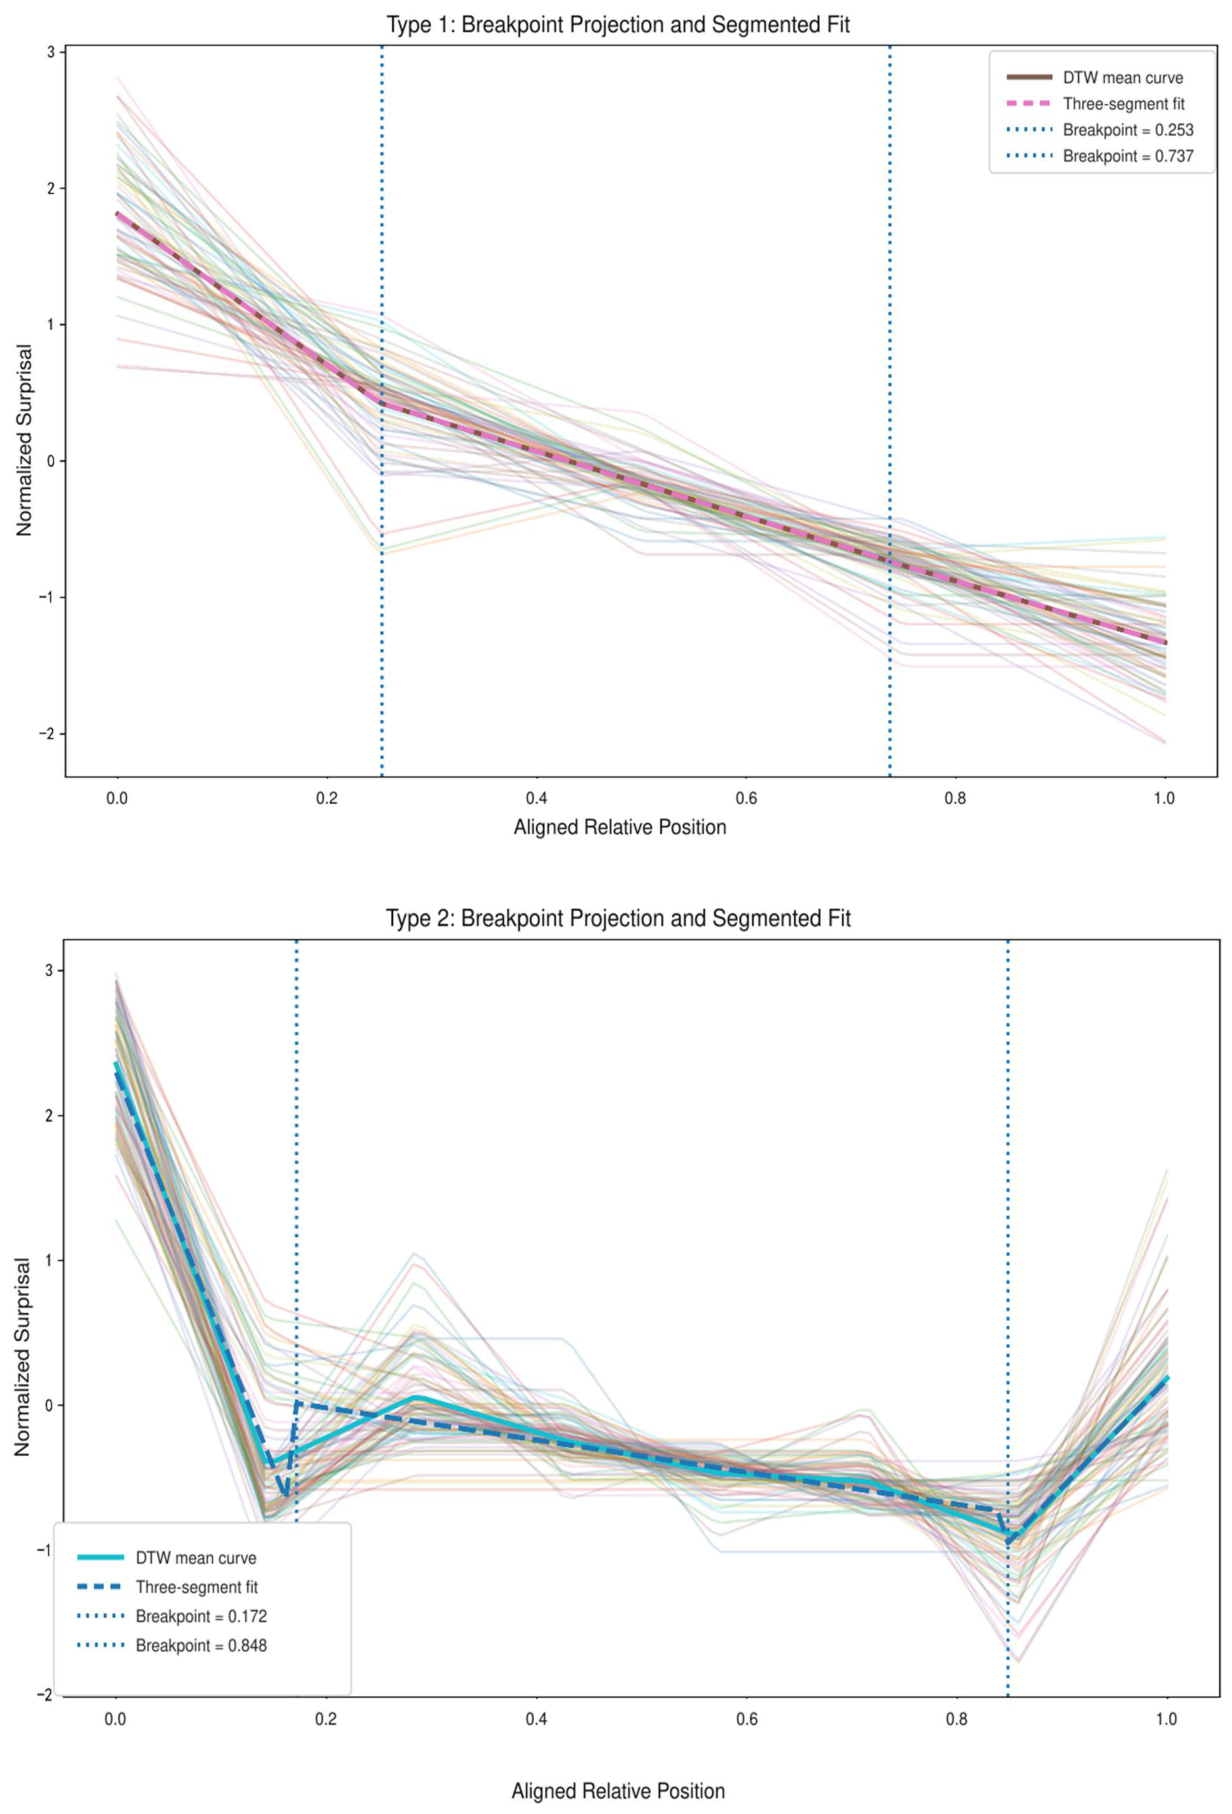
Figure 3.
Changes in the Spearman correlations between six core variables and mean surprisal across stages. Solid lines with circular markers represent Type 1; dashed lines with square markers represent Type 2.
Figure 3.
Changes in the Spearman correlations between six core variables and mean surprisal across stages. Solid lines with circular markers represent Type 1; dashed lines with square markers represent Type 2.
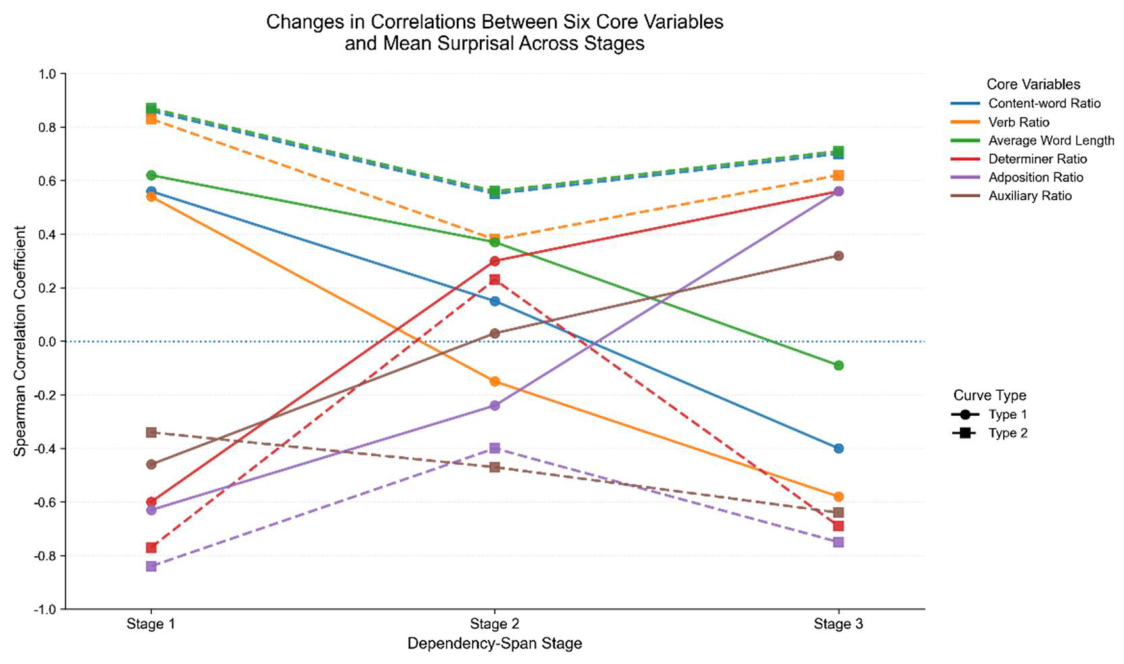
Figure 4.
Dep/Head ratios at the beginning of dependency spans across curve types. Values are plotted on a base-2 logarithmic scale.
Figure 4.
Dep/Head ratios at the beginning of dependency spans across curve types. Values are plotted on a base-2 logarithmic scale.
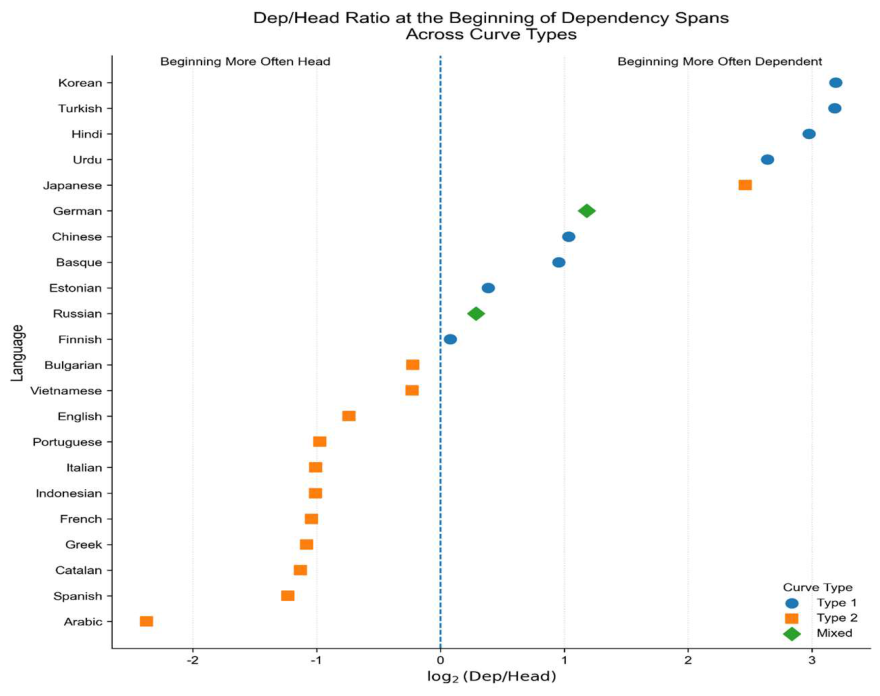
Figure 5.
Mean surprisal differences among verbs serving as heads, dependents, or span-internal tokens in Type 1 Stage 3. Each point is expressed relative to the corresponding mean for heads.
Figure 5.
Mean surprisal differences among verbs serving as heads, dependents, or span-internal tokens in Type 1 Stage 3. Each point is expressed relative to the corresponding mean for heads.
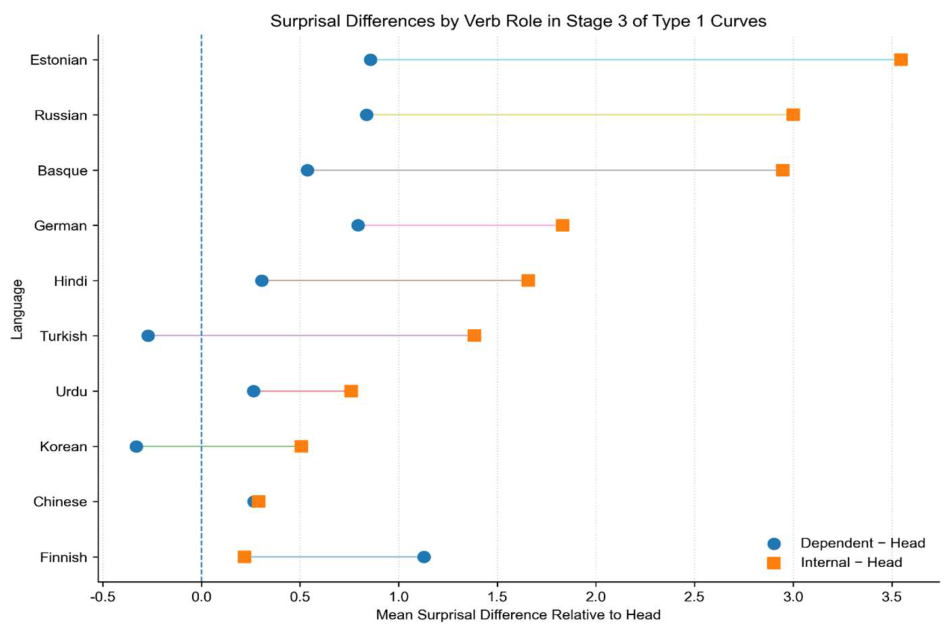
Table 1.
Summary statistics of the UD treebanks.
| Language family | Language | Tokens | Sentences |
| Indo-European (Germanic) | German | 3,810,131 | 208,438 |
| English | 742,304 | 46,310 | |
| Indo-European (Romance) | Catalan | 547,261 | 16,678 |
| Portuguese | 1,464,445 | 78,141 | |
| Spanish | 1,023,080 | 35,214 | |
| French | 635,081 | 29,735 | |
| Italian | 879,629 | 37,871 | |
| Indo-European (Slavic) | Russian | 1,830,033 | 111,238 |
| Bulgarian | 156,149 | 11,138 | |
| Indo-European (Indo-Aryan) | Urdu | 138,077 | 5,130 |
| Hindi | 351,704 | 16,649 | |
| Indo-European (Hellenic) | Greek | 88,934 | 4,328 |
| Uralic (Finnic) | Finnish | 396,999 | 36,981 |
| Estonian | — | — | |
| Turkic | Turkish | 681,936 | 64,673 |
| Sino-Tibetan (Sinitic) | Chinese | 186,619 | 9,947 |
| Austronesian | Indonesian | 169,728 | 7,628 |
| Austroasiatic | Vietnamese | 59,957 | 3,423 |
| Afro-Asiatic (Semitic) | Arabic | 303,131 | 8,664 |
| Language isolate | Basque | 121,443 | 8,993 |
| Japonic | Japanese | 222,442 | 9,100 |
| Koreanic | Korean | 446,996 | 34,702 |
Table 2.
Silhouette coefficients for different numbers of clusters.
| Number of clusters | 2 | 3 | 4 | 5 | 6 |
| Silhouette coefficient | 0.4161 | 0.3648 | 0.3384 | 0.3130 | 0.3314 |
Table 3.
Summary of cross-distance cluster-membership patterns.
| Membership pattern | Languages | Type 1 curves | Type 2 curves |
| Consistently Type 1 | 8 | 56 | 0 |
| Consistently Type 2 | 12 | 0 | 84 |
| Mixed | 2 | 9 | 5 |
| Total | 22 | 65 | 89 |
Note. Each language contributed seven curves, corresponding to dependency distances 4–10. Russian and German had mixed membership.
Table 4.
Comparison of segmented models for the two curve types.
| Curve type | Segments | RSS | BIC |
| Type 1 | 1 | 2.34 | -366.26 |
| 2 | 0.003 | -1031.54 | |
| 3 | 0.0001 | -1338.18 | |
| Type 2 | 1 | 22.74 | -138.90 |
| 2 | 4.24 | -292.94 | |
| 3 | 0.76 | -450.99 |
Table 5.
Breakpoints and segment slopes for the two curve types.
| Curve type | Breakpoint 1 | Breakpoint 2 | Stage 1 slope | Stage 1 SD | Stage 2 slope | Stage 2 SD | Stage 3 slope | Stage 3 SD |
| Type 1 | 0.253 | 0.737 | -5.54 | 2.69 | -2.38 | 0.74 | -2.26 | 1.35 |
| Type 2 | 0.172 | 0.848 | -18.22 | 3.39 | -1.11 | 0.52 | 7.45 | 3.94 |
Table 6.
Numbers of individual curves whose segment slopes match the type-level model.
| Curve type | Total curves | Stage 1 matches | Stage 2 matches | Stage 3 matches |
| Type 1 | 65 | 65 | 65 | 62 |
| Type 2 | 89 | 89 | 87 | 88 |
Table 7.
Explained variance in the six type-by-stage PCA units.
| Curve type | Stage | Retained PCs | Cumulative explained variance | Variance explained by PC1 |
| Type 1 | 1 | 5 | 0.806 | 0.326 |
| Type 1 | 2 | 9 | 0.836 | 0.180 |
| Type 1 | 3 | 5 | 0.822 | 0.488 |
| Type 2 | 1 | 5 | 0.858 | 0.453 |
| Type 2 | 2 | 8 | 0.842 | 0.306 |
| Type 2 | 3 | 4 | 0.854 | 0.566 |
Table 9.
Most frequent variables among the ten largest absolute PC1 loadings.
| Variable | Number of occurrences |
| content_ratio | 6 |
| VERB_ratio | 6 |
| avg_word_length | 5 |
| DET_ratio | 5 |
| AUX_ratio | 5 |
| ADP_ratio | 5 |
Table 10.
Language-specific Spearman correlations between the six core variables and surprisal in Type 1 Stage 3.
Table 10.
Language-specific Spearman correlations between the six core variables and surprisal in Type 1 Stage 3.
| Language | Content-word ratio | Verb ratio | Mean word length | Determiner ratio | Adposition ratio | Auxiliary ratio |
| Urdu | -0.84* | -0.90* | 0.51* | 0.79* | 0.87* | 0.57* |
| Hindi | -0.90* | -0.80* | 0.33* | 0.87* | 0.93* | 0.60* |
| Turkish | -0.73* | -0.71* | -0.65* | 0.62* | 0.74* | 0.43 |
| Basque | -0.69* | -0.80* | -0.15 | 0.86* | 0.79* | 0.47 |
| German | -0.41 | -0.59* | -0.40* | 0.58* | -0.31 | -0.72* |
| Chinese | 0.46 | 0.16 | 0.30 | 0.17 | -0.18 | -0.26 |
| Estonian | -0.81* | -0.85* | -0.74* | 0.87* | 0.73* | 0.71* |
| Finnish | -0.43 | -0.45 | -0.46 | 0.54* | 0.23 | 0.43 |
| Korean | -0.74* | -0.86* | -0.84* | 0.88* | 0.80* | 0.66* |
Disclaimer/Publisher’s Note: The statements, opinions and data contained in all publications are solely those of the individual author(s) and contributor(s) and not of MDPI and/or the editor(s). MDPI and/or the editor(s) disclaim responsibility for any injury to people or property resulting from any ideas, methods, instructions or products referred to in the content. |
© 2026 by the authors. Licensee MDPI, Basel, Switzerland. This article is an open access article distributed under the terms and conditions of the Creative Commons Attribution (CC BY) license (http://creativecommons.org/licenses/by/4.0/).
Copyright: This open access article is published under a Creative Commons CC BY 4.0 license, which permit the free download, distribution, and reuse, provided that the author and preprint are cited in any reuse.