
Submitted:
25 August 2026
Posted:
25 August 2026
You are already at the latest version
Abstract
Listeners often struggle in noisy environments due to increased cognitive load (listening effort). While listening effort is a multidimensional construct evaluated using different metrics, the relationship among these metrics remains underexplored when conducted at participant equivalent performance levels. The purpose was to determine the relationship between self-reported hearing difficulty and physiologic state during challenging listening tasks that may lead to more sensitive measures of performance and ultimately more effective remedial strategies. This investigation involved listening effort measures via three concurrent non-invasive physiological modalities—pupillometry, electrodermal activity, and photoplethysmography—alongside self-reported hearing abilities in 33 young adults with typical hearing (M = 20.55 years). The noise level required for 75% speech recognition threshold was determined individually (SNR75). A second speech recognition task was presented at each individual’s SNR75 while the three physiologic metrics were recorded. These measures exhibited statistically significant changes from baseline to listening and response peaks across the time domain. Despite these universal main effects, the physiological measures showed no significant cross-modal correlations, nor did they align with self-reported hearing metrics. The results confirm that while these three sensor modalities are sensitive markers of task-evoked effort, they reflect fundamentally independent physiological axes of autonomic arousal during complex speech comprehension.
Keywords:
listening effort
; pupillometry
; electrodermal activity
; photoplethysmography
; speech recognition in noise
1. Introduction
Hearing difficulty in noisy environments affects an estimated 10–15% of the population who possess clinically normal pure-tone audiograms [1,2]. Traditionally, this phenomenon—often termed hidden hearing loss—has been attributed to peripheral neuropathies such as cochlear synaptopathy or auditory nerve demyelination [3,4]. However, while animal models demonstrate these neuropathologies, the translation to human populations has yielded inconsistent physiological and behavioral results [5,6]. This suggests that purely peripheral mechanisms cannot fully account for the auditory struggles in the real-world observed in individuals with typical audiograms [7]. Therefore, traditional tests of hearing function may need revision with consideration of how functional hearing is conceptualized and measured.
Standard clinical assessments of behavioral hearing, which primarily rely on threshold audibility or speech-in-noise intelligibility scores, fail to capture the active neural mechanics of real-world communication [8,9]. Individuals with subclinical auditory deficits often rely on top-down cognitive processing and executive functioning to “fill in the blanks” of a degraded auditory signal. Consequently, they may maintain high speech intelligibility scores on standard clinical behavioral tests, effectively masking their underlying deficits. Yet, maintaining this performance comes at a high cognitive cost [10,11]. Qualitative studies emphasize that these individuals expend immense daily energy and rely on extensive coping strategies to function in noise, despite showing no measurable deficits in standardized clinical settings [12]. Therefore, investigation of listening effort, the cognitive resources actively deployed to understand speech, has emerged as a potential sensitive metric for quantifying these hidden auditory struggles.
Qi and Thibodeau [13] reported that listening effort was a significant predictor of hearing difficulty in noise s in young adults with self-reported typical hearing. The significant correlation between the scores on a digits-in-noise task and a listening effort self-report measure only emerge at a medium-difficulty (−12 dB) signal-to-noise ratio (SNR). No significant relationships were observed at easier (−9 dB) or harder (−15 dB) SNRs [14]. This finding aligns with the Framework for Understanding Effortful Listening (FUEL), which posits that cognitive resource allocation (listening effort) is a dynamic function of both task demand and listener motivation over time [15]. When a listening task is too simple, minimal cognitive resources is required; when a task is overwhelmingly difficult, listeners disengage and deploy fewer cognitive resources. Consequently, evaluation of listening effort should be conducted at a medium-difficulty level, where effort scores change linearly with task demand while minimizing the confounding effects of participant disengagement.
However, these relationships may be influenced by the specific methodologies employed. The digits-in-noise test primarily reflects basic auditory sensitivity rather than higher level cognitive processing required with sentence recognition [16]. While the digits test is useful for rapid screening due to its constrained test materials, this simplicity limits its ability to capture the broader cognitive function experienced by listeners in realistic situations. Therefore, more linguistically complex measures of speech-in-noise abilities should be considered when evaluating listening effort associated with speech comprehension.
Furthermore, listening effort is recognized as a multi-dimensional construct, reflecting different components of task demand, autonomic arousal, and resource allocation [17,18]. Table 1 summarizes the main subjective, behavioral and physiological listening effort measures together with their major advantages and limitations. Self-reported listening effort measures (i.e., questionnaires) often reflect a listener’s subjective frustration rather than objective physiological load [19]. Objective physiological measures of listening effort include pupillometry, electrodermal activity (EDA), and heart rate (HR). Pupillometry (gaze), driven by the locus coeruleus-norepinephrine system, primarily reflects instantaneous cognitive load and momentary task demand [20]. In contrast, EDA (i.e., skin conductance) mainly reflects sympathetic nervous system arousal, which is sensitive to the sustained emotional or stress-related dimensions of processing acoustic challenge [21]. Concurrently, HR, which is modulated by both sympathetic and parasympathetic pathways, offers broader insights into sustained attention, systemic fatigue, and overall physiological state [21]. Due to this multi-dimensional nature of listening effort, it is necessary to employ a multimodal approach considering the distinct neurophysiological pathways governing autonomic arousal.
To address these limitations and increase our understanding of the multidimensional nature of listening effort, this study was designed to include a continuous multi-modal framework to evaluate pupillary, electrodermal (EDA), and cardiovascular/hearing rate (HR) responses during complex speech comprehension under controlled, individualized recognition difficulty. Specifically, participants completed the tasks at an individualized medium task difficulty level of 75% sentence recognition. The primary research question was to determine how these concurrent physiological signals transition from baseline states to stimulus-driven peaks elicited by the individual events (listening to sentences in noise or verbal repeating the sentences). We hypothesized that listening effort elicits a robust, multidimensional autonomic arousal, where significant baseline-to-peak deviations are universally observable elicited by different events, yet the temporal sustainment and latency of these peaks are distinctly governed by the underlying measurement modality.
2. Methods
Participants
Thirty-three participants (ages 18–24; M = 20.55, SD = 1.72; 20 female, 12 male) from a previous larger online study that included 321 participants were recruited to participate. They all had self-reported normal bilateral hearing, hearing within normal limits bilaterally determined through an online hearing screening, began learning English before age six, and reported no history of neurological or psychological disorders. The research protocol, consent, and experimental measures were approved by the Institutional Review Board at the University of Texas at Dallas.
General Procedures
Following the hearing screening conducted in a sound booth, the participants completed an adaptive speech-in-noise task to establish the signal-to-noise ratio required to achieve 75% sentence recognition accuracy (SNR75). At this SNR75 level, the participant’s listening effort was recorded by eye-tracker, Galvanic skin response (GSR), and photoplethysmography while engaging in the sentence recognition task.
Measures
Hearing screening
All participants completed pure-tone audiometry using a Grason-Stadler AudioStar Pro audiometer across 0.25–16 kHz, with TDH-39 headphones in a sound booth. As shown in Figure 1, thirty-one participants presented with clinically typical hearing (pure-tone thresholds ≤ 25 dB HL at octave frequencies from 0.25 to 8 kHz bilaterally), and two individuals exhibited a mild elevation (30 dB HL) at 8 kHz in the left ear. These two participants were retained in the analysis, considering this elevation was only present at a single high frequency in one ear and the present study focused on within-subject listening-effort measures.
SNR75
The 75% speech reception threshold (SNR75) was estimated using a Bayesian adaptive procedure [28] implemented in Python (version 3.9.19) via the PsychoPy package (version 2024.2.5). Twenty root-mean-square (RMS) normalized sentences (hearing-in-noise; HINT sentences lists 1&2) [29] were mixed with the multi-talker babble noise and presented in the free field at 65 dBA as measured at the head of the participant. The stimuli were delivered via a speaker (Knowles Electronics Manikin for Acoustic Research) positioned 30 cm from the participant at 0° azimuth. The SNR was dynamically adjusted on a trial-by-trial basis by holding the overall intensity of the multi-talker babble constant at 65 dBA and modulating the RMS of the sentence until the 75% criterion was met. Details of the procedure are included in Appendix A.
Speech Recognition at SNR75
Twenty sentences were presented in multi-talker babble (HINT sentences of lists 7&8) with the SNR set to the participant’s specific SNR75 dB level. The sentence accuracy was scored based on recognition at the word-level instead of the whole sentence accuracy used for SNR75.
Detailed procedures for each trial (total = 20) are presented in Figure 2.
To balance the need for physiological recovery with the prevention of cognitive fatigue and vigilance decrement, a continuous trial paradigm was employed. Each trial was set to last 12 s. Following the stimulus presentation and retention phases, there was a 5 s verbal response window. Behavioral observations indicated that most participants completed their verbal responses within the first 2 to 3 s. The remaining 2 to 3 s of silence served as an implicit inter-trial interval to maintain continuous ecological engagement and minimize fatigue. All participants finished all trials in about 5 m.
Specifically, each of the 20 trials began with a 0.5 s 1000 Hz alert tone, followed by 3.5 s of babble noise and a 2 s target sentence that started 1 s after the noise onset. The baseline used in this study is the 0.5 s window right after the onset of the continuous babble to isolate the listening effort allocated to sentence processing from the abrupt auditory change elicited by the noise onset [30]. The listening phase (4.5 s window) is determined from the start of the sentence and the 2 s silent retention period. Following the retention period, another 0.5 s 1000 Hz tone prompted a 5 s recording window (response phase) for the participant to verbally repeat the sentence. Throughout this entire sequence, both devices continuously recorded and timestamped physiological responses across all testing steps, capturing GSR metrics alongside detailed pupil data (i.e., left and right pupil size, validity) for subsequent analysis. Data were transmitted and recorded via hardware connection in Python.
Listening effort: Pupillometry
Participants sat in front of the eye-tracker and were required to focus on the middle of the screen with eyes open and remain still after calibration till the end of the test. Using the Tobii Pro Eye Tracker Manager (v2.7.4) to connect the Tobii Pro Spectrum and Python, a 5-point calibration (four corners and the center) was initiated before the test. After the participant successfully passed the calibration, the biosensors (Tobii Pro Spectrum and Shimmer3 GSR+) were initialized.
Listening effort: Electrodermal activity and heart rate
Electrodermal activity (EDA: Galvanic skin response) and photoplethysmography (PPG: heart rate) were recorded simultaneously with the eye tracker at a sampling rate of 128 Hz using a Shimmer3 GSR+ wireless sensor unit (Shimmer Research). Two reusable Ag/AgCl electrodes were secured to the medial phalanges of the index and middle fingers of the left hand, while a PPG clip was attached to a separate digit to measure blood volume pulse and minimize localized motion artifacts. Data were transmitted and recorded via Bluetooth in Python.
Self-reported hearing: The 15-item Speech, Spatial, and Qualities of Hearing Scale (15iSSQ)
The 15iSSQ [31] was completed during the previous six months as part of the larger online study. The 15iSSQ maintains the three-factor structure of the full form [32]: speech hearing (questions 1–5), spatial hearing (questions 6–10), and sound quality (questions 11–15). The score ranged from 0 (complete inability) to 10 (perfect ability). Average scores were calculated across the 15 questions to show the overall self-reported hearing evaluation.
Data analysis
Data analysis was conducted using Python (version 3.9.19) via the pandas, scipy, and statsmodels libraries. Data normality was evaluated using the Shapiro-Wilk test. Parametric tests (Pearson’s r, ANOVA, paired t) were used for normally distributed data, whereas non-parametric measures (Spearman’s ρ, Wilcoxon signed-rank) were used for non-normally distributed data. All reported p-values were corrected (Bonferroni, or false discovery rate) for multiple comparisons.
The designed trial duration was 12 s; however, actual trials averaged around 14 s due to hardware latency and response variability. To correct for this, all physiological and eye-tracking signals were synchronized using empirical event timestamps rather than the planned schedule, with peak latencies calculated relative to actual stage onsets. Prior to statistical analysis, raw physiological data were cleaned to remove non-physiological outliers as described in Appendix B.
3. Results
Description of the data
SNR75 and sentence accuracy
Relative to the targeted 75% sentence recognition accuracy when tested at SNR75, the actual accuracy averaged approximately 74% (SD = 0.08), with more favorable SNRs significantly correlating with increased accuracy (r = 0.39, p = 0.025). A one-sample t-test revealed no significant deviation from the 75% target (p = 0.65). This validates the experimental design, confirming that tested individualized SNR75 level successfully captured around the intended 75% accuracy level.
Physiological data
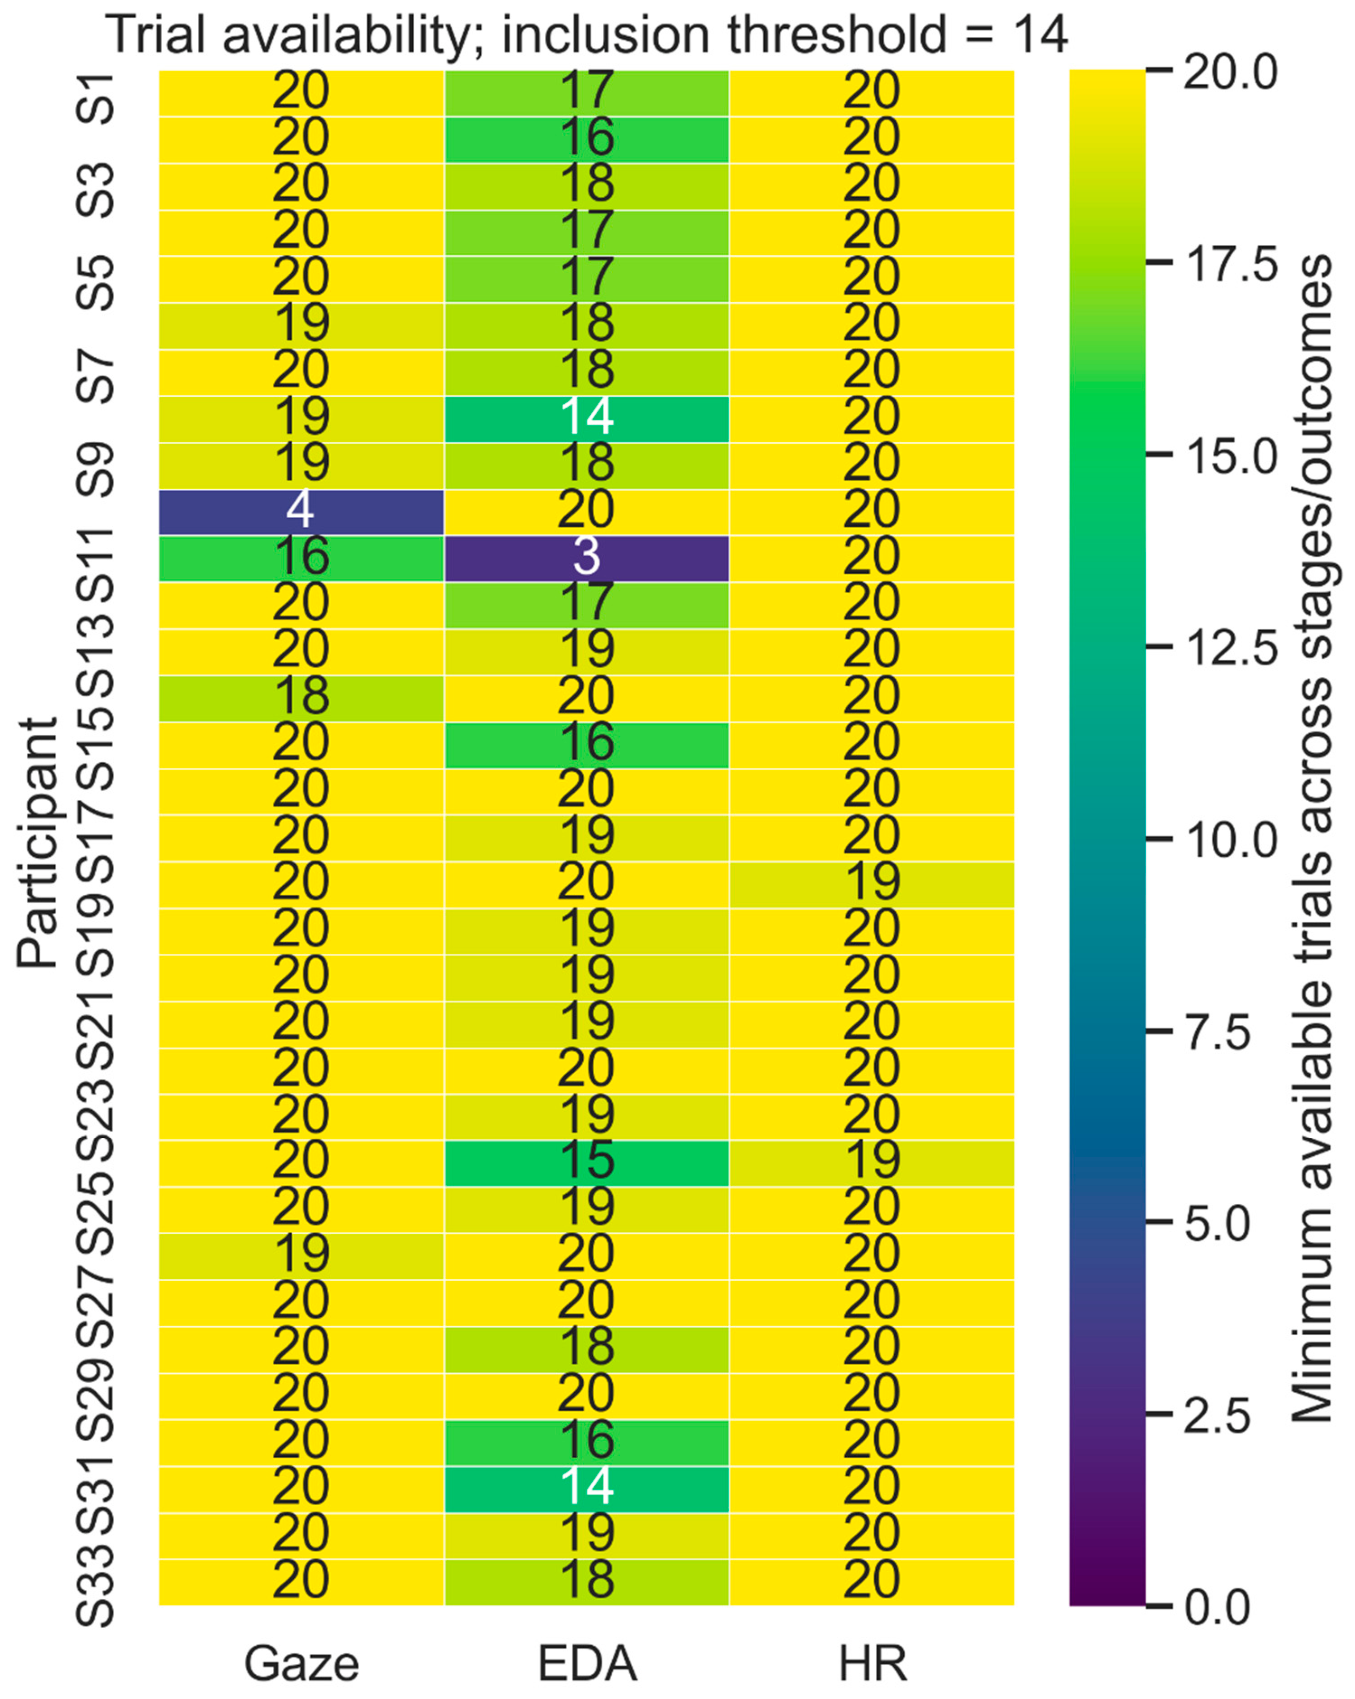
Physiological data retention was high after quality control. Only two data points (out of 33) were excluded due to excessive signal artifacts or missing data failing to meet the 14-trial threshold: one participant (S10) was excluded from all Gaze analyses (yielding only 4 valid trials), and another participant (S11) was excluded from all EDA analyses (yielding only 3 valid trials). A comprehensive heatmap detailing the exact valid trial counts for all participants across modalities is available in Appendix B Figure A2.
Figure 3 represents a single-trial multimodal recording after data preprocessing. The raw pupil diameter exhibits a continuous phasic dilation during the auditory stimulus (“Sentence playing”), followed by a rapid constriction and a secondary peak prior to the “Response” stage. Concurrently, the EDA phasic component demonstrates a slow-wave sympathetic response that gradually builds throughout the listening and retention phases, peaking during the response period. The raw PPG trace displays the continuous pulsatile waveform of the cardiac cycle.
Figure 4 illustrates the group-level distributions of three physiological responses (gaze, EDA, and HR) including the baseline and peaks during listening and response phases (n = 31). Results from Friedman rank test demonstrated significant differences across three modalities (all p < 0.001). Post-hoc analysis showed that physiological arousal was significantly elevated during both the Peak Listening and Peak Response stages compared to the Baseline condition (all p < 0.001, Bonferroni-corrected). However, no statistically significant differences were observed between the Peak Listening and Peak Response stages for any of the modalities (Gaze: p = 1.000; EDA: p = 0.718; HR: p = 0.055). These results indicate that autonomic arousal robustly increases in response to the primary auditory task demands and is sustained at a high level throughout the subsequent verbal response phase.
Comparison among three listening effort measures
Figure 5 illustrates the temporal dynamics of Gaze, EDA, and HR during the sentence recognition task averaged across all participant trials. To facilitate direct comparison across different physiological modalities, baseline-removed responses were normalized and overlaid on a common axis across the baseline through sentence playing, retention, and response stages.
The correlations were assessed among response amplitudes and latencies across the listening and response phases for gaze, EDA, and HR. No significant correlations were found among gaze, EDA, and HR metrics across any task phases (all p > 0.05), indicating that the three metrics capture distinct dimensions of cognitive and autonomic reactivity. Within all modalities, listening amplitude strongly and positively predicted response amplitude: gaze (r = 0.73), EDA (r = 0.88), and HR (r = 0.85; all p < 0.001), suggesting a stable physiological reactivity within one modality across participants. Furthermore, for HR, longer listening latency correlated with both greater listening amplitude (r = 0.63, p < 0.001) and response amplitude (r = 0.67, p < 0.001). Conversely, longer EDA listening latency negatively predicted subsequent response amplitude (r = −0.52, p < 0.05). All other temporal associations were non-significant after FDR correction.
As shown in Figure 6, significant differences were observed in listening amplitude, listening latency, and response latency among three listening effort metrics, except their response amplitude. During the auditory encoding (listening) phase, pupil reactivity was the most immediate and pronounced, yielding the highest amplitude elevation, followed by EDA (, ), and then HR (, ). EDA exhibited a significant delay relative to both Gaze ( s, ) and HR ( s, ) during listening, while HR demonstrated the most protracted latency during the response phase than both EDA ( s, ) and Gaze ( s, ).
Correlation among behavioral measures and three modalities
Associations among physiological responses and behavioral or subjective outcomes (SNR, sentence recognition accuracy, and 15iSSQ) were modality-specific, as shown in Figure 7. Specifically, faster gaze reactivity (shorter latency) during the listening phase correlated with higher SNR thresholds (r = −0.35, p < 0.05), suggesting the association between less degraded speech materials and faster response. Meantime, greater gaze amplitude during the response phase positively correlated with higher 15iSSQ (r = 0.38, p < 0.05). In contrast, EDA and HR demonstrated distinct temporal and magnitude associations with behavioral performance. Greater EDA amplitude during the listening phase correlated positively with SNR (ρ = 0.40, p < 0.05). Shorter EDA latency during the listening phase was strongly associated with higher sentence accuracy (ρ = −0.47, p < 0.01). Furthermore, higher HR during listening and response phase were both significantly positively correlated with higher sentence accuracy scores.
4. Discussion
The purpose of this study was to compare three non-invasive physiological measures of listening effort—gaze, EDA and HR—during a complex speech recognition task. By using a Bayesian adaptive procedure, the individualized speech intelligibility level was held constant at 75% performance level, effectively controlling for variations in individual task difficulty. Our analyses yielded three central findings. First, all three modalities demonstrated robust, statistically significant elevations in rank from baseline to both the listening and response stages. Second, these three metrics exhibited no cross-modal correlations, indicating that autonomic arousal during speech processing is a highly multidimensional construct. Third, the modalities demonstrated fundamentally distinct temporal dynamics and unique associations with behavioral performance and self-reported hearing abilities, underscoring their distinct value in objective effort assessment.
Divergent temporal dynamics within three modalities and their intra-modality coupling
Our results confirmed that Gaze, EDA, and HR are all sensitive markers of listening effort, indicated by significant physiological elevations in both the auditory encoding and verbal response stages (all p < 0.001) relative to baseline. This supports existing literature identifying ocular behaviors and cardiovascular metrics as sensitive markers of autonomic nervous system arousal during cognitive load [33,34]. The findings also aligns with the FUEL model [15] that effort is a sustained allocation of processing resources rather than an acute change. The persistent elevation during the response phase highlights that the cost of speech comprehension in noise extends beyond initial auditory encoding, encompassing the working memory retention and articulatory planning required for verbal execution.
The modality divergence in temporary dynamics, for example, pupil reactivity yielded fastest and highest peak during listening phase, followed by HR then EDA, suggests that these metrics capture different phases of the autonomic lifecycle. Pupillometry may reflect immediate central cognitive resource allocation, neurologically underpinned by the tight, low-latency coupling between the locus coeruleus-norepinephrine system and the pupillary dilator muscle [35]. In contrast, the significant delay observed in EDA ( s relative to Gaze) directly reflects the peripheral mechanics of the sudomotor system. EDA is driven by the sympathetic nervous system and relies on the physical accumulation of sweat in eccrine glands before changes in skin conductance can be detected at the epidermal surface [36]. Furthermore, the prolonged latency of HR during the response stage may be attributed to the dual autonomic innervation of the cardiovascular system [37]. While initial, rapid HR increases during listening may stem from vagal (parasympathetic) withdrawal, the delayed peak during the active response phase may reflect a slower, compounding sympathetic dominance driven by the metabolic and biomechanical demands of speech production (articulation).
Furthermore, the data revealed strong intra-modality temporal coupling. For all measures, the physiological amplitude during the listening stage significantly strongly and positively predicted the response amplitude (r = 0.73 to 0.88). This high internal consistency suggests that individual autonomic reactivity operates as a stable physiological trait within a trial. Individuals who recruit massive physiological resources to simply parse the acoustic signal (high listening amplitude) are constrained to maintain that hyper-aroused physiological state through the response phase. This structural coupling underscores the reliability of these physiological sensors through a sustained allocation of listening effort: excessive strain during early perceptual encoding may incur an inevitable and proportional physiological burden during subsequent cognitive-motor execution.
The multidimensionality of objective effort
Despite aiming to measure the same underlying construct of listening effort, gaze, EDA, and HR were not significantly correlated with one another at any stage of the task. This lack of inter-modality correlation suggests that these metrics do not act as redundant signals of a singular “effort” mechanism. Instead, they capture distinct, multidimensional aspects of the body’s autonomic response to cognitive demand [17]. These measures may reflect varying temporal dynamics, underlying neural pathways, or shifting balances of sympathetic (e.g., EDA, HR acceleration) and parasympathetic (e.g., HR deceleration, pupillary reflex) activation associated with continuous auditory processing, as proposed by current models of cognitive load and autonomic regulation [20,38].
Dissociation and alignment with behavioral results
The SNR threshold was positively correlated with EDA amplitude and negatively correlated with pupillary latency. Because a higher SNR75 threshold indicates poorer intrinsic speech-in-noise ability (i.e., the listener requires a more favorable acoustic environment to achieve target intelligibility), these divergent physiological associations collectively highlight a compensatory autonomic stress response. The negative correlation with gaze latency suggests that individuals with poor speech recognition abilities may mobilize their locus coeruleus-norepinephrine system more rapidly. This rapid pupillary onset might reflect a state of hyper-vigilance necessary to immediately cope with the degraded auditory signal [20]. Simultaneously, the positive correlation with EDA amplitude implies that these same individuals experience a larger magnitude of sympathetic arousal when faced with inherent task difficulty. This duality characterizes early pupillary reactivity as an index of acute attentional orienting, while characterizing overall EDA amplitude as a sensitive marker of affective arousal and task-related stress [39].
Greater pupil amplitude during the response phase significantly and positively correlated with self-reported hearing abilities (15iSSQ). This finding may be interpreted by the “Active Coping” hypothesis [40]. Participants who perceive themselves as having better hearing abilities (higher 15iSSQ scores) may possess the cognitive reserve and confidence required to remain actively engaged throughout the trial. Consequently, they commit greater cognitive resources during the verbal execution phase rather than disengaging or succumbing to fatigue, resulting in a larger response amplitude. However, the dissociation between 15iSSQ and any other modality [17,41] may also suggest that individuals be poor estimators of their own autonomic arousal, or that subjective ratings capture a different dimension of hearing experiences, such as emotional frustration, perceived fatigue, or trait anxiety, rather than the immediate, acute physiological cost of the task itself [17,40]. It highlights the necessity of utilizing both subjective and objective metrics in effort measures.
The data also revealed participants who recognized sentences better responded faster in EDA latency when listening (ρ = −0.47) and had higher HR during both the listening () and response () phases, indicating higher scores associated with higher effort levels. The association might reflect different mechanisms of EDA and HR metrics. In classical psychophysiology, a rapid sudomotor response characterizes the “Orienting Reflex”—an organism’s immediate autonomic mobilization to process novel or significant sensory information [42]. The negative correlation between accuracy and EDA latency suggests that rapid sympathetic engagement is adaptive. Participants who can trigger this acute attentional focus faster are more successful at suppressing background noise to decode the target speech. In contrast, cardiovascular data indicate that sustained autonomic engagement actively supports speech recognition. By motivational intensity theory [43], sympathetic cardiovascular reactivity is proportional to active resource mobilization, peaking when a task is demanding but achievable. The positive association between HR amplitude and accuracy therefore reflects an “active coping” mechanism: participants who dynamically mobilized greater cardiovascular output were able to sustain the cognitive effort required to successfully decode speech [44].
However, this sustained cardiac reactivity contrasts with findings by Mackersie et al. [38], who observed that typical-hearing listeners exhibited no significant changes in cardiac reactivity (HR variability) across various SNRs, despite reduced speech accuracy. The differences might be explained by the lack of control of task difficulty in the Mackersie et al. study and the use of SNR75 in the current study. When acoustic conditions become too easy or too difficult, listeners disengage or withdraw effort, leading to disassociation with autonomic arousal [15], which might cover significant changes in cardiac reactivity. The current study used an adaptive Bayesian procedure to stabilize the SNR at a 75% performance target, a medium difficulty, which might reveal their significant relationships. Further research is needed to test this hypothesis.
Limitations
Several limitations should be considered when interpreting these findings. The first is the continuous trial pacing. While the short implicit inter-trial interval of 2–3 s helped maintain participant engagement, it was not optimal for all physiological modalities due to their differing recovery times. As shown in Figure 5, although the pupillary response returns to its baseline during each trial, it seems to be insufficient for EDA or HR, causing carry-over effects and baseline drift across consecutive trials. Additionally, though necessary and fast to monitor speech accuracy, verbal responses may introduce respiratory and motor changes. The short interval may not have provided enough time for HR and breathing patterns to completely stabilize before the next trial’s baseline window. Future multimodal studies should consider longer, jittered inter-trial intervals or apply continuous deconvolution algorithms to better separate overlapping slow-wave autonomic responses.
A further limitation relates to the estimation of HR from the PPG. Although the raw PPG sensor provides a continuous vascular signal, HR calculation fundamentally relies on detecting discrete peak-to-peak intervals (i.e., individual heartbeats). Given the short total trial duration and very brief analytical windows (e.g., the 4.5 s listening and 5.0 s response), each phase captures only several cardiac cycles (See Figure 3). Interpolating continuous, instantaneous HR from such sparse discrete events inherently limits the temporal precision of the measurement. Furthermore, although portable, PPG is highly susceptible to micro-motion artifacts and changes in vascular compliance induced by facial movements during the verbal response phase, which may introduce additional noise into the absolute HR calculations.
Other limitations may include the material and participant settings. While the laboratory setting allowed for targeted accuracy control over the SNR and speech materials, it may not fully capture the dynamic, unpredictable acoustic environments and varying motivation levels individuals navigate in daily life [45]. Furthermore, the reliance on a cohort of young adults with typical hearing limits the generalizability of the results to broader populations, particularly older adults or those with clinical hearing loss, whose autonomic baseline and effort profiles may differ.
Clinical Implications and future directions
Despite these limitations, our findings have potential clinical implications. Relying solely on traditional speech recognition scores—or even subjective questionnaires—often overlooks the ‘hidden’ cognitive cost of listening, which frequently contributes to listening-related fatigue [46]. The demonstrated sensitivity and independence of pupillometry, EDA, and HR at a fixed level speech recognition accuracy suggests that multi-sensor physiological tracking could be a valuable addition to standard audiological assessments when evaluating listening effort is deemed necessary.
Future research may consider building upon these findings by investigating physiological effort across a broader continuum of varying intelligibility levels (e.g., 50% vs. 90%) to map how these distinct multidimensional measures scale with acoustic challenge. Furthermore, exploring these metrics in more ecologically valid setups, such as immersive virtual reality, and conducting longitudinal studies will be necessary to determine how these independent physiological pathways adapt following hearing device acclimatization or auditory rehabilitation.
Author Contributions
Conceptualization, S.Q. and L.T.; methodology, S.Q.; software, S.Q.; validation, S.Q. and L.T.; formal analysis, S.Q.; investigation, S.Q.; data curation, S.Q.; writing—original draft preparation, S.Q.; writing—review and editing, S.Q. and L.T.; visualization, S.Q.; supervision, L.T.; project administration, S.Q.; funding acquisition, S.Q. and L.T. All authors have read and agreed to the published version of the manuscript.
Funding
This research was funded by Callier Center for Communication Disorders, 2023 Susan and Jim JergerResearch in Audiology Fellowship.
Institutional Review Board Statement
The study was approved by the Institutional Review Board of The University of Texas at Dallas (IRB-24-173 approved on 09/30/2024).
Informed Consent Statement
Informed consent was obtained from all subjects involved in the study.
Data Availability Statement
The data presented in this study are available on request from the corresponding author due to privacy concern.
Acknowledgments
Great thanks to the subject recruitment platforms: SONA, at the University of Texas at Dallas and Callier Center research registry.
Conflicts of Interest
The authors declare no conflicts of interest.
Abbreviations
The following abbreviations are used in this manuscript:
| 15iSSQ | 15-item Speech, Spatial, and Qualities of Hearing Scale |
| EDA | Electrodermal Activity |
| FUEL | Framework for Understanding Effortful Listening |
| GSR | Galvanic Skin Response |
| HINT | Hearing-in-Noise |
| HR | Heart Rate |
| PPG | Photoplethysmography |
| SNR | Signal to Noise Ratio |
Appendix A
Measure of SNR75
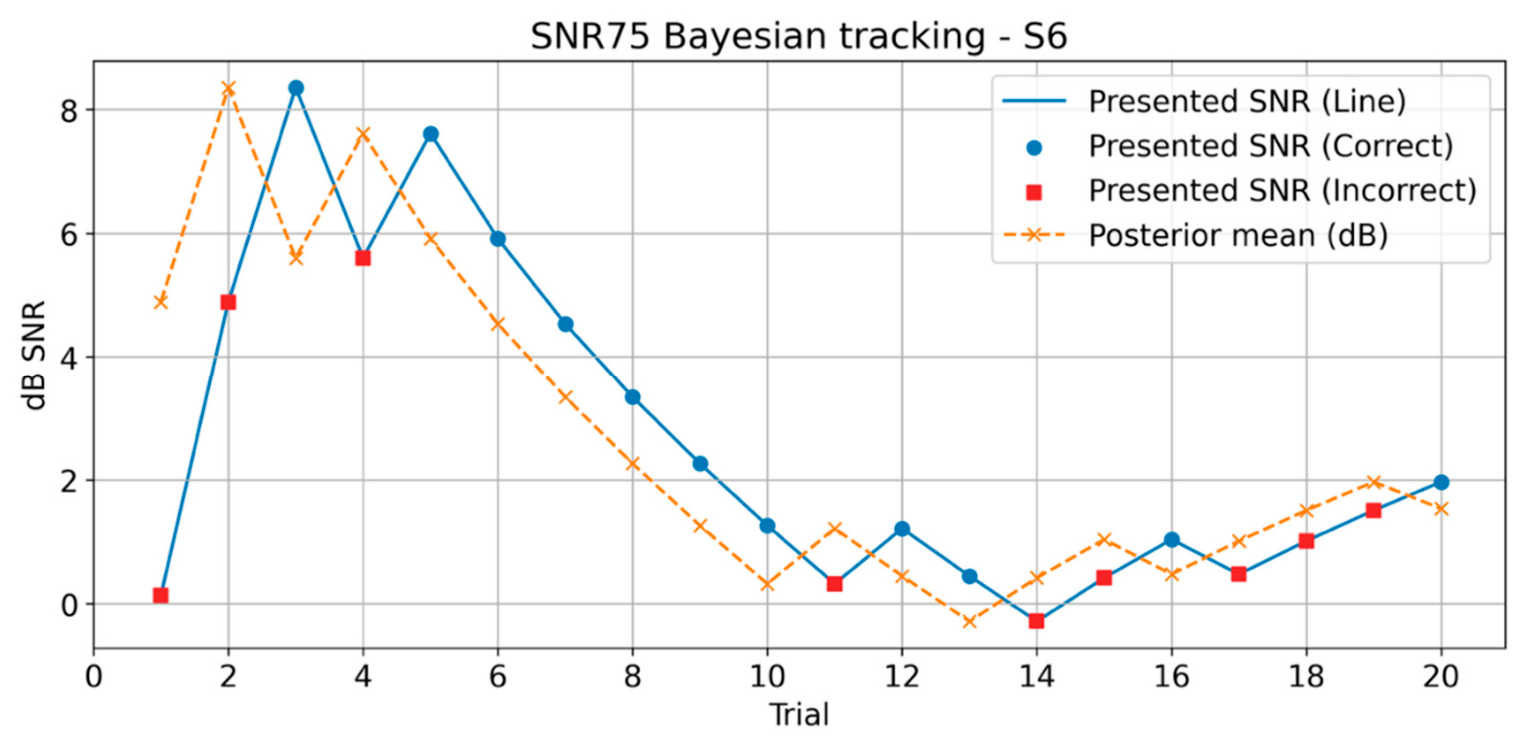
The tester recorded the result of each trial as “correct” using the right sign (→) of the keyboard if the participant correctly repeated the full sentence, or “incorrect” using the left sign (←) if there was any mistake in the response. Following each recorded response, the threshold posterior distribution was updated using a logistic psychometric function (slope = 0.25 dB-1) applied across a 300-point SNR grid (−20 to +30 dB), initialized with a Gaussian prior (mean = 0 dB, SD = 8 dB). The SNR for each subsequent presentation was set to the updated posterior mean, and the final SNR75 was defined as the mean of the posterior distribution following the completion of the 20-trial block. A representative result from the 6th participant is shown in Figure A1 (SNR75 = 1.54 dB SNR).
Figure A1.
A demo of estimating the signal-to-noise ratio targeting 75% speech recognition accuracy procedure from one participant. Note. The solid blue line represents the actual signal-to-noise ratio (SNR) in dB presented during each trial with circles and squares indicating correct and incorrect responses, respectively. The dashed orange line (crosses) illustrates the estimated posterior mean of the threshold, which updates dynamically based on the participant’s responses. In the beginning, the algorithm uses larger step sizes to accelerate convergence toward the target, with both the presented SNR and the posterior mean eventually converging to a stable SNR75 estimate of approximately 1.54 dB by the final trials.
Figure A1.
A demo of estimating the signal-to-noise ratio targeting 75% speech recognition accuracy procedure from one participant. Note. The solid blue line represents the actual signal-to-noise ratio (SNR) in dB presented during each trial with circles and squares indicating correct and incorrect responses, respectively. The dashed orange line (crosses) illustrates the estimated posterior mean of the threshold, which updates dynamically based on the participant’s responses. In the beginning, the algorithm uses larger step sizes to accelerate convergence toward the target, with both the presented SNR and the posterior mean eventually converging to a stable SNR75 estimate of approximately 1.54 dB by the final trials.
Appendix B
Physiological Data Preprocessing
Prior to analysis, raw physiological data were cleaned to remove non-physiological outliers. Specifically, for pupil data, blink artifacts were padded by expanding the invalid data mask by 12 frames (approximately 100 ms) in both directions. Extreme outliers (3 SDs from the trial mean) were removed (removed N = 0). All resulting gaps were filled using linear interpolation. The continuous pupil signal was smoothed using a 1D Gaussian filter (σ = 15). To maximize data retention, missing-data thresholds were evaluated independently for each eye. If an eye exhibited more than 40% missing data within the trial analysis window, it was excluded; however, the trial was retained if the contralateral eye remained valid (≤40% missing data). An entire trial was excluded only if both eyes exceeded the 40% missing-data threshold (removed N = 1).
EDA data were processed using the standard NeuroKit2 pipeline to separate the tonic skin conductance level from the phasic skin conductance responses. Strict quality control criteria were implemented to minimize motion artifacts. A trial was excluded if the mean baseline fell outside the 0.1–40.0 μS range (removed N = 1). Additionally, trials were rejected if any transient phasic peak exceeded 5.0 μS, indicating a massive movement artifact during the task (removed N = 0).
The raw PPG signal was first cleaned by discarding physically implausible amplitude values (below 1.0) and filling the resulting gaps via linear interpolation. A 3rd-order Butterworth bandpass filter (0.8–2.5 Hz) was then applied to attenuate high-frequency noise and baseline drift. To calculate HR, R-R intervals were extracted using a peak detection algorithm, with a minimum interval constraint of 0.4 s to prevent false-positive artifact detection. The instantaneous HR was interpolated into a continuous time series and smoothed using a 3.0-s rolling median filter. Trials were excluded from analysis if the mean HR during the baseline window fell outside 40–140 BPM (removed N = 0).
A strict data quality control procedure was implemented at the trial level for all three modalities. For each participant, an inclusion threshold was established a priori: a minimum of 14 valid trials per modality (total = 20 trials) across all task stages. Specifically, if a participant retained fewer than 14 valid trials for a given modality, their data for that specific metrics were excluded. Valid data from their remaining modalities were preserved for modality-specific or pairwise analyses. However, for omnibus testing using repeated-measures ANOVA, participants with missing modality data were entirely excluded via listwise deletion.
Figure A2.
Trial availability and data quality control matrix across physiological modalities. The heatmap visualizes the minimum number of valid trials retained for each participant (S1–S33) across all task stages for Gaze, Electrodermal Activity (EDA), and Heart Rate (HR). Cell values and the corresponding color gradient (from dark purple to yellow) indicate the number of available trials out of 20. The predefined inclusion threshold was set at 14 trials. Cells depicted in dark purple represent data points that fell below this threshold (Participant S10 for Gaze; Participant S11 for EDA), leading to the exclusion of these specific participant-modality pairs from subsequent statistical analyses.
Figure A2.
Trial availability and data quality control matrix across physiological modalities. The heatmap visualizes the minimum number of valid trials retained for each participant (S1–S33) across all task stages for Gaze, Electrodermal Activity (EDA), and Heart Rate (HR). Cell values and the corresponding color gradient (from dark purple to yellow) indicate the number of available trials out of 20. The predefined inclusion threshold was set at 14 trials. Cells depicted in dark purple represent data points that fell below this threshold (Participant S10 for Gaze; Participant S11 for EDA), leading to the exclusion of these specific participant-modality pairs from subsequent statistical analyses.
References
- Curti, S.A.; Taylor, E.N.; Su, D.; Spankovich, C. Prevalence of and Characteristics Associated with Self-Reported Good Hearing in a Population with Elevated Audiometric Thresholds. JAMA Otolaryngol. Head Neck Surg. 2019, 145, 626–633. [Google Scholar] [CrossRef] [PubMed]
- Spankovich, C.; Gonzalez, V.B.; Su, D.; Bishop, C.E. Self Reported Hearing Difficulty, Tinnitus, and Normal Audiometric Thresholds, the National Health and Nutrition Examination Survey 1999–2002. Hear. Res. 2018, 358, 30–36. [Google Scholar] [CrossRef] [PubMed]
- Budak, M.; Grosh, K.; Sasmal, A.; Corfas, G.; Zochowski, M.; Booth, V. Contrasting Mechanisms for Hidden Hearing Loss: Synaptopathy vs. Myelin Defects. PLoS Comput. Biol. 2021, 17, e1008499. [Google Scholar] [CrossRef] [PubMed]
- Kohrman, D.C.; Wan, G.; Cassinotti, L.; Corfas, G. Hidden Hearing Loss: A Disorder with Multiple Etiologies and Mechanisms. Cold Spring Harb. Perspect. Med. 2020, 10, a035493. [Google Scholar] [CrossRef] [PubMed]
- Guest, H.; Munro, K.J.; Prendergast, G.; Millman, R.E.; Plack, C.J. Impaired Speech Perception in Noise with a Normal Audiogram: No Evidence for Cochlear Synaptopathy and No Relation to Lifetime Noise Exposure. Hear. Res. 2018, 364, 142–151. [Google Scholar] [CrossRef] [PubMed]
- Washnik, N.J.; Bhatt, I.S.; Sergeev, A.V.; Prabhu, P.; Suresh, C. Auditory Electrophysiological and Perceptual Measures in Student Musicians with High Sound Exposure. Diagnostics 2023, 13, 934. [Google Scholar] [CrossRef] [PubMed]
- Liu, J.; Stohl, J.; Overath, T. Hidden Hearing Loss: Fifteen Years at a Glance. Hear. Res. 2024, 443, 108967. [Google Scholar] [CrossRef] [PubMed]
- Ruggles, D.; Bharadwaj, H.; Shinn-Cunningham, B.G. Normal Hearing Is Not Enough to Guarantee Robust Encoding of Suprathreshold Features Important in Everyday Communication. Proc. Natl. Acad. Sci. USA 2011, 108, 15516–15521. [Google Scholar] [CrossRef] [PubMed]
- Tremblay, K.L.; Pinto, A.; Fischer, M.E.; Klein, B.E.K.; Klein, R.; Levy, S.; Tweed, T.S.; Cruickshanks, K.J. Self-Reported Hearing Difficulties among Adults with Normal Audiograms: The Beaver Dam Offspring Study. Ear Hear. 2015, 36, e290–e299. [Google Scholar] [CrossRef] [PubMed]
- Peelle, J.E. Listening Effort: How the Cognitive Consequences of Acoustic Challenge Are Reflected in Brain and Behavior. Ear Hear. 2018, 39, 204–214. [Google Scholar] [CrossRef] [PubMed]
- Rennies, J.; Schepker, H.; Holube, I.; Kollmeier, B. Listening Effort and Speech Intelligibility in Listening Situations Affected by Noise and Reverberation. J. Acoust. Soc. Am. 2014, 136, 2642–2653. [Google Scholar] [CrossRef] [PubMed]
- Pang, J.; Beach, E.F.; Gilliver, M.; Yeend, I. Adults Who Report Difficulty Hearing Speech in Noise: An Exploration of Experiences, Impacts and Coping Strategies. Int. J. Audiol. 2019, 58, 851–860. [Google Scholar] [CrossRef] [PubMed]
- Qi, S.; Thibodeau, M.L. Role of Listening Effort and Linguistic Experience in Predicting Hearing Difficulty in Listeners with Typical Hearing. In Proceedings of the Association for Research in Otolaryngology MidWinter Meeting, San Juan, Puerto Rico, 7–11 February 2026. [Google Scholar]
- Qi, S. Association of Personality, Listening Effort, and Self-Report and Behavioral Hearing Perception in Individuals with Typical Hearing: An Online Study. Doctoral Dissertation, The University of Texas at Dallas: ProQuest Dissertations & Theses Global, Richardson, TX, USA, 2026. [Google Scholar]
- Pichora-Fuller, M.K.; Kramer, S.E.; Eckert, M.A.; Edwards, B.; Hornsby, B.W.Y.; Humes, L.E.; Lemke, U.; Lunner, T.; Matthen, M.; Mackersie, C.L.; et al. Hearing Impairment and Cognitive Energy: The Framework for Understanding Effortful Listening (FUEL). Ear Hear. 2016, 37, 5S. [Google Scholar] [CrossRef]
- Houweling, T. A Trait/State Perspective on the Neural Bases of Interindividual and Intra-Individual Variability in Speech-Innoise Perception. Doctoral Dissertation, The University of Zürich, Zurich, Switzerland, 2023. [Google Scholar]
- Alhanbali, S.; Dawes, P.; Millman, R.E.; Munro, K.J. Measures of Listening Effort Are Multidimensional. Ear Hear. 2019, 40, 1084–1097. [Google Scholar] [CrossRef] [PubMed]
- Shields, C.; Sladen, M.; Bruce, I.A.; Kluk, K.; Nichani, J. Exploring the Correlations between Measures of Listening Effort in Adults and Children: A Systematic Review with Narrative Synthesis. Trends Hear. 2023, 27, 23312165221137116. [Google Scholar] [CrossRef] [PubMed]
- Francis, A.L.; Love, J. Listening Effort: Are We Measuring Cognition or Affect, or Both? WIREs Cogn. Sci. 2020, 11, e1514. [Google Scholar] [CrossRef] [PubMed]
- Zekveld, A.A.; Koelewijn, T.; Kramer, S.E. The Pupil Dilation Response to Auditory Stimuli: Current State of Knowledge. Trends Hear. 2018, 22, 2331216518777174. [Google Scholar] [CrossRef] [PubMed]
- Mackersie, C.L.; Calderon-Moultrie, N. Autonomic Nervous System Reactivity during Speech Repetition Tasks: Heart Rate Variability and Skin Conductance. Ear Hear. 2016, 37, 118S. [Google Scholar] [CrossRef] [PubMed]
- Hart, S.G.; Staveland, L.E. Development of NASA-TLX (Task Load Index): Results of Empirical and Theoretical Research. In Advances in Psychology; Hancock, P.A., Meshkati, N., Eds.; Human Mental Workload; Elsevier: Amsterdam, The Netherlands, 1988; Volume 52, pp. 139–183. [Google Scholar]
- Giuliani, N.P.; Brown, C.J.; Wu, Y.-H. Comparisons of the Sensitivity and Reliability of Multiple Measures of Listening Effort. Ear Hear. 2021, 42, 465–474. [Google Scholar] [CrossRef] [PubMed]
- Strasser, E.; Brand, T.; Rennies, J. The Relation between Sustained Listening under Difficult Conditions and Behavioral, Subjective, and Physiological Indicators of Fatigue. Trends Hear. 2026, 30, 23312165261441694. [Google Scholar] [CrossRef] [PubMed]
- Keur-Huizinga, L.; Huizinga, N.A.; Zekveld, A.A.; Versfeld, N.J.; van de Ven, S.R.B.; van Dijk, W.A.J.; de Geus, E.J.C.; Kramer, S.E. Effects of Hearing Acuity on Psychophysiological Responses to Effortful Speech Perception. Hear. Res. 2024, 448, 109031. [Google Scholar] [CrossRef] [PubMed]
- Visentin, C.; Valzolgher, C.; Pellegatti, M.; Potente, P.; Pavani, F.; Prodi, N. A Comparison of Simultaneously-Obtained Measures of Listening Effort: Pupil Dilation, Verbal Response Time and Self-Rating. Int. J. Audiol. 2022, 61, 561–573. [Google Scholar] [CrossRef] [PubMed]
- Richter, M.; Buhiyan, T.; Bramsløw, L.; Innes-Brown, H.; Fiedler, L.; Hadley, L.V.; Naylor, G.; Saunders, G.H.; Wendt, D.; Whitmer, W.M.; et al. Combining Multiple Psychophysiological Measures of Listening Effort: Challenges and Recommendations. Semin. Hear. 2023, 44, 95–105. [Google Scholar] [CrossRef] [PubMed]
- Watson, A.B.; Pelli, D.G. Quest: A Bayesian Adaptive Psychometric Method. Percept. Psychophys. 1983, 33, 113–120. [Google Scholar] [CrossRef] [PubMed]
- Nilsson, M.; Soli, S.D.; Sullivan, J.A. Development of the Hearing in Noise Test for the Measurement of Speech Reception Thresholds in Quiet and in Noise. J. Acoust. Soc. Am. 1994, 95, 1085–1099. [Google Scholar] [CrossRef] [PubMed]
- Winn, M.B.; Wendt, D.; Koelewijn, T.; Kuchinsky, S.E. Best Practices and Advice for Using Pupillometry to Measure Listening Effort: An Introduction for Those Who Want to Get Started. Trends Hear. 2018, 22, 2331216518800869. [Google Scholar] [CrossRef] [PubMed]
- Moulin, A.; Vergne, J.; Gallego, S.; Micheyl, C. A New Speech, Spatial, and Qualities of Hearing Scale Short-Form: Factor, Cluster, and Comparative Analyses. Ear Hear. 2019, 40, 938. [Google Scholar] [CrossRef] [PubMed]
- Gatehouse, S.; Noble, W. The Speech, Spatial and Qualities of Hearing Scale (SSQ). Int. J. Audiol. 2004, 43, 85–99. [Google Scholar] [CrossRef] [PubMed]
- Kramer, A.F. Physiological Metrics of Mental Workload: A Review of Recent Progress. In Multiple Task Performance; CRC Press: Boca Raton, FL, USA, 1991. [Google Scholar]
- Mackersie, C.L.; Cones, H. Subjective and Psychophysiological Indices of Listening Effort in a Competing-Talker Task. J. Am. Acad. Audiol. 2011, 22, 113–122. [Google Scholar] [CrossRef] [PubMed]
- Aston-Jones, G.; Cohen, J.D. AN INTEGRATIVE THEORY OF LOCUS COERULEUS-NOREPINEPHRINE FUNCTION: Adaptive Gain and Optimal Performance. Annu. Rev. Neurosci. 2005, 28, 403–450. [Google Scholar] [CrossRef] [PubMed]
- Boucsein, W. Electrodermal Activity; Springer Science & Business Media: Berlin/Heidelberg, Germany, 2012; ISBN 978-1-4614-1126-0. [Google Scholar]
- Berntson, G.G.; Thomas Bigger, J., Jr.; Eckberg, D.L.; Grossman, P.; Kaufmann, P.G.; Malik, M.; Nagaraja, H.N.; Porges, S.W.; Saul, J.P.; Stone, P.H.; et al. Heart Rate Variability: Origins, Methods, and Interpretive Caveats. Psychophysiology 1997, 34, 623–648. [Google Scholar] [CrossRef] [PubMed]
- Porges, S.W. Orienting in a Defensive World: Mammalian Modifications of Our Evolutionary Heritage. A Polyvagal Theory. Psychophysiology 1995, 32, 301–318. [Google Scholar] [CrossRef] [PubMed]
- Mackersie, C.; MacPhee, I.; Heldt, E. Effects of Hearing Loss on Heart Rate Variability and Skin Conductance Measured during Sentence Recognition in Noise. Ear Hear. 2015, 36, 145–154. [Google Scholar] [CrossRef] [PubMed]
- Koelewijn, T.; Zekveld, A.A.; Festen, J.M.; Kramer, S.E. Pupil Dilation Uncovers Extra Listening Effort in the Presence of a Single-Talker Masker. Ear Hear. 2012, 33, 291–300. [Google Scholar] [CrossRef] [PubMed]
- Lemke, U.; Besser, J. Cognitive Load and Listening Effort: Concepts and…. Ear Hear. 2016, 37, 77S–84S. [Google Scholar] [CrossRef] [PubMed]
- Sokolov, E.N. Higher Nervous Functions: The Orienting Reflex. Annu. Rev. Physiol. 1963, 25, 545–580. [Google Scholar] [CrossRef] [PubMed]
- Wright, R.A. Brehm’s Theory of Motivation as a Model of Effort and Cardiovascular Response. In The Psychology of Action: Linking Cognition and Motivation to Behavior; The Guilford Press: New York, NY, USA, 1996; pp. 424–453. ISBN 978-1-57230-032-3. [Google Scholar]
- Richter, M. The Moderating Effect of Success Importance on the Relationship between Listening Demand and Listening Effort. Ear Hear. 2016, 37, 111S–117S. [Google Scholar] [CrossRef] [PubMed]
- Keidser, G.; Naylor, G.; Brungart, D.S.; Caduff, A.; Campos, J.; Carlile, S.; Carpenter, M.G.; Grimm, G.; Hohmann, V.; Holube, I.; et al. The Quest for Ecological Validity in Hearing Science: What It Is, Why It Matters, and How to Advance It. Ear Hear. 2020, 41, 5S–19S. [Google Scholar] [CrossRef] [PubMed]
- Hornsby, B.W.Y.; Naylor, G.; Bess, F.H. A Taxonomy of Fatigue Concepts and Their Relation to Hearing Loss. Ear Hear. 2016, 37, 136S–144S. [Google Scholar] [CrossRef] [PubMed]
Figure 1.
Pure-tone audiometry across traditional and extended high frequencies. Note. Right (red circles) and left (blue crosses) ear thresholds are displayed in separate panels. Faint traces represent individual participant profiles, while bold lines denote the cohort averages with standard deviation (± SD) error bars. The shaded grey region (≤25 dB HL) indicates the clinically normal hearing range. A dashed vertical line at 8 kHz separates traditional pure-tone audiometry from extended high-frequency testing.
Figure 1.
Pure-tone audiometry across traditional and extended high frequencies. Note. Right (red circles) and left (blue crosses) ear thresholds are displayed in separate panels. Faint traces represent individual participant profiles, while bold lines denote the cohort averages with standard deviation (± SD) error bars. The shaded grey region (≤25 dB HL) indicates the clinically normal hearing range. A dashed vertical line at 8 kHz separates traditional pure-tone audiometry from extended high-frequency testing.
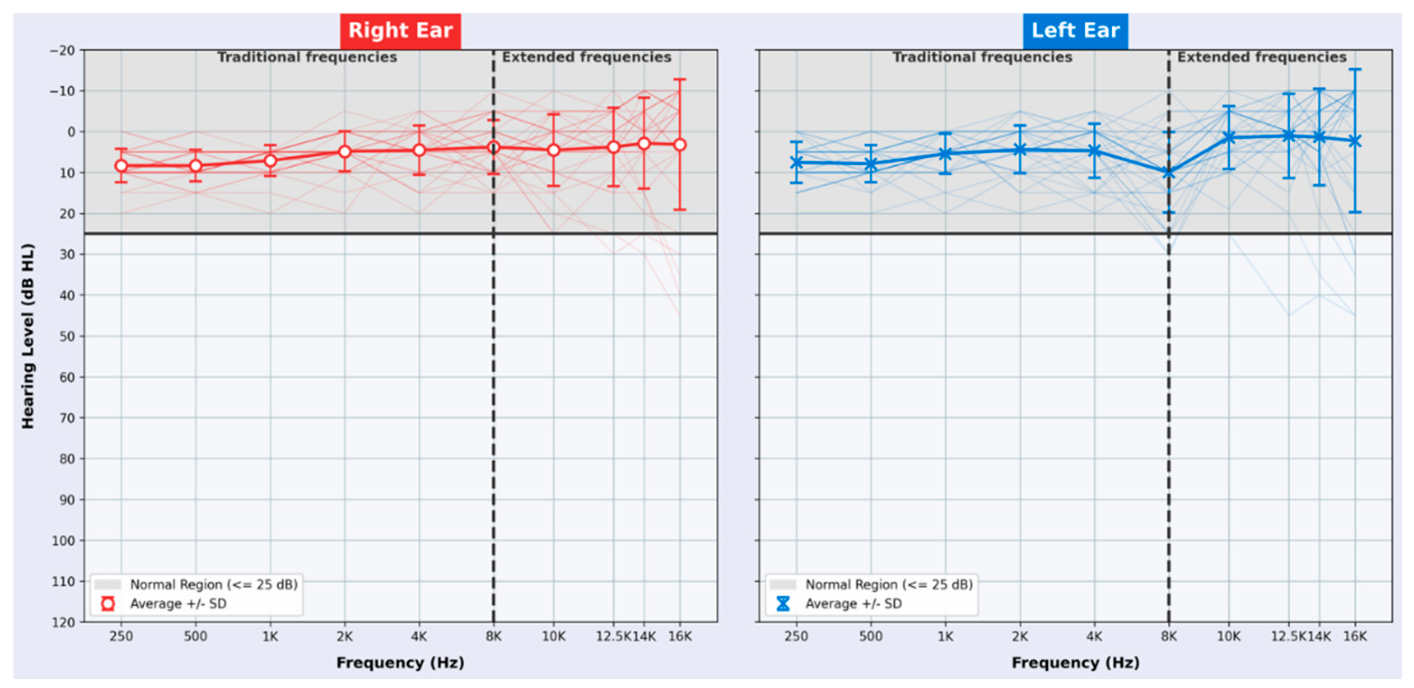
Figure 2.
Demo of the simultaneous listening effort acquisition setting during sentence recognition in noise in one trial. Note. EDA = Electrodermal Activity, PPG = photoplethysmography.
Figure 2.
Demo of the simultaneous listening effort acquisition setting during sentence recognition in noise in one trial. Note. EDA = Electrodermal Activity, PPG = photoplethysmography.
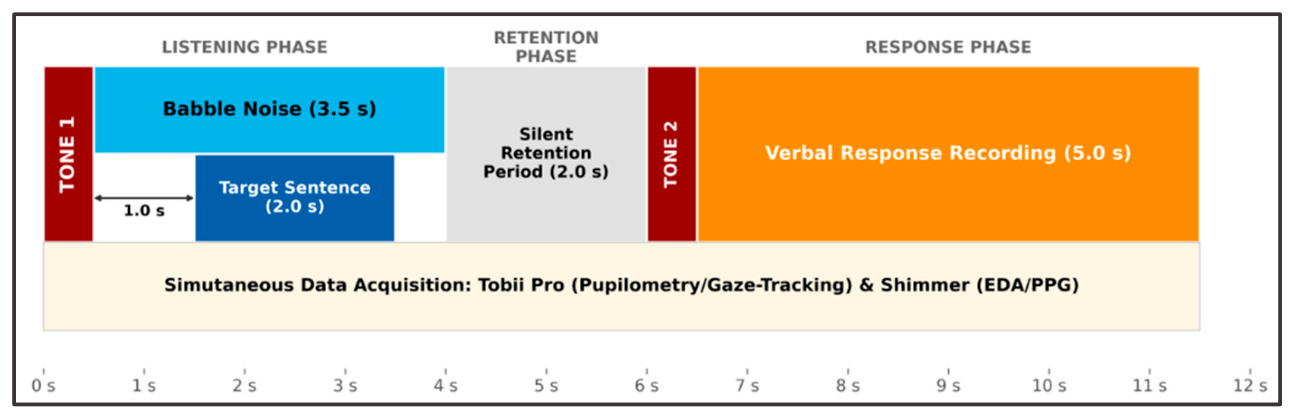
Figure 3.
A representative trial of raw multimodal physiological trajectories. Note. The three vertically aligned panels represent continuous recordings of pupil diameter (top, mm), phasic electrodermal activity (middle, μS), and raw photoplethysmography (bottom, mV) sharing a common time axis (seconds from trial onset). The background shading and vertical dotted lines demarcate the four trial stages: trial initialization (Start), auditory stimulus presentation (Sentence playing), cognitive holding (Retention), and verbal execution (Response). EDA = Electrodermal Activity, PPG = Photoplethysmography.
Figure 3.
A representative trial of raw multimodal physiological trajectories. Note. The three vertically aligned panels represent continuous recordings of pupil diameter (top, mm), phasic electrodermal activity (middle, μS), and raw photoplethysmography (bottom, mV) sharing a common time axis (seconds from trial onset). The background shading and vertical dotted lines demarcate the four trial stages: trial initialization (Start), auditory stimulus presentation (Sentence playing), cognitive holding (Retention), and verbal execution (Response). EDA = Electrodermal Activity, PPG = Photoplethysmography.
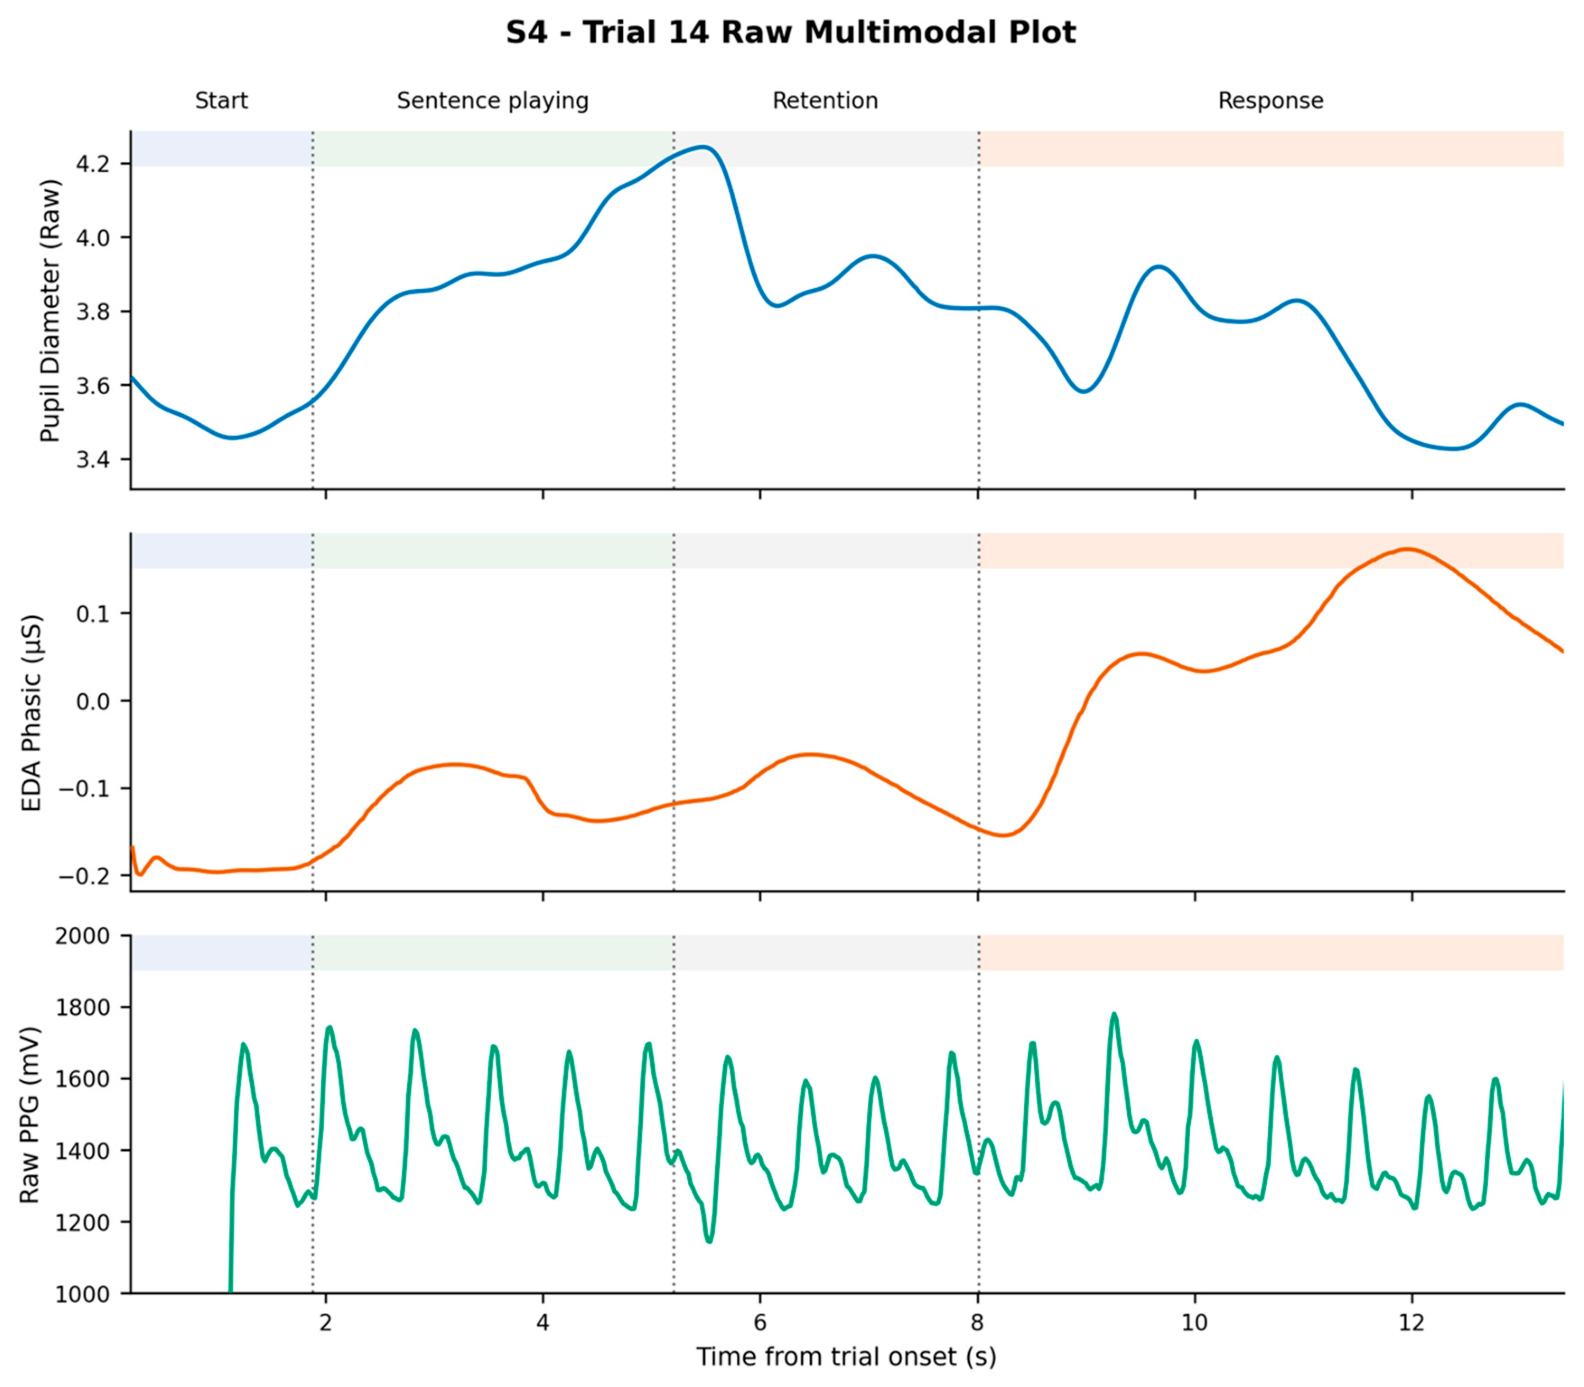
Figure 4.
Average multi-model listening effort results across task phases. Note. A grouped boxplot illustrating raw pupil size data separated by measures (gaze, EDA and HR) across three phases: Baseline, Listening, and Response. The y-axis represents the response levels. The horizontal line within each box indicates the median, the box boundaries represent the interquartile range, and the whiskers extend to the rest of the distribution, excluding outliers. N = 31 across all measures as indicated in the title excluding subjects 10 and 12.
Figure 4.
Average multi-model listening effort results across task phases. Note. A grouped boxplot illustrating raw pupil size data separated by measures (gaze, EDA and HR) across three phases: Baseline, Listening, and Response. The y-axis represents the response levels. The horizontal line within each box indicates the median, the box boundaries represent the interquartile range, and the whiskers extend to the rest of the distribution, excluding outliers. N = 31 across all measures as indicated in the title excluding subjects 10 and 12.
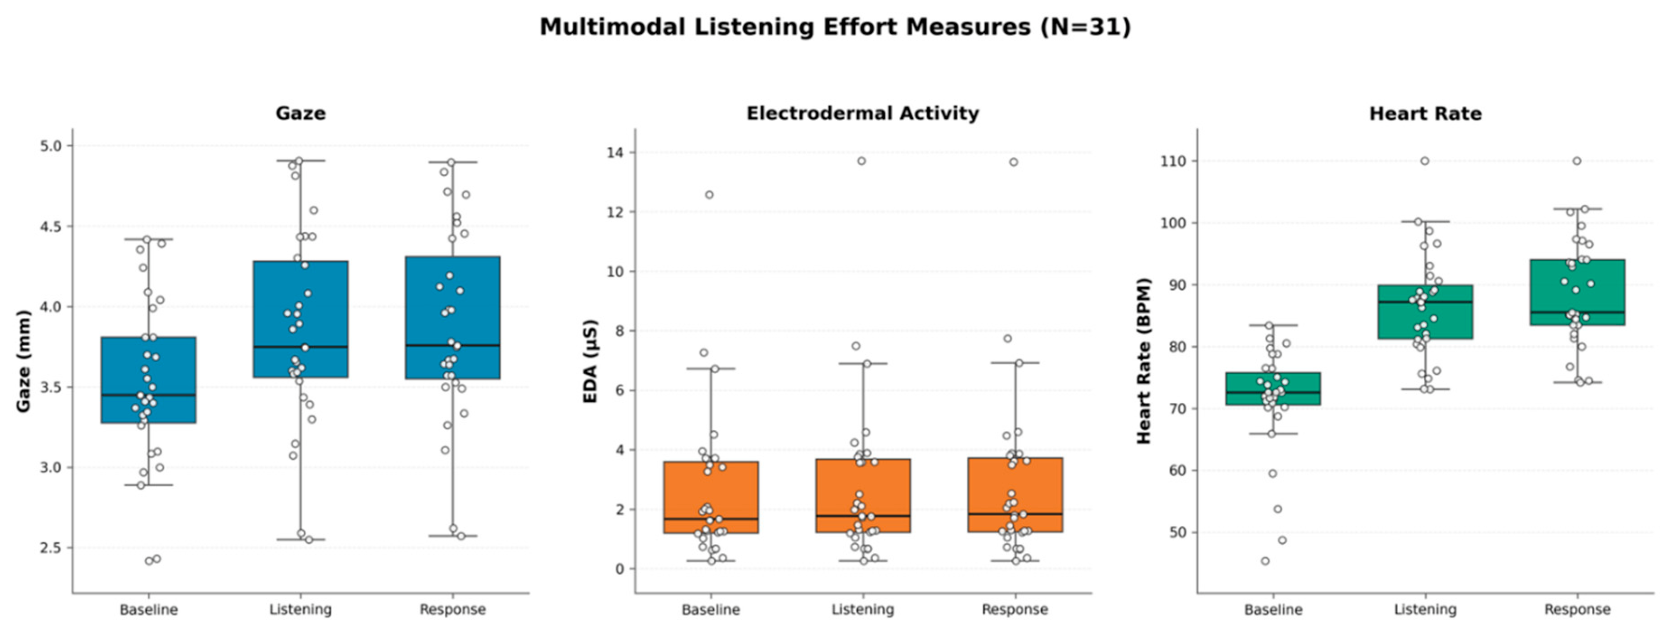
Figure 5.
Group-averaged temporal dynamics of gaze, electrodermal, and heart-rate responses during the sentence recognition task. Note. Lines represent the grand mean all participants, with shaded bands indicating 95% confidence intervals. Signals are plotted in single trial-time ( marks recording onset; the initial 0.2 s is excluded due to onset artifacts). The full-height shaded region denotes the 0.5-s silent baseline interval. Signals were baseline-centered and scaled by a modality-specific interquartile range to align on a common axis while preserving the baseline zero. Vertical dotted lines indicate group-average event timings: baseline, sentence playing, retention, and response.
Figure 5.
Group-averaged temporal dynamics of gaze, electrodermal, and heart-rate responses during the sentence recognition task. Note. Lines represent the grand mean all participants, with shaded bands indicating 95% confidence intervals. Signals are plotted in single trial-time ( marks recording onset; the initial 0.2 s is excluded due to onset artifacts). The full-height shaded region denotes the 0.5-s silent baseline interval. Signals were baseline-centered and scaled by a modality-specific interquartile range to align on a common axis while preserving the baseline zero. Vertical dotted lines indicate group-average event timings: baseline, sentence playing, retention, and response.
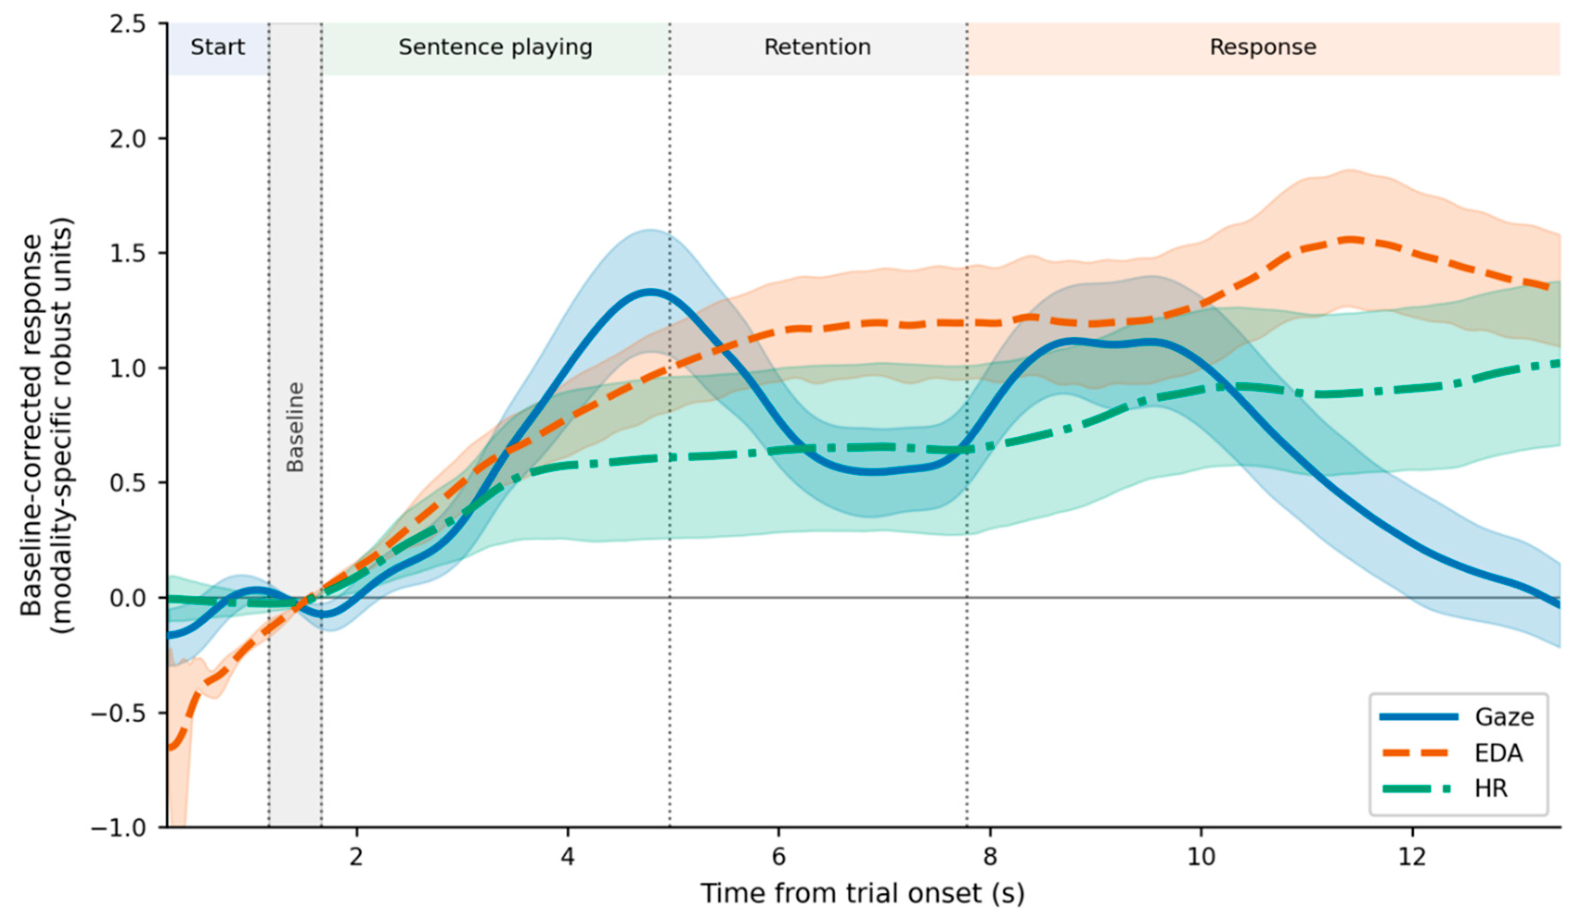
Figure 6.
Comparing amplitude and latency of multimodal physiological responses during listening and response phases. Note. (Left) Data distributions for Gaze, EDA, and HR are represented by violin plots, overlaid with box plots and individual participant data points (). Solid grey lines connect observations from the same participant to illustrate within-subject trajectories. Amplitudes are expressed in fixed-scale robust units; latencies are measured in seconds. (Right) Paired contrasts (EDA vs. Gaze, HR vs. Gaze, and HR vs. EDA) are visualized as forest plots. Black markers indicate the effect estimate (median paired difference, ), with error bars representing the 95% confidence intervals. Asterisks denote statistical significance derived from paired Wilcoxon signed-rank tests (* p < 0.05, ** p < 0.01, ** p < 0.001).
Figure 6.
Comparing amplitude and latency of multimodal physiological responses during listening and response phases. Note. (Left) Data distributions for Gaze, EDA, and HR are represented by violin plots, overlaid with box plots and individual participant data points (). Solid grey lines connect observations from the same participant to illustrate within-subject trajectories. Amplitudes are expressed in fixed-scale robust units; latencies are measured in seconds. (Right) Paired contrasts (EDA vs. Gaze, HR vs. Gaze, and HR vs. EDA) are visualized as forest plots. Black markers indicate the effect estimate (median paired difference, ), with error bars representing the 95% confidence intervals. Asterisks denote statistical significance derived from paired Wilcoxon signed-rank tests (* p < 0.05, ** p < 0.01, ** p < 0.001).
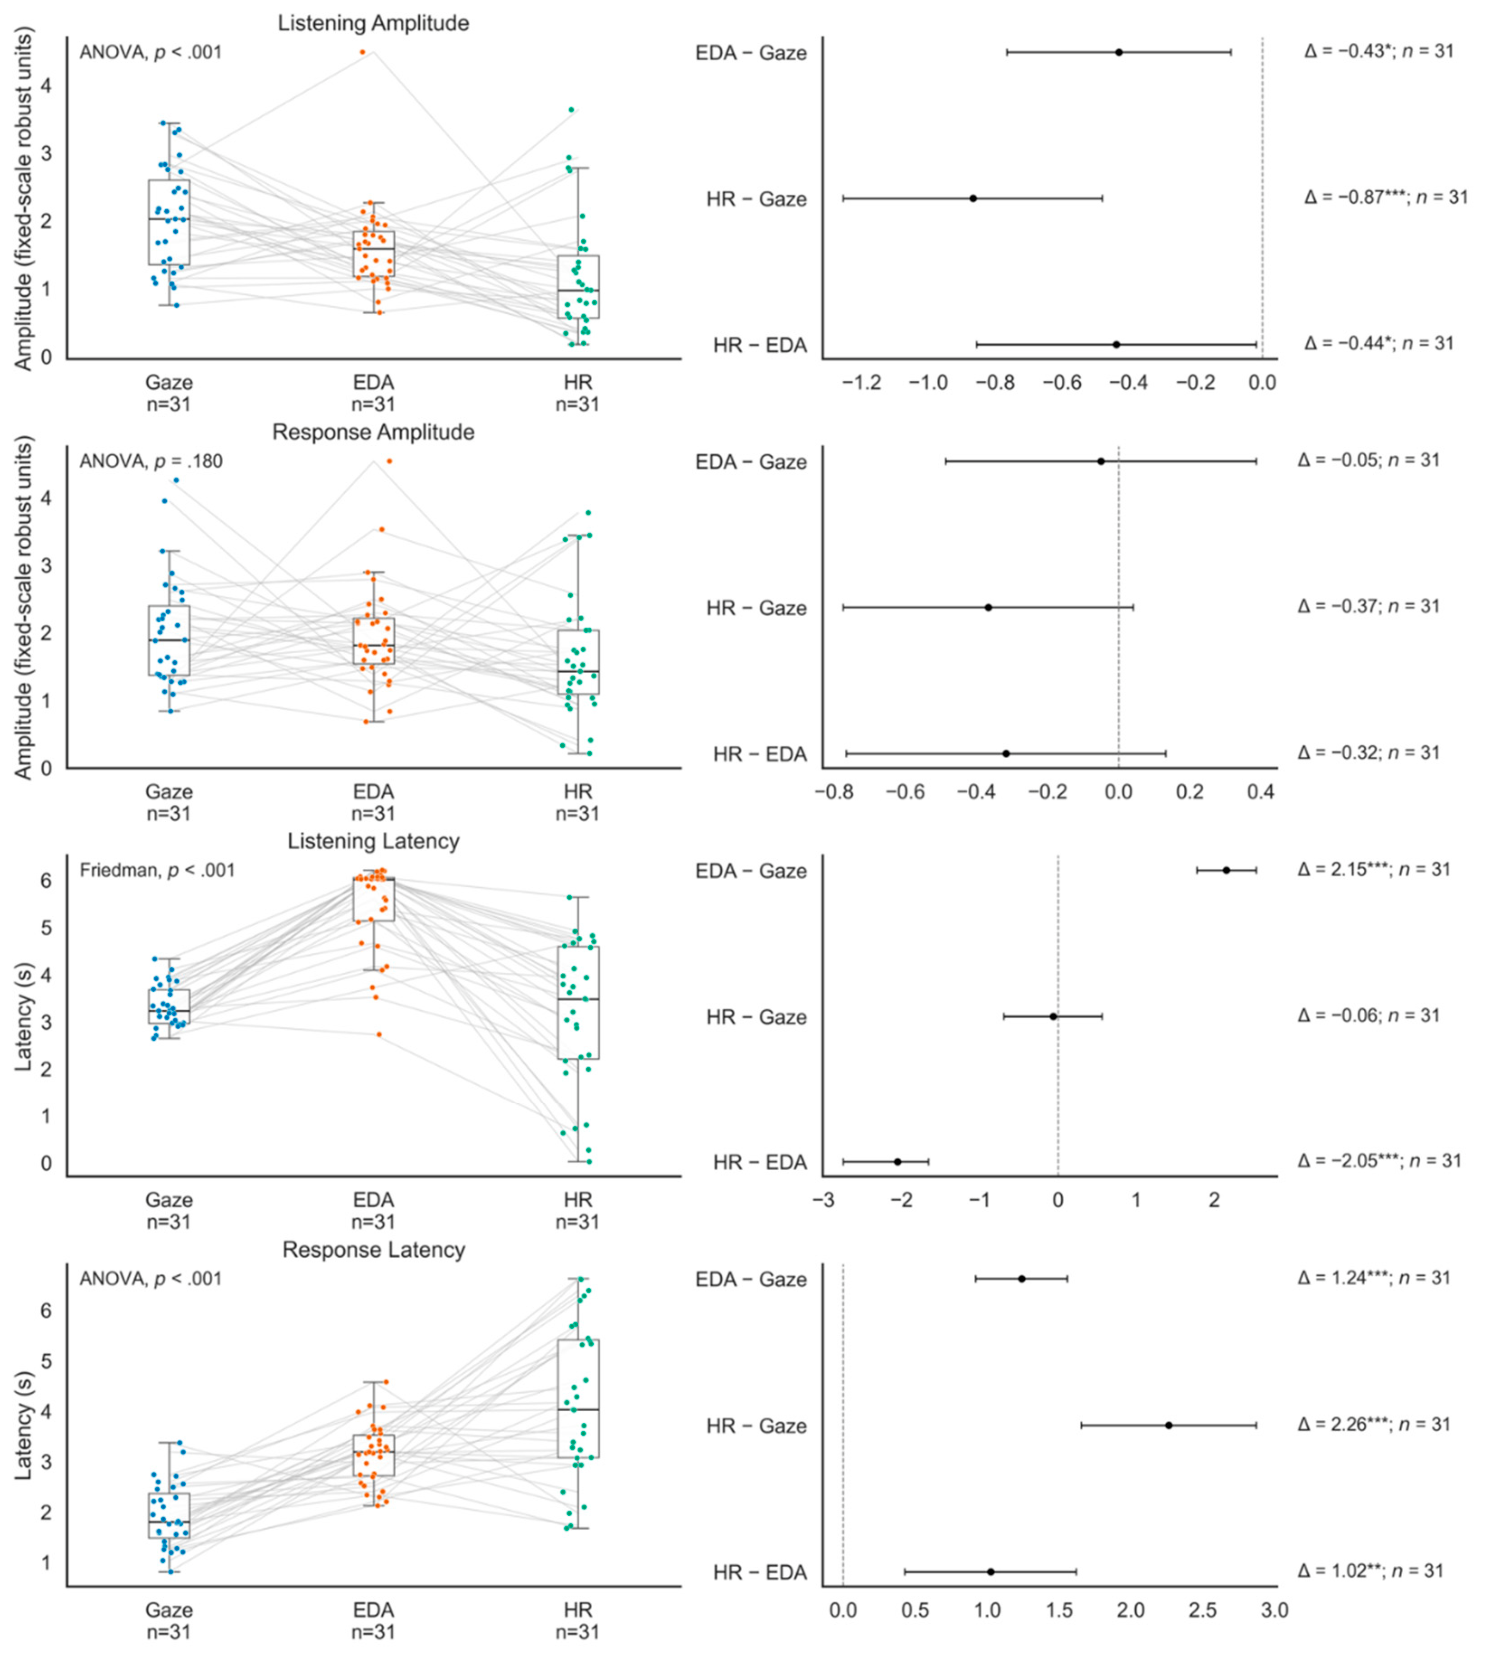
Figure 7.
Correlation matrix of physiological responses and behavioral/subjective measures. Note. Rows represent physiological modalities (Gaze, EDA, HR) and columns represent behavioral assessments (SNR, Sentence Accuracy, 15iSSQ) separated by listening and response phases. Cell values indicate the correlation coefficient, mapped to a diverging color scale (red for positive, blue for negative correlations). Underlined coefficients indicate Pearson’s r (applied to normally distributed variables), whereas non-underlined coefficients indicate Spearman’s ρ (applied to non-normally distributed variables). Asterisks denote statistical significance (* p < 0.05, ** p < 0.01).
Figure 7.
Correlation matrix of physiological responses and behavioral/subjective measures. Note. Rows represent physiological modalities (Gaze, EDA, HR) and columns represent behavioral assessments (SNR, Sentence Accuracy, 15iSSQ) separated by listening and response phases. Cell values indicate the correlation coefficient, mapped to a diverging color scale (red for positive, blue for negative correlations). Underlined coefficients indicate Pearson’s r (applied to normally distributed variables), whereas non-underlined coefficients indicate Spearman’s ρ (applied to non-normally distributed variables). Asterisks denote statistical significance (* p < 0.05, ** p < 0.01).
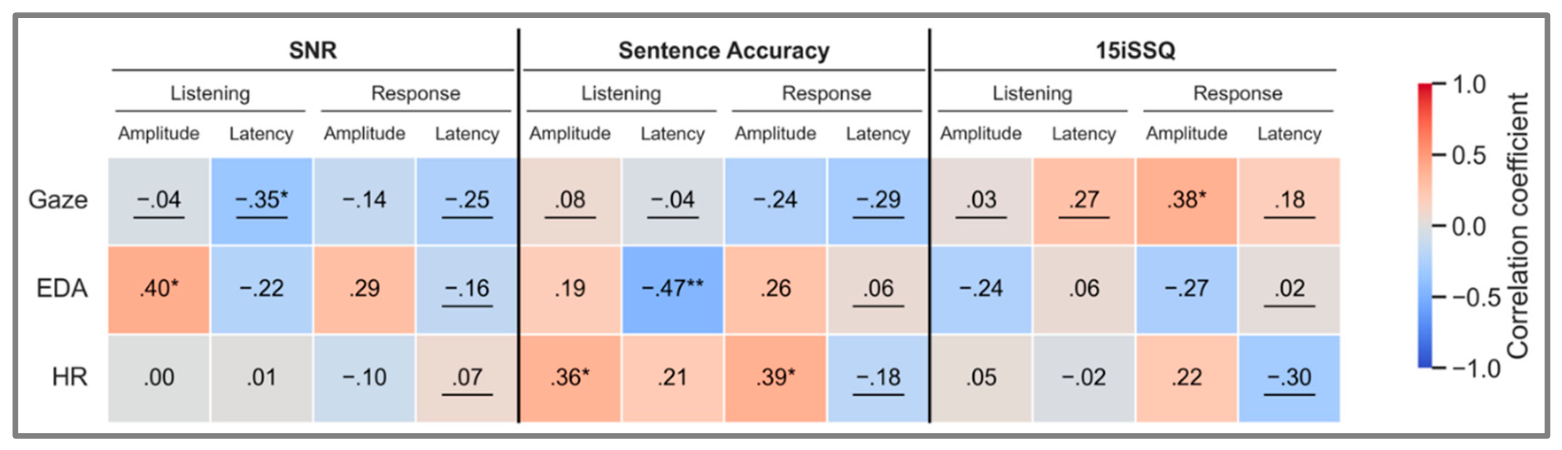

Table 1.
Multidimensional Measures of Listening Effort.
| Category | Specific Metrics | Mechanism | Advantages | Limitations |
|---|---|---|---|---|
| Subjective | Questionnaires & Rating Scales (e.g., NASA Task Load Index [22]) | Conscious appraisal of cognitive exertion and task demand [17] |
|
|
| Behavioral | Processing Speed & Dual-Tasking (e.g., Reaction Time, Accuracy) [23,26] | Allocation of limited cognitive capacity and divided attention [17,23] |
|
|
| Physiological | Pupillometry (e.g., Peak or Mean Pupil Dilation, Pupil Unrest Index) [24,26] | Autonomic arousal and central cognitive load, driven by the locus coeruleus-norepinephrine system [25] |
|
|
| Electrodermal Activity (e.g., Skin Conductance) [23,25] | Pure sympathetic nervous system arousal via eccrine gland activity [25] |
|
||
| Cardiovascular (e.g., Heart Rate) [25] | Regulated by both the sympathetic and parasympathetic branches of the autonomic nervous system [25] |
|
||
| Central or Cortical (e.g., Electroencephalography, Functional Near-Infrared Spectroscopy) [17,25] | Direct cortical activity tracking working memory load and the active suppression of noise [17,25] |
|
Disclaimer/Publisher’s Note: The statements, opinions and data contained in all publications are solely those of the individual author(s) and contributor(s) and not of MDPI and/or the editor(s). MDPI and/or the editor(s) disclaim responsibility for any injury to people or property resulting from any ideas, methods, instructions or products referred to in the content. |
© 2026 by the authors. Licensee MDPI, Basel, Switzerland. This article is an open access article distributed under the terms and conditions of the Creative Commons Attribution (CC BY) license (http://creativecommons.org/licenses/by/4.0/).
Copyright: This open access article is published under a Creative Commons CC BY 4.0 license, which permit the free download, distribution, and reuse, provided that the author and preprint are cited in any reuse.