

Submitted:
24 August 2026
Posted:
25 August 2026
You are already at the latest version
Abstract
Objectives: Rhododendron species are widely used in Himalayan traditional medicine, but the phytochemical composition, antioxidant capacity, and antibacterial potential of their flower, particularly against clinically relevant gram-negative bacteria, remain poorly characterized for Nepalese populations. This study aims to evaluate the phytochemical profile of total phenolic/flavonoid content, antioxidant activity, and antibacterial potential of sequential solvent extract of Rhododendron flowers collected from two sites in Nepal. Materials and Methods: Dried flowers from two sites, R1 and R2, were sequentially extracted with hexane, ethyl acetate, methanol, and water. Extracts were screened quantitatively for major phytochemical classes and total phenolic content (TPC) and total flavonoid content (TFC) were determined colorimetrically. Antioxidant activity was assessed by DP-Ph and ABTS radical scavenging assay. Antibacterial activity of the methanol and ethyl acetate extracts was evaluated against Escherichia coli, Klebsiella sp., and Pseudomonas sp. by agar well diffusion, minimum inhibitory concentration (MIC), and minimum bactericidal concentration (MBC) assays. Results: Methanol gave the highest extraction yield (17-18%) and the richest phytochemical profile, particularly flavonoids and tannins. TPC and TFC were highest in methanol extracts (up to 78.4 mg GAE/g and 46.2 mg QE/g, respectively) and were significantly negatively correlated with DPPH IC50 (r = −0.75 to −0.79, p < 0.05). Methanol and ethyl acetate extracts showed the strongest antioxidant activity (IC50 as low as 18.2 µg/mL), while hexane extracts were the weakest in both assays. The ethyl acetate extract of R2 and the methanol extract of R1 showed the strongest antibacterial activity, with the lowest MIC (12.5 mg/mL) recorded against E. coli, and predominantly bactericidal action (MBC/MIC ≤ 4) against all three bacterial genera. Conclusion: Rhododendron flower extracts, particularly the methanol and ethyl acetate fractions, are rich in phenolic and flavonoid compounds and exhibit notable antioxidant and antibacterial activities, supporting their potential as natural sources of bioactive compounds against oxidative stress and antimicrobial-resistant pathogens.
Keywords:
Rhododendron
; phytochemical screening
; antioxidant activity
; antimicrobial activity
; Klebsiella pneumoniae
; Escherichia coli
; antimicrobial resistance (AMR)
Introduction
Nepal's steep elevation gradient from sub-tropical Tarai to high Himalayan region has fostered an exceptional flora diversity and a long tradition of plant-based medicine. Over 100 species, are documented for ethnomedicinal use in the country's mountain districts alone (Kunwar et al., 2006). Within this flora the genus Rhododendron, (Family Ericaceae), occupies a particularly prominent place. It comprises more than a thousand species, distributed chiefly across the Himalaya, South-East Asia, and other temperate regions of the Northern Hemisphere. It features in Nepal's Tibetan and the Ayurvedic medical tradition as a remedy for inflammation, pain, respiratory complaints, and skin disorder (Popescu & Kopp, 2013). Rhododendron arboreum is the national flower of Nepal also known as the Laligurans is among the most widely recognized species in the genus. Its flower are traditionally consumed as a juice which is also known as sherbet in Nepali and used in different remedies such as the cough , fever, gastrointestinal ailment (Popescu & Kopp, 2013). Beyond its ethnomedicinal reputation, the Rhododendron flower has attracted growing scientific interest as a source of bioactive secondary metabolites. Phytochemical surveys of Rhododendron arboreum flower extract have consistently reported flavonoid, phenolic acid, tannins, alkaloids, saponins, and terpenoids as a major constituent, with the flavonoid and phenolic fraction regarded as principal contributors of this plant's anti-oxidant ability(Jha et al., 2024). In parallel antimicrobial resistance (AMR) is one of the most significant global public health challenges of the 21st century. The World Health Organization (WHO) has identified antibiotic resistance as a major worldwide problem, warning that without immediate action, drug-resistant infections could cause 10 million deaths annually by 2050 (Salam et al., 2023). AMR is a rapidly escalating global issue, particularly in low- and middle-income countries. Among the microbial group exhibiting some of the highest level of resistance are E.coli, klebsiella sp. (Chaudhary et al., 2026). Among the most concerning pathogens are gram-negative bacteria particularly E. coli, Klebsiella species, and Pseudomonas species which have demonstrated the capacity to acquire and transmit resistant genes across clinical and community settings (Mączyńska et al., 2023). Antimicrobial resistance has renewed interest in plant-derived antibacterial agents as potential adjunct or alternative to conventional antibiotics. Medicinal plants represent a promising reservoir of novel antimicrobial leads as they contain structurally diverse phytochemicals, particularly flavonoids, tannins, and phenolics. These compounds have been reported to act through multiple antibacterial mechanisms. These mechanisms include disruption of the bacterial cell membrane, inhibition of the proton pump interference with biofilm formation (Ashraf et al., 2023). This is especially relevant to the Himalayan region, where over 100 traditionally used plants, including several Rhododendron species, have been catalogued for antimicrobial phytoconstituents active against clinically important gram-negative pathogens such as E. coli and Pseudomonas sp. (Paudel et al., 2011, 2016).
While the phytochemical composition and bioactivity of R. arboreum flowers have been studied at various locations in Nepal and neighbouring Himalayan states, there is limited comparative data on how altitude and collection site influence the phytochemical yield, antioxidant capacity, and antibacterial efficacy of sequentially extracted R. arboreum flower fractions. To address this gap, the present study evaluated the phytochemical composition, total phenolic and flavonoid content, DPPH and ABTS radical-scavenging activity, and antibacterial potential (including minimum inhibitory and bactericidal concentrations) of R. arboreum flower extracts. These extracts were obtained through sequential solvent extraction (hexane, ethyl acetate, methanol, and water) from two ecologically distinct sites within Nepal's Kathmandu Valley: Tarebhir (2,100 m) and Lalitpur Lele (1,600 m). The extracts were tested against the Gram-negative pathogens Escherichia coli, Klebsiella sp., and Pseudomonas sp.
Methodology
Study Design
This laboratory based experimental study evaluated the phytochemical composition and the antioxidant and the antibacterial activity of the Rhododendron flower extract. Flowers of Rhododendron were collected from the two different sites in Kathmandu valley : Tarebhir (2100 m elevation) referred as R1 and Lalitpur Lele (1600 m elevation) referred as R2. From each sites flowers extracted with four different solvents of increasing polarity.
Sample Collection
Fresh Rhododendron flowers were collected from two locations near Kathmandu: Tarebhir (2,100 m) and Lalitpur Lele (1,600 m). At each sites only healthy and fully opened flowers freed of visible insects damage or disease were hand picked in to clean zip-lock bags and transported to the laboratory on the same day. In the laboratory the flowers were gently rinsed under running distilled water to remove dust soils and other surface debris then allowed to drain. The rinsed flowers were spread in a single layers on clean trays and shade dried at the room temperature (22-30o C) aways from the sunlight to prevent the degradation of light sensitive compound such as flavonoids. Drying continued till the samples reached a constant weight.
Extract Preparation
The dried flower material was ground in to fine uniform powder using a clean mortar and pestle. The powder was then passed through a 2mm sieve to ensure uniform particle size which promotes even solvent penetration during extraction. Sieved powder from each sites was stored separately in labeled airtight container at room temperature protected from the light and moisture until extraction to prevent degradation and contamination. Extraction was performed sequentially starting with the least polar solvent and moving to the most polar this method separate compound by polarity. To begin 50 g of dried powdered of flower sample was weighed using an analytical balance and placed in a clean conical flask or extraction thimble. Hexane was added at a 1:5 weight/volume ratio (250 mL of hexane for 50 g of powder). Extraction was carried out by cold maceration: the powder was soaked in the solvent with intermittent shaking at 150 rpm on a shaker for 24 hours at room temperature. The mixture was then filtered through Whatman No. 1 filter paper to separate the liquid extract (filtrate) from the solid plant residue (marc). The filtrate was transferred to a clean glass container and dried under a laminar airflow hood at room temperature until the solvent completely evaporated, yielding a dry or semi-solid crude extract. This dried extract was then weighed and stored in an airtight container at 4 °C until further analysis.
The marc (leftover plant residue) was dried to remove residual hexane, then re-extracted with the next solvent in the polarity series: ethyl acetate, followed by methanol, and finally distilled water.
This process yielded four crude extracts per site (hexane, ethyl acetate, methanol, and aqueous), all derived from the same original batch of plant material. Each crude extract was weighed to calculate the percentage yield using the formula: Percentage Yield (%) = (Weight of dried crude extract ÷ Weight of original dried powder) × 100. All extracts were transferred into labeled, airtight amber vials and stored at 4 °C (refrigerated and protected from light) until further analysis. Immediately before use in each assay, extracts were re-dissolved in an appropriate solvent (e.g., dimethyl sulfoxide, DMSO, at a concentration below 1% v/v in the final test solution)(Shootha et al., 2022).
Qualitative Phytochemical Screening
Qualitative phytochemical screening was performed to identify the major classes of secondary metabolites in extract using standard procedures. The phytochemical screened were alkaloids, flavonoids, tannins saponins, terpenoids , steroids, and cardiac glycoside. Specific tests were used for the each: Mayers test for alkaloids, the alkaline reagent tests for the flavonoids, the ferric chloride tests for tannins, the froth tests for saponins, the Salkowski tests for the terpenoids, theLiebermann Burchard tests for steroids and the keller killiani tests for the cardiac glycosides . The presence of the each phytochemical was confirmed by observing the characteristic color change or precipitate formation associated with its respective assay. Results were recorded qualitatively as absent (-), weakly present (+) , moderate present (++) or strongly present (+++).(A.M. et al., 2019; Goud, n.d.)
Determination of Total Phenolic Content (TPC)
The total phenolic content (TPC) of the extract was determined using a slightly modified Folin- Ciocalteu colorimetric method. Briefly 0.5ml of the extract solution (1mg/mL) was mixed with 2.5mL of 10 fold diluted Folin- Ciocalteu reagent. After 5 minutes , 2.0 mL of 7.5% (w/v) sodium carbonate solution was added. The reaction mixture was the incubated in the dark at room temperature for 30 minutes. Absorbance was measured at 765 nm using UV-visible spectrophotometer against a reagent blank. Gallic acid served as the reference standard and results were expressed as milligrams of gallic acid equivalent per gram of dry extract (mg GAE/g DE)(Lamuela-Raventós, 2017).
Determination of Total Flavonoid Content (TFC)
Total flavonoid content (TFC) was determined using aluminum chloride colorimetric assay. 0.5 mL of the extract solution was mixed with the 1.5mL of methanol 0.1 mL of 10% aluminium chloride, 0.1 mL of 1M potassium acetate and 2.8mL of distilled water. After incubating the mixture at room temperature for 35 minutes to 40 minutes the absorbance was recorded at 415 nm against the reagent blank in a UV- visible spectrophotometer. Quercetin equivalent per gram of dry extract (mg QE/g DE)(Bello et al., 2024).
Antioxidant Activity
DPPH Free Radical Scavenging Assay
The antioxidant activity of the extract was assessed by using the DPPH (2,2-diphenyl-1-picrylhydrazyl) free radical scavenging assay. Various concentration of each extract were combined with an equal volume of freshly prepared 0.1mM DPPH solution and incubated in the dark at room temperature for 30 minutes. Absorbance was then measured at 517 nM against the methanol blank using a UV-visible spectrophotometer. Ascorbic acid was used as the positive control.Radical scavenging activity, expressed as percentage inhibition, was calculated using the following equation:
% Inhibition = [(A₀ − A₁)/A₀] × 100
Where A₀ represents the absorbance of the control and A₁ represents the absorbance of the sample. The IC₅₀ value was determined from the resulting concentration–response curve. All experiments were performed in triplicate(Baliyan et al., 2022).
ABTS Radical Cation Decolorization Assay
ABTS radical scavenging activity was determined using the ABTS radical cation decolorization assay. The ABTS•⁺ radical was generated by reacting 7Mm ABTS with 2.45mm potassium persulfate and the mixture was allowed to stand in the dark for 12 hours. Before use the solution was diluted with methanol to an absorbance of 0.70 ± 0.02 at 734 nm. Equal volumes of the ABTS•⁺ solution and extract were mixed and incubated for 6 minutes at room temperature in the dark. Absorbance was measured at 734 nm. Percentage inhibition and IC50 values were calculated using the same formula as described for the DPPH assay. Ascorbic acid served as the reference standard(Bibi Sadeer et al., 2020).
Antimicrobial Activity- Agar Well Diffusion Method
Based on the preliminary phytochemical screening and the determination of the total phenolic and total flavonoids content , the ethyl acetate and the methalonic extract were selected for antibacterial evaluation. The antibacterial activity of these extract was determined against Escherichia coli, Klebsiella sp. and Pseudomonas sp. using the agar well diffusion method. Fresh bacterial cultures were standardized to 0.5 McFarland (approximately 1.5 × 10⁸ CFU/mL) and uniformly spread onto sterile Mueller–Hinton agar (MHA) plates using a sterile cotton swab. Sterile wells of 6 mm diameter were made in the agar using a cork borer. The dried extracts were dissolved in dimethyl sulfoxide (DMSO), and 20 µL of each extract solution was dispensed into the respective wells. Ampicillin (10 µg) was used as the positive control, while DMSO served as the negative control. The plates were incubated at 37 ± 2°C for 24 h, after which the zones of inhibition were measured in millimetres (mm)(Donkor et al., 2019; Shahi et al., 2025). All experiments were performed in triplicate (n = 3), and the results were expressed as mean ± standard deviation (SD).
Minimum Inhibitory Concentrations (MICs)
The minimum inhibitory concentrations (MICs) of methanol and ethyl acetate extracts from Rhododendron arboreum flowers, collected from two distinct sites (R1 and R2), were determined against Escherichia coli, Klebsiella sp. and Pseudomonas sp. The broth macrodilution method, based on Clinical and Laboratory Standards Institute (CLSI) guidelines with minor modifications, was employed. For each extract, a stock solution of 100 mg/mL was prepared in 10% dimethyl sulfoxide (DMSO). Two-fold serial dilutions were then made in Mueller-Hinton broth, yielding final concentrations of 100, 50, 25, 12.5, 6.25, and 3.125 mg/mL. An equal volume of standardized bacterial inoculum (adjusted to a 0.5 McFarland standard and diluted as per CLSI recommendations) was added to each tube. A growth control (broth with bacterial inoculum but no extract) and a sterility control (broth only) were also included. The tubes were incubated at 37°C for20–24 hours. Following incubation, tubes were visually inspected for turbidity. The MIC was defined as the lowest extract concentration that completely inhibited visible bacterial growth.
Minimum Bactericidal Concentration (MBC)
Following MIC assay the minimm bactericidal concentration (MBC) was determined. Aliquots (100 µL) from tubes without visible bacterial growth were aseptically spread on to Mueller- Hinton agar (MHA) plates and incubated at 370 C for 24 hours. The MBC was defined as the lowest extract concentration that resulted in no visible bacterial colony growth on the agar plates signifying complete bactericidal activity.
Statistical analysis
All quantitative assays (TPC, TFC, DPPH, ABTS, and antibacterial zone of inhibition) were performed in triplicate and the results are expressed as mean ± standard deviation of the assay. A two-way analysis of variance (ANOVA) was used to evaluate the effect of sample (R1 VS R2 ) extraction solvent (hexane, ethyl acetate, methanol, aqueous) and their interaction on TPC and TFC. Where the ANOVAs indicate a significant effect, post-hoc pairwise comparisons were performed between solvent-sample combinations. Distinct superscript letters in Figure 2 and Figure 3 denote groups that differ significantly from one another (p < 0.05). Pearson correlation R was calculated to assess the relationship between TPC/TFC and DPPH/ABTS IC50 value and between TPC and TFC themselves.
A significant threshold of P < 0.05 was applied throughout. All statistical analyses were performed in R version, (R Core Team 2025), within R studio (version 2025.05.0+496, Post-Software PBC, Boston, MA).
Results
Extraction Yield
The dried flowers of Rhododendron were subjected to successive solvent extraction using hexane, ethyl acetate, methanol and distilled water. For samples R1 and R2 47.26 g and 53.42 g of dried flower powder were used respectively. The total dried crude extract obtained was 8.62 g for R1 and 9.15 g for R2 corresponding to extraction yields of 18.23% and 17.12%(Table 1). Methanol yielded the highest amount of extract among the solvent followed by the water , ethyl acetate and hexane indicating that the flowers are rich in the polar phytoconstituents.
Phytochemical Profiling
Qualitative phytochemical screening revealed considerable variation in the phytochemical composition of the sequential Rhododendron flower extracts. Methanol extracts exhibited the richest phytochemical profile, showing a strong presence (+++) of flavonoids and tannins, with methanol R2 also containing abundant alkaloids (+++). Ethyl acetate extracts were rich in flavonoids, tannins, and alkaloids, (particularly in R2) whereas hexane extracts predominantly contained terpenoids and relatively few polar phytochemicals. The aqueous extracts showed moderate levels of flavonoids, tannins, and saponins. Cardiac glycosides were detected in methanol, aqueous R1, and ethyl acetate R2 extracts but were absent in the remaining fractions. Overall, the heatmap (Figure 1) demonstrates that methanol was the most effective solvent for extracting phytochemicals, followed by ethyl acetate, while hexane primarily extracted non-polar constituents.
Total Phenolic Content and Total Flavonoids Content
The total phenolic content (TPC) and total flavonoids content (TFC) in Rhododendron flower extract varied significantly based on the extraction solvent and the specific sample (Figure 2). A two-way ANOVA revealed that sample, extraction solvent, and their interaction all had significant effects on TPC (p < 0.001 for all). For TFC, sample, extraction solvent, and their interaction all had significant effects (solvent and interaction: p < 0.001; sample: p = 0.013). Methanol extracts yielded the highest TPC for both R1 (78.4 ± 2.1 mg GAE/g) and R2 (64.3 ± 1.8 mg GAE/g). Regarding TFC, methanol extracts showed the highest value in R1 (46.2 ± 1.8 mg QE/g), whereas ethyl acetate extracts resulted in the highest value in R2 (41.4 ± 1.3 mg QE/g). Hexane extracts consistently exhibited the lowest phenolic and flavonoid contents. These findings demonstrate that the extraction solvent significantly influences the recovery of phenolic and flavonoid compounds, with methanol proving particularly efficient for phenolic recovery.
Antioxidant Activity
The antioxidant activities of rhododendron flower were assessed using DPPH and ABTS radical scavenging assays (Figure 3). Across the both assays the hexane extract consistently showed the weakest antioxidant activity with the highest IC50 values ((DPPH: 212.5 ± 5.3 µg/mL for R1, 180.3 ± 3.2 µg/mL for R2; ABTS: 198.7 ± 4.9 µg/mL for R1, 78.5 ± 4.9 µg/mL for R2). The methanol extract showed the strongest activity overall with the lowest IC50 values in the ABTS assays for the both samples (R1: 31.2 ± 1.1 µg/mL; R2: 18.2 ± 1.3 µg/mL) and in DPPH assay for R1 (38.6 ± 1.4 µg/mL). Notably for R2 in DPPH assay the ethylacetate extract (36.3 ± 2.0 µg/mL) showed marginally stronger activity then the methanol extract (38.6 ± 1.4 µg/mL) , indicating that the relative ranking of methanol and the ethyl acetate extract was not entirely consistent across the assays and the samples. Ascorbic acid used as the positive control consistently showed the lowest IC50 values in the both assay (DPPH: 22.1 ± 0.8 µg/mL for R1, 12.1 ± 0.8 µg/mL for R2; ABTS: 18.4 ± 0.7 µg/mL for R1, 8.4 ± 0.2 µg/mL for R2). The pearson correlation analysis showed that both tortal phenolic content and the total flavonoid content were significantly negatively corelated with the DPPH IC50 values (r = -0.748, p =0.033 and r = -0.793, p = 0.019, respectively) indicating that extract richer in the phenolic and flavonoids exhibited stronger radical scavenging activity. AA similar negative trends was observed for ABTS IC50 (TPC: r = −0.638, p = 0.089; TFC: r = −0.704, p = 0.051), through the association did not reach statistical significance . TPC and TFC were themselves strongly positively corelated (r = 0.843, p = 0.009), consistent with flavonoids constituting a major subclass of the total phenolic pool inn these extract.
Antimicrobial Activity - Agar Well Diffusion
The antibacterial activity of methanol and ethyl acetate extracts of Rhododendron flower samples (R1 and R2) was evaluated against Escherichia coli, Klebsiella sp., and Pseudomonas sp. using the agar well diffusion method, and the results are summarized in (Figure 4). For the methanol extract, R1 consistently produced larger zones of inhibition than R2 against all three strains, with the strongest activity observed against Pseudomonas sp. (R1: 13.80 ± 0.53 mm; R2: 11.30 ± 1.08 mm), moderate activity against E. coli (R1: 12.20 ± 1.06 mm; R2: 11.20 ± 0.40 mm), and the weakest activity against Klebsiella sp. (R1: 9.40 ± 1.44 mm; R2: 7.43 ± 1.24 mm). In contrast, the ethyl acetate extract showed a more variable pattern between samples depending on the bacterial strain, with R2 exhibiting significantly stronger inhibition than R1 against E. coli (13.81 ± 0.19 mm vs. 11.30 ± 1.01 mm) and Pseudomonas sp. (13.33 ± 0.30 mm vs. 9.47 ± 1.21 mm), whereas R1 showed greater activity than R2 against Klebsiella sp. (12.87 ± 0.70 mm vs. 10.36 ± 0.66 mm). Overall, E. coli and Pseudomonas sp. were the most susceptible strains, particularly to the ethyl acetate extract of R2, which produced the highest inhibition zones among all tested combinations, while Klebsiella sp. was generally the least sensitive strain across both extract types, with the exception of the ethyl acetate extract of R1. These findings indicate that the antibacterial efficacy of Rhododendron flower extracts is influenced by both the extraction solvent and the bacterial strain tested, with the ethyl acetate extract of R2 and the methanol extract of R1 demonstrating the strongest overall antibacterial potential(Figure 5).
Minimum Inhibitory Concentration (mic) and Minimum Bactericidal Concentration (mbc)
Minimum inhibitory concentrations (MICs) of methanol and ethyl acetate extracts from Rhododendron flowers R1 and R2 against Escherichia coli, Klebsiella sp, and Pseudomonas sp. are presented in (Table 2). MICs were determined using the broth macrodilution method. Among the tested extracts, the ethyl acetate extract from R1 demonstrated the strongest antibacterial activity, exhibiting the lowest MIC of 12.5 mg/mL against E. coli. The same extract showed MICs of 25 mg/mL against both Klebsiella sp and Pseudomonas sp. The methanol extract from R1 exhibited MICs of 25, 50, and 50 mg/mL against E. coli, Klebsiella sp, and Pseudomonas sp respectively. For R2, the ethyl acetate extract demonstrated MICs of 25, 25, and 50 mg/mL, while the methanol extract showed MICs of 50, 50, and >100 mg/mL, respectively. Notably, the methanol extract from R2 exhibited the weakest activity against P. aeruginosa, with no inhibition observed at the highest concentration tested (100 mg/mL). Appropriate growth and sterility controls confirmed the validity of the assay, and the 10% DMSO solvent control showed no detectable antibacterial activity.
Minimum bactericidal concentrations (MBCs) of the methanol and ethyl acetate extracts from Rhododendron flowers R1 and R2 against E. coli, Klebsiella sp., and Pseudomonas sp. are presented in (Table 3). Overall, considerably higher concentrations were required to achieve bactericidal effects compared to the inhibitory concentrations reported in (Table 2). The ethyl acetate extract from R1 exhibited the strongest bactericidal activity against Pseudomonas sp., with an MBC of 50 mg/mL, while requiring 100 mg/mL against both E. coli and Klebsiella sp. The methanol extract from R1 showed MBCs of 100 mg/mL against E. coli and Klebsiella sp., with no bactericidal effect observed against Pseudomonas sp. at the highest concentration tested (>100 mg/mL). For R2, the ethyl acetate extract demonstrated the lowest MBC of 50 mg/mL against E. coli, whereas MBCs of 100 mg/mL were recorded against both Klebsiella sp. and Pseudomonas sp. The methanol extract from R2 required 100 mg/mL against E. coli and Klebsiella sp. and showed no bactericidal activity against Pseudomonas sp. even at the highest concentration tested (>100 mg/mL). Comparison of MBC and MIC values revealed MBC/MIC ratios of 2–4 for most extract-strain combinations, indicating predominantly bactericidal activity; however, the ethyl acetate R1 extract against E. coli showed a notably higher ratio (8), suggesting a more bacteriostatic mode of action against this strain despite its low MIC.
Discussion
Efficient recovery and isolation of phytochemicals from plant material require an appropriate extraction process as extraction yield is determined by a physicochemical characteristic of the targeted compounds, the extraction method, particle size of the plant matrix,solvent properties, the presence of interfering constituents(Do et al., 2014). Sequential extraction of Rhododendron from both Tarebhir (R1) and Lalitpur Lele (R2) showed a consistent polarity-dependent pattern, methanol gave the largest crude extract mass, followed by water, ethyl acetate, and hexane. This ordering agrees with the general solubility rule that governs botanical extraction. Polar protic solvents such as methanol dissolve the broad hydrophilic pool of a plant matrix: sugars, organic acids, and all phenolic and flavonoids far more effectively than non-polar solvents such as hexane, which are largely restricted to lipophilic constituents like waxes, sterols, and some terpenoids(Sun et al., 2025). Methanol, a comparatively small and highly polar molecule with a short methyl group rather than the longer alkyl chain of ethanol, gives it superior solvation of the phenolic hydroxyl group. This characteristic is repeatedly cited as the reason it out-extracts other alcohols and non-polar solvents for phenolic-rich matrices(Boeing et al., 2014). Similarly solvent hierarchy, methanol > ethyl acetate > hexane, has been reported for other phenolic-rich botanicals such as Tamarindus indica and vegetable residue, where methanol consistently produces the highest total phenolic content among the graded solvent series(Razali et al., 2012). The pattern observed here is therefore consistent with the broader extraction literature rather than being unique to Rhododendron. It mirrors what has previously been reported for R. arboreum flower and leaves from the other parts of Nepal, where methanol extracts were likewise the richest in flavonoid contents and alkaloids(Jha et al., 2024; Khatri et al., 2025). The same polarity gradient also explains the phytochemical screening patterns shown in (Figure 1). Hexane, at the nonpolar end of the series, extracted mainly terpenoids and almost no polar constituents while methanol, with a lesser degree, ethyl acetate captured the flavonoid, tannin, and alkaloid-rich fraction.
This is the expected outcome of like-dissolves-like solvent chemistry, with increasing solvent polarity progressively recruiting compounds of matching polarity. The sequential extraction protocol effectively fractionates the phytochemical pool by chemical class rather than simply diluting a fixed pool of compounds(Sun et al., 2025). The intermediate position of ethyl acetate, which recovers moderate to high flavonoid and alkaloid content, particularly in R2, reflects its role as a bridge solvent capable of extracting moderate polar agaric compounds that are too lipophilic for water but polar for hexane.
Site level differences in TPC and TFC ( higher TPC for R1 across solvent, but higher TFC4 R2 in the ethyl acetate fraction) must plausibly reflect the roughly 500 m elevation gap between Tarebhir (2100 m) and Lele(1600 m). Altitude is a well-established modulator of plant phenolic and flavonoid biosynthesis, acting chiefly through increased ultraviolet-B irradiance at higher elevation, which upregulates the phenylpropanoid pathway as a photoprotective response(Jaakola & Hohtola, 2010). Flavonoids and other phenolic compounds play an important photoprotective role in plants by absorbing UV radiation and neutralizing reactive oxygen species generated by UV exposure. Consequently plants growing at higher elevations, where UV radiation is typically more intense, often accumulate greater concentrations of these metabolites. Then conspecific plant inhabiting lower elevation(Jaakola & Hohtola, 2010; Kumar et al., 2023).
This finding is consistent with higher TPC observed in (R1), the higher altitude site in the present study. However the contrasting pattern observed for TFC in the ethyl acetate fraction of (R2)suggests that elevation alone does not fully account for the variation in phenolic accumulation. Other environmental and methodological factors, including microclimate conditions, soil nutrients availability, canopy cover, flower development stages at the time of collection, and subtle difference in post-harvest handling between sampling periods, may also influence the relative accumulation of different phenolic subclass independently of altitude(Jaakola & Hohtola, 2010). The strong positive correlations observed between TPC and TFC (r= 0.843 and p = 0.009) suggest that site-specific variance in TFC within an ethyl acetate fraction may be attributed primarily to differences in the solubilization and recovery of specific flavonoid subclasses. This is rather than to an inherent difference in the overall phenolic biosynthetic capacity of the plant.
The antioxidant activity observed in this study was consistent with the extraction profile described above. Methanolic extract, which exhibited the highest concentration of phenolic and flavonoid compounds, generally demonstrated the lowest IC50 values, indicating a stronger radical scavenging activity against both DPPH and ABTS. Similarly previous studies have reported strong DPPH-radical scavenging activity in methanolic flower extracts of R. arboreum collected from Kathmandu Valley. In comparative studies of R. arboreum and R. campanulatum flower, R. arboreum exhibits an even lower effective value of 33.6 μg/mL, which corresponds with its comparatively higher phenolic and flavonoid content among the specifically examined(Jha et al., 2024; Khatri et al., 2025). Further solvent-dependent patterns in antioxidant activity have been reported in R. arboreum flower extracts from Manma, Kalikot, as well as in three endemic Rhododendron species from Sikkim. In these studies methanolic or moderately polar extracts consistently exhibit stronger antioxidant activity than nonpolar fractions, which correspond with higher concentrations of phenolic and flavonoid compounds(Shahi et al., 2025; Shootha et al., 2022).
The methanolic extract of R1 and the ethyl acetate extract of R2, which exhibited the highest levels of flavonoid, tannin, and alkaloid, demonstrated the strongest antibacterial activity as evidenced by their larger inhibition zone and lower MIC value. These observations are each consistent with the previous reports suggesting that plant-derived polyphenols exert antibacterial effects by disrupting bacterial cell membranes and cell wall as well as by interfering with microbial adhesins and essential enzymes. This is thereby contributing to enhanced antimicrobial activity(Lone et al., 2024; Mogana et al., 2020; Niroula et al., 2024). Due to its lower polarity compared with methanol, ethyl acetate preferentially extracted moderately lipophilic flavonoids, aglycones and free phenolic acid. In contrast, methanol has a broader extraction capacity, facilitating the recovery of this compound together with more polar constituents. such as flavonoids, glycosides, tannins, and certain alkaloids. In contrast methanol has a broader extraction capacity facilitating the recovery of these compounds together with more polar constituents such as flavonoids, glycosides, tannins, and certain alkaloids(Sun et al., 2025). The relatively weaker and more variable antibacterial activity observed against the Klebsiella species compared with E. coli and Pseudomonas species may be attributed to the inherent resistance characteristic of gram-negative bacteria. Their lipopolysaccharide-rich outer membrane can act as an effective permeability barrier, limiting the entry of a relatively hydrophobic phytoconstituent. Furthermore the predominantly low MBC/MIC ratio observed across the most extract-strain combinations suggests that rhododendron extract exert mainly bactericidal effects rather than solely bacteriostatic activity in accordance with the commonly applied criterion of an MBC/MIC ratio ≤ 4 for classifying antibacterial action as bactericidal in a plant extract study. In contrast the higher MBC/MIC ratio of 8 recorded for the ethyl acetate extract of R1 against E. coli, suggesting a predominantly bacteriostatic effect against the particular strain.
Conclusion
This study shows that sequential solvent extraction of Rhododendrons flowers from two altitudinally distinct sites in Nepal's Kathmandu Valley produces a clear polarity-dependent gradient in phytochemical content, antioxidant capacity, and antibacterial activity. Methanol consistently gave the highest extraction yield and richest phytochemical profile, which translated into the strongest antioxidant activity, while ethyl acetate extracts, particularly from the lower-elevation site (R2), showed comparable or superior antibacterial potency against E. coli and Pseudomonas sp. The higher-elevation site (R1) generally showed greater total phenolic content, consistent with UV-mediated induction of phenolic biosynthesis at altitude, although flavonoid trends were less consistent across sites, pointing to additional site-specific factors beyond elevation alone. Predominantly bactericidal MBC/MIC ratios support the potential of these extracts, particularly the methanol fraction from R1 and the ethyl acetate fraction from R2, as candidate sources of natural antioxidant and antibacterial agents against the gram-negative pathogens implicated in antimicrobial resistance. Future work should expand sampling across a wider altitudinal gradient and across seasons, identify the specific bioactive compounds responsible for the observed effects through chromatographic and spectroscopic characterization, and evaluate efficacy in vivo to further establish the therapeutic potential of Rhododendrons flower extracts.
Author Contributions
A.C. (Anup Chaudhary) and A.S. (Ashirwad Shrestha) conducted most of the experimental work. A.C. (Anup Chaudhary) and A.K.C. (Anshu Kumar Chaudhary) performed the data analysis. A.K.C. (Anshu Kumar Chaudhary) took the lead in preparing the manuscript. All authors reviewed and approved the final version of this manuscript.
Funding
None.
Conflicts of Interest
The authors declare that the research was conducted without any commercial or financial relationship that could potentially be perceived as constituting a conflict of interest.
References
- 1. A.M., L., M. M., L., & S. A, A. (2019). Phytochemical Analysis and Thin Layer Chromatography Profiling of Crude Extracts from GuieraSenegalensis (Leaves). Open Access J. Chem. 2019, 3(3), 7–12. [CrossRef]
- Ashraf, M. V.; Pant, S.; Khan, M. A. H.; Shah, A. A.; Siddiqui, S.; Jeridi, M.; Alhamdi, H. W. S.; Ahmad, S. Phytochemicals as Antimicrobials: Prospecting Himalayan Medicinal Plants as Source of Alternate Medicine to Combat Antimicrobial Resistance. Pharmaceuticals 2023, 16(6), 881. [Google Scholar] [CrossRef] [PubMed]
- Baliyan, S.; Mukherjee, R.; Priyadarshini, A.; Vibhuti, A.; Gupta, A.; Pandey, R. P.; Chang, C.-M. Determination of Antioxidants by DPPH Radical Scavenging Activity and Quantitative Phytochemical Analysis of Ficus religiosa. Molecules 2022, 27(4), 1326. [Google Scholar] [CrossRef] [PubMed]
- Bello, A. A.; Katta, A.; Obaydo, R. H.; Jazmati, A. Phytochemical analysis and antioxidant efficacy of Chrysojasminum fruticans (L.) Banfi in Syrian flora. Heliyon 2024, 10(17), e37322. [Google Scholar] [CrossRef] [PubMed]
- Bibi Sadeer, N.; Montesano, D.; Albrizio, S.; Zengin, G.; Mahomoodally, M. F. The Versatility of Antioxidant Assays in Food Science and Safety—Chemistry, Applications, Strengths, and Limitations. Antioxidants 2020, 9(8), 709. [Google Scholar] [CrossRef] [PubMed]
- Boeing, J. S.; Barizão, É. O.; E Silva, B. C.; Montanher, P. F.; De Cinque Almeida, V.; Visentainer, J. V. Evaluation of solvent effect on the extraction of phenolic compounds and antioxidant capacities from the berries: Application of principal component analysis. Chem. Cent. J. 2014, 8(1), 48. [Google Scholar] [CrossRef] [PubMed]
- Chaudhary, A.; Joshi, S.; Kafle, A.; K.C., G.; Thapa, H. Antibiotic Resistance Patterns of Uropathogens Isolated from Patients with Urinary Tract Infections at Kathmandu Medical College, a Tertiary Care Hospital in Nepal. Nexus J. Interdiscip. Eng. Technol. Manag. 2026, 1(1), 17–27. [Google Scholar] [CrossRef]
- Do, Q. D.; Angkawijaya, A. E.; Tran-Nguyen, P. L.; Huynh, L. H.; Soetaredjo, F. E.; Ismadji, S.; Ju, Y.-H. Effect of extraction solvent on total phenol content, total flavonoid content, and antioxidant activity of Limnophila aromatica. J. Food Drug Anal. 2014, 22(3), 296–302. [Google Scholar] [CrossRef] [PubMed]
- Donkor, S.; Larbie, C.; Komlaga, G.; Emikpe, B. O. Phytochemical, Antimicrobial, and Antioxidant Profiles of Duranta erecta L. Parts. Biochem. Res. Int. 2019, 2019, 1–11. [Google Scholar] [CrossRef] [PubMed]
- Goud, B. J. PRELIMINARY QUALITATIVE PHYTOCHEMICAL SCREENING AND FLUORESCENCE ANALYSIS OF METHANOLIC LEAF EXTRACT OF ARTEMISIA ABSINTHIUM. n.d. [Google Scholar]
- Jaakola, L.; Hohtola, A. Effect of latitude on flavonoid biosynthesis in plants. Plant Cell Environ. 2010, 33(8), 1239–1247. [Google Scholar] [CrossRef] [PubMed]
- Jha, A. K.; Khalid, M. A.; Labh, S. N. In Vitro Antioxidant and Antibacterial Activities of Medicinal Flower Laligurans Rhododendron arboreum Collected from Kathmandu Valley, Nepal. Int. J. Food Sci. 2024, 2024(1), 6073042. [Google Scholar] [CrossRef] [PubMed]
- Khatri, D.; Poudel, A.; Ray, M. K.; Gupta, N. K.; Baral, P.; Kunwar, S.; Parajuli, S.; Purja, S.; Adhikari, S.; Tripathi, J.; Adhikari, R.; Baruwal Chhetri, S. B.; Poudel, P. Phytochemical Profiling and Antioxidant Potential of Three Rhododendron Species Collected from Mustang District, Nepal. Himal. Biodivers. 2025, 10, 100–109. [Google Scholar] [CrossRef]
- Kumar, K.; Debnath, P.; Singh, S.; Kumar, N. An Overview of Plant Phenolics and Their Involvement in Abiotic Stress Tolerance. Stresses 2023, 3(3), 570–585. [Google Scholar] [CrossRef]
- Kunwar, R. M.; Nepal, B. K.; Kshhetri, H. B.; Rai, S. K.; Bussmann, R. W. Ethnomedicine in Himalaya: A case study from Dolpa, Humla, Jumla and Mustang districts of Nepal. J. Ethnobiol. Ethnomedicine 2006, 2(1), 27. [Google Scholar] [CrossRef] [PubMed]
- Lamuela-Raventós, R. M. Folin-Ciocalteu method for the measurement of total phenolic content and antioxidant capacity. In Measurement of Antioxidant Activity & Capacity; Apak, R., Capanoglu, E., Shahidi, F., Eds.; John Wiley & Sons, Ltd., 2017; pp. 107–115. [Google Scholar] [CrossRef]
- Lone, A. S.; Ravindran, K. C.; Jeandet, P. Evaluation of antimicrobial activity and bioactive compound analysis of Verbascum thapsus L. A folklore medicinal plant. Phytomed. Plus 2024, 4(3), 100560. [Google Scholar] [CrossRef]
- Mączyńska, B.; Frej-Mądrzak, M.; Sarowska, J.; Woronowicz, K.; Choroszy-Król, I.; Jama-Kmiecik, A. Evolution of Antibiotic Resistance in Escherichia coli and Klebsiella pneumoniae Clinical Isolates in a Multi-Profile Hospital over 5 Years (2017–2021). J. Clin. Med. 2023, 12(6), 2414. [Google Scholar] [CrossRef] [PubMed]
- Mogana, R.; Adhikari, A.; Tzar, M. N.; Ramliza, R.; Wiart, C. Antibacterial activities of the extracts, fractions and isolated compounds from Canarium patentinervium Miq. Against bacterial clinical isolates. BMC Complement. Med. Ther. 2020, 20(1), 55. [Google Scholar] [CrossRef] [PubMed]
- Niroula, S.; Shyaula, S. L.; Acharya, A.; Banjara, M. R. Evaluation of Antioxidant and Antibacterial Properties of Rhododendron arboreum, Acmella calva and Trifolium repens of Nepal. Tribhuvan Univ. J. Microbiol. 2024, 11(1), 83–91. [Google Scholar] [CrossRef]
- Paudel, A.; Panthee, S.; Shakya, S.; Amatya, S.; Maiya, T.; Amatya, M. P. Phytochem. Antibact. Prop. Rhododendr. Camp. From Nepal 2011. [CrossRef] [PubMed]
- Paudel, A.; Panthee, S.; Shakya, S.; Amatya, S.; Shrestha, T.; Amatya, M. Analgesic, Anti-inflammatory and Other Pharmacological Activities of Methanol Extract of Rhododendron campanulatum from Nepal. Eur. J. Med. Plants 2016, 13(4), 1–7. [Google Scholar] [CrossRef]
- Popescu, R.; Kopp, B. The genus Rhododendron: An ethnopharmacological and toxicological review. J. Ethnopharmacol. 2013, 147(1), 42–62. [Google Scholar] [CrossRef] [PubMed]
- Razali, N.; Mat-Junit, S.; Abdul-Muthalib, A. F.; Subramaniam, S.; Abdul-Aziz, A. Effects of various solvents on the extraction of antioxidant phenolics from the leaves, seeds, veins and skins of Tamarindus indica L. Food Chem. 2012, 131(2), 441–448. [Google Scholar] [CrossRef]
- Salam, M. A.; Al-Amin, M. Y.; Salam, M. T.; Pawar, J. S.; Akhter, N.; Rabaan, A. A.; Alqumber, M. A. A. Antimicrobial Resistance: A Growing Serious Threat for Global Public Health. Healthcare 2023, 11(13), 1946. [Google Scholar] [CrossRef] [PubMed]
- Shahi, D. K.; Achhami, H.; Karki, N.; Pachhai, B. B.; Rai, E.; Gautam, D.; Neupane, D.; Regmi, S. R.; Joshi, R.; Bhatta, L. R.; Joshi, M. K. Phytochemical Properties, Antioxidant and Antimicrobial Activities, and Colorimetric pH Responsiveness of Rhododendron arboreum Sm. Flower Extract from Manma-Kalikot, Nepal. J. Inst. Sci. Technol. 2025, 30(1), 115–123. [Google Scholar] [CrossRef]
- Shootha, D.; Tripathi, D.; Singh, M.; Kumar, D.; Ercisli, S. Antioxidant, antimicrobial and phytochemical analysis of three endemic Rhododendron spp. Of Sikkim Himalaya. South Afr. J. Bot. 2022, 151, 403–412. [Google Scholar] [CrossRef]
- Sun, S.; Yu, Y.; Jo, Y.; Han, J. H.; Xue, Y.; Cho, M.; Bae, S.-J.; Ryu, D.; Park, W.; Ha, K.-T.; Zhuang, S. Impact of extraction techniques on phytochemical composition and bioactivity of natural product mixtures. Front. Pharmacol. 2025, 16, 1615338. [Google Scholar] [CrossRef] [PubMed]
Figure 1.
Heatmap illustrating the qualitative phytochemical profile of sequential Rhododendron flower extracts. Qualitative screening results were converted into numerical scores for visualization (0 = absent, 1 = weak, 2 = moderate, and 3 = strong). Increasing color intensity from white to dark red represents increasing abundance of phytochemical constituents across Hexane, Ethyl acetate, Methanol, and Aqueous extracts (R1 and R2). .
Figure 1.
Heatmap illustrating the qualitative phytochemical profile of sequential Rhododendron flower extracts. Qualitative screening results were converted into numerical scores for visualization (0 = absent, 1 = weak, 2 = moderate, and 3 = strong). Increasing color intensity from white to dark red represents increasing abundance of phytochemical constituents across Hexane, Ethyl acetate, Methanol, and Aqueous extracts (R1 and R2). .
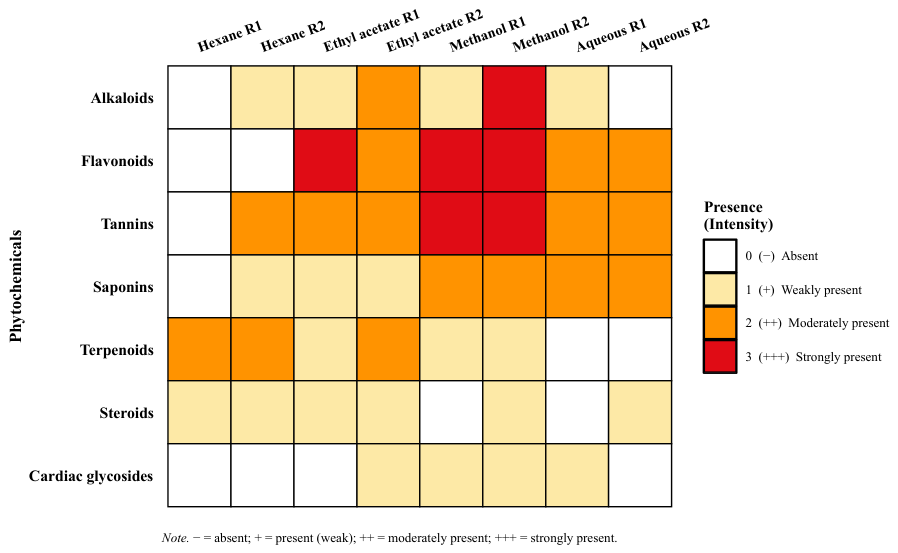
Figure 2.
Total flavonoid content (TFC, mg QE/g) (A) and total phenolic content (TPC, mg GAE/g) (B) of R1 and R2 across hexane, ethyl acetate, methanol, and aqueous extracts. Data are presented as mean ± SD; bars not sharing a common letter differ significantly (p < 0.05).
Figure 2.
Total flavonoid content (TFC, mg QE/g) (A) and total phenolic content (TPC, mg GAE/g) (B) of R1 and R2 across hexane, ethyl acetate, methanol, and aqueous extracts. Data are presented as mean ± SD; bars not sharing a common letter differ significantly (p < 0.05).
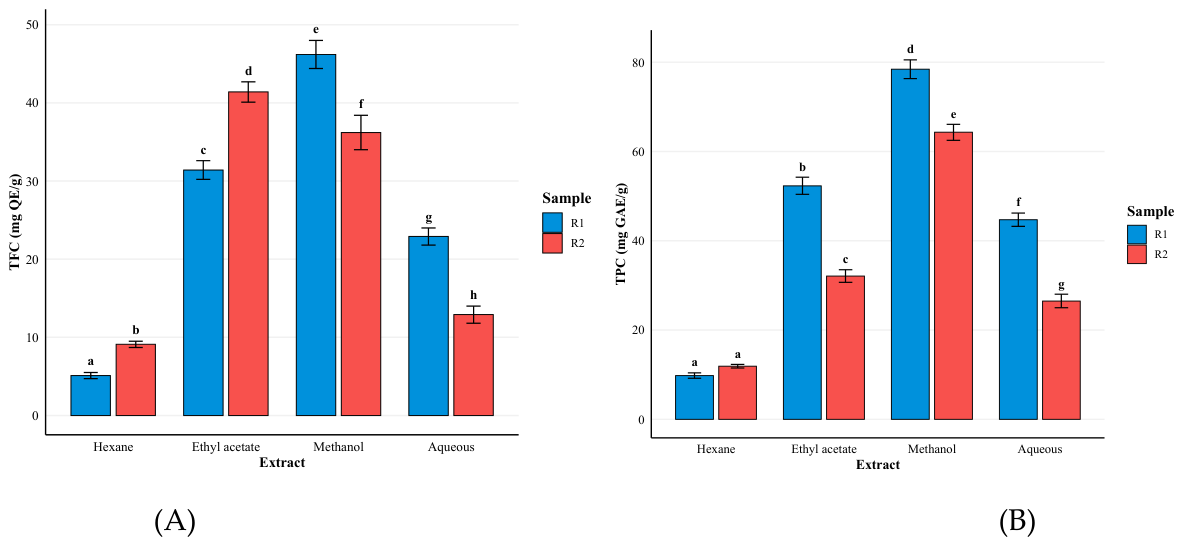
Figure 3.
Antioxidant activity of Rhododendron flower extracts determined by (A) DPPH and (B) ABTS radical scavenging assays. Bars represent the IC50 values (mean ± SD, n = 3) of R1 and R2 extracts prepared using hexane, ethyl acetate, methanol, and aqueous solvents, with ascorbic acid used as the positive control. Lower IC₅₀ values indicate stronger antioxidant activity.
Figure 3.
Antioxidant activity of Rhododendron flower extracts determined by (A) DPPH and (B) ABTS radical scavenging assays. Bars represent the IC50 values (mean ± SD, n = 3) of R1 and R2 extracts prepared using hexane, ethyl acetate, methanol, and aqueous solvents, with ascorbic acid used as the positive control. Lower IC₅₀ values indicate stronger antioxidant activity.
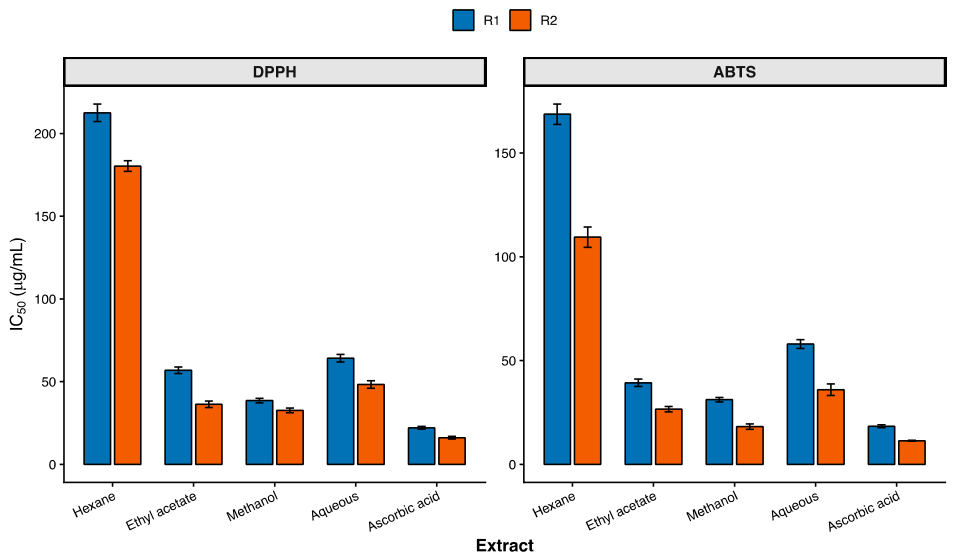
Figure 4.
Antibacterial activity of R1 and R2 extracts against E. coli, Klebsiella sp., and Pseudomonas sp., expressed as zone of inhibition (mm). (A) Methanol extracts; (B) ethyl acetate extracts. Data are presented as mean ± SD (n = 3).
Figure 4.
Antibacterial activity of R1 and R2 extracts against E. coli, Klebsiella sp., and Pseudomonas sp., expressed as zone of inhibition (mm). (A) Methanol extracts; (B) ethyl acetate extracts. Data are presented as mean ± SD (n = 3).
Figure 5.
Agar well diffusion assay showing zones of inhibition produced by methanolic Rhododendron spp. flower extracts. (A) Rhododendron spp. (R1) extract against Klebsiella sp.; (B) Rhododendron spp. (R2) extract against E. coli.
Figure 5.
Agar well diffusion assay showing zones of inhibition produced by methanolic Rhododendron spp. flower extracts. (A) Rhododendron spp. (R1) extract against Klebsiella sp.; (B) Rhododendron spp. (R2) extract against E. coli.
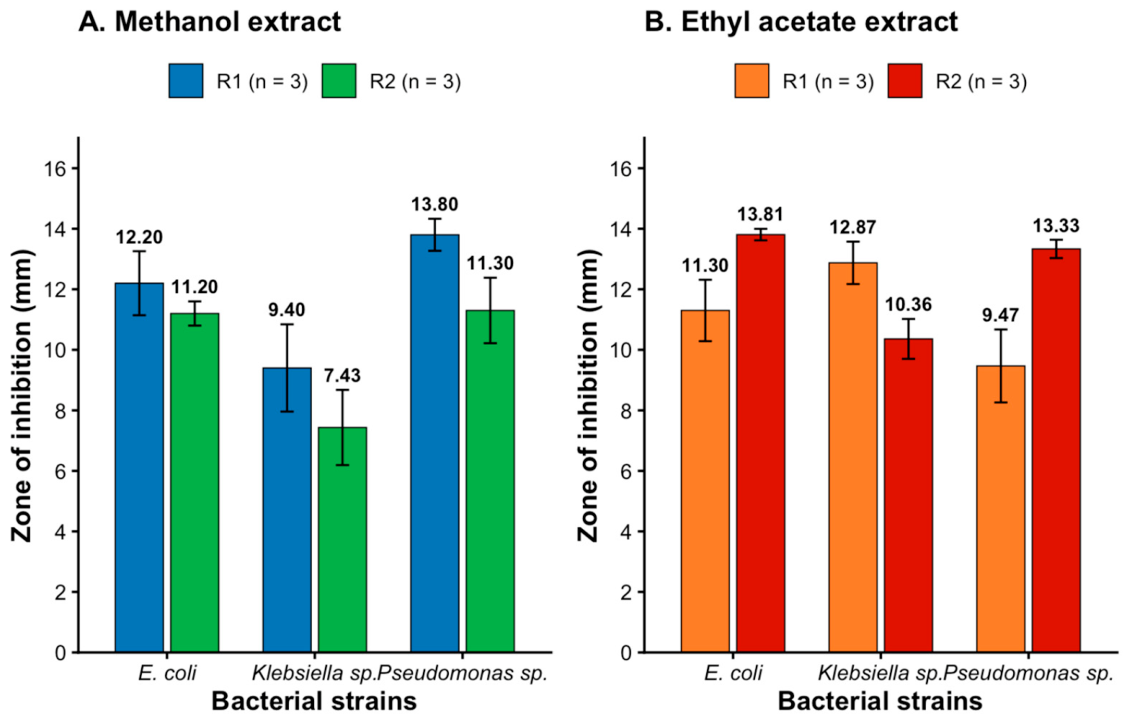

Table 1.
Extraction yield of rhododendron flower extracts obtained by successive solvent extraction.
Table 1.
Extraction yield of rhododendron flower extracts obtained by successive solvent extraction.
| Parameter | R1 | R2 |
| Initial dried flower powder (g) | 47.26 | 53.42 |
| Hexane extract (g) | 0.31 | 0.42 |
| Ethyl acetate extract (g) | 1.28 | 1.42 |
| Methanol extract (g) | 5.10 | 4.90 |
| Aqueous extract (g) | 1.93 | 2.41 |
| Total crude extract (g) | 8.62 | 9.15 |
| Extraction yield (%) | 18.23 | 17.12 |
Table 2.
Minimum inhibitory concentrations (MICs) of Rhododendron flower extracts against selected bacterial strains.
Table 2.
Minimum inhibitory concentrations (MICs) of Rhododendron flower extracts against selected bacterial strains.
| Extract | E. coli | Klebsiellasp. | Pseudomonassp |
| Methanol (R1) | 25 | 50 | 50 |
| Ethyl acetate (R1) | 12.5 | 25 | 25 |
| Methanol (R2) | 50 | 50 | >100 |
| Ethyl acetate (R2) | 25 | 25 | 50 |
Table 3.
Minimum bactericidal concentrations (MBCs) of Rhododendron flower extracts against selected bacterial strains.
Table 3.
Minimum bactericidal concentrations (MBCs) of Rhododendron flower extracts against selected bacterial strains.
| Extract | E. coli | Klebsiellasp. | Pseudomonassp. |
| Methanol (R1) | 100 | 100 | >100 |
| Ethyl acetate (R1) | 100 | 100 | 50 |
| Methanol (R2) | 100 | 100 | >100 |
| Ethyl acetate (R2) | 50 | 100 | 100 |
Disclaimer/Publisher’s Note: The statements, opinions and data contained in all publications are solely those of the individual author(s) and contributor(s) and not of MDPI and/or the editor(s). MDPI and/or the editor(s) disclaim responsibility for any injury to people or property resulting from any ideas, methods, instructions or products referred to in the content. |
© 2026 by the authors. Licensee MDPI, Basel, Switzerland. This article is an open access article distributed under the terms and conditions of the Creative Commons Attribution (CC BY) license (http://creativecommons.org/licenses/by/4.0/).
Copyright: This open access article is published under a Creative Commons CC BY 4.0 license, which permit the free download, distribution, and reuse, provided that the author and preprint are cited in any reuse.