
Submitted:
24 August 2026
Posted:
25 August 2026
You are already at the latest version
Abstract
Coal mining in Zimbabwe significantly contributes to its economy, but it harms the environment by releasing toxic elements. We investigated the bioconcentration of harmful elements in the Hwange coal mining area in order to ascertain the efficacy of the aquatic plant Typha latifolia in bioaccumulating various toxic elements. Water, plant and sediment samples were collected during dry and wet seasons from 4 sites and physico-chemical parameters of water were measured on-site. A pH range of 1.79 - 8.32 and 2.13 – 6.56 was observed during the wet and dry season respectively. Elevated TDS and conductivity levels were observed with a site recording figures of 1.20 ppt and 2.41 mS/cm respectively. The samples were analysed for copper, lead, zinc and cadmium concentration and the bioconcentration factor of toxic elements from sediment to plants. Copper and zinc concentrations observed were higher in the wet season compared to the dry season for plant samples. In contrast, water and sediment samples had higher concentrations of copper and zinc in the dry season compared to the wet season. The study showed the lowest bioconcentration factors of zinc, while the highest bioconcentration factors were for lead and cadmium. In summary, this study verified Typha latifolia’s capacity to accumulate cadmium from the environment and its ability to accumulate lead, which may be enhanced by changes in environmental conditions.
Keywords:
bioconcentration
; heavy metals
; aquatic plants
; coal mining
1. Introduction
Coal plays a crucial role in electricity generation as well as driving industrial processes globally. It contributes to the socio-economic development of many nations. As such, economic growth correlates with an increase in coal production [1]. However, coal mining puts enormous pressure on the natural environment resulting in the natural habitats and ecosystem being negatively affected. Coal is composed of some potentially harmful components that are released into the environment during its production. Coal mining uses copious amounts of water which is a major source of toxic elements in the environment when disposed of [2]. During the process of coal mining, toxic elements such as cadmium, lead, mercury, zinc, sulphur, and copper and iron are released into the environment and contribute to its pollution and degradation [3]. The dissemination of toxic elements into the environment is mainly caused by acid mine drainage which results in the dissolution of metal ions [4]. Toxic elements are a hazard to the environment particularly in the aquatic system where pollutants affect both terrestrial and aquatic organisms.
Aquatic plants take up toxic elements in the environment. These can either cause physiological and metabolic changes which can be lethal or can be bioaccumulated and tolerated. Hence their ability to take up toxic elements has been used as a bioindicator of pollution in aquatic environments [5]. The ability of aquatic plants to accumulate and tolerate toxic elements has made them a possible solution for mitigating environmental pollution. Literature has shown that different plant species have different bioaccumulation factors depending on the element(s) in question [5]. Most plants concentrate toxic elements in the roots and restrict movement to shoots, [3].
This study aimed to determine the effectiveness in bioaccumulation of different toxic elements of the aquatic plant Typha latifolia mostly found in the study area. Since many toxic elements are released into the environment, there is a need to remediate the area using plants endemic in the natural environment.
It was thought that determining the efficiency in bioaccumulation of metals in a plant native to the area would go a long way in finding a non-invasive and affordable solution.
2. Materials and Methods
2.1. Sampling and Physical Parameter Analysis
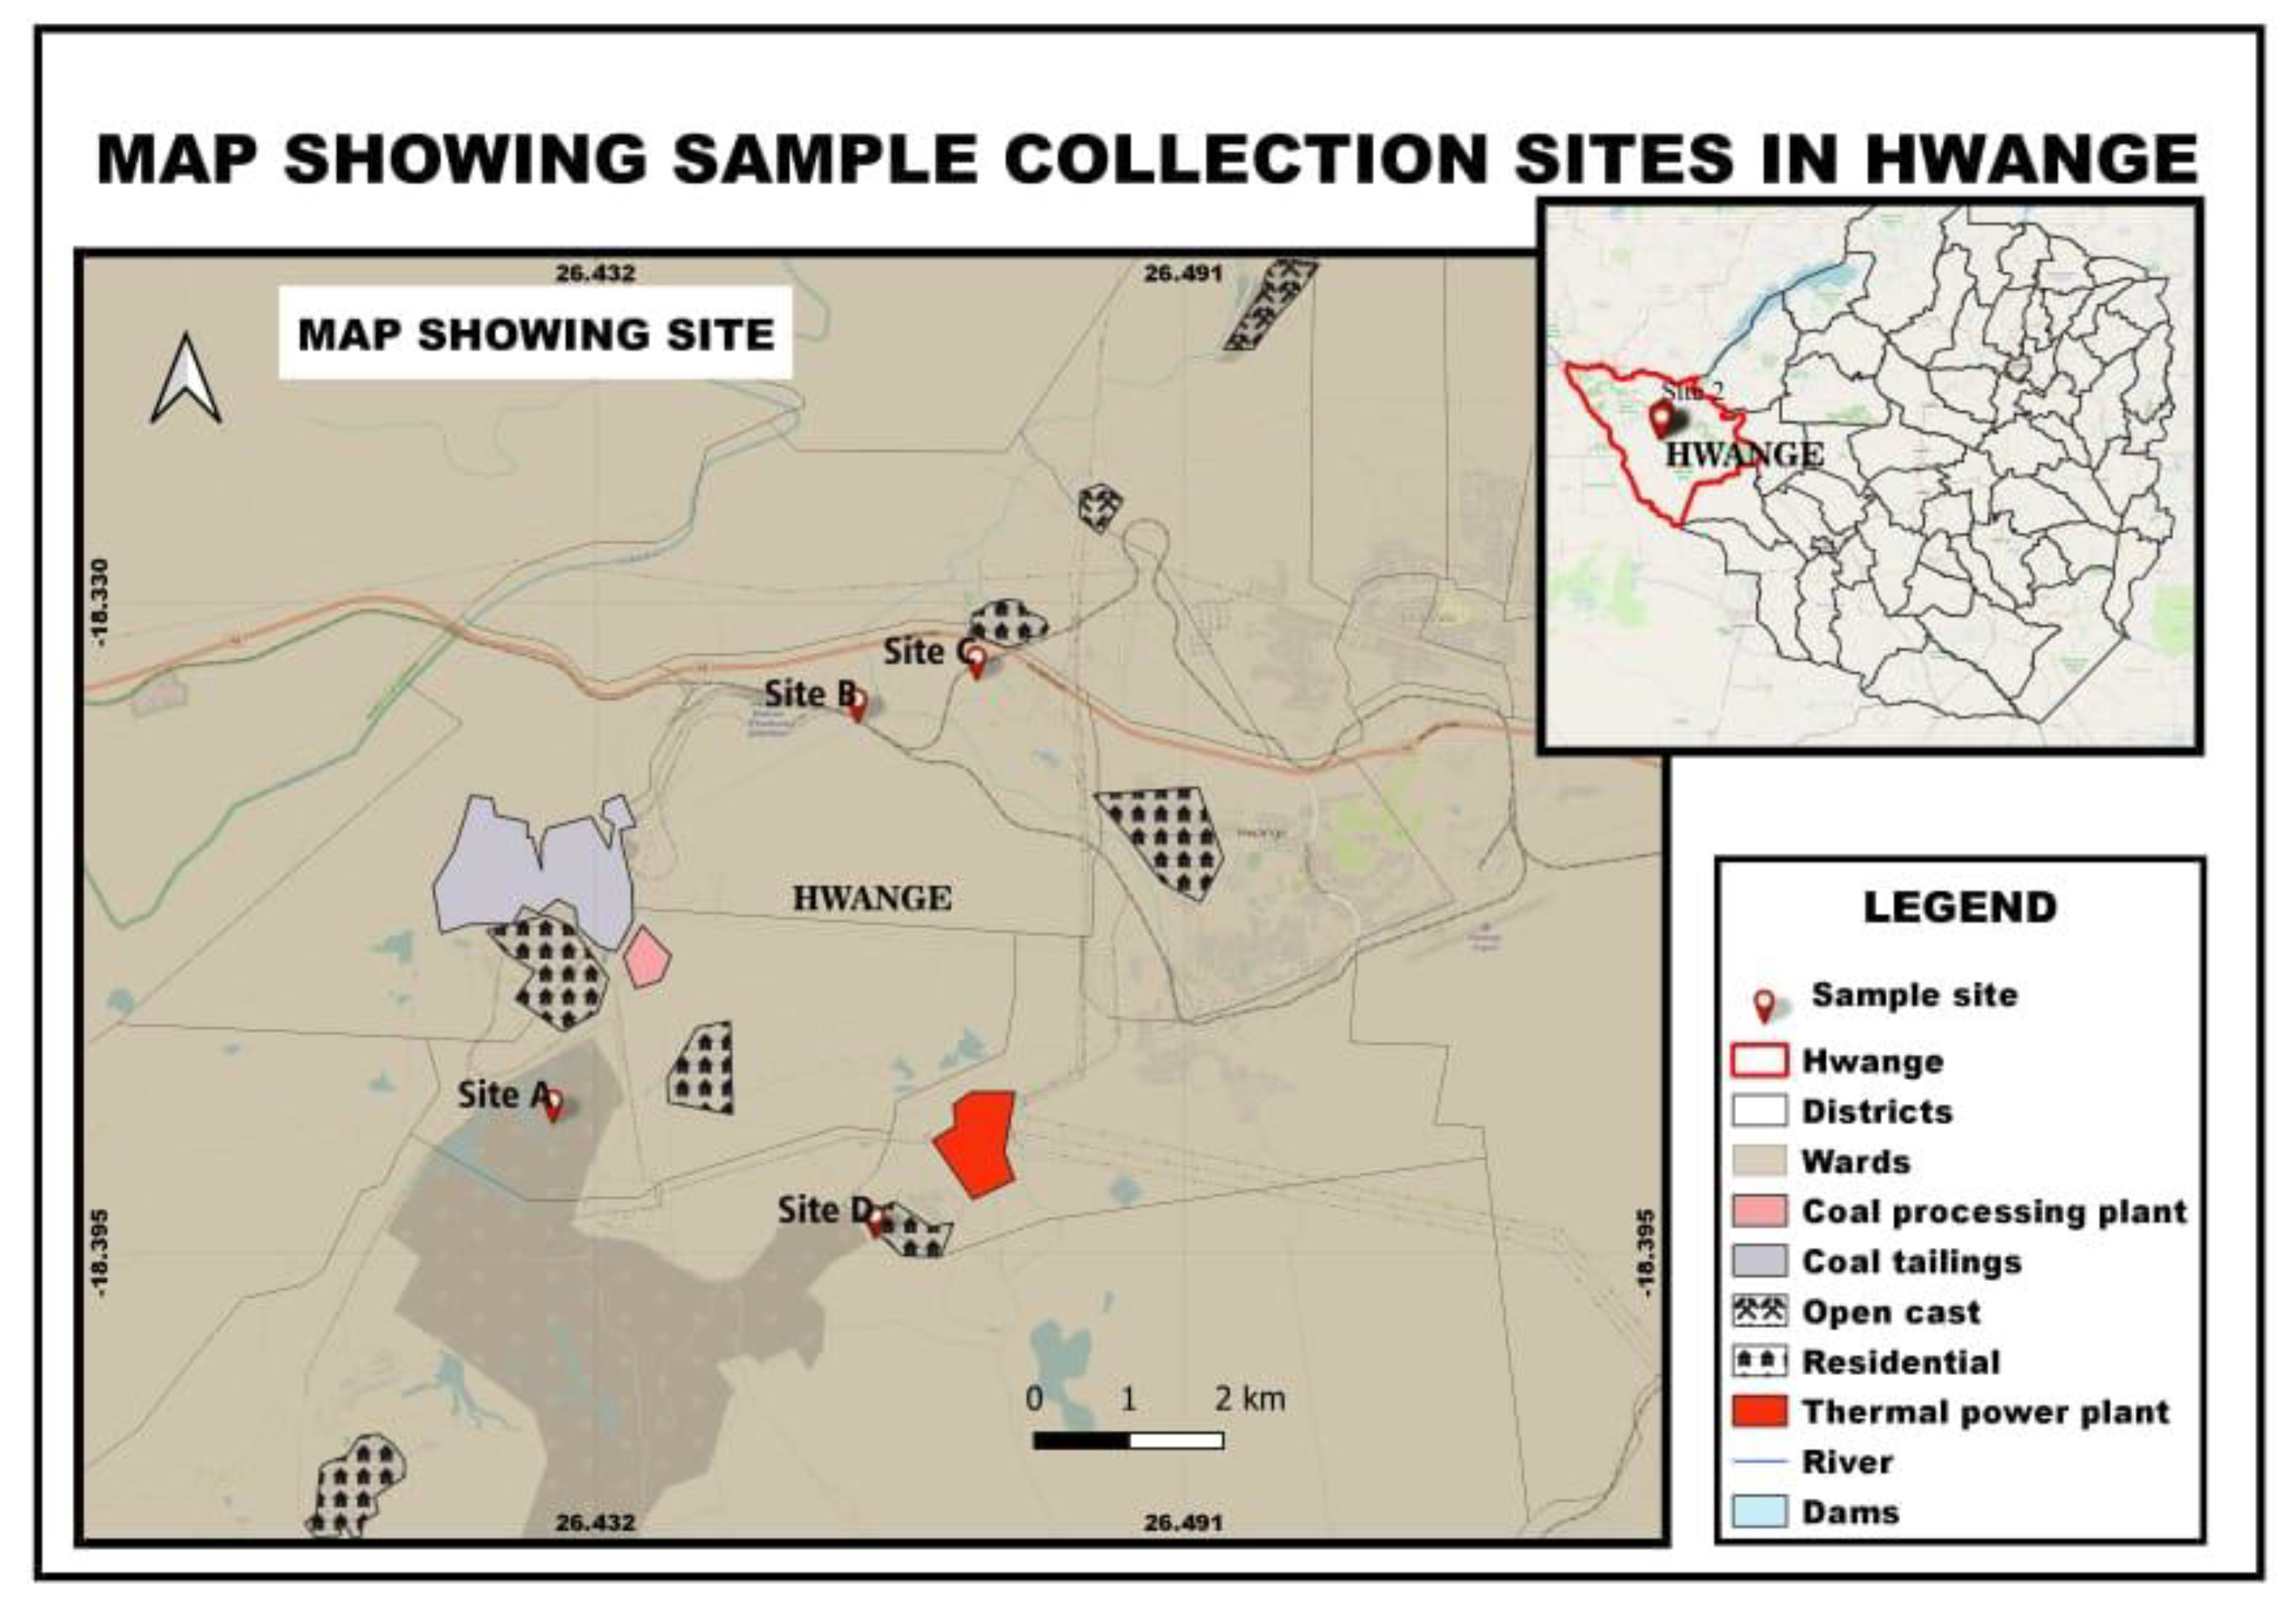
Water, sediment and plant samples were collected in triplicate from four sampling points during the wet and dry seasons and these were assigned as follows; Site A was effluent from an open cast mine, Site B was upstream of a coal processing plant, Site C was underground acid rock drainage point and Site D was effluent from a power production plant. One litre glass reagent bottles were used for water samples whilst polythene bags were used for sediment and plant samples. Sampling was carried out during the wet and dry seasons. Municipal water from Hwange was used as a control. Temperature, pH, conductivity and total dissolved solids parameters were measured at each site.
Figure 1.
Map showing sampling collection sites in Hwange.
2.2. Heavy Metal Analysis
2.2.1. Plants
Two grams of dry plant leaf samples were weighed, ground and placed in 50 ml beakers. The samples were allowed to stand overnight in 5 ml of 55% HNO3. The samples were heated carefully on a hot plate at 80oC for an hour until the production of red NO2 fumes had ceased. The temperature was increased to 120oC and samples were heated for another hour. One millilitre of H2O2 was added and heated for an hour at 120oC. Samples were allowed to cool and 1 ml of 32% HCl was added. The digests were filtered using a Whatman 40-micron filter paper and made up to 50 ml using distilled water [6]. The digests were then analysed using an atomic absorption spectrometer.
2.2.2. Water
The water samples were filtered using a Whatman 40-micron filter paper and then kept in the refrigerator for metal analysis.
2.2.3. Sediment
The sediment samples were oven dried at 100oC for 12 hours. The dried sediment from each site was pulverized using pestle and mortar and 1 g was weighed and added to 100 ml beakers. The weighed samples were digested in 1 ml distilled water, 12 ml 32% m/m HCl, 4 ml 55% HNO3 at 140oC and left to reflux for about 20 minutes. Five millilitres of distilled water were then run down the side of the respective beakers and the solutions were refluxed for a further 10 minutes. The resultant solutions were transferred to 100 ml volumetric flasks and diluted to 100 ml with distilled water [7].
3. Results
3.1. Physico Chemical Analysis of Water Samples
The physico chemical results of water samples are shown in Table 1. Elevated conductivity and total dissolved solids levels were observed in water collected from Site C (underground acid rock drainage point), whilst low pH was observed when compared to other sites and the control during both the dry and wet season. No significant difference was observed in the pH values during the dry and wet season for Sites A, B, D and the control. A significant difference in conductivity and total dissolved values were observed between the control site and all sites for both the dry and wet seasons.
3.2. Heavy Metal Analysis of Water
Table 2 shows heavy metal concentration in water samples. Site C (underground acid rock drainage point) exhibited high levels of zinc (540 mg/ml) during the wet season and 535 mg/ml during the dry season, whilst Site B (upstream of a coal processing plant) had elevated levels of copper (270 mg/ml) and cadmium (72 mg/ml) during the dry season. Site B had statistically significant higher concentrations for all metals in the dry season compared to the wet season.
3.3. Heavy Metal Analysis of Sediment
Heavy metal concentration levels in sediment are shown in Table 3. High concentrations of zinc were observed at all sites for both seasons and only Site D (underground acid rock drainage point) exhibited high levels of lead during both seasons. Statistically significant differences were observed for zinc levels among all sites, whilst lead concentrations for Site D were significantly different compared to Sites A, B and C.
3.4. Heavy Metal Concentration and Bioconcentration Factors of Aquatic Plants
Concentrations of heavy metals in plants and their bioconcentration factors are shown in Table 4. High bioaccumulation factors were observed for cadmium for all sites and lead for Sites A, B and C.
4. Discussion
Aquatic plants can take up large amounts of metals from water and/or sediment through active and passive absorption, through different organs such as roots, stems, and leaves. Metals like lead are introduced in aquatic ecosystems as effluent from mining and industrial activities. Literature shows that metals induce oxidative stress in cells of living organisms which results from an imbalance between the generation and elimination of reactive oxygen species [8,9].
The order of metal concentration in aquatic plants was Zn > Pb > Cu > Cd with plants collected from Site D (effluent from a power production plan) exhibiting the highest metal concentrations (Table 2). Plant samples collected during the wet season showed elevated copper and zinc concentrations compared to those collected during the dry season. A study by D’ Souza et al., (2013) showed that the uptake of metals as well as the degree of tolerance by plants is dependent on the bioavailability of the metals, plant species and their metabolism. In another study Amin et al., (2018) concluded that high concentrations of lead in plant tissue correlate to the concentration in the growing environment. The ability of aquatic plants to take up heavy metals is also dependent on whether it is submerged, floating or emerging, with submerged plants bioaccumulating higher concentrations of metals [12]. According to Baker and Walker (1990), plants are classified into three groups of heavy metal accumulation; metal excluders, indicators and accumulators or hyperaccumulators. Metal excluders limit the levels of metals taken up by the plant and maintain low concentrations in the shoots whilst metal indicators take up metal concentrations in plant tissue above the ground that reflect the metal levels in the soil. Metal accumulators are plants that bioaccumulate metals in the above ground tissue resulting in levels that exceed the concentration levels currently in the soil [14]. The classification of the plants in the current study differs with different metals. They may be classified as hyperaccumulators as cadmium had high bioaccumulation factors compared to other metals followed by Pb (Table 4). This is in agreement with the study by Mojiri and colleagues (2013) who observed Typha domingensis as an effective accumulator of Pb, Cd and Ni. This may be a result of the mobility of the metals in soil, hence it is readily available for uptake by plants [16]. The plant may be further classified as a metal excluder as the bioaccumulation factor of copper observed for all sites except for Sites A and C during the wet season is below one. This may be as a result of regulation of uptake of copper by plants as it is toxic in high concentrations [16]. Although the plants showed high concentration of zinc, they had low bioaccumulation factors compared to other metals with the exception of plants collected from Site D in the wet season.
The diversity, population and productivity of aquatic organisms is affected by the abiotic factors of an aquatic body [12]. In the current study, water collected from Site C was acidic (pH of 1.96) with high levels of total dissolved solids and electrical conductivity. This site consequently had elevated levels of zinc. However, the plant used in the study had a low bioaccumulation factor for zinc. A study by Li et al., 2015 concluded that uptake of metals by plants is facilitated by slightly acidic water with a pH range of 5.6 – 6.5. The low bioaccumulation factor may be due to a pH lower than the optimum required for metal availability to plants [17].
Further studies need to be carried out to determine whether the bioaccumulation factor for Zn and Cu can be increased by altering environmental conditions.
Acknowledgments
This work was supported by funds from the International Science Program, Uppsala University Sweden. Support from the Ecotoxicology Research Group and Applied Biology and Biochemistry Department of the National University of Science and Technology Zimbabwe was much appreciated.
Declaration of interest statement
The corresponding author would like to declare on behalf of the authors that there is no conflict of interest or any other statements to make.
References
- International Energy Agency. Coal 2022: Analysis and Forecast to 2025. 2022. Available online: www.iea.org (accessed on 21 November 2023).
- Yang, J.; Guo, L. Dynamic Evaluation of Water Utilization Efficiency in Large Coal Mining Area Based on Life Cycle Sustainability Assessment Theory. Geofluids 2021, 2021, 1–20. [Google Scholar] [CrossRef]
- Singh, R.; Venkatesh, A. S.; Syed, T. H.; Reddy, A. G. S.; Kumar, M.; Kurakalva, R. M. Assessment of potentially toxic trace elements contamination in groundwater resources of the coal mining area of the Korba Coalfield, Central India. Environ. Earth Sci. 2017, 76, 1–17. [Google Scholar] [CrossRef]
- Change, J. B.; Siwela, A. H.; Basopo, N. Biochemical effects of effluent pollutants from coal mining activities on the freshwater snails, Helisoma duryi. J. Environ. Chem. Toxicol. 2020, 4(2), 1–4. [Google Scholar]
- Muliyadi, M.; Purwanto, P.; Sumiyati, S.; Mussadun, M. Bioaccumulation of heavy metals using aquatic plants in wastewater. Int. J. Public Health Sci. 2023, 12(2), 690–698. [Google Scholar] [CrossRef]
- Corns, W.T.; Chen, B.; Stockwell, P. B. Mercury Speciation and Total Mercury in fish and Seafood and Seafood products. 2014. Available online: www.psanalytical.com.
- Millennium Merlin User’s Manual. 2013. Version 10.0 P S Analytical Ltd. Stockwell, M. A. and P. B. Stockwell. Method for mercury in sludge, soils and sediments. Arthur House, Orpington, Kent BR5 3HP UK. Retrieved on May 24 2015 from www.psanalytical.com.
- Patra, R.C.; Rautray, A. K.; Swarup, D. Oxidative Stress in Lead and Cadmium Toxicity and Its Amelioration. Vet. Med. Int. J. 2011, 457327. [Google Scholar]
- Basopo, N.; Ngabaza, T. Toxicological Effects of Chlorpyrifos and Lead on the Aquatic Snail Helisoma duryi. Adv. Biol. Chem. 2015, 5, 225–233. [Google Scholar]
- D’Souza, R.; Varun., M.; Pratas, J.; Paul, M. S. Spatial distribution of heavy metals in soil and flora associated with the glass industry in North Central India: Implications for phytoremediation. Soil Sediment Contam. An. Int. J. 2013, 22, 1–20. [Google Scholar] [CrossRef]
- Amin, H.; Arain, B. A.; Jahangir, T. M.; Abbasi, M. S.; Amin, F. Accumulation and distribution of lead (Pb) in plant tissues of guar (Cyamopsis tetragonoloba L.) and sesame (Sesamum indicum L.): profitable phytoremediation with biofuel crops. Geol. Ecol. Landsc. 2018, 2(1), 51–60. [Google Scholar] [CrossRef]
- Bai; L.; X; Liu.; J. Hu.; J. Li.; Z. Wang.; Han; G.; S. Li.; Liu, C. Heavy Metal Accumulation in Common Aquatic Plants in Rivers and Lakes in the Taihu Basin. Int. J. Environ. Res. Publ. Health 2018, 15(2857), 1–12. [Google Scholar] [CrossRef]
- Baker, A. J. M.; Walker, P. L. Ecophysiology of metal uptake by tolerant plants: Heavy metal tolerance in plants. In Evolutionary Aspects; Shaw, A.J., Ed.; CRC Press: Boca Raton, 1990. [Google Scholar]
- Mganga, N.; Manoko, M. L. K.; Rulangaranga, Z. K. Classification of plants according to their heavy metal content around North Mara gold mine, Tanzania: Implication for phytoremediation. Tanzan. J. Sci. 2011, 37, 109–119. [Google Scholar] [CrossRef]
- Mojiri, A.; Aziz., H. A.; Zahed., M. A.; Aziz., S.Q.; Razip., M.; Selamat, B. Phytoremediation of Heavy Metals from Urban Waste Leachate by Southern Cattail (Typha domingensis). Int. J. Sci. Res. Environ. Sci. 2013, 1(4), 63–70. [Google Scholar] [CrossRef]
- Li, J.; Yu, H.; Luan, Y. Meta-Analysis of the Copper, Zinc, and Cadmium Absorption Capacities of Aquatic Plants in Heavy Metal-Polluted Water. Int. J. Environ. Res. Publ. Health 2015, 12, 14958–14973. [Google Scholar] [CrossRef]
- Zeng; F.; S. Ali.; H. Zhang.; Y Ouyang.; B. Qiu.; F. Wu.; Zhang, G. The Influence of pH and Organic Matter Content in Paddy Soil on Heavy Metal Availability and their Uptake by Rice Plants. Environ. Pollut. J. 2011, 159, 84–91. [Google Scholar] [CrossRef]

Table 1.
Physico chemical parameters of water samples (values are means ± SD of 3 replicates).
| pH Dry Wet |
Temperature (OC) Dry Wet |
Conductivity (µS/cm) Dry Wet |
Total Dissolved Solid (ppm) Dry Wet |
|||||
| Site A (open cast mine effluent) |
6.56ac ± 0.47 |
8.14b ± 0.02 |
14.2a ± 0.22 |
16.8a ± 0.0 |
1170.0a ± 73.0 |
795.0b ± 6.4 |
554.5a ± 0.5 |
398.0b ± 2.0 |
| Site B (upstream of a coal processing plant) |
6.12a ± 0.77 |
7.07bc ± 0.18 |
19.6b ± 0.64 |
20.2b ± 0.0 |
309.0c ± 5.7 |
291.3c ± 19.1 |
158.0cf ± 5.9 |
145.3c ± 9.5 |
| Site C (underground acid rock drainage point) |
2.13d ± 0.14 |
1.79d ± 0.16 |
16.6a ± 0.3 |
16.6a ± 0.3 |
2410.0d ± 16.3 |
2350.0d ± 149.9 |
1200.0d ± 20.0 |
1125.0e ± 5.0 |
| Site D (effluent from a power production plant) |
5.77a ± 0.01 |
8.32b ± 0.09 |
22.4b ± 0.29 |
20.7b ± 3.4 |
253.0c ± 2.5 |
336.3c ± 13.9 |
127.5c ± 0.5 |
172.7cf ± 6.1 |
| Control (municipal water) |
5.84a ± 0.0 |
7.12bc ± 0.12 |
23.7b ± 0.29 |
31.7c ± 0.1 |
64.9e ± 7.6 |
64.8e ± 0.14 |
32.4g ± 4.2 |
35.1g ± 4.0 |
Sites with different alphabetical letters, within columns for each parameter and season, indicate that means are significantly different, p >0.01(2-Way Anova).
Table 2.
Heavy metal concentration in water samples (mg/l) collected from different sites at a Hwange Coal Mining area. (All values are means ± SD of 2-3 replicates).
Table 2.
Heavy metal concentration in water samples (mg/l) collected from different sites at a Hwange Coal Mining area. (All values are means ± SD of 2-3 replicates).
| Sampling site | ||||||||
| Heavy metal |
Site A (open cast mine effluent) Dry Wet |
Site B (upstream of a coal processing plant) Dry Wet |
Site C (underground acid rock drainage point) Dry Wet |
Site D (effluent from a power production plant) Dry Wet |
||||
| Cu | 4.8a ± 0.2 |
13.1a ± 0.3 |
270.0b ± 22.4 |
15.1a ± 0.3 |
33.5c ± 0.1 |
12.8a ± 0.2 |
34.0c ± 0.3 |
7.4a ± 0.3 |
| Pb | 10.9a ± 0.1 |
8.4b ± 0.0 |
50.4c ± 1.0 |
8.0b ± 0.2 |
7.1bd ± 0.2 |
24.0e ± 0.3 |
4.5f ± 0.1 |
10.7a ± 0.1 |
| Zn | 5.7a ± 0.1 |
6.1a ± 0.1 |
50.6b ± 0.2 |
13.7c ± 0.1 |
540.0d ± 4.9 |
535.0d ± 3.8 |
31.3e ± 0.1 |
7.6a ± 0.1 |
| Cd | 5.7a ± 1.0 |
1.4b ± 0.1 |
72.1c ± 0.3 |
0.9b ± 0.1 |
3.9d ± 0.1 |
2.2e ± 0.1 |
1.1b ± 0.1 |
1.2b ± 0.1 |
Sites with different alphabetical letters, within rows for each element and different season, indicate that means are significantly different, p <0.01(2-Way Anova).
Table 3.
Heavy metal concentration of sediment samples (mg/kg) collected from different sites at a Hwange Coal Mining area. (All values are means ± SD of 2-3 replicates).
Table 3.
Heavy metal concentration of sediment samples (mg/kg) collected from different sites at a Hwange Coal Mining area. (All values are means ± SD of 2-3 replicates).
| Sampling site | ||||||||
| Heavy metal |
Site A (open cast mine effluent) Dry Wet |
Site B (upstream of a coal processing plant) Dry Wet |
Site C (underground acid rock drainage point) Dry Wet |
Site D (effluent from a power production plant) Dry Wet |
||||
| Cu | 31.0a ± 0.6 |
19.0b ± 0.4 |
70.0c ± 0.3 |
34.0a ± 0.4 |
47.0d ± 0.3 |
27.0ae ± 0.3 |
77.0f ± 3.2 |
76.0f ± 4.6 |
| Pb | 58.0a ± 3.0 |
45.0b ± 2.8 |
60.0a ± 0.0 |
16.0c ± 0.0 |
92.0d ± 2.8 |
83.0d ± 7.3 |
381.0e ± 1.5 |
369.0f ± 3.7 |
| Zn | 11250.0a ± 22.5 | 9260.0b ± 125.0 |
8600.0c ± 133.3 |
4030.0d ± 82.2 |
10950.0a ± 341.6 | 7900.0e ± 152.5 |
10050.0f ± 40.2 | 6530.0g ± 101.9 |
| Cd | 1.6a ± 0.0 |
1.1b ± 0.3 |
1.2a ± 0.2 |
1.1b ± 0.0 |
2.2c ± 0.3 |
0.6d ± 0.0 |
1.2a ± 0.0 |
0.6d ± 0.0 |
Sites with different alphabetical letters, within rows for each element and different seasons, indicate that means are significantly different, p <0.01(2-Way Anova).
Table 4.
Heavy metal concentrations in aquatic plants (mg/kg) and their bioconcentration factors. (All values are means ±SD of 2-3 replicates) Figures in parenthesis are bioconcentration factors based on metal concentration in sediment.
Table 4.
Heavy metal concentrations in aquatic plants (mg/kg) and their bioconcentration factors. (All values are means ±SD of 2-3 replicates) Figures in parenthesis are bioconcentration factors based on metal concentration in sediment.
| Sampling site | ||||||||
| Heavy metal | Site A (open cast mine effluent) Dry Wet |
Site B (upstream of a coal processing plant) Dry Wet |
Site C (underground acid rock drainage point) Dry Wet |
Site D (effluent from a power production plant) Dry Wet |
||||
| Cu | 16.0a ± 0.2 (0.5) |
18.2b ± 0.2 (1.0) |
21.7c ± 0.5 (0.3) |
22.5c ± 0.6 (0.7) |
25.0d ± 0.2 (0.5) |
26.3e ± 0.3 (1.0) |
20.0f ± 0.4 (0.30) |
32.6g ± 0.4 (0.4) |
| Pb | 103.6a ± 0.6 (2.0) |
36.6b ± 0.6 (0.8) |
91.2c ± 5.4 (1.5) |
285.6d ± 3.4 (18.0) |
68.2e ± 0.5 (0.7) |
113.6f ± 3.1 (1.4) |
141.6g ± 0.8 (0.4) |
118.8f ± 0.4 (0.3) |
| Zn | 570.0a ± 5.7 (0.1) |
660.0b ± 9.9 (0.1) |
540.0a ± 6.5 (0.1) |
710.0c ± 13.5 (0.2) |
530.0da ± 8.0 (0.1) |
550.0a ± 20.4 (0.1) |
600.0e ± 0.0 (0.1) |
3740.0f ± 18.7 (0.6) |
| Cd | 2.0a ± 0.1 (1.3) |
2.5b ± 0.1 (2.3) |
3.0c ± 0.1 (2.5) |
1.6d ± 0.1 (1.5) |
4.4e ± 0.0 (2.0) |
1.9a ± 0.0 (3.2) |
2.1a ± 0.1 (1.8) |
21.1f ± 0.1 (35.2) |
Sites with different alphabetical letters, within rows for each element and different seasons, indicate that means are significantly different, p <0.01(2-Way Anova).
Disclaimer/Publisher’s Note: The statements, opinions and data contained in all publications are solely those of the individual author(s) and contributor(s) and not of MDPI and/or the editor(s). MDPI and/or the editor(s) disclaim responsibility for any injury to people or property resulting from any ideas, methods, instructions or products referred to in the content. |
© 2026 by the authors. Licensee MDPI, Basel, Switzerland. This article is an open access article distributed under the terms and conditions of the Creative Commons Attribution (CC BY) license (http://creativecommons.org/licenses/by/4.0/).
Copyright: This open access article is published under a Creative Commons CC BY 4.0 license, which permit the free download, distribution, and reuse, provided that the author and preprint are cited in any reuse.