
Submitted:
25 August 2026
Posted:
25 August 2026
You are already at the latest version
Abstract
Vitamin E is an essential dietary nutrient, yet deficiency affects large populations, especially in ricedependent developing countries. To dissect the genetic basis of grain vitamin E content in rice, we performed a genomewide association study (GWAS) on a diverse panel of 533 rice accessions. A major locus, VEQ2, was identified on chromosome 2, where the CC genotype significantly increased αtocopherol content compared with the TT genotype. We developed a kompetitive allelespecific PCR (KASP) marker for VEQ2 and validated its effect in an F₂ population derived from Baikezaohe (TT) and AKITAKOMACHI (CC), confirming semidominant inheritance. Through markerassisted backcrossing, we introgressed VEQ2 into an elite indica background, generating nearisogenic lines. The CC introgression lines exhibited α-tocopherol and α-tocotrienol levels that were approximately 1.86- and 5.28-fold those of the control, respectively, accompanied by reduced β-tocopherol, whereas the TT lines displayed the opposite metabolic profile, with no significant penalties in agronomic traits. Analysis of 4,726 accessions revealed strong subspecies differentiation: TT was predominant in indica (84.2%), whereas CC was nearly fixed in japonica (99.5%). Collectively, these findings demonstrate that VEQ2 serves as a key genetic switch modulating the rice vitamin E metabolic profile and represents a promising target for biofortification of indica rice without compromising yield.
Keywords:
rice
; vitamin E
; α-tocopherol
; VEQ2
; genome-wide association study
; marker-assisted selection
; biofortification
; near-isogenic line
1. Introduction
Vitamin E comprises a group of lipid-soluble antioxidants that are ubiquitously distributed in plant seeds, leaves, and animal tissues. In plants, it plays essential roles in stress tolerance, maintenance of photosynthetic membrane integrity, and seed longevity [1,2]. In humans, vitamin E protects cellular membranes from lipid peroxidation and modulates multiple signaling pathways—through regulation of gene and protein expression—that are involved in lipid homeostasis, inflammation, cell survival/apoptosis, angiogenesis, tumorigenesis, neurodegeneration, and senescence [3,4]. Since humans lack the ability to synthesize vitamin E de novo, it must be obtained from dietary sources. However, approximately 64% of the global population suffers from inadequate vitamin E intake, with rice-dependent developing countries being particularly affected [5]. In addition, the global market for vitamin E as an animal feed additive is valued at approximately USD 574.4 million [6]. Therefore, elucidating the biosynthetic and regulatory mechanisms of vitamin E and enhancing its content in staple crops such as rice represent one of the most cost-effective and sustainable strategies for improving human and animal nutrition.
Vitamin E (collectively termed tocochromanols) belongs to a class of amphipathic isoprenoid derivatives, each molecule consisting of a polar chromanol ring and a hydrophobic isoprenoid side chain [2]. Based on side-chain saturation, tocochromanols are classified into two major groups: tocopherols, which carry a saturated phytyl side chain, and tocotrienols, which contain an unsaturated farnesyl side chain with three trans double bonds [6,7]. Each group is further divided into α, β, γ, and δ isoforms according to the number and position of methyl groups on the chromanol ring. In addition, rare isoforms such as plastochromanol-8, which has a longer side chain, and tocomonoenols, which carry a single double bond, also exist in plants [8,9].
Among all vitamin E isoforms, α-tocopherol exhibits the highest nutritional and physiological activity, as it is preferentially absorbed, transported, and accumulated due to its highest affinity (100% relative binding efficiency) for the human hepatic α-tocopherol transfer protein [6]. By contrast, although γ-tocopherol constitutes the major dietary intake, its proportion in the circulatory system is far lower than that of α-tocopherol as a result of selective hepatic processing [10]. Notably, tocotrienols, owing to the unsaturated double bonds in their side chains, possess stronger membrane penetration ability and more efficient radical-scavenging activity, and exhibit unique physiological functions particularly in cholesterol reduction and neuroprotection [11].
The biosynthetic pathway of vitamin E in plants is a complex metabolic network governed by precursor supply, core enzymatic reactions, and multilayered regulatory mechanisms. The pathway strictly depends on two major precursors: the aromatic ring donor homogentisate (HGA) and the isoprenoid side-chain donors phytyl diphosphate (PDP) or geranylgeranyl diphosphate (GGPP). HGA is derived from the tyrosine degradation pathway, sequentially catalyzed by tyrosine aminotransferase (TAT) and 4-hydroxyphenylpyruvate dioxygenase (HPPD) [2,6]. The side-chain precursors PDP and GGPP are mainly supplied by the plastidial methylerythritol phosphate (MEP) pathway. In addition, the seed-specific alpha/beta hydrolases (ABH/VTE7), Phytol kinase (PK/VTE5), and Phytyl phosphate kinase (PKK/VTE6) mediate the direct recycling and reutilization of phytol from chlorophyll degradation, thus establishing a molecular bridge between chlorophyll catabolism and vitamin E biosynthesis [2,12]. Upon entry into the core synthesis stage, HGA condenses with PDP, catalyzed by homogentisate phytyltransferase (HPT/VTE2), to form 2-methyl-6-phytyl-1,4-benzoquinol (MPBQ), initiating tocopherol synthesis; whereas HGA condenses with GGPP, catalyzed by homogentisate geranylgeranyltransferase (HGGT), to form 2-methyl-6-geranylgeranylbenzoquinol (MGGBQ), initiating tocotrienol synthesis. Subsequently, MPBQ methyltransferase (MPBQ-MT/VTE3) and tocopherol cyclase (TC/VTE1) catalyze methylation and cyclization, respectively, yielding δ- and γ-tocopherols (or tocotrienols), which are ultimately converted to the most biologically active α-forms by γ-tocopherol methyltransferase (γ-TMT/VTE4) [2,6]. The pathway is also subject to multilayered regulation by transcription factors (e.g., GmZF351) and environmental stress signals (high temperature, high light, drought, etc.), enabling dynamic responses to developmental and environmental cues [6].
Despite substantial progress in elucidating the biosynthetic pathway, the genetic architecture underlying grain vitamin E content in rice remains poorly understood. OsVTE2 is not only involved in tocopherol biosynthesis but is also essential for seed longevity, plant development, and cold tolerance [13,14]. Polymorphisms in the 3′ UTR of OsVTE4 significantly affect α-tocopherol content in indica and japonica rice grains [15]. Two independent GWAS studies have identified 13 and 18 QTLs associated with grain vitamin E content, respectively [16,17]. OsVTE1 (LOC_Os02g17650) has been reported to be associated with salt tolerance [18]. More recently, a transcriptome-based study identified 10 α-tocopherol biosynthesis genes in the rice genome and showed that these genes respond effectively to anilofos-induced stress, potentially promoting α-tocopherol production and modulating pesticide degradation [19]. However, with the exception of OsVTE2 and OsVTE4, the contributions of other genes or loci to grain vitamin E content remain to be functionally validated and allelically characterized.
Currently, genetic improvement of vitamin E content in rice relies predominantly on transgenic approaches, whereas the application of marker-assisted selection remains underexploited. Introduction of sunflower-derived HaHPT and HaTMT into the elite rice cultivar Ningjing 7 increased grain α-tocopherol content by up to 2.33-fold in transgenic lines without significantly affecting agronomic performance, suggesting that this metabolic engineering strategy is effective for enhancing rice grain vitamin E content [20]. In the indica cultivar ASD16, single or combined introduction of Arabidopsis AtVTE1 and AtVTE2 increased leaf α-tocopherol content by 2.2- to 5.3-fold, whereas the increase in seed α-tocopherol content was modest, with a maximum of 1.29-fold [21].
In this study, using a diverse panel of 533 rice accessions, we performed a genome-wide association study (GWAS) and identified a major locus, VEQ2, that controls brown rice α-tocopherol content. We developed a kompetitive allele-specific PCR (KASP) marker for VEQ2 and validated its genetic effect in an F2 segregating population. Through marker-assisted backcrossing, using an elite indica cultivar as the recurrent parent and a high-α-tocopherol japonica cultivar as the donor, we generated near-isogenic introgression lines at different generations. We systematically characterized the vitamin E metabolic profiles, agronomic traits, and background genome recovery rates of these introgression lines, and analyzed the allelic distribution patterns of VEQ2 across 4,726 rice accessions. This study aims to provide elite alleles, functional molecular markers, and improved germplasm resources that are readily applicable for vitamin E biofortification in rice breeding programs.
2. Results
2.1. VEQ2 is a Major Locus Controlling Grain α-Tocopherol Content in Rice
To identify genetic loci controlling grain α-tocopherol content in rice, we assembled a diverse panel of 533 rice accessions collected from worldwide sources [22]. Ultra-high-performance liquid chromatography-tandem mass spectrometry (UPLC-MS/MS) analysis revealed substantial variation in brown rice α-tocopherol content across the panel, with the highest-content accession exhibiting 91.2-fold that of the lowest-content accession, and a coefficient of variation (CV) of 61.31% (Table S1). GWAS analyses using this panel identified 12 loci associated with brown rice α-tocopherol content. Among these, the most prominent locus was located at approximately 28.8 Mb on chromosome 2, which we designated as VEQ2 (Figure 1A). The lead single nucleotide polymorphism (SNP) at the VEQ2 locus, vg0228814969 (position 28,814,969 bp on chromosome 2), was used as the representative genotype for VEQ2 in subsequent analyses. Two alleles, T and C, were identified at VEQ2. A total of 285 accessions carried the homozygous T genotype, with a mean relative α-tocopherol content of 69,528.84, whereas 247 accessions carried the homozygous C genotype, with a mean relative α-tocopherol content of 146,524.47. Student’s t-test revealed a highly significant difference in α-tocopherol content between the two genotypic groups (P = 1.38 × 10−47; Figure 1B). These results demonstrate that VEQ2 is a major locus controlling grain α-tocopherol content in rice, with the CC genotype conferring the high-content phenotype and the TT genotype conferring the low-content phenotype.
2.2. Development and Validation of a Marker for the VEQ2 Locus
To facilitate the utilization of VEQ2 for improving grain α-tocopherol content in rice, we first developed a KASP marker for genotyping the VEQ2 locus. Genotyping of 13 randomly selected accessions from the 533-panel using this KASP marker identified 11 TT genotypes and 2 CC genotypes (Figure 2A), which were fully consistent with Sanger sequencing results at the VEQ2 locus for the same 13 accessions (Table S2), confirming the reliability of the KASP marker for VEQ2 genotyping.
To validate the genetic effect of VEQ2, we generated an F2 segregating population from a cross between Baikezaohe (TT genotype) and AKITAKOMACHI (CC genotype). KASP genotyping of the F2 population (Table S3) identified 27 TT plants, 26 CC plants, and 63 heterozygous (CT) plants, fitting a 1:2:1 segregation ratio (χ2 = 0.442, P = 0.80), indicating that VEQ2 does not affect gamete fertility, and segregation follows Mendelian expectations.
F2 plants with single-plant seed yield above 10 g (for brown rice) and 20 g (for milled rice) were selected for α-tocopherol content measurement (Table S3). In brown rice, CC plants exhibited a 75.6% higher mean relative α-tocopherol content compared with TT plants (P = 0.019); CT plants showed a 69.6% increase over TT plants, although this difference was not statistically significant (Figure 2B). In milled rice, although CC and CT plants both had higher mean relative α-tocopherol contents than TT plants, the differences were not significant (Figure 2C). The mean α-tocopherol contents in milled rice of the three genotypes were approximately 17.7%, 18.6%, and 24.2% of those in brown rice, with no significant differences among genotypes, suggesting that the processing retention rate of α-tocopherol is not affected by genotype and that the difference in α-tocopherol content primarily originates from the initial content in brown rice (Figure 2D). Collectively, these results indicate that VEQ2 primarily controls α-tocopherol content in brown rice.
2.3. Development of Backcross Introgression Lines at the VEQ2 Locus Through Marker-Assisted Selection
PXB is an improved line derived from the widely cultivated indica variety Huanghuazhan in South China, carrying introgressed genes for blast resistance (Pi1, Pita, Pi9), bacterial blight resistance (Xa7, Xa21, Xa23), and brown planthopper resistance (Bph14, Bph15). AKITAKOMACHI is a high-quality japonica variety from Japan. Using PXB (TT genotype) as the recurrent parent and AKITAKOMACHI as the donor parent, we developed backcross introgression lines at the VEQ2 locus through successive crossing, backcrossing, and selfing, including 15 CC-genotype lines at BC2F2, BC2F5, and BC3F4 generations, and 5 TT-genotype lines at BC2F2, BC3F3, and BC3F4 generations (Table S4). The plant architecture of these lines was largely similar to that of the recurrent parent PXB (Figure 3).
Background genome analysis (Table S4) revealed that the mean recurrent parent genome recovery rate for CC-genotype lines was 86.54 ± 1.87% at the BC2 generation (n = 9) and increased to 93.83 ± 1.09% at the BC3 generation (n = 6), showing a stepwise increase. For TT-genotype lines, the recovery rate was 87.98% at BC2 (n = 1) and increased to 96.29 ± 1.17% at BC3 (n = 4), similar to the CC-genotype lines at the corresponding generations. Within each generation, the CV among lines was low (range 1.16%–2.16%), indicating consistent background recovery among lines of the same generation.
2.4. CC-Genotype Introgression Lines Exhibit Significant Enrichment of α-Type Vitamin E Components
Using PXB (TT genotype) as the control, we quantified vitamin E components in brown rice of 15 CC-genotype introgression lines (Table S4). As shown in Figure 4A, α-tocopherol content in CC-introgression lines was significantly elevated compared with PXB (42.47 μg/g), with a mean of 1.86-fold that of PXB (range 1.42–2.35-fold). Among these, three BC3F4 lines—LT37 (99.88 μg/g), LT36 (95.35 μg/g), and LT34 (93.80 μg/g)—reached or exceeded the level of the donor parent AKITAKOMACHI (92.41 μg/g; 2.18-fold).
The increase in α-tocotrienol was even more pronounced, with CC-introgression lines exhibiting a mean of 5.28-fold that of PXB (range 4.00–6.43-fold; Figure 4B). Two lines, LT57 (6.43-fold) and LT60 (6.33-fold), showed high α-tocotrienol accumulation comparable to AKITAKOMACHI (6.17-fold).
Concurrently, β-tocopherol content in CC-introgression lines was significantly reduced compared with PXB, with a mean of only 0.66-fold (range 0.46–0.92-fold; Figure 4C), even lower than the 0.81-fold level of AKITAKOMACHI, suggesting that backcross introgression may further suppress β-tocopherol accumulation in the CC background. β-Tocotrienol content remained at approximately 0.85-fold that of PXB (range 0.70–1.04-fold; Figure 4D), showing a slight overall decreasing trend. δ-Tocotrienol content showed a mean of 1.33-fold that of PXB (range 0.85–1.83-fold; Figure 4E), with LT57 exhibiting the highest level at 1.83-fold.
2.5. TT-Genotype Introgression Lines Display a “High-β, Low-α” Vitamin E Profile
In contrast to the CC-genotype introgression lines, the five TT-genotype introgression lines exhibited a distinctly different vitamin E profile (Figure 4; Table S4). In TT lines, α-tocopherol content showed no significant difference from PXB, averaging 1.09-fold (range 1.03–1.15-fold; Figure 4A); α-tocotrienol content was also comparable to PXB, with a mean of 1.17-fold (range 0.96–1.27-fold; Figure 4B). Notably, β-tocopherol content was significantly elevated compared with PXB, averaging 1.30-fold (range 1.19–1.43-fold; Figure 4C), with LT42 showing the highest value (1.43-fold). β-Tocotrienol content also increased significantly, with a mean of 1.22-fold (range 1.12–1.31-fold; Figure 4D). δ-Tocotrienol content averaged 1.20-fold but displayed considerable variation among lines (range 0.86–1.75-fold; Figure 4E), with LT58 showing the highest level (1.75-fold), whereas LT48 (0.86-fold) and LT49 (0.87-fold) fell below the PXB level. These results reveal that, under a similar genetic background, the CC and TT genotypes generate opposite vitamin E accumulation profiles.
2.6. Intergenerational Stability of Vitamin E Profiles in Backcross Introgression Lines
To evaluate the genetic stability of the target traits across different backcross generations, we compared the introgression lines grouped by generation: BC2F2, BC2F5, BC3F3, and BC3F4 (Table S5). For CC-genotype lines, the mean α-tocopherol contents at BC2F2, BC2F5, and BC3F4 were 86.75 μg/g, 74.77 μg/g, and 72.70 μg/g, respectively, with an intergenerational CV of only 9.71%, indicating stable expression. The intergenerational CVs for α-tocotrienol, β-tocotrienol, and δ-tocotrienol were 7.70%, 6.25%, and 3.28%, respectively, all within highly stable ranges. β-Tocopherol showed relatively higher intergenerational variation (CV = 14.79%), though still within an acceptable range.
For TT-genotype lines, α-tocopherol (CV = 3.71%), α-tocotrienol (CV = 8.56%), β-tocopherol (CV = 0.69%), and β-tocotrienol (CV = 6.33%) all exhibited high stability across the BC2F2, BC3F3, and BC3F4 generations. δ-Tocotrienol showed greater intergenerational variation (CV = 34.6%), primarily due to the lower mean value in the BC3F3 generation. Overall, with the exception of δ-tocotrienol in the TT background, all major vitamin E components exhibited good genetic stability across the BC2 to BC3 generations, indicating that the high vitamin E traits conferred by the target genotypes have been effectively fixed during backcross introgression.
2.7. The VEQ2 Locus Does not Affect Other Agronomic Traits
To evaluate the potential pleiotropic effects of the VEQ2 locus on other agronomic traits, we systematically measured plant height, tiller number, seed setting rate, grain shape, and yield-related traits in the 20 backcross introgression lines (Table 1). Although individual lines showed varying degrees of difference from PXB for certain traits, the mean values of both CC- and TT-genotype lines were generally similar to those of PXB (Table 1). CC-genotype lines (n = 15) had a mean plant height of 92.91 ± 5.23 cm (range 86.86–103.29 cm), comparable to PXB (100.7%). TT-genotype lines (n = 5) had a mean plant height of 95.43 ± 3.85 cm (range 89.71–98.00 cm), slightly higher than PXB (103.4%). CC-genotype lines showed a mean tiller number of 14.77 ± 1.77 (range 12.43–17.71), representing an 18.8% increase over PXB (12.43) and a 16.2% increase over AKITAKOMACHI (12.71). TT-genotype lines had a mean tiller number of 13.75 ± 0.72, a 10.6% increase over PXB. For seed setting rate, CC-genotype lines averaged 79.92 ± 2.57% (range 75.93%–87.65%), approximately 2.41 percentage points higher than PXB (77.51%). TT-genotype lines averaged 79.12 ± 1.45%, comparable to the CC lines.
Grain shape varied significantly across generations among CC-genotype lines. BC3F4 lines exhibited grain length (7.78 ± 0.40 mm), grain width (1.86 ± 0.10 mm), and length-to-width ratio (4.33 ± 0.05) close to or exceeding those of PXB. However, BC2F2 and BC2F5 lines showed significantly reduced grain length (6.50 mm and 4.56 mm, respectively), narrower grain width (1.83 mm and 1.53 mm), and markedly reduced length-to-width ratios (3.60 and 3.02). TT-genotype lines displayed stable grain shape traits highly consistent with PXB. The mean 1,000-grain weight of CC- and TT-genotype lines was 21.11 ± 0.10 g and 21.15 ± 0.08 g, respectively, essentially identical to PXB (21.16 g). CC-genotype lines had a mean yield per plant of 25.85 ± 2.09 g (range 22.72–28.75 g), representing 98.7% of PXB (26.19 g), with LT37 showing the highest yield (28.75 g), significantly exceeding PXB. TT-genotype lines had a mean yield per plant of 25.12 ± 3.43 g, representing 95.9% of PXB, with LT58 showing the highest yield (27.52 g).
2.8. Genotype distribution of the VEQ2 locus in rice germplasm resources
To characterize the natural variation pattern of the VEQ2 locus across different rice subspecies, we analyzed the genotype distribution of the VEQ2 locus in 4,726 rice accessions (Table 2). The VEQ2 locus exhibited two major genotypes, TT and CC, accounting for 52.7% and 46.9% of the total population, respectively. At the subspecies level, a pronounced indica-japonica differentiation was observed. Among 2,759 indica accessions, the TT allele was overwhelmingly predominant, with a frequency of 84.2%, whereas the CC allele accounted for only 15.3%. In contrast, among 1,512 japonica accessions, the CC allele was nearly fixed, with a frequency of 99.5%, while the TT allele was extremely rare (0.4%). In the aus group (n = 269), the TT and CC alleles were present at near-equilibrium frequencies of 49.8% and 50.2%, respectively. The VI/Aromatic group (n = 96) resembled japonica in having a predominance of the CC allele (99%), with TT accounting for only 1%. Among admixture accessions (n = 90), the CC allele frequency was 67.8%, while TT accounted for 28.9%.
3. Discussion
3.1. VEQ2 is a Novel Major Locus Controlling Grain α-Tocopherol Content in Rice
Recent genome-wide association studies have identified 13 QTLs associated with grain α-tocopherol and total tocopherol contents in rice, distributed across chromosomes 1, 2, 3, 6, and 8 [16]. In the present study, using a diverse panel of 533 rice accessions, we identified a novel locus, VEQ2, on chromosome 2 that controls brown rice α-tocopherol content (Figure 1A). Genotyping based on the lead SNP vg0228814969 revealed that accessions carrying the CC genotype exhibited significantly higher α-tocopherol content than those with the TT genotype (P = 1.38 × 10−47), with an approximately 110% increase (Figure 1B; Table S1). These results establish VEQ2 as a major, previously unreported locus governing grain α-tocopherol content in rice.
The genetic effect of VEQ2 was further validated in an F2 population derived from Baikezaohe (TT) × AKITAKOMACHI (CC). In brown rice, CC homozygotes displayed 75.6% higher α-tocopherol content than TT homozygotes, with heterozygotes showing intermediate levels (Figure 2B; Table S3), consistent with a semi-dominant inheritance pattern. This dosage-dependent effect suggests that even a single copy of the C allele can partially enhance α-tocopherol accumulation. Notably, while CC and CT plants both exhibited higher α-tocopherol content in milled rice than TT plants, the differences were not statistically significant, indicating that the VEQ2 locus functions primarily in brown rice—likely in the embryo, pericarp and/or aleurone layers—with limited contribution to the endosperm.
3.2. Allelic Variation at VEQ2 Remodels the Vitamin E Metabolic Profile
Previous studies have shown that changes in seed α-tocopherol content in plants are often accompanied by reciprocal changes in γ-tocopherol [15,23]. The most striking finding of the present study is that, under a near-isogenic background, the CC and TT genotypes at VEQ2 produced opposite vitamin E metabolic profiles. In CC-introgression lines, we observed significant enrichment of α-tocopherol (1.86-fold) and α-tocotrienol (5.28-fold), accompanied by a marked reduction in β-tocopherol (0.66-fold) compared with the recurrent parent PXB (Figure 4; Table S4). In contrast, TT-introgression lines showed no significant differences in α-tocopherol and α-tocotrienol relative to PXB, but exhibited significantly elevated β-tocopherol (1.30-fold) and β-tocotrienol (1.22-fold). This see-saw metabolic pattern strongly suggests that VEQ2 modulates metabolic flux through the vitamin E biosynthetic pathway, likely by influencing substrate partitioning or enzyme activity at key branch points. Future fine-mapping and functional characterization of the causal gene at VEQ2—including transcriptomic profiling and enzyme activity assays—will be essential to elucidate the precise molecular mechanism underlying this metabolic switch.
3.3. VEQ2 Enhances Nutritional Quality Without Compromising Yield Potential
A key concern in biofortification breeding is the potential for linkage drag associated with the introgression of donor alleles. Our results demonstrate that the C allele from the japonica donor AKITAKOMACHI was successfully introgressed into the elite indica recurrent parent PXB via marker-assisted backcrossing, with minimal impact on agronomic performance. Evaluation of 20 introgression lines revealed that plant height, tiller number, seed setting rate, grain shape, 1,000-grain weight, and yield per plant were generally comparable to those of PXB (Table 1). Although individual lines showed significant deviations for certain traits—for example, reduced grain length in BC2F2 and BC2F5 CC lines, which reverted to normal in BC3F4—these variations appear to reflect transient linkage drag that can be effectively broken with additional backcrossing. The mean yield per plant of CC and TT introgression lines reached 98.7% and 95.9% of PXB, respectively, with some lines (e.g., LT37, 28.75 g; LT58, 27.52 g) even outperforming the recurrent parent. These findings indicate that VEQ2-mediated vitamin E enhancement can be achieved without yield penalty—a prerequisite for the commercial deployment of biofortified varieties.
3.4. Subspecies Differentiation at VEQ2 and Implications for Germplasm Utilization
Analysis of 4,726 rice accessions revealed pronounced subspecies differentiation at the VEQ2 locus: the TT genotype predominated in indica (84.2%), whereas the CC genotype was nearly fixed in japonica (99.5%) (Table 2). The aus subpopulation exhibited near-equilibrium frequencies of TT and CC (49.8% vs. 50.2%), consistent with previous reports that aus has an independent domestication origin and a distinct genetic basis [24,25].
From a breeding perspective, the near-fixation of the CC allele in japonica implies that japonica germplasm already harbors the high-α-tocopherol haplotype, and further improvement could focus on pyramiding VEQ2 with other minor QTLs. Conversely, the overwhelming predominance of the TT allele in indica highlights a substantial biofortification opportunity: introduction of the CC allele into elite indica varieties could significantly enhance α-tocopherol content in the most widely consumed rice subspecies globally. The KASP marker developed in this study can be readily deployed in breeding pipelines for foreground selection, enabling rapid conversion of TT to CC genotypes without the need for extensive phenotypic screening.
3.5. Stability of Vitamin E Traits Across Backcross Generations
Previous studies have reported high heritability for α-tocopherol content [16]. In the present study, intergenerational stability analysis (Table S5) demonstrated that the vitamin E profiles of both CC and TT introgression lines remained highly consistent from BC2 to BC3 (with intergenerational CVs below 10% for most components), indicating that the VEQ2 effect is genetically stable and minimally influenced by background genetic noise. Notably, this stability contrasts with the transient grain-shape variations observed in BC2F2 and BC2F5 CC lines, further supporting the conclusion that VEQ2 exerts a specific and stable effect on vitamin E metabolism. The larger intergenerational variation observed for δ-tocotrienol in TT lines (CV = 34.6%) may reflect the lower mean value in the BC3F3 generation, compounded by the small sample size (n = 5) and the inherent sensitivity of δ-tocotrienol to environmental or epistatic effects. Nevertheless, the core traits—α-tocopherol and α-tocotrienol in CC lines, and β-tocopherol in TT lines—showed remarkable stability, suggesting that breeders can confidently select for these traits at the BC3 generation without concern for inter-generational instability.
3.6. Limitations and Future Perspectives
Several limitations of this study should be acknowledged. First, although we have established VEQ2 as a major-effect locus and validated its allelic effects, the causal gene underlying the locus has not yet been cloned. Fine-mapping to identify the causal polymorphism, followed by transgenic complementation or CRISPR-Cas9-based gene editing, will be essential to confirm the molecular function of VEQ2. Second, the TT-introgression lines comprised only five lines across three generations, limiting the statistical power for evaluating the stability of TT-associated vitamin E profiles. Third, the vitamin E analyses of the introgression lines were conducted under a single environmental condition; multi-location field trials are needed to assess the environmental stability of the VEQ2 effect.
Looking forward, pyramiding VEQ2 with other QTLs that control vitamin E components—such as those modulating γ-tocopherol or tocotrienol ratios—could enable rational design of rice vitamin E profiles tailored to specific nutritional or industrial applications. Furthermore, the KASP marker developed in this study is immediately applicable in breeding programs to accelerate the development of high-α-tocopherol rice varieties, contributing to global efforts to combat vitamin E deficiency through staple crop biofortification.
4. Materials and Methods
4.1. Plant Materials and Growth Conditions
A total of 533 rice accessions collected from worldwide sources were used in this study [22]. An F2 population derived from a cross between Baikezaohe and AKITAKOMACHI was generated for functional validation of the VEQ2 locus. Using PXB as the recurrent parent and AKITAKOMACHI as the donor parent, backcross introgression lines at the VEQ2 locus were developed through successive crossing, backcrossing, and selfing.
The 533-accession panel used for GWAS was grown in Wuhan under conditions as previously described by Li et al. [26]. From 2020 to 2022, the rice materials used in this study were planted at the Luoniushan Experimental Station of Hainan University in Haikou during the main cropping season, and at the Lingshui or Sanya bases of Guangling Hi-Tech Co., Ltd. during the off-season nursery. From 2023 to 2025, all materials were planted at the Batou Experimental Base of Sanya Nanfan Research Institute, Hainan University during the early season, and at the Dongfang Base of Hainan Nongle Nanfan Technology Co., Ltd. during the late season. The planting spacing was 20 cm between rows and 20 cm between plants. Standard water and fertilizer management practices were applied.
4.2. Metabolic Sample Preparation and Profiling
Metabolic sample preparation was performed as described by Zhao et al. [27] with minor modifications. Dried brown rice and milled rice were ground into powder using a mixer (MM400, Retsch) mill at 30 Hz for 60 s. Approximately 0.05–0.08 g of powder was weighed and mixed on ice in the dark with 10,000 μL of extraction solvent per gram of sample (i.e., sample mass in g × 10,000 μL) of extraction solvent (methanol:acetonitrile:water = 2:2:1, v/v/v). The mixture was vortexed for approximately 15 s and then subjected to ultrasonication for 10 min, repeated three times. After centrifugation at 12,000 rpm at 4°C for 10 min, the supernatant was filtered through a 0.22-μm pore size membrane filter (SCAA-104, ANPEL, Shanghai, China). A 2-μL aliquot of the filtered supernatant was analyzed using an UPLC-MS/MS-based targeted method as previously described by Zhang et al [28] and Yang et al [29].
4.3. Absolute Quantification of α-Tocopherol
Aliquots of 0.2, 0.4, 0.6, and 0.8 μL of 10 mmol/L α-tocopherol standard (Cat. No. T90262, Shanghai Yuanye Bio-Technology Co., Ltd.) were dissolved in 1,000 μL of DMSO. A 2-μL aliquot of each diluted standard was subjected to UPLC-MS/MS analysis. A standard curve was constructed with the chromatographic peak area as the Y-axis and the absolute concentration of the standard as the X-axis, yielding the equation y = 68610x − 20948 (R2 = 0.9924). The absolute α-tocopherol content in brown rice and milled rice was calculated based on the standard curve and the dilution factor of the samples.
4.4. Genome-Wide Association Study
Genome-wide association analysis was performed as described by Li et al. [26]. In total, 4,300,150 high-quality SNPs with minor allele frequency (MAF) > 0.05 and deletion rate < 0.1 were selected from the 533 rice cultivars for GWAS. The GWAS analyses were performed using the efficient mixed-model association expedited method [30]. The kinship matrix was constructed using the emmax-kin program.
4.5. KASP Marker Development, Detection, and Validation
Based on the KASP principle [31], we designed KASP primers for the lead SNP vg0228814969 at the VEQ2 locus. The primer sequences are listed in Table S6. KASP genotyping was performed using the KASP-TF V4.0 2× Master Mix kit (Cat. No. KBS-1050-102, LGC Biosearch Technologies) on an ABI QuantStudio 7 Flex Real-Time PCR system (Applied Biosystems, Foster City, CA, USA), following the manufacturer’s instructions. Each KASP reaction was carried out in a total volume of 5 μL, containing 2.5 μL of KASP 2× Master Mix, 1 μL of genomic DNA template (50 ng/μL), 0.07 μL of primer mix (allele-specific forward primers Q2-F1 and Q2-F2 at 36 μM each, and common reverse primer Q2-R at 90 μM), and 1.43 μL of sterile double-distilled water. The thermal cycling program was: 94°C for 15 min; followed by 10 touchdown cycles of 94°C for 20 s and 61–55°C for 60 s (decreasing by 0.6°C per cycle); followed by 26 cycles of 94°C for 20 s and 55°C for 60 s, and the cycle number at this stage may be adjusted as required.
To further validate the KASP genotyping results, primers flanking the vg0228814969 site were designed for PCR amplification and Sanger sequencing. The primer sequences are listed in Table S6. The PCR reaction mixture (25 μL) contained 12.5 μL of 2× Taq PCR Master Mix (Cat. No. PC1120, Beijing Solarbio Science & Technology Co., Ltd), 2 μL of DNA template (50 ng/μL), 1.25 μL each of primers VEQ2F and VEQ2R (10 μmol/L), and 8 μL of ddH2O. The PCR program was: 94°C for 5 min; 30 cycles of 94°C for 30 s, 58°C for 30 s, and 72°C for 40 s; followed by 72°C for 5 min and 25°C for 1 min. The amplified products were sequenced by Beijing Tsingke Biotech Co., Ltd.
4.6. Background Genome Analysis
For each backcross introgression line, five individual plants were randomly selected, and leaf samples were submitted to Huazhi Biotech Co., Ltd. for background genome analysis using the rice 1K mGPS liquid-phase chip. The analysis procedure was briefly as follows: Genomic DNA was extracted using the magnetic bead method, and sequencing libraries were constructed. Qualified libraries were subjected to paired-end 150-bp high-throughput sequencing on the DNBSEQ-T7 platform. Raw sequencing data were quality-assessed using FastQC, and reads containing adapter sequences or with base quality below Q20 were removed using Trimmomatic. High-quality clean reads were aligned to the rice reference genome using the MEM algorithm of Burrows-Wheeler Aligner. Variant calling was performed using FreeBayes software with parameters set as MAF ≥ 0.05 and sequencing depth ≥ 10×. Finally, the detected variants were manually verified using the Integrative Genomics Viewer to ensure the accuracy of variant detection.
4.7. Agronomic Trait Evaluation
For each line evaluated, more than 60 plants were planted. Five sampling points were evenly selected within each plot, and 2–3 healthy plants were chosen from each sampling point for measurement of plant height, tiller number, seed setting rate, grain length, grain width, length-to-width ratio, 1,000-grain weight, and yield per plant.
4.8. Distribution Frequency Analysis of Genotypes at the VEQ2 Locus
The allele distribution frequencies of SNP vg0228814969 were analyzed online across 4,726 rice accessions from different population groups using the “Search for Variation Information with Variation ID” function on the RiceVarMap v3.0 website (https://ricevarmap.ncpgr.cn/v3/) [32,33].
5. Conclusions
In this study, we identified a novel major locus, VEQ2, controlling grain α-tocopherol content in rice through genome-wide association analysis. The CC allele at this locus significantly increased brown rice α-tocopherol content by approximately 2.1-fold compared with the TT allele, and exhibited semi-dominant inheritance. Using a newly developed KASP marker for marker-assisted backcrossing, we successfully introgressed VEQ2 into an elite indica background and generated near-isogenic lines. The CC-introgression lines displayed a high-α, low-β vitamin E profile, with α-tocopherol and α-tocotrienol contents increased by 86% and 428%, respectively, whereas the TT-introgression lines showed the opposite pattern. Agronomic evaluation revealed that the introgressed lines were comparable to the recurrent parent in yield and major traits, with no significant linkage drag detected. Germplasm analysis demonstrated a strong indica–japonica differentiation at VEQ2, with the TT allele being overwhelmingly predominant in indica subspecies.
Collectively, these findings establish VEQ2 as a key genetic switch modulating the rice vitamin E metabolic profile and a promising target for nutritional improvement of indica rice grains. Marker-assisted selection for the favorable allele of VEQ2 enables the directional enhancement of brown rice α-tocopherol content while maintaining desirable agronomic performance, providing a valuable genetic resource and a feasible technical pathway for the molecular design breeding of functional rice.
6. Patents
The KASP marker at the VEQ2 locus has been granted a Chinese invention patent (patent number: ZL202211647049.7).
Supplementary Materials
The following supporting information can be downloaded at the website of this paper posted on Preprints.org, Table S1: Summary of 533 rice accessions, including their population group, VEQ2 genotype, and grain α-tocopherol content; Table S2: Genotypes at the VEQ2 locus determined by Sanger sequencing in 13 rice varieties; Table S3: VEQ2 genotype and grain α-tocopherol content in F2 plants of Baikezaohe × AKITAKOMACHI; Table S4: Genotype at the VEQ2 locus, genetic background recovery rate, and grain vitamin E composition of backcross introgression lines; Table S5: Analysis of inter-generational variation in vitamin E component contents among VEQ2 backcross introgression lines; Table S6: Primers used in this study.
Author Contributions
Conceptualization, T.L. and J.L.; methodology, T.L., H.Y. and Y.H.; validation, H.Y., H.Z. and T.L.; formal analysis, T.L. and H.Y.; investigation, H.Y., Y.H., H.Z., T.L., R.Z., S.H., and X.L.; resources, T.L., Y.L. and J.L.; data curation, T.L., H.Y. and Y.H.; writing—original draft preparation, T.L.; writing—review and editing, T.L.; supervision, T.L. and J.L.; project administration, T.L.; funding acquisition, T.L. All authors have read and agreed to the published version of the manuscript.
Funding
This research was funded by the Project of Sanya Yazhou Bay Science and Technology City, grant number SCKJ-JYRC-2023-20, and the Hainan University Startup Fund, grant number KYQD(ZR)-21081.
Data Availability Statement
All data and materials are available on request.
Acknowledgments
We are grateful to Dr. Sihan Zhao for her contribution to the development of the KASP marker for the VEQ2 locus, to Xianqing Liu for managing the laboratory, and to Huiping Li for her help with reagent and consumable procurement and financial reimbursement.
Conflicts of Interest
The authors declare no conflicts of interest. The funders had no role in the design of the study; in the collection, analyses, or interpretation of data; in the writing of the manuscript; or in the decision to publish the results.
Abbreviations
The following abbreviations are used in this manuscript:
| GWAS | genome-wide association study |
| KASP | kompetitive allele-specific PCR |
| HGA | homogentisate |
| PDP | phytyl diphosphate |
| GGPP | geranylgeranyl diphosphate |
| TAT | tyrosine aminotransferase |
| HPPD | 4-hydroxyphenylpyruvate dioxygenase |
| MEP | methylerythritol phosphate |
| ABH | alpha/beta hydrolases |
| PK | Phytol kinase |
| PKK | Phytyl phosphate kinase |
| HPT | homogentisate phytyltransferase |
| MPBQ | 2-methyl-6-phytyl-1,4-benzoquinol |
| HGGT | homogentisate geranylgeranyltransferase |
| MGGBQ | 2-methyl-6-geranylgeranylbenzoquinol |
| MPBQ-MT | MPBQ methyltransferase |
| TC | tocopherol cyclase |
| γ-TMT | γ-tocopherol methyltransferase |
| CV | coefficient of variation |
| SNP | single nucleotide polymorphism |
| MAF | minor allele frequency |
References
- Muñoz, P.; Munné-Bosch, S. Vitamin E in Plants: Biosynthesis, Transport, and Function. Trends Plant Sci. 2019, 24, 1040–1051. [Google Scholar] [CrossRef] [PubMed]
- Li, Y.; Yang, D.; Ren, Y.; Luo, Y.; Zheng, H.; Liu, Y.; Wang, L.; Zhang, L. Vitamin E in Plants: Biosynthesis Pathways, Biofortification Strategies, and Regulatory Dynamics. Int. J. Mol. Sci. 2025, 26, 3380. [Google Scholar] [CrossRef]
- Zingg, J.-M. Vitamin E: Regulatory Role on Signal Transduction. IUBMB Life 2019, 71, 456–478. [Google Scholar] [CrossRef]
- Kim, H.-K.; Han, S.N. Vitamin E: Regulatory Role on Gene and Protein Expression and Metabolomics Profiles. IUBMB Life 2019, 71, 442–455. [Google Scholar] [CrossRef]
- Passarelli, S.; Free, C.M.; Shepon, A.; Beal, T.; Batis, C.; Golden, C.D. Global Estimation of Dietary Micronutrient Inadequacies: A Modelling Analysis. Lancet Glob. Health 2024, 12, e1590–e1599. [Google Scholar] [CrossRef] [PubMed]
- Zhang, R.; Ren, Y.; Zhao, Y.; Zheng, H.; Luo, Y.; Liu, Y.; Wang, L.; Zhang, L. A Century of Vitamin E Research: The Innovative Journey from Basic Biology to Synthetic Bio-Manufacturing. J. Integr. Plant Biol. 2026, 68, 985–1012. [Google Scholar] [CrossRef]
- Horvath, G.; Wessjohann, L.; Bigirimana, J.; Jansen, M.; Guisez, Y.; Caubergs, R.; Horemans, N. Differential Distribution of Tocopherols and Tocotrienols in Photosynthetic and Non-Photosynthetic Tissues. Phytochemistry 2006, 67, 1185–1195. [Google Scholar] [CrossRef]
- Sadre, R.; Frentzen, M.; Saeed, M.; Hawkes, T. Catalytic Reactions of the Homogentisate Prenyl Transferase Involved in Plastoquinone-9 Biosynthesis. J. Biol. Chem. 2010, 285, 18191–18198. [Google Scholar] [CrossRef]
- Stacey, M.G.; Cahoon, R.E.; Nguyen, H.T.; Cui, Y.; Sato, S.; Nguyen, C.T.; Phoka, N.; Clark, K.M.; Liang, Y.; Forrester, J.; et al. Identification of Homogentisate Dioxygenase as a Target for Vitamin E Biofortification in Oilseeds. Plant Physiol. 2016, 172, 1506–1518. [Google Scholar] [CrossRef]
- Traber, M.G. Utilization of Vitamin E. Biofactors 1999, 10, 115–120. [Google Scholar] [CrossRef]
- Bardhan, J.; Chakraborty, R.; Raychaudhuri, U. The 21st Century Form of Vitamin E--Tocotrienol. Curr. Pharm. Des. 2011, 17, 2196–2205. [Google Scholar] [CrossRef]
- Albert, E.; Kim, S.; Magallanes-Lundback, M.; Bao, Y.; Deason, N.; Danilo, B.; Wu, D.; Li, X.; Wood, J.C.; Bornowski, N.; et al. Genome-Wide Association Identifies a Missing Hydrolase for Tocopherol Synthesis in Plants. Proc. Natl. Acad. Sci. U S A 2022, 119, e2113488119. [Google Scholar] [CrossRef]
- Hwang, J.E.; Ahn, J.-W.; Kwon, S.-J.; Kim, J.-B.; Kim, S.H.; Kang, S.-Y.; Kim, D.S. Selection and Molecular Characterization of a High Tocopherol Accumulation Rice Mutant Line Induced by Gamma Irradiation. Mol. Biol. Rep. 2014, 41, 7671–7681. [Google Scholar] [CrossRef]
- Wang, D.; Wang, Y.; Long, W.; Niu, M.; Zhao, Z.; Teng, X.; Zhu, X.; Zhu, J.; Hao, Y.; Wang, Y.; et al. SGD1, a Key Enzyme in Tocopherol Biosynthesis, Is Essential for Plant Development and Cold Tolerance in Rice. Plant Sci. 2017, 260, 90–100. [Google Scholar] [CrossRef]
- Somsri, A.; Chu, S.-H.; Nawade, B.; Lee, C.-Y.; Park, Y.-J. Harnessing γ-TMT Genetic Variations and Haplotypes for Vitamin E Diversity in the Korean Rice Collection. Antioxidants 2024, 13, 234. [Google Scholar] [CrossRef]
- Kazemzadeh, S.; Farrokhi, N.; Ahmadikhah, A.; Tabar Heydar, K.; Gilani, A.; Askari, H.; Ingvarsson, P.K. Genome-Wide Association Study and Genotypic Variation for the Major Tocopherol Content in Rice Grain. Front Plant Sci. 2024, 15, 1426321. [Google Scholar] [CrossRef]
- Kazemzadeh, S.; Farrokhi, N.; Ahmadikhah, A.; Ingvarsson, P.K.; Heydar, K.T. Genome-Wide Association Mapping and Transcriptional Analysis Uncover Genetic Determinants of Minor Tocopherols in Rice Seeds. Sci. Rep. 2025, 15, 28530. [Google Scholar] [CrossRef]
- Ouyang, S.; He, S.; Liu, P.; Zhang, W.; Zhang, J.; Chen, S. The Role of Tocopherol Cyclase in Salt Stress Tolerance of Rice (Oryza sativa). Sci. China Life Sci. 2011, 54, 181–188. [Google Scholar] [CrossRef]
- Wang, X.L.; He, Z.J.; Zeng, L.Q.; Zeng, Y.Y.; Zhou, Z.Z.; Liu, X.L.; Cheng, X.R.; Chen, H.; Chen, Z.J. Identification, Characterization, and Expression Profiling of α-Tocopherol Biosynthesis Genes Associated with Anilofos Metabolism in Oryza sativa. Chem. Biol. Technol. Agric. 2025, 12, 124. [Google Scholar] [CrossRef]
- Song, S.; Li, H.; Lin, S.; Dong, X.; Tian, R.; Wu, Z.; Li, Q.; Li, M.; Zhang, K.; Liu, X.; et al. Heterologous Expression of Sunflower HaHPT and HaTMT Genes Enhances Rice-Grain Vitamin E Content. Plants 2024, 13, 2392. [Google Scholar] [CrossRef]
- Sundararajan, S.; Rajendran, V.; Sivakumar, H.P.; Nayeem, S.; Mani Chandra, H.; Sharma, A.; Ramalingam, S. Enhanced Vitamin E Content in an Indica Rice Cultivar Harbouring Two Transgenes from Arabidopsis Thaliana Involved in Tocopherol Biosynthesis Pathway. Plant Biotechnol. J. 2021, 19, 1083–1085. [Google Scholar] [CrossRef]
- Xie, W.; Wang, G.; Yuan, M.; Yao, W.; Lyu, K.; Zhao, H.; Yang, M.; Li, P.; Zhang, X.; Yuan, J.; et al. Breeding Signatures of Rice Improvement Revealed by a Genomic Variation Map from a Large Germplasm Collection. Proc. Natl. Acad. Sci. U S A 2015, 112, E5411–E5419. [Google Scholar] [CrossRef]
- Zhang, H.; Shi, Y.; Sun, M.; Hu, X.; Hao, M.; Shu, Y.; Zhou, X.-R.; Hu, Q.; Li, C.; Mei, D. Functional Differentiation of BnVTE4 Gene Homologous Copies in α-Tocopherol Biosynthesis Revealed by CRISPR/Cas9 Editing. Front Plant Sci. 2022, 13, 850924. [Google Scholar] [CrossRef]
- Wang, H.; Xu, X.; Vieira, F.G.; Xiao, Y.; Li, Z.; Wang, J.; Nielsen, R.; Chu, C. The Power of Inbreeding: NGS-Based GWAS of Rice Reveals Convergent Evolution during Rice Domestication. Mol. Plant 2016, 9, 975–985. [Google Scholar] [CrossRef]
- Choi, J.Y.; Platts, A.E.; Fuller, D.Q.; Hsing, Y.-I.; Wing, R.A.; Purugganan, M.D. The Rice Paradox: Multiple Origins but Single Domestication in Asian Rice. Mol. Biol. Evol. 2017, 34, 969–979. [Google Scholar] [CrossRef]
- Li, Y.; Yang, Z.; Yang, C.; Liu, Z.; Shen, S.; Zhan, C.; Lyu, Y.; Zhang, F.; Li, K.; Shi, Y.; et al. The NET Locus Determines the Food Taste, Cooking and Nutrition Quality of Rice. Sci. Bull. 2022, 67, 2045–2049. [Google Scholar] [CrossRef]
- Zhao, S.; Fu, S.; Cao, Z.; Liu, H.; Huang, S.; Li, C.; Zhang, Z.; Yang, H.; Wang, S.; Luo, J.; et al. OsUGT88C3 Encodes a UDP-Glycosyltransferase Responsible for Biosynthesis of Malvidin 3-O-Galactoside in Rice. Plants 2024, 13, 697. [Google Scholar] [CrossRef]
- Zhang, Z.; Zhang, F.; Deng, Y.; Sun, L.; Mao, M.; Chen, R.; Qiang, Q.; Zhou, J.; Long, T.; Zhao, X.; et al. Integrated Metabolomics and Transcriptomics Analyses Reveal the Metabolic Differences and Molecular Basis of Nutritional Quality in Landraces and Cultivated Rice. Metabolites 2022, 12, 384. [Google Scholar] [CrossRef]
- Yang, J.; Chen, R.; Wang, C.; Li, C.; Ye, W.; Zhang, Z.; Wang, S. A Widely Targeted Metabolite Modificomics Strategy for Modified Metabolites Identification in Tomato. J. Integr. Plant Biol. 2024, 66, 810–823. [Google Scholar] [CrossRef]
- Kang, H.M.; Sul, J.H.; Service, S.K.; Zaitlen, N.A.; Kong, S.-Y.; Freimer, N.B.; Sabatti, C.; Eskin, E. Variance Component Model to Account for Sample Structure in Genome-Wide Association Studies. Nat. Genet. 2010, 42, 348–354. [Google Scholar] [CrossRef]
- Kalendar, R.; Shustov, A.V.; Akhmetollayev, I.; Kairov, U. Designing Allele-Specific Competitive-Extension PCR-Based Assays for High-Throughput Genotyping and Gene Characterization. Front. Mol. Biosci. 2022, 9, 773956. [Google Scholar] [CrossRef]
- Zhao, H.; Yao, W.; Ouyang, Y.; Yang, W.; Wang, G.; Lian, X.; Xing, Y.; Chen, L.; Xie, W. RiceVarMap: A Comprehensive Database of Rice Genomic Variations. Nucleic Acids Res. 2015, 43, D1018–D1022. [Google Scholar] [CrossRef] [PubMed]
- Zhao, H.; Li, J.; Yang, L.; Qin, G.; Xia, C.; Xu, X.; Su, Y.; Liu, Y.; Ming, L.; Chen, L.-L.; et al. An Inferred Functional Impact Map of Genetic Variants in Rice. Mol. Plant 2021, 14, 1584–1599. [Google Scholar] [CrossRef]
Figure 1.
Association analysis of the VEQ2 locus with brown rice α-tocopherol content. (A) Manhattan plot of genome-wide association study (GWAS) for α-tocopherol content in brown rice across 533 rice accessions. The red dashed line indicates the significance threshold (−log10P = 5), and the arrow points to the significant association signal of the VEQ2 locus on chromosome 2. (B) Box plot of brown rice α-tocopherol content for VEQ2 genotypes TT (homozygous T; N = 285), and CC (homozygous C; N = 247). The upper and lower boundaries of the box represent the third quartile and first quartile, respectively. The black solid line indicates the median, the yellow dashed line indicates the mean, whiskers extend to the most extreme values within 1.5× the interquartile range, and blue dots represent outliers. **, P < 0.01.
Figure 1.
Association analysis of the VEQ2 locus with brown rice α-tocopherol content. (A) Manhattan plot of genome-wide association study (GWAS) for α-tocopherol content in brown rice across 533 rice accessions. The red dashed line indicates the significance threshold (−log10P = 5), and the arrow points to the significant association signal of the VEQ2 locus on chromosome 2. (B) Box plot of brown rice α-tocopherol content for VEQ2 genotypes TT (homozygous T; N = 285), and CC (homozygous C; N = 247). The upper and lower boundaries of the box represent the third quartile and first quartile, respectively. The black solid line indicates the median, the yellow dashed line indicates the mean, whiskers extend to the most extreme values within 1.5× the interquartile range, and blue dots represent outliers. **, P < 0.01.
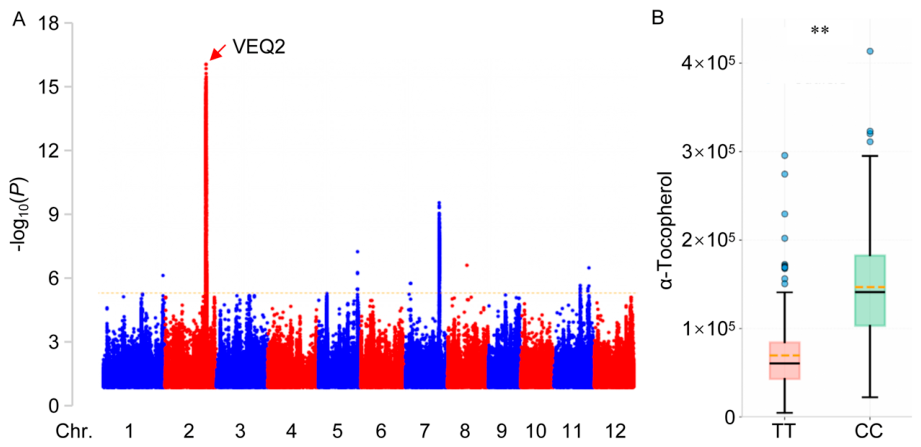
Figure 2.
VEQ2 allelic discrimination and association of VEQ2 genotypes with α-tocopherol content in brown rice, milled rice, and retention rate in the F2 population of Baikezaohe × AKITAKOMACHI. (A) Allelic discrimination plot of the VEQ2 locus. Blue, green, and red dots represent homozygous T (TT), heterozygous (CT), and homozygous C (CC) genotypes, respectively. Black dots indicate signals of ddH2O. (B–D) Box plots showing α-tocopherol content in brown rice (B), milled rice (C), and the retention rate of α-tocopherol in milled rice relative to brown rice (D) across three VEQ2 genotypes (CC, CT, and TT) in the F2 population. The horizontal line within each box represents the median, the box edges indicate the 25th and 75th percentiles, and the whiskers extend to 1.5× the interquartile range. Outliers are shown as colored dots. The plus sign (+) denotes the mean. Statistical significance between genotypes was determined by one-way ANOVA followed by Tukey's multiple comparison test. ✱, P < 0.05; ns, no significant difference. The number of samples analyzed was n = 13 for CC, n = 28 for CT, and n = 9 for TT in brown rice; n = 11 for CC, n = 24 for CT, and n = 9 for TT in milled rice and retention rate.
Figure 2.
VEQ2 allelic discrimination and association of VEQ2 genotypes with α-tocopherol content in brown rice, milled rice, and retention rate in the F2 population of Baikezaohe × AKITAKOMACHI. (A) Allelic discrimination plot of the VEQ2 locus. Blue, green, and red dots represent homozygous T (TT), heterozygous (CT), and homozygous C (CC) genotypes, respectively. Black dots indicate signals of ddH2O. (B–D) Box plots showing α-tocopherol content in brown rice (B), milled rice (C), and the retention rate of α-tocopherol in milled rice relative to brown rice (D) across three VEQ2 genotypes (CC, CT, and TT) in the F2 population. The horizontal line within each box represents the median, the box edges indicate the 25th and 75th percentiles, and the whiskers extend to 1.5× the interquartile range. Outliers are shown as colored dots. The plus sign (+) denotes the mean. Statistical significance between genotypes was determined by one-way ANOVA followed by Tukey's multiple comparison test. ✱, P < 0.05; ns, no significant difference. The number of samples analyzed was n = 13 for CC, n = 28 for CT, and n = 9 for TT in brown rice; n = 11 for CC, n = 24 for CT, and n = 9 for TT in milled rice and retention rate.
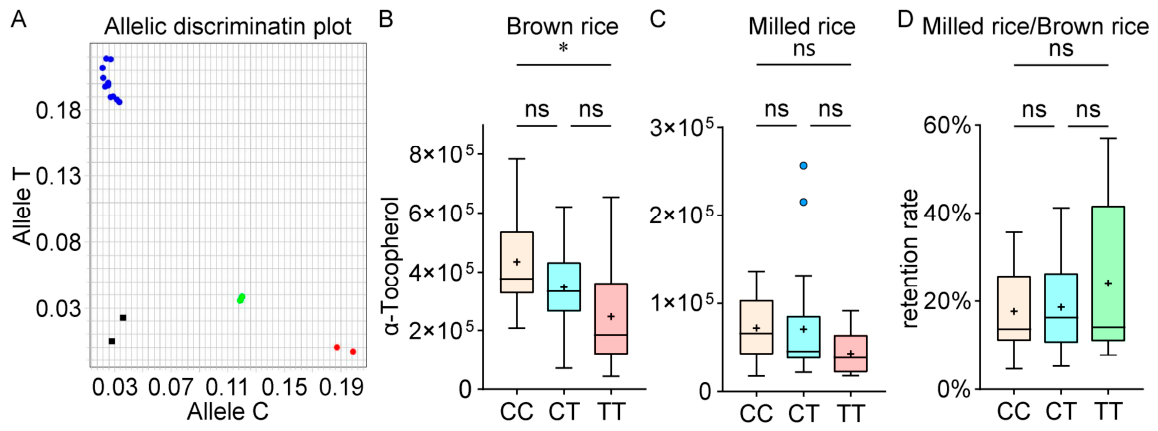
Figure 3.
Phenotypes of backcross introgression lines at the VEQ2 locus. (A) Line LT36 (BC3F4); (B) Line LT60 (BC2F5); (C) Line LT54 (BC2F2); (D) Line LT48 (BC3F3). Lines LT36, LT60, and LT54 carry the CC genotype at VEQ2, whereas LT48 carries the TT genotype. PXB is the recurrent parent, and AKITAKOMACHI (AK) is the donor parent. Scale bar: 10 cm.
Figure 3.
Phenotypes of backcross introgression lines at the VEQ2 locus. (A) Line LT36 (BC3F4); (B) Line LT60 (BC2F5); (C) Line LT54 (BC2F2); (D) Line LT48 (BC3F3). Lines LT36, LT60, and LT54 carry the CC genotype at VEQ2, whereas LT48 carries the TT genotype. PXB is the recurrent parent, and AKITAKOMACHI (AK) is the donor parent. Scale bar: 10 cm.
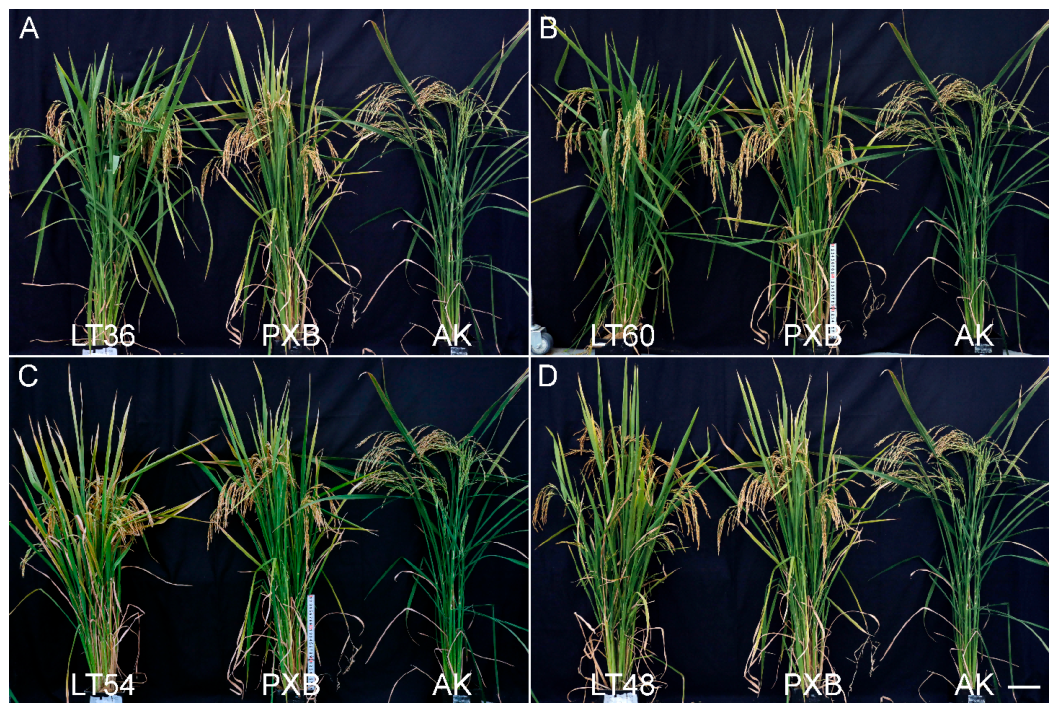
Figure 4.
Composition analysis of vitamin E components in brown rice of backcross introgression lines at the VEQ2 locus. (A) Absolute content of α-tocopherol; (B) relative content of α-tocotrienol; (C) relative content of β-tocopherol; (D) relative content of β-tocotrienol; (E) relative content of δ-tocotrienol. PXB and AKITAKOMACHI (AK) are the recurrent and donor parent controls, respectively; LT34–LT66 are introgression lines. Blue and yellow dashed lines indicate the corresponding vitamin E component levels in PXB and AK, respectively; blue and yellow bars represent the TT and CC genotypes, respectively. Bar height represents the mean, error bars indicate standard deviation, and dots represent individual biological replicates. Asterisks indicate significant differences compared with the recurrent parent PXB: ✱, P < 0.05; ✱✱, P < 0.01 (Student’s t-test).
Figure 4.
Composition analysis of vitamin E components in brown rice of backcross introgression lines at the VEQ2 locus. (A) Absolute content of α-tocopherol; (B) relative content of α-tocotrienol; (C) relative content of β-tocopherol; (D) relative content of β-tocotrienol; (E) relative content of δ-tocotrienol. PXB and AKITAKOMACHI (AK) are the recurrent and donor parent controls, respectively; LT34–LT66 are introgression lines. Blue and yellow dashed lines indicate the corresponding vitamin E component levels in PXB and AK, respectively; blue and yellow bars represent the TT and CC genotypes, respectively. Bar height represents the mean, error bars indicate standard deviation, and dots represent individual biological replicates. Asterisks indicate significant differences compared with the recurrent parent PXB: ✱, P < 0.05; ✱✱, P < 0.01 (Student’s t-test).
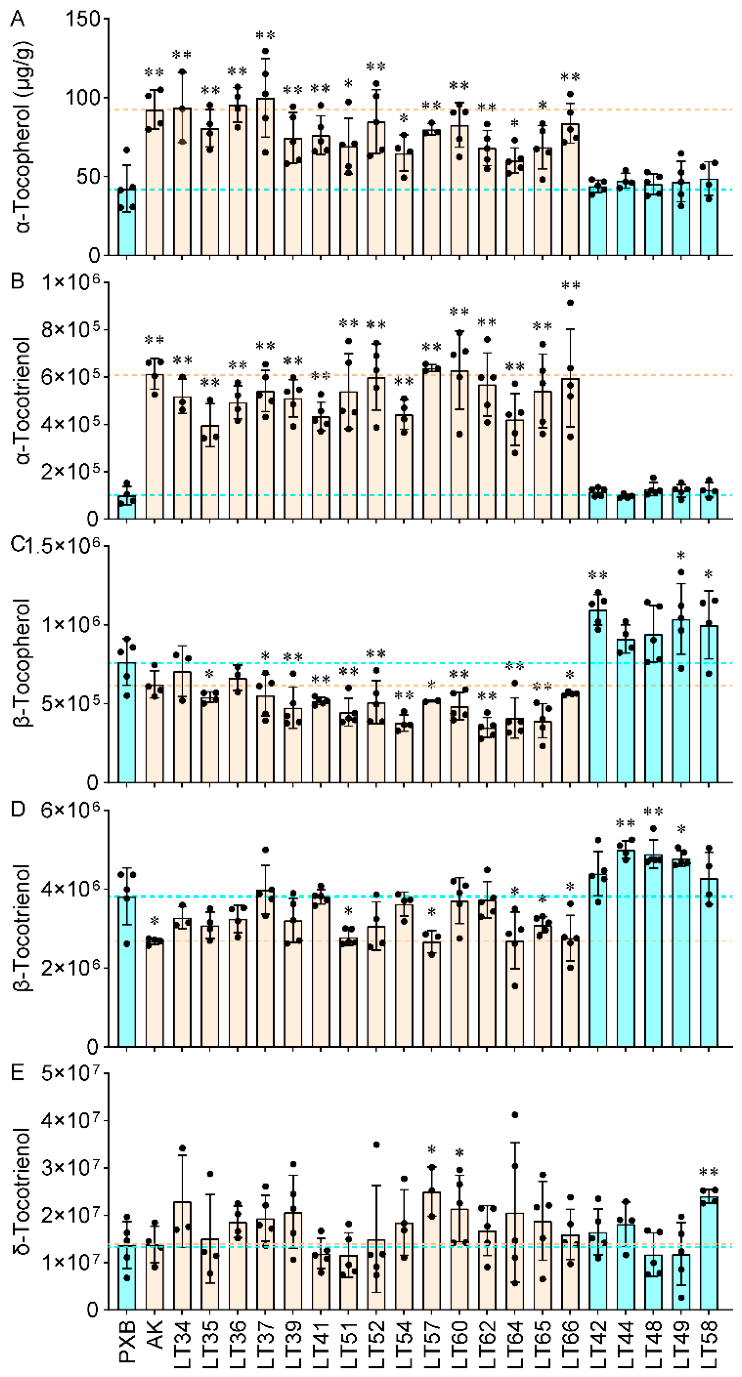

Table 1.
Agronomic traits of VEQ2 backcross introgression lines.abce.
| Line No.d | PH (cm) | TN | SSR (%) | GL (mm) | GW (mm) | L/W | TGW (g) | YPP (g) |
| PXB | 92.29±1.8 | 12.43±3.05 | 77.51±2.90 | 7.52±0.22 | 1.78±0.07 | 4.3±0.2 | 21.16±0.09 | 26.19±2.06 |
| AK | 114.57±7.46** | 12.71±1.98 | 78.31±8.64 | 7.45±0.31 | 1.71±0.07* | 4.44±0.1* | 20.9±0.18** | 27.96±5.08 |
| CC | 92.91±5.23 | 14.77±1.77 | 79.92%±2.57 | 6.37±1.58 | 1.74±0.19 | 3.70±0.62 | 21.11±0.10 | 25.85±2.09 |
| TT | 95.43±3.85 | 13.75±0.72 | 79.12%±1.45 | 7.40±0.18 | 1.72±0.05 | 4.41±0.08 | 21.15±0.08 | 25.12±3.43 |
| LT34 | 103.29±1.89** | 14.86±2.54 | 87.65±9.08** | 7.72±0.51 | 1.87±0.13 | 4.27±0.18 | 20.95±0.16** | 23.98±3.4* |
| LT35 | 96±3.46** | 17.71±3.73** | 79.75±2.60 | 8.05±0.5* | 1.88±0.09* | 4.4±0.14 | 21.21±0.15 | 24.92±2.99 |
| LT36 | 92.57±2.99 | 12.57±2.37 | 81.13±3.35* | 7.73±0.68 | 1.85±0.14 | 4.29±0.17 | 21.19±0.12 | 28.46±3.61* |
| LT37 | 98±3.32** | 12.57±1.62 | 79.62±10.17 | 7.28±0.41 | 1.71±0.07* | 4.38±0.32 | 21.18±0.18 | 28.75±2.59** |
| LT39 | 96.14±2.41** | 14.57±2.37 | 80.84±3.38* | 8.41±0.46** | 2.02±0.21* | 4.28±0.34 | 21.18±0.11 | 27.71±4.22 |
| LT41 | 99.43±4.69** | 15.71±1.89* | 80.14±7.66 | 7.5±0.5 | 1.8±0.11 | 4.33±0.26 | 21±0.21* | 22.87±4.77* |
| LT51 | 90.29±1.89* | 14±3.21 | 77.47±2.18 | 4.84±1.37** | 1.6±0.18* | 3.06±0.69** | 21.12±0.19 | 23.22±5.01 |
| LT52 | 91.29±2.36 | 12.43±1.81 | 79.05±4.05 | 7.3±1.13 | 1.93±0.16* | 3.86±0.35* | 21.23±0.21 | 22.72±2.66** |
| LT54 | 87.14±1.57** | 14±1.29 | 75.93±7.45 | 7.84±0.77 | 1.98±0.2* | 4.08±0.44 | 21.21±0.14 | 24.92±3.41 |
| LT57 | 90.43±4.39 | 12.43±0.98 | 80.41±3.76* | 6.02±1.43** | 1.83±0.29 | 3.4±0.5 | 21.2±0.19 | 27.69±8.52 |
| LT60 | 89.43±2.64* | 14.86±1.35* | 80.07±4.57 | 4.92±0.79** | 1.54±0.17** | 3.23±0.3** | 21.04±0.12* | 26.77±3.52 |
| LT62 | 86.86±2.04** | 15.57±1.4* | 77.38±2.74 | 4.64±0.92** | 1.52±0.1** | 3.1±0.5** | 21.12±0.08 | 25.72±5.88 |
| LT64 | 87±1.63** | 16.71±1.98** | 79.48±3.07 | 4.17±0.53** | 1.48±0.07** | 2.89±0.27** | 20.97±0.05** | 25.97±3.61 |
| LT65 | NA | 16.71±1.5** | 80.56±3.70* | 4.74±0.88** | 1.59±0.19* | 3.03±0.32** | 21±0.04** | 25.45±3.08 |
| LT66 | NA | 16.86±2.27** | 79.26±2.84 | 4.35±1.42** | 1.52±0.21** | 2.85±0.58** | 21.01±0.26 | 28.59±4.4 |
| LT42 | 98±4.08** | 14±1.53 | 79.30±2.99 | 7.47±0.43 | 1.78±0.11 | 4.33±0.31 | 21.22±0.09 | 24.95±7.03 |
| LT44 | NA | NA | 78.45±9.15 | 7.6±0.4 | 1.74±0.13 | 4.5±0.24 | 21.04±0.22 | NA |
| LT48 | 97.29±2.69** | 14.57±1.99 | 78.59±7.60 | 7.41±0.28 | 1.71±0.09 | 4.45±0.23 | 21.11±0.08 | 27.67±6.43 |
| LT49 | 96.71±3.5** | 13.57±1.72 | 77.75±3.60 | 7.11±0.58 | 1.64±0.08** | 4.45±0.21 | 21.19±0.06 | 20.33±2.93** |
| LT58 | 89.71±3.99 | 12.86±1.35 | 81.53±4.88* | 7.39±0.58 | 1.75±0.15 | 4.34±0.21 | 21.2±0.06 | 27.52±8.14 |
a Data are presented as mean ± standard deviation (SD) of 5-19 biological replicates. b PH, plant height; TN, tiller number; SSR, seed setting rate; GL, grain Length; GW, grain width; L/W, length/width Ratio; TGW, thousand Grain Weight; YPP, Yield per Plant. c Asterisks indicate significant differences compared with the control PXB (TT genotype) by Student's t-test: *P < 0.05, **P < 0.01. d PXB and AK are recurrent and donor parents, respectively. Values for CC and TT are means of CC- and TT-genotype introgression lines, respectively. LT34–LT66 are CC-genotype introgression lines; LT42–LT58 are TT-genotype introgression lines. e NA, sample not analyzed.
Table 2.
Genotype frequency of the VEQ2 locus in 4,726 rice germplasm accessionsab.
| Populationsc | Size | Frequency of TT | Frequency of CC | Frequency of N |
| All | 4726 | 52.7% | 46.9% | 0.4% |
| Indica | 2759 | 84.2% | 15.3% | 0.6% |
| Japonica | 1512 | 0.4% | 99.5% | 0.1% |
| Aus | 269 | 49.8% | 50.2% | 0.0% |
| VI/Aromatic | 96 | 1.0% | 99.0% | 0.0% |
| Intermediate | 90 | 28.9% | 67.8% | 3.3% |
a Genotypes from RiceVarMap v3.0 (https://ricevarmap.ncpgr.cn/v3/). b CC and TT denote homozygous C, homozygous T genotypes, respectively. N indicates missing data at the VEQ2 locus. c Population classification follows RiceVarMap v3.0.
Disclaimer/Publisher’s Note: The statements, opinions and data contained in all publications are solely those of the individual author(s) and contributor(s) and not of MDPI and/or the editor(s). MDPI and/or the editor(s) disclaim responsibility for any injury to people or property resulting from any ideas, methods, instructions or products referred to in the content. |
© 2026 by the authors. Licensee MDPI, Basel, Switzerland. This article is an open access article distributed under the terms and conditions of the Creative Commons Attribution (CC BY) license (http://creativecommons.org/licenses/by/4.0/).
Copyright: This open access article is published under a Creative Commons CC BY 4.0 license, which permit the free download, distribution, and reuse, provided that the author and preprint are cited in any reuse.