
Submitted:
23 August 2026
Posted:
25 August 2026
You are already at the latest version
Abstract
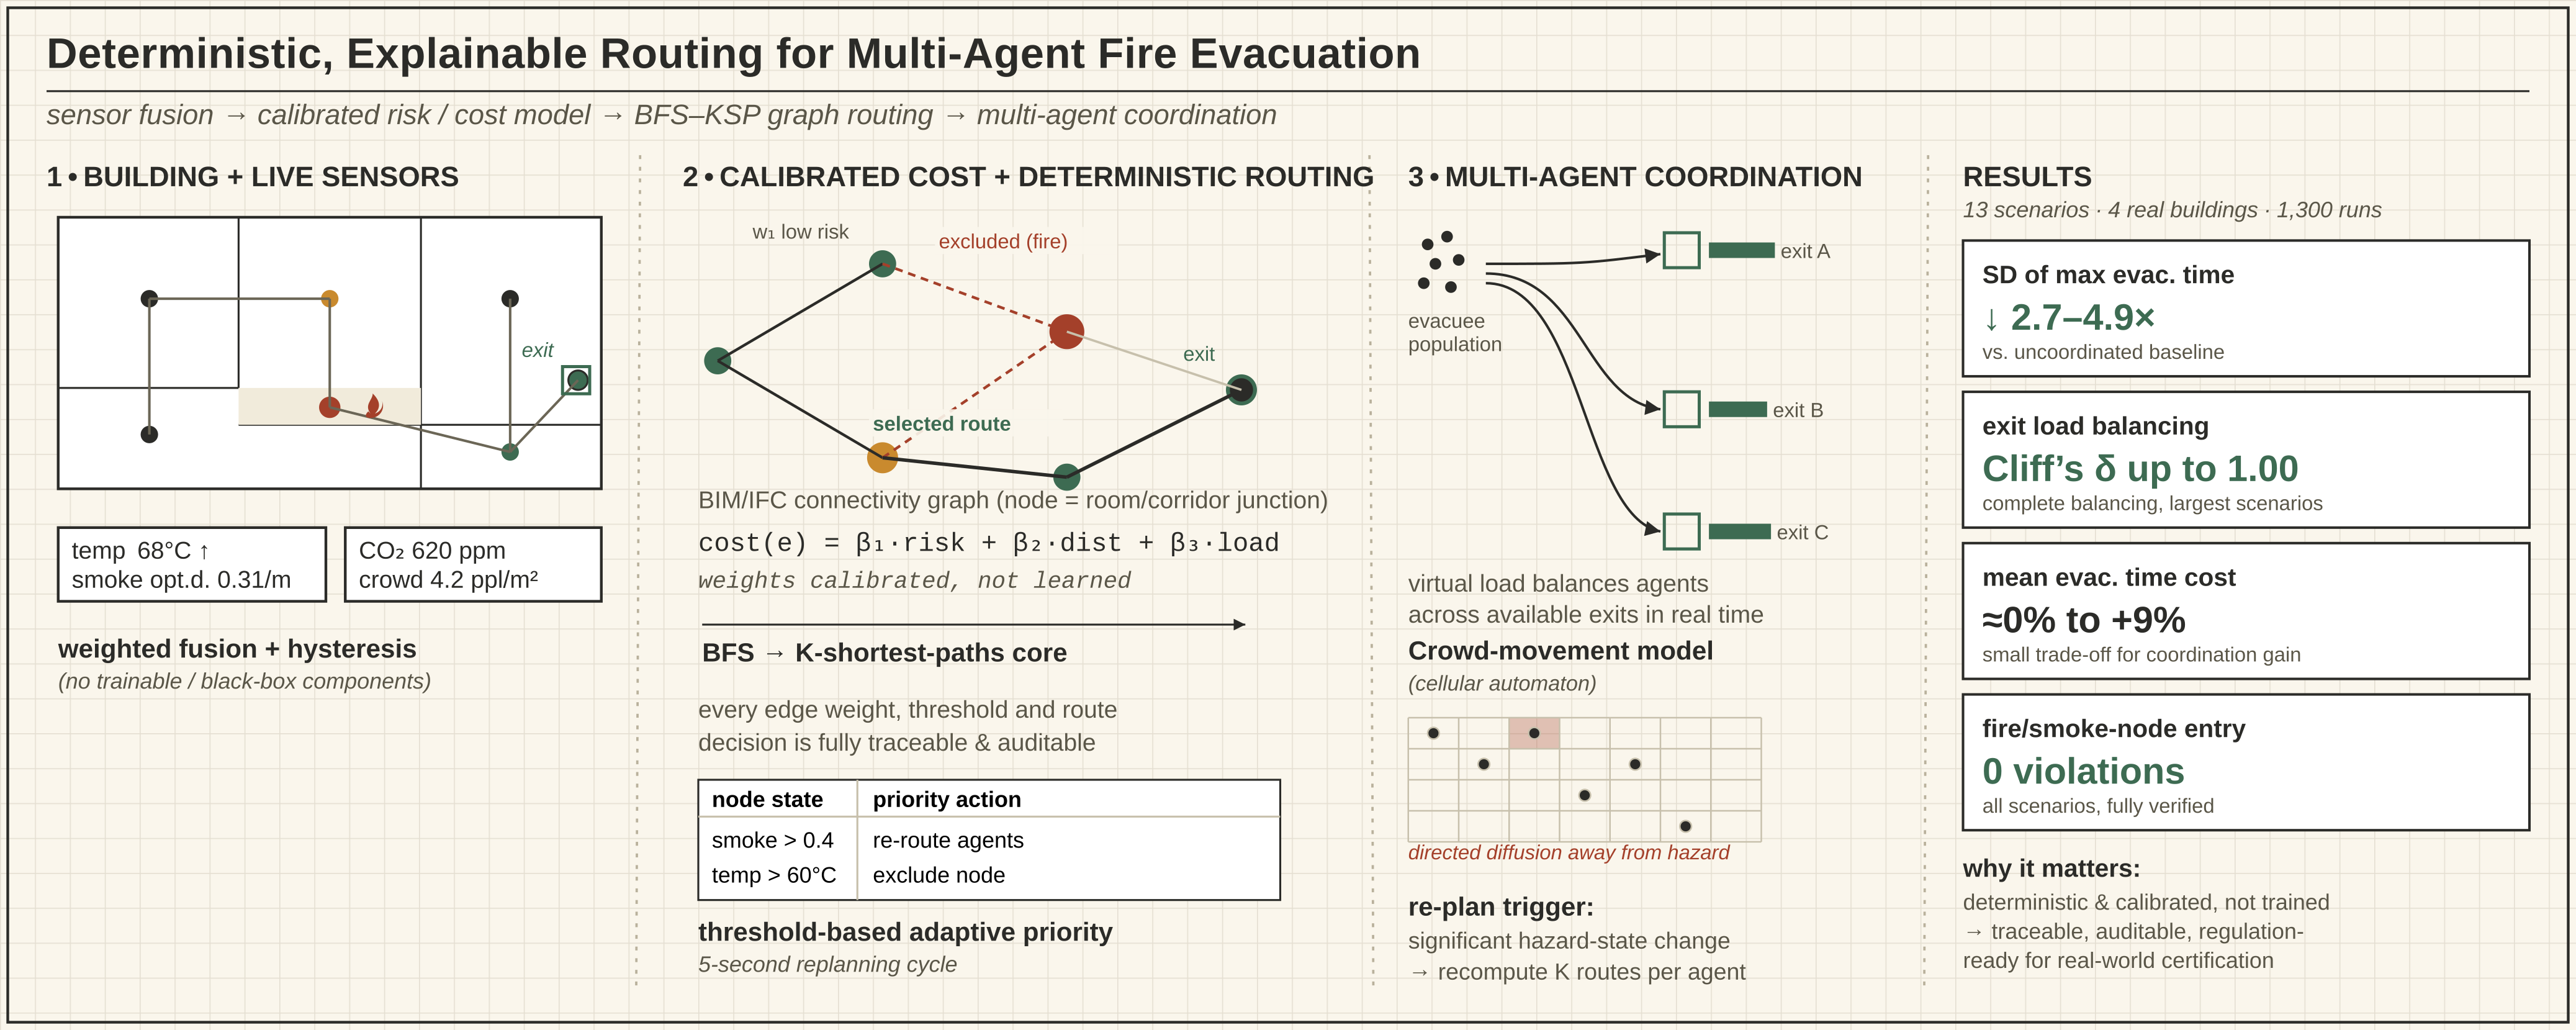
Fire evacuation in complex multi-storey buildings is a dynamic task in which route safety changes depending on fire development, smoke propagation, and the spatial distribution of evacuees. Contemporary research increasingly applies artificial-intelligence methods for adaptive evacuation planning, but most of these approaches achieve adaptivity at the expense of interpretability and traceability. This is a limitation that is especially critical for systems with direct relevance to human safety. The present paper introduces a fully deterministic approach to intelligent fire evacuation that extends the hierarchical building graph model proposed by Ivanov [1] with continuous sensor-based risk assessment (temperature, smoke, CO₂, crowd density), unified through weighted fusion with hysteresis. Route evaluation uses a calibrated composite edge-cost model, complemented by a threshold-based table for adaptive node priority and multi-agent coordination through virtual load, while evacuee movement is modeled by a cellular automaton. All components of the proposed system are configurable and calibrated rather than trainable, which ensures full traceability, auditability, and compliance with fire-safety regulatory requirements. Evaluation across thirteen scenarios in four real buildings shows that the system's adaptivity stems mainly from multi-agent coordination and dynamic route recomputation, rather than from offline calibration of the graph weights. Coordination reduces the standard deviation of the maximum evacuation time by a factor of 2.7 to 4.9 relative to an uncoordinated baseline algorithm, at a mean evacuation time that is practically equivalent (within 1%) or, in the worst case, about 9% higher. The system achieves complete load balancing across exits (Cliff's delta up to 1.00) and guaranteed avoidance of fire and smoke nodes in all test scenarios, with the only exception involving boundary cases in which fire spreads faster than the sensor-classification interval, a physical detection-latency limit rather than a routing failure. These results indicate that deterministic, calibrated coordination can achieve adaptivity comparable to learning-based methods while preserving the traceability and auditability required for regulatory-compliant fire-safety deployment.
Keywords:
fire evacuation
; deterministic routing
; sensor fusion
; risk assessment
; regulatory compliance
; multi-agent systems
; dynamic route planning
1. Introduction
Fires in multi-storey and architecturally complex buildings continue to represent one of the most serious challenges for human-safety systems. Regardless of advances in building codes, fire-protection installations, and early-warning systems, effective evacuation remains a critical factor in limiting human losses. Data from the systematic bibliometric analysis by Qi et al. [2], covering 673 publications from 2000 to 2024, show that research interest in fire evacuation is growing exponentially. 59.3% of all publications are concentrated in the last five years, reflecting the increasing recognition of the problem as an unresolved scientific task. The main reason is that real fires are highly dynamic events in which building conditions change continuously because of fire spread, smoke accumulation, decreasing visibility, changes in air toxicity, and the emergence of local congestion along evacuation routes. Under such conditions, predefined evacuation plans often cannot guarantee optimal, or even safe, behavior for all occupants.
Over the last decade, a significant transformation has been observed in fire-evacuation research. According to the systematic reviews by Muthukumar et al. [3] and Qi et al. [2], the field is gradually moving from static evacuation models toward intelligent systems that combine sensor data, digital building models, fire-development simulations, and artificial-intelligence algorithms. Muthukumar et al. [3] analyze 96 peer-reviewed publications and identify a clear shift from rule-based systems to deep-learning solutions, noting that the largest share of AI research (43.75%) is directed at the disaster-response phase—the phase into which real-time evacuation routing falls. This trend is driven by the need for evacuation decisions to be adapted to the specific real-time situation rather than based on predefined scenarios.
In parallel, technologies for creating digital representations of the building environment are also developing. The integration of Building Information Modeling (BIM) and Fire Dynamics Simulator (FDS) enables the construction of digital twins that combine the building’s spatial structure with fire-dynamics models and risk assessment [4]. Simulation studies by Zhang et al. [5] in L-shaped buildings demonstrate that the safety of evacuation routes depends not only on distance to exits but also on smoke dynamics, airflow direction, and fire-origin location — factors whose consideration requires a substantially richer information basis than that provided by static plans.
Significant progress is also observed in the use of machine-learning and reinforcement-learning algorithms. Contemporary research demonstrates the potential of deep learning for predicting fire development, assessing risk, and dynamically planning evacuation routes [6,7,8]. In addition, the development of multi-agent approaches enables coordination of the behavior of large groups of people and management of evacuation processes in complex environments [9,10,11].
Despite these significant achievements, there is a substantial contradiction between the adaptivity of contemporary AI-based solutions and the requirements for reliability, transparency, and traceability in safety-critical systems. Most contemporary models achieve high effectiveness through complex neural architectures whose behavior is difficult to interpret and formally verify. From the standpoint of real-world deployment, this represents a serious limitation, since evacuation decisions in safety-critical systems must not only be effective but must also meet the requirements of the applicable regulations and fire-safety building codes, which presuppose deterministic, traceable, and verifiable system behavior. Muthukumar et al. [3] and Qi et al. [2] identify precisely the lack of explainability, limited generalizability, and difficulties in real-world deployment as among the field’s main unresolved problems. These limitations become especially critical when a system must be approved by regulatory bodies or certified for real-world operation.
The present study treats evacuation as a real-time intelligent decision-support task in which adaptivity to a dynamically changing environment is achieved without the use of trainable or “black-box” components, relying entirely on deterministic, configurable, and traceable mechanisms. This work is developed as a direct extension of the BFS-based KSP algorithm for hierarchical buildings proposed by Ivanov [1], whose deterministic graph architecture is retained as the system’s core and extended with three complementary, fully formula-based mechanisms: a calibrated model for weighting graph edges, threshold-based adaptation of priorities, and multi-agent coordination.
The main contributions of the present work are:
- A fully deterministic evacuation algorithm combining BFS/K-shortest-paths search with a calibrated composite edge-cost model, a threshold-based table for adaptive node priority, and multi-agent coordination;
- A weighted sensor-fusion module with hysteresis for converting continuous sensor readings (temperature, smoke, CO₂, crowd density) into topological-graph parameters, without trainable components;
- A cellular automaton with directed diffusion and a danger-escape mechanism for realistic modeling of evacuees under a dynamically spreading fire;
- An architectural separation between statically calibrated parameters and the dynamically adapted priority layer, providing both full traceability/auditability and adaptivity, a prerequisite for regulatory compliance and certification in real evacuation systems;
- Empirical validation across thirteen scenarios in four real buildings, including ablation configurations, one-at-a-time sensitivity analysis, and a Monte Carlo comparative study against multiple baseline configurations and alternative route-sorting criteria.
The remainder of the paper is organized as follows: Section 2 reviews the existing literature and positions the proposed approach relative to it; Section 3 describes the methodology — the architecture, risk assessment, the route-cost model, adaptive node priority, agent coordination, and the crowd model; Section 4 presents comparative experiments across thirteen scenarios in four buildings; Section 5 verifies compliance with regulatory requirements; Section 6 discusses the results and limitations; Section 7 summarizes the contributions and conclusions.
2. Related Work
To situate the present study within contemporary trends, it is necessary to review the available systematic reviews that outline the field’s development and identify its unresolved problems.
Muthukumar et al. [3] present a systematic review of AI applications in disaster management, analyzing 96 peer-reviewed publications from IEEE Xplore, Elsevier, Wiley, and Springer using the PRISMA methodology and bibliometric analysis with VOSviewer. The review establishes a clear evolution from rule-based systems to machine-learning and deep-learning solutions. The authors identify three key unresolved problems: (1) the quality and representativeness of training data; (2) the limited generalizability of models to unfamiliar scenarios and environments; and (3) the substantial gap between laboratory developments and real-world operational deployment in emergency systems. These problems directly motivate architectural decisions in the present work.
Qi et al. [2] conduct a bibliometric and systematic analysis of 673 publications in the field of fire evacuation for the period 2000–2024 and identify three dominant research directions: crowd-behavior analysis, evacuation simulation and optimization, and risk perception in decision-making. The authors propose the “perception–behavior–model” framework as a unifying conceptual basis and identify the growing use of AI and RL for dynamic optimization after 2021 as a leading trend. A persistent problem is the shortage of real fire data, which forces most studies to rely on simulated data.
The two reviews outline the boundaries of current knowledge and serve as a methodological basis for structuring the remaining subsections of this review.
2.1. Modeling the Fire Environment
The effectiveness of any evacuation-support system depends directly on the quality of information about building conditions and fire development. For this reason, a significant portion of contemporary research is directed toward building digital representations of the building environment that enable risk assessment and prediction of incident development.
Zhang et al. [5] use the Fire Dynamics Simulator (FDS) to analyze nine fire scenarios in a 15-storey L-shaped building, systematically varying fire origin, floor, and wind direction. The results demonstrate that visibility is the most sensitive indicator of fire development. It responds faster than temperature and CO and shows a larger hazardous zone. More importantly, the authors find that the safety of evacuation routes depends nonlinearly on the combination of all these factors: in the baseline scenario, Stairwell 1 remains safe for only about 60 s, whereas under different wind conditions the order of preference is completely reversed. This shows that traditional static evacuation plans are structurally unable to guarantee optimal decisions during real, evolving fires.
Leong et al. [4] extend the capabilities of FDS through integration with Building Information Modeling (BIM). Their proposed conceptual framework, implemented on a three-storey building in Revit, the Dynamo API, and PyroSim, enables automated regulatory-compliance checking and the integration of fire-simulation results back into the BIM model. From the simulation, an Available Safe Egress Time (ASET) of 331 s was determined, while the evacuation time was under 30 s. The work demonstrates a functioning pipeline from BIM through fire scenario to evacuation decision. In this way, BIM becomes not merely a design tool but also a platform for risk analysis and safety management.
Further development of this idea is presented by Deng et al. [12], who use an ontological model (IFEEont) to represent fire-safety knowledge, integrated with BIM through IFC and Protégé/SWRL rules. The approach enables automated semantic inference of space-accessibility information and dynamic generation of evacuation routes, validated on a six-storey office building in Guangzhou. The method improves interoperability between different information systems but offers no trainable components and relies on predefined rules.
In the same direction, Jiang et al. [13] propose a method for semantically enriching a BIM model, specifically targeting the requirements of fire simulation. Their method automatically populates the BIM model with information needed by the simulation engine (material properties, boundary conditions, space classification) that is typically missing from design-oriented BIM models. The approach demonstrates optimization of the evacuation design of public buildings directly on the enriched model, confirming that the quality of the BIM-to-simulation conversion remains a key bottleneck regardless of the chosen evacuation algorithm itself.
2.2. Dynamic Evacuation Route Planning
Classical studies in this area treat evacuation as the task of finding an optimal route between a starting point and a destination in the presence of dynamically changing constraints.
Shih and Tsai [14] propose a multi-criteria approach for determining the safest fire-evacuation route, in which fire-spread prediction via a CMS-LSTM model is combined with the SPS (Safest Path Search) algorithm. The system achieves over 10% higher survivability compared with previous methods and is about 10 times faster at computing routes, thanks to a two-level map architecture. The limitation is that effectiveness depends directly on the accuracy of the fire prediction.
Guan et al. [15] develop this idea further through a bi-objective optimization model that simultaneously minimizes risk and path length via a modified Dijkstra algorithm. Risk is assessed through five factors (CO, HCN, temperature, visibility, crowd density), combined through linear weighting. The results show that as the fire develops, the system successfully reroutes from a shorter, riskier path to a longer but safe one.
Yen et al. [16] develop two algorithms: SIEP for individual evacuation and SGEP for group evacuation in an IoT-equipped multi-storey building. The study is particularly relevant to the present work along three axes: (1) IoT sensor integration for real-time monitoring of smoke toxicity, analogous to the proposed sensor-fusion module; (2) the Fractional Effective Dose (FED) indicator as a quantitative measure of route risk, paralleling the proposed hazard function; and (3) prioritized group evacuation based on cumulative toxic exposure, analogous to the proposed multi-agent coordination. SGEP outperforms SIEP by up to 68.1 percentage points in a methane fire and by 50% in a PVC fire. The key difference from the proposed approach is that Yen et al. use binary node classification without continuously weighted, calibrated risk scores and without hysteresis, which makes the system more vulnerable to sensor noise.
Li et al. [17] focus on the interaction between fire spread and evacuee behavior in multi-storey hybrid buildings. The study is methodologically distinctive in that it uses Stacking Ensemble Learning (XGBoost + LightGBM + Gradient Boosting with a Lasso meta-model) to predict evacuation time, trained on 4,520 simulation records from Pathfinder. The model achieves MAE = 88.85 s and MRE = 18.88% on the test data, while the integrated routing model reduces total evacuation time by 7.12% for 4,520 evacuees. This paper is closer to Section 2.3, since it uses machine learning, and highlights the potential of predictive methods to support route selection.
Bai et al. [18] propose an improved A* algorithm with dynamic fire-risk assessment, integrating temperature, visibility, CO, and O₂ into a single quantitative score. Validation in a metro station shows about a 69–70% reduction in route risk compared with standard A*, at a moderate increase in path length (12–46%). The approach is methodologically close to the proposed algorithm in terms of its dynamic risk function, but it does not include sensor fusion with hysteresis, agent coordination, or crowd modeling.
Ant-colony-based algorithms also occupy an important place. Xu et al. [19] develop an improved Ant Colony Optimization (IACO) for a single-storey supermarket, in which the equivalent path length incorporates temperature, CO, and visibility. Zhang et al. [20] propose IAACO with a multi-factor heuristic function (risk, energy cost, length) and an adaptive evaporation coefficient, achieving up to a 63.8% reduction in inefficiency relative to standard ACO in environments with multiple exits and fire origins. Both approaches demonstrate a good ability to reach a global optimum but require substantial computational resources when scaled.
Zuo et al. [21] use Dynamic Avoid-Smoke A-Star (DASA-Star) for evacuation in metro stations, achieving a 66.8% reduction in fire risk relative to Dynamic A-Star at only a 9.2% increase in route length. Golshani and Fang [22] develop a navigation model integrating FDS, modified Dijkstra, Agent-Based Simulation, and Intelligent Adaptive Dynamic Signage (IADSS), accounting simultaneously for travel time, fire impact (FED), and congestion. Theirs is one of the few publications to consider all three competing criteria in parallel.
Regardless of the differences among these approaches, their common feature is that evacuation is treated predominantly as an optimization task with predefined rules. In most cases, a mechanism for continuous learning and adaptation to unfamiliar scenarios is absent.
2.3. Reinforcement Learning for Evacuation
As computational capabilities grow, increasing attention is being paid to reinforcement learning as a means of decision-making in a dynamic environment.
Sharma et al. [6] make two independent contributions: (1) they develop the first standardized RL environment for fire evacuation in the form of an OpenAI Gym with dynamic spread, uncertainty, and capacity constraints; and (2) they propose Q-matrix transfer learning, in which tabular Q-learning pretrains a DQN network. The results show significant improvement. QMP-Dueling DQN achieves an average of 68.75 steps compared with 642 for SARSA and 343 for PPO. An important methodological contribution is precisely the division of the task into a “structural-knowledge transfer” phase and an “online adaptation” phase. This principle is analogous to the architectural separation in the present work between the statically calibrated route-cost model and the dynamically adapted node-priority table, albeit without a trainable component on the side of the proposed system.
Feng et al. [7] use an improved DDPG algorithm (I-DDPG with RND, HER, and BWO) for continuous control of evacuation decisions in a hospital building, achieving about 100 units higher average reward and faster convergence relative to standard DDPG. Unlike Sharma et al., this work is directed at algorithm optimization rather than at a new environment. Its limitation is that the model considers a single agent without interactions among people.
Fang et al. [8] introduce the concept of tenability-based path planning through the SafeStep model, in which the reward function is based on the FED of toxic gases rather than solely on geometric characteristics. In a test scenario, SafeStep achieves a 62% reduction in FED exposure relative to Dijkstra’s algorithm and successfully identifies evacuation routes in scenarios in which Dijkstra fails to find a solution. Cumulative accounting of toxic exposure is an important step toward more realistic risk modeling.
Despite the high adaptivity of reinforcement learning, these approaches suffer from limited interpretability. Decisions are formed by complex neural models, which makes it difficult to explain the chosen route and raises questions about their reliability in safety-critical applications.
2.4. Multi-Agent Systems and Coordinated Evacuation
Under real conditions, evacuation is rarely reducible to the behavior of a single individual. For this reason, recent years have seen growing interest in multi-agent models.
Sun et al. [9] propose GRU-MAPPO, an architecture combining Multi-Agent Proximal Policy Optimization with a Gated Recurrent Unit for processing temporal dependencies. Agents are organized hierarchically (leaders and followers), with leaders planning global routes via GRU-MAPPO while local collision avoidance is handled through ORCA. The method achieves about 20% faster convergence relative to standard MAPPO, a Path Efficiency of 0.91, and a Uniformity of 0.91 when tested on a real building floor plan.
Xie et al. [10] extend this concept by integrating fire-spread models and dynamic evacuation signage within the CTM–PyroSim–QMIX framework. Each dynamic sign acts as an agent coordinated by the QMIX algorithm. Across 10 fire scenarios in a real karaoke-complex floor plan, the method achieves maximum improvements of over 30% in evacuation efficiency, over 50% reduction in fire risk, and over 70% reduction in congestion risk relative to static signage.
Omidbeyk and Ghavami [11] combine GIS, BIM, and PPO-based reinforcement learning within a unified multi-agent simulation environment implemented in Unity ML-Agents. The study demonstrates that fire location is a determining factor. For example, for a fire on the sixth floor versus a basement level, evacuation time increases by 57%. RL-trained agents consistently outperform those following a static shortest-path strategy. Spatial context from BIM/GIS has a substantial effect on the quality of the decisions made.
Shi et al. [23] specifically address the problem of balanced use of multiple exits through a Collaborative Decision-Making Framework combining Multi-Agent Proximal Policy Optimization with a dynamic, multi-objective reward mechanism and a localized (rather than global) observation strategy for each agent. The authors achieve over 70% more stable training and a 2–11% reduction in mean evacuation time relative to baseline models in an asymmetric multi-exit scenario.
Beyond purely algorithmic improvements, Yu et al. [24] demonstrate an application of multi-agent modeling to a real outpatient hospital building, aimed at resource-allocation decisions for fire response and prioritization of retrofit measures. They show that multi-agent models can serve not only for algorithm evaluation but also for direct support of engineering retrofit decisions. Bahmani et al. [25] extend the scope of multi-agent modeling to a specific, vulnerable occupant group (children in elementary schools), incorporating age-specific psychomotor and health characteristics into the agents.
These approaches demonstrate high adaptivity and an expanding range of applications—from algorithmic optimization to specific engineering and demographic contexts — but they increase model complexity and further complicate the analysis of the reasons behind specific decisions.
2.5. Integrated AI Platforms for Disaster Management
The most recent trends are directed toward building integrated systems that combine multiple AI technologies.
Saravanan et al. [26] propose architecture including computer vision (OpenCV + Canny Edge Detection), a Social Force Model for crowd simulation, Retrieval-Augmented Generation (RAG) with FAISS and GPT-2 for generating context-dependent evacuation policies, and a Graph Attention Network (GAT) for predicting optimal routes. The system achieves an average route efficiency of 0.93 with zero incursions into the hazardous zone around the fire. The limitation is that validation is entirely on synthetic scenarios and publicly available floor plans.
In a direction opposite to computational complexity, Yang et al. [27] investigate the integration of a large language model (LLM) as the “cognitive core” of each agent in an ABM simulation of disaster evacuation. Each agent maintains personality traits, observations, and a decision history, while the LLM provides context-aware reasoning and inter-agent communication. The improvements demonstrated in realism and adaptivity come at the cost of complete opacity in the agent-level decision-making process.
A systematic literature review by Lin et al. [28], covering the period 2004–2025 using the PRISMA methodology, categorizes integrated digital-twin-type evacuation platforms into three functional components: sensing and environment reconstruction, disaster simulation, and planning/risk assessment. This is a framework within which the architecture of the present work is positioned precisely in the third component, but without dependence on an opaque digital twin. In addition, Pishahang et al. [29] propose a Bayesian agent-based model is implemented as a complete software tool for wildfire evacuation planning. This demonstrates that integrating probabilistic uncertainty with directly applicable software is a distinct direction of development, separate from the AI-centric platforms discussed above.
Sun et al. [30] directly address the problem of decision-making time through EvacuNet, a deep neural network trained on 5,400 simulated evacuation scenarios spanning diverse building types, exit configurations, and density distributions. EvacuNet can provide an estimate of evacuation time and exit-wise distribution in under 5 seconds with over 90% accuracy, outperforming even human experts in speed, consistency, and accuracy. Unlike conventional simulations, which require hours, or other AI-based models, which require minutes, EvacuNet pushes the boundary of practical applicability of such tools toward genuine real time.
These examples, spanning computer vision and RAG, LLM-based reasoning, systematized digital-twin frameworks and Bayesian software tools, and deep-learning models for real-time assessment, show a trend toward increasingly powerful, faster, and methodologically more diverse, yet increasingly harder-to-audit architectures. This trend stands in direct contrast to the goals of the present work.
2.6. Positioning and Scientific Novelty of the Proposed Approach
The literature review conducted outlines three main directions. Classical graph-based and optimization algorithms [14,15,16,18,19,20,21,22] provide high traceability and determinism but rely on statically defined rules and adapt poorly to unforeseen scenarios. RL- and MARL-based solutions [6,7,8,9,10,11] achieve high adaptivity, but their decisions stem from trained policies that are difficult to interpret, which complicates auditing and practical certification. Integrated BIM/IoT/AI platforms [4,5,12,26] improve the information basis but do not resolve the problem of decision transparency.
This gap is especially critical for systems with direct relevance to human life, where applicable regulatory requirements and fire-safety standards presuppose the ability to fully verify and justify every generated decision.
A summary comparison of the proposed approach against these three directions, in terms of dynamism, logic type, explainability, graph structure, real-time capability, multi-agent coordination, and potential for regulatory compliance, is presented in Table 1.
The comparison shows that the proposed approach is the only one that combines dynamic adaptivity and multi-agent coordination with fully deterministic, calibrated logic and high potential for regulatory compliance — a combination absent from the other works.
At the component level, the novelty consists of: a continuous risk-assessment model based on weighted fusion of heterogeneous sensor data with hysteresis (instead of predefined fixed binary thresholds, as in Yen et al. [16], or static rules, as in Bai et al. [18]); a calibrated composite model for graph-edge costs, whose coefficients are determined offline through numerical calibration against reference scenarios rather than through statistical training; a threshold-based table for adaptive node priority, acting as a deterministic memory of accumulated evacuation experience; accounting for the projected future load through the cellular automaton when evaluating routes; and coordination among agents through dynamic virtual loading of already-occupied routes, rather than through trained policies (in contrast to Xie et al. [10]; Omidbeyk and Ghavami [11]; Sun et al. [9]).
At the architectural level, the main contribution is the development of a hybrid structure in which adaptivity to a dynamically changing environment is achieved without a single trainable component: the statically calibrated cost-model parameters and the dynamically adapted node-priority table work together, while the final routing remains entirely the outcome of deterministic graph search. This architectural separation between calibrated environment assessment and deterministic decision-making is the direct reason the system retains full traceability and reproducibility for every generated decision, including during post-incident audits.
At the system level, the novelty stems from the integration of a topological building model [1], real-time multi-sensor risk assessment, a calibrated route-cost model, threshold-based priority adaptation, deterministic routing, multi-agent coordination, and pedestrian-flow modeling. All of this is combined within a single, fully auditable platform designed to meet regulatory requirements for safety-critical systems.
For systems of this type, the difference in decision traceability relative to RL- and MARL-based approaches [6,7,9,10] is especially significant: whereas in those approaches the final route stems from a trained policy whose behavior cannot be directly justified by specific measurements, in the proposed approach every evacuation recommendation can be traced back to specific sensor values, risk-assessment formulas, and graph-model parameters — a property of direct practical significance for subsequent analysis, auditing, and regulatory approval.
3. Methods
3.1. General Overview of the Algorithm
The proposed system implements a hybrid architecture for supporting fire evacuation, combining real-time sensor-data processing, calibrated risk-assessment mechanisms, and deterministic graph-based routing. The main design goal is to simultaneously achieve adaptivity to a dynamically changing environment and preserve full traceability of the decision-making process. The algorithms are implemented in Python and are available for analysis and use (SupplementaryMaterial/software). In addition to the source code, a supplementary tool has also been developed for interactive 3D visualization of a selected individual evacuation route (Section 5.6), useful for auditing a specific evacuation decision. The project structure, a description of the software, and the operation of the 3D visualizer are described in PDF files (SupplementaryMaterial/docs).
The overall algorithmic architecture of the system is presented in Figure 1.
The architecture is organized as a sequence of interconnected modules that transform data from the building environment into concrete evacuation routes. The starting point of processing is the building’s topological model, built on a BIM-based graph representation (IFC file format).
Data from the sensor infrastructure feeds into this model, including temperature, smoke, carbon-dioxide concentration, and evacuation-flow density. The sensor-fusion module converts the heterogeneous measurements into unified estimates of fire risk and smoke risk. The resulting values are used by the calibrated risk-assessment model, which determines the dynamic traversal costs for individual nodes and edges of the graph. In parallel, the adaptive node-priority mechanism updates local environment assessments whenever new hazards arise or the fire configuration changes.
Following risk assessment, the multi-agent coordination module runs, distributing evacuees among alternative routes through a virtual-load mechanism. Final route generation is performed by the deterministic BFS-KSP core, which uses the updated graph weights and environmental constraints to determine the most suitable evacuation paths.
The resulting routes are fed to the cellular automaton for modeling the evacuation flow, which simulates the movement of individual agents, their interactions, and the influence of local hazards on their behavior. The simulation results are used to update the load and risk estimates, closing the dynamic-replanning loop and enabling adaptation to the evolving fire situation.
The proposed algorithm implements multi-agent dynamic evacuation, in which agent routes are recomputed in real time whenever a significant change in hazard conditions occurs, rather than being determined once at the start of the simulation. The algorithm operates in an iterative loop with a fixed five-second time step, at each step of which the following operations are performed in sequence: (1) incoming sensor data is normalized and combined into an updated hazard-state estimate for each node of the building graph; (2) this estimate is compared with the previous one to determine whether a significant change has occurred that requires route recomputation; (3) if a significant change is detected, K alternative routes are computed for each affected agent through weighted search over the connectivity graph, accounting simultaneously for risk, load, and distance; (4) the resulting route is passed to the crowd-movement model, implemented as a cellular automaton; and (5) agent positions and local crowd density are updated and recorded for the next step.
The remainder of this section describes in detail the mathematical apparatus behind each of these operations.
3.2. Hazard-State Assessment
Raw physical measurements (temperature, smoke level, CO₂ concentration, headcount) are transformed into normalized risk scores in the range [0,1]. This is achieved through linear scaling relative to maximum values specified in a threshold configuration file (400 °C for temperature, 3000 ppm for CO₂; the smoke level arrives already normalized; the maximum crowding capacity depends on node type, as summarized in Table 2).
The fire and smoke risk scores for each node are computed through weighted maximum aggregation of the normalized sensor values. Instead of simple summation, the maximum of the contributions from the individual sensor types is taken, weighted by their reliability for the corresponding hazard type (Equation 1):
An analogous formula, with a separate set of weights, is applied for . The confidence weights for the individual sensor types are summarized in Table 3.
For example, the temperature-sensor reading carries the highest weight for fire risk (0.95), while the smoke index carries the highest weight for smoke risk (0.85); crowd does not participate in this aggregation (weight 0 for both risk types), since crowding is treated as a separate, independent risk factor (see Section 3.4).
To avoid unstable switching of the classification for values near the threshold, the transition between a node’s “safe” and “hazardous” state is performed via hysteresis: a node enters a hazardous zone at a higher threshold than is required to leave it again. The thresholds applied are summarized in Table 4.
The replanning trigger is activated immediately whenever a new fire or smoke node appears, or when an existing fire node clears; for gradually changing conditions, it is activated when the risk level changes by a value greater than or equal to 0.20, or the crowd density changes by a value greater than or equal to 0.15, for a given node. This stepwise, rather than continuous, response is the direct reason why, in six of the thirteen scenarios, the static fire and smoke node fields remain empty at the initial planning moment. The hazard itself enters the simulation solely through this sensor mechanism at a later stage (Section 4.4.3, Mechanism C).
3.3. Building Connectivity Model
The topology of each building is represented as a weighted directed multigraph, in which nodes correspond to spatial elements (rooms, corridors, stairwells, exits) and edges correspond to physical transitions between them (doors, open spaces). The graph is described hierarchically (building → wing → floor → vertical connectivity), following the model from Ivanov [1], described in Section 4.1 in the context of the computational efficiency of the search.
Besides the dynamic exclusion of nodes depending on the current hazard, the graph also supports a permanent structural-exclusion mechanism, applied once at load time and independent of the simulation’s progress. Nodes listed in the configuration as physically inaccessible are removed from the graph together with all edges connected to them. This mechanism is used for the regulatory exclusion of elevator nodes from the evacuation graph, since elevators cannot serve as an evacuation route during a fire unless specifically designed for that purpose. A separate, finer-grained mechanism allows the removal of a specific door or transition between two nodes without excluding the nodes themselves. This is suitable for doors that are regulatorily locked or permanently inaccessible, while the room itself remains part of the evacuation graph through other doors (a room is connected to adjacent rooms through multiple doors).
3.4. Route-Cost Model
Each node carries a composite risk score in the range [0,1], computed as a sum of indicator contributions, capped from above (Equation 2):
The coefficients reflect the relative severity of the hazards: a fire zone (0.9) is close to maximum risk, a smoke-affected zone (0.5) is a serious but potentially more briefly traversable hazard, and crowd density (0.3) adds a smooth, continuous penalty component rather than a binary prohibition. A combination of simultaneous fire and smoke reaches the maximum value . This score is independent of the calibratable weight vector described below and plays a central role in the route-selection criterion (see Section 3.5).
For each edge of the graph, an eight-dimensional feature vector is computed, summarized in Table 5, describing the conditions at the edge’s target node.
The cost of traversing an edge is computed as the dot product of the calibratable weight vector and the feature vector , increased by a contribution from the projected crowd density, and bound from below for the numerical stability of the search algorithm (Equation 3):
The default values of the weight vector , used for the uncalibrated configurations in the ablation study (Section 4.3), are given in Table 6.
The projected crowd density ĉ(node), used in Equation 3, is obtained from a diffusion model that propagates observed density to neighboring nodes in the direction of the exits (Equation 4):
with retention parameter δ=0.85, spread σ=0.30, and evaporation ε=0.15. In this formula, n̄(node) is a weighted average of the neighboring nodes, weighted by normalized distance to the nearest exit. In this way, nodes closer to the exit have greater influence, modeling directed rather than isotropic diffusion. Direct sensor observations are given precedence over the projection through exponential smoothing with coefficient α=0.4: .
3.5. Route Search and Selection
During the search for K alternative routes, nodes are traversed via a priority queue (min-heap) whose key reflects not only the accumulated path cost but also current risk conditions and the accumulated long-term experience of each node’s quality (Equation 5):
where the first term is the node’s accumulated long-term value, the second is the composite risk score from Equation 2 (with a coefficient of 8.0, which imposes a strong penalty contribution for hazardous nodes, independent of the calibratable weight ), the third adds a penalty for overcrowded nodes, and the fourth imposes a penalty of 12.0 for every floor above the agent’s starting floor, which prevents routes that climb back upward without good reason.
The number of alternative routes searched at each planning cycle is bound by parameter K. For the scenarios evaluated in Section 4, the value applied is K=5 for every planning cycle, regardless of the value specified in each individual scenario’s configuration. A direct comparison of the results for K=5 versus K=200 shows that, for twelve of the thirteen scenarios, the number of evacuated agents remains completely identical, and in the single scenario with a measurable difference, the deviation is one agent.
After the K admissible routes are found, they are sorted using a two-criterion lexicographic key function (Equation 6):
where the term is the sum over all edges of the path. The semantics of this sorting are central to the algorithm’s architecture: the safer route (lower value ) is always preferred over the cheaper one, regardless of the difference in the secondary term . The calibratable weight vector participates only in the secondary criterion and therefore decides only between routes with an identical primary value. The route with index 0 after sorting is the recommended route for the corresponding agent. This lexicographic structure is called TWO_TIER.
3.6. Weight Calibration and Online Adaptation
The weight vector from Table 6 can be loaded from a pre-calibrated model instead of using the default values. Calibration is performed offline, via gradient descent, minimizing the mean-squared error between the cost predicted by Equation 3 and an “ideal” cost derived from simulated evacuation trajectories in the test scenarios. This linear model with eight defined features contains no graph neural network, no message-passing mechanism between nodes, and no learned node embeddings. Calibration is limited to the eight scalar coefficients of the linear combination in Equation 3.
Alongside the offline-calibrated weight vector, the system maintains an online table of long-term node values , used in Equation 5. Unlike formal reinforcement learning, this table uses no reward function, discount factor, or Bellman equation — it is updated through direct, threshold-based addition of fixed correction values whenever certain events occur, summarized in Table 7.
These corrections act as a long-term memory of node quality: after a series of successful evacuations, nodes that were part of reliable routes accumulate a positive value and are preferred earlier in subsequent searches, without this constituting a formal reinforcement-learning process in the sense of a Markov decision process.
3.7. Coordination Among Agents
When planning for multiple agents, the processing order is not arbitrary: more endangered agents receive a computed route first, before the virtual load from already-planned agents can influence their choice (Equation 7):
Under the strict smoke-tolerance threshold configuration used in the evaluated scenarios (Section 5.2), every classified smoke node is treated as intolerable, so that in practice an agent in a smoke node receives the same highest priority (3.0) as an agent in a fire node. A value of 2.0 would apply only under a looser tolerance threshold, permitting low smoke levels, different from the configuration used in the present study.
To prevent multiple agents from concentrating on the same route, after each agent is planned, the nodes along its route receive a temporary, virtual increase in crowd density (Equation 8):
The value of the coefficient applied in all simulation runs in Section 4 (the PROPOSED configuration) is . The next agent in sequence “sees” the already-planned nodes as more congested and naturally prefers an alternative route, without any need for centralized coordination or communication among agents. This mechanism is quantitatively confirmed in Section 4.5 through the ablation configuration NO_AGENTS_COORD ().
When an agent is left without an admissible route () for two or more consecutive planning cycles, a rescue-intervention notification is automatically generated, containing the agent’s current position, a recommended access point for rescue teams, and the duration of the blockage. This sequence is directly verified in the simulation log for the boundary case.
3.8. Crowd-Movement Model
The route computed in Section 3.5 is not executed unconditionally. The physical movement of each agent from node to node is governed by a separate, independent model, implemented as a discrete cellular automaton with a fixed, at this stage, five-second time step. This model acts as an execution layer between the planned route and the agent’s actual position, and includes its own, independent hazard-avoidance logic, distinct from the hard exclusion of nodes at the planning level. This is a defence-in-depth architecture, in which physical entry into a fire or intolerable-smoke node is prevented at two independent levels.
The agent’s movement speed depends on the local crowd density at the node the agent currently occupies (Equation 9):
Speed accumulates as credit at each step. The agent changes node only once the accumulated credit reaches 1.0, after which the credit is reduced by 1.0. This is a mechanism that allows agents with different individual mobility to advance at different effective rates within an equal discrete time step, rather than all agents moving synchronously at every step.
The decision as to which neighboring node is selected as the next position follows a three-level priority hierarchy. First, if the agent is already located in a fire or intolerable-smoke node, escape logic is activated: the agent follows the route recommended by the planner if it points to a neighboring node that is not fire-affected or intolerably smoke-affected. Otherwise, a neighboring node is chosen via a scoring function that gives preference to fully safe nodes over tolerably smoke-affected nodes, and to fire nodes only as a last resort, with an additional penalty for recently visited nodes to prevent persistent oscillation between two neighboring nodes. Second, if the agent is not in danger and a planned route exists, it is followed to the next node along the path, unless that node is fire-affected or intolerably smoke-affected, in which case processing moves to the third level. Third, in the absence of an applicable planned move, direct, local (greedy) selection among the neighboring nodes is applied, based on an attraction scoring function (Equation 10):
with default weights , , ;the first term is a monotonically decreasing function of the number of hops to the nearest exit (obtained via multi-source breadth-first traversal from all exit nodes), and the second term is 1.0 for a fire node, 0.5 for a smoke node, and 0.0 for a safe node. At all three levels of the hierarchy, a choice leading to a fire or intolerable-smoke node from a currently safe position is explicitly prohibited and is confirmed through a separate validation step after all moves for the current step have been determined, before they are applied.
If all an agent’s neighboring nodes are simultaneously on fire, the agent remains at its current position rather than being forced to choose among equally inadmissible options. This is a state corresponding to a section of the graph topologically cut off by the hazard, and it is the threshold condition for the rescue-intervention notification. It is precisely the discrete, stepwise nature of this movement model that explains why an agent already located in a given node at the moment of its sensor classification as fire- or smoke-affected may register brief physical contact with the hazard before the escape mechanism has the opportunity to trigger at the next step.
4. Experiments
4.1. Experimental Setup
The algorithm was evaluated in a simulation environment combining (i) an agent-based crowd-movement model, implemented as a cellular automaton, and (ii) a risk-aware K-shortest-paths planner, which computes K shortest paths over a building connectivity graph weighted by a linear edge-cost model with eight defined parameters (presence of fire, presence of smoke, crowd density, blocked connections, proximity to exit, proximity to fire, geometric distance, constant offset value). The weight vector is calibrated offline via gradient descent on a mean-squared-error-type loss function relative to an “ideal” cost derived from simulated trajectories and is further adapted online through threshold-based updating of a table of node values as new sensor data arrives.
Building topology is described through a hierarchical directed-multigraph connectivity model [1], in which nodes represent spatial elements (rooms, corridors, stairwells) and edges are the doors and openings between them. Unlike the flat graph-based models used in most indoor-navigation systems, the hierarchical representation (building → wing → floor → vertical connectivity) allows a subgraph to be extracted for only the relevant part of the building, without loading the entire topology into memory. This advantage was demonstrated experimentally in the original paper (up to 1,433 times faster than Yen’s algorithm on complete graphs, and 4.7–27 times faster in real building scenarios, relative to the same baseline algorithm). Provision is made for introducing virtual nodes. For example, a virtual target node (outdoors) allows simultaneous search toward multiple admissible exits in a single call to the algorithm.
Hazard (fire and smoke) is modeled dynamically through time series of sensor data, which are fed into the simulation from a file in a stepwise manner and lead to recomputation of the plans for affected agents whenever a significant change in hazard occurs, rather than only once at the start of the simulation.
The fire and smoke dynamics in Scenarios 8–13 are constructed to reflect established fire-safety engineering practice, rather than arbitrarily chosen curves: the growth of heat-release rate follows the t² law [31,32], with a growth class (ultra-fast/fast/medium) determined by the space category; the temperature contribution at each node is computed via the Alpert [33] ceiling-jet correlation; occupant loading per area follows BS 9999 [34] and the occupancy load tables of NFPA 101 [35]; and pre-movement time distributions are aligned with PD 7974-6 [36].
The evaluation covers thirteen scenarios, presented in Table 8, spanning four different buildings and differing in the number of agents, topology, and fire-spread dynamics.
Detailed information for each scenario (objective, building(s), number of agents, fire type and dynamics, smoke type and dynamics) is available in Supplementary Material/docs/SF2_Software_description.pdf.
The Rectorate and University Library buildings are real buildings of the Technical University of Gabrovo (Bulgaria), modeled specifically for the purposes of the present study. The Institute corresponds to a publicly available IFC test model [37], and ZDB corresponds to a real test model for evacuation-route analysis, published by the research team at TU Wien [38] under a Creative Commons Attribution 4.0 license.
A visual overview of the four studied buildings, illustrating the difference in their scale and typology, is shown in Figure 2. For the Institute and for ZDB individually, the corresponding building IFC file serves as the sole source of information — both the 3D geometry and the connectivity graph used by the routing algorithm were extracted from it. For the Rectorate and the Library, the 3D visualization and the connectivity graph are two separate representations, independent of one another, of the same real buildings: the 3D model was built in SketchUp solely for illustration purposes, while the connectivity graph was defined manually.
4.2. Evaluation Metrics
Six metrics were used for the quantitative evaluation of the algorithm, computed from the complete agent-movement log rather than from the planned routes alone, to reflect the executed behavior.
Evacuated (number of evacuated agents). The number of agents that reach the “outdoors” node by the end of the simulation, relative to the total number of agents in the scenario. This information is complemented by Blocked agents — agents for whom the planner found no admissible route and for whom the emergency services are notified.
Mean and maximum evacuation time. The mean and maximum time (in seconds) required successfully evacuated agents to reach an exit. The maximum value is indicative of the worst-case scenario. This is a critical metric for compliance with regulatory evacuation-time requirements.
Number of exits used. The number of distinct exits through which agents left the building, relative to the total number of available exits in the scenario. A low value indicates overloading of a small subset of exits, even given a good mean evacuation time.
Gini coefficient of exit load. Computed according to Equation 11, where the values are the numbers of evacuated agents per exit, sorted in ascending order, and is the number of exits actually used — with one correction: if all evacuated agents used a single exit () while the building has more than one registered exit (), is instead set to and the count vector is zero-padded with the unused exits before evaluating the sum below. This distinguishes a genuine single-exit building, for which is the only possible outcome, from a case where several exits exist but agents happened to concentrate on only one of them.
The value of corresponds to perfectly uniform loading of all exits; the maximum value () corresponds to complete concentration of evacuation on a single exit. A building with only one registered exit trivially yields ; by contrast, all agents using only one of several available exits is scored close to . This metric is key for assessing the contribution of inter-agent coordination (Section 4.5), since it directly reflects load balance rather than evacuation speed.
Safety-compliance metrics (agents_fire / agents_smoke). The number of evacuated agents whose executed movement path (rather than the planned route) passed through at least one node classified as fire-affected, or respectively smoke-affected, at the moment the agent occupied it. This is computed by matching each agent’s position log against the sensor time series for fire and smoke. This metric is independent of the speed and balance metrics above and is used specifically to verify regulatory compliance.
All metrics are aggregated over twenty Monte Carlo replicates per scenario and configuration (Section 4.3), using the non-parametric Mann–Whitney U test for statistical significance and Cliff’s delta for effect size. This is necessary because normality of the distributions cannot be guaranteed given the small number of agents in some of the scenarios.
4.3. Ablation Configurations
To isolate the contribution of each individual component of the proposed algorithm, an ablation study was conducted with five configurations, distinguished by four independent switches: (1) whether the weight vector is offline-calibrated or set manually to its default values; (2) whether online adaptation of the node-value table is active; (3) the degree of coordination among agents in distributing load across exits; and (4) whether the plan is dynamically recomputed upon a significant change in hazard, or computed once at the start. The five configurations are summarized in Table 9.
PROPOSED is the complete version of the proposed algorithm. STATIC_WEIGHTS isolates the effect of offline calibration and online adaptation on its own, keeping coordination and dynamic replanning unchanged. NO_AGENTS_COORD isolates the effect of coordination on its own, keeping calibration and adaptation active. Here the coordination factor is set to zero, so that each agent plans its route independently of the load on the exits chosen by the other agents. KSP_BASELINE combines both restrictions but retains dynamic replanning. It simulates a standard K-shortest-paths planner with a fixed heuristic, extended solely with a response to hazard changing over time. STATIC_PLAN isolates the contribution of dynamic recomputation on its own. In this case, the plan is computed once at the start of the simulation and is not subsequently updated, regardless of the later development of the fire or smoke
Each of the five configurations was run with twenty Monte Carlo replicates for each of the thirteen scenarios, using identical, paired values of random jitter and density-prediction noise across configurations for a given replicate index. This is a methodological choice that reduces variance in the comparison and allows the observed differences to be directly attributed to the factor under study.
4.4. Sensitivity Analysis
4.4.1. Methodology
To verify the extent to which the proposed linear edge-cost model governs route selection, a One-At-a-Time (OAT) local sensitivity analysis was conducted on the eight calibratable weights, following the methodology recommended in ASTM E1355 [39] for assessing the predictive capacity of deterministic fire models. For each weight, its value is scaled relative to the default value by six factors (0.25, 0.5, 1, 1.5, 2, and 3) while the remaining seven weights are held fixed at their default values. The base case is shared across the sweeps of the individual weights, so the total number of runs per scenario is 41. The analysis was applied across all thirteen scenarios to verify whether the conclusions are specific to a particular topology or generalize (Supplementary Material/results/sensitivity).
4.4.2. Results
The results, summarized in Table 10, show that a substantial share of the eight weights have no measurable effect on the output metrics across the entire range studied.
Flatness is not confined to a particular scenario. The weights fire, smoke, and blocked are systematically flat across all scenarios, regardless of the fire’s characteristics. For example, Scenario 8, in which the fire spreads across three floors, shows an identical flatness pattern to Scenario 10, in which the fire is localized.
4.4.3. Causal Analysis
To determine whether the lack of sensitivity is an implementation defect or architecturally expected behavior, the planner was directly instrumented to trace what happens during each route-planning step. Three distinct, empirically confirmed mechanisms were identified.
Mechanism A: absence of an alternative route. In the scenarios with limited connectivity (1–5, 7), only a single physically feasible route to the exit exists for most agents. A direct test with the fire weight ranging from 2.5 to 30.0 shows an identical total route cost and an identical selected route, since the sole feasible path never passes through a node with a nonzero value for the corresponding feature.
Mechanism B: dominance of a fixed risk-gate over the calibratable cost. The final route selection sorts of candidate routes by a dual key (), where the primary term is a separate, hard-coded formula, entirely independent of the eight calibratable weights. The latter enter only into the secondary term , which serves solely as a tie-break criterion. Direct instrumentation of all planning points in Scenario 10 (869 agent-replan instances) shows that changing the fire weight from 10.0 to 30.0 changes the total cost in 108 of 869 cases (12%) but never changes the selected route (0 of 869 cases).
Mechanism C: dynamic rather than static fire modeling. The static configuration fields for fire and smoke nodes are empty in all six of the larger scenarios (8–13); fire and smoke enter only dynamically, through the sensor time series, later in the simulation’s timeline. The initial plan, computed at the starting instant , is computed under an entirely clean hazard state. The fire and smoke parameters are structurally zero at this planning point, regardless of the value of the corresponding weights.
An illustration of the mixed sensitivity pattern is presented in Figure 3, showing the results for Scenario 10: the panels for fire, smoke, blocked, fire_proximity, and distance are completely flat, while the panels for crowd and bias show a measurable dependence.
4.4.4. Interaction with the Compensating Regulatory-Compliance Correction
The hard exclusion of fire and smoke nodes from the planning graph (introduced for regulatory compliance, Section 5) has a side effect on the sensitivity-analysis results. The reason is a logical consequence of Mechanism A: removing previously generated inadmissible routes reduces the total number of alternative candidate routes, and hence the tie-break opportunities through which these two weights had shown an effect. This is a quantitative picture of the architecture, paid as a necessary price for compliance with regulatory requirements for fire evacuation from buildings
4.4.5. Conclusions
The observed low sensitivity is a consequence of the design decision to use a safety-oriented route-selection criterion. In this case, the calibratable weights act solely as a secondary mechanism with limited scope of influence. This finding directly motivates the content of Section 4.5, in which the comparative Monte Carlo study localizes the real source of result improvement outside weight calibration.
The architectural question of whether a different choice of primary sorting criterion could reveal broader influence of the calibratable weights, without compromising the guaranteed avoidance of fire and smoke, remains an open architectural question, discussed further in Section 6.7.
4.5. Comparative (Monte Carlo) Study
4.5.1. Overview of Results
The aggregated result at the level of the entire sample of thirteen scenarios across five configurations and twenty replicates, a total of 1,300 simulation runs and 260 pairwise comparisons (Supplementary Material/results/mc), is presented in Table 11.
The PROPOSED configuration versus STATIC_WEIGHTS is statistically indistinguishable in practice almost everywhere. This is a direct confirmation of the finding from Section 4.4 (Mechanism B). PROPOSED versus configurations without coordination or without dynamic replanning shows a systematically significant effect. This aggregated result, however, conceals substantial variation among scenarios, which cannot be understood without a breakdown by group, presented in Figure 4 and the following subsections.
For a meaningful interpretation, the scenarios are divided into three groups based on two objective criteria: (1) the source of graph connectivity — manually described (Scenarios 1–8, the Rectorate and Library buildings) versus automatically extracted from IFC (Scenarios 9–13, the Institute and ZDB buildings); and (2) the number of actually accessible exits, which determines whether the load-balance metrics are structurally informative.
4.5.2. Group A: Small Buildings, Manual Connectivity, Limited Exit Choice (Scenarios 1–5)
The results for Group A are summarized in Table 12.
The effect is real and in the correct direction everywhere, but statistical significance is weak and inconsistent. This is not because the mechanism fails to work, but because the sample is structurally limited: with 3–8 agents and 20 replicates per configuration, the distribution of “which agent through which exit” has too few possible outcome states to allow the Mann–Whitney test to consistently reject the null hypothesis. This is a statistical-power effect rather than an absence of a real effect. This is confirmed by the fact that the effect size remains comparable in magnitude to that in the larger groups, while the p-value is unstable due to the small size of the sample of possible outcome configurations.
4.5.3. Group B: Larger Buildings, Manual Connectivity, Rich Exit Choice (Scenarios 6–8)
The results for Group B, summarized in Table 13, show the strongest and statistically cleanest effect of the entire dataset.
Cliff’s delta reaches a value of 1.00 (complete separation of the distributions) for the Gini coefficient and the number of exits relative to the three uncoordinated configurations. The reason is direct: with 32–64 agents and 7–8 accessible exits in a richly connected topology, the coordination mechanism has enough agents and alternative exits available to display its full potential for load balancing. An illustration for the representative Scenario 6 is shown in Figure 5.
An important trade-off is also observed. In this group, PROPOSED shows a higher, not lower, mean evacuation time (27.17 s versus 24.98 s) relative to the uncoordinated configurations, despite a significantly better distribution across exits. This is an expected trade-off between speed and load fairness. Coordination deliberately diverts some agents from the nearest, but potentially overloaded, exit toward a more distant but less occupied one, which increases the individual path length for some agents in exchange for a lower risk of congestion at the most heavily used exit.
4.5.4. Group C: IFC-Derived Connectivity, Large Buildings (Scenarios 9–13)
The results for Group C are summarized in Table 14.
Unlike Group B, in the representative Scenario 10, coordination improves the Gini coefficient (0.231 versus 0.456 for NO_AGENTS_COORD) without paying a cost in higher mean time (120.77 s versus 121.57 s). This difference relative to Group B is due to scale: with 48–120 agents and a more complex topology, the available buffer of alternative routes is large enough to allow load balancing without materially lengthening the individual path of any agent. The distribution of evacuated agents across exits for Scenario 10 specifically, under the PROPOSED configuration, is shown in Figure 6. The plotted data represent direct console output from the simulation script (dynamic_simulation.py) and illustrate, at the level of individual agents, how the coordination mechanism distributes the load among the six available exits of the ZDB building, rather than concentrating it on the nearest one.
The strongest and most consistent result across the entire study is for maximum evacuation time (5/5 significant scenarios relative to NO_AGENTS_COORD and STATIC_PLAN, δ≈0.75). Dynamic replanning is especially critical precisely in this group, because larger, more complex buildings entail longer evacuation times, during which a significant change in hazard requiring plan recomputation is statistically more likely to occur.
Scenario 9 is an exception within the group: the building is constructed with a single physically accessible exit, so the Gini coefficient is trivially 0.0 for each of the five configurations, in every one of the twenty replicates, without exception. The Mann–Whitney test on two identical constant samples is not informative. This scenario was deliberately included in the study design to test the algorithm’s behavior under a topology devoid of choice. The result confirms that the algorithm does not create artificial variation where no physical choice exists.
4.5.5. Conclusions
The three groups, considered together, trace a consistent picture, in agreement with the architectural analysis from Section 4.4. Calibration of the weight vector shows no measurable effect in any of the three groups — a confirmation of Mechanism B at the level of final simulation results. Coordination and dynamic replanning show an effect whose strength increases monotonically with the size of the sample of possible outcome configurations, as expected from a statistical standpoint. The trade-off between speed and load balance is scale-dependent — noticeable in Group B for smaller, denser buildings, practically absent in Group C at larger scale. The sole structural exception, Scenario 9, is fully explainable by the building’s topology.
Whether an alternative route-ranking criterion changes the balance between coordination and calibration established above is documented in the study’s supplementary material.
5. Verification of Regulatory Compliance
5.1. Regulatory Requirement
Besides effectiveness, an evacuation algorithm intended for real-world operation must meet a categorical regulatory requirement arising from Regulation No. Iz-1971 [40]: agents must not be routed along a path passing through a node with an active fire, nor through a smoke-affected node. To verify that the proposed architecture guarantees this in practice, a targeted audit of the planner’s code was conducted, followed by quantitative verification against the actual simulation logs.
5.2. Mechanism for Excluding Fire and Smoke Nodes
The planner applies a single, unified principle of hard exclusion of hazardous nodes from the planning graph, applied symmetrically for both smoke and fire. The prohibition on passing through smoke nodes can be disabled programmatically. Smoke is excluded through a tolerance-checking mechanism configured to a strict zero value. This means that any node classified as smoke-affected drops out of the graph at every (re)planning cycle. The same principle applies to all nodes with an active fire: they do not participate in route search as candidates for traversal, regardless of the computed cost of alternative paths. In this way, the selected route is guaranteed to be free of fire and smoke nodes at every moment of planning, not merely in the statistically more likely case.
5.3. Handling of a Starting Position Within a Hazardous Zone
When an agent is in a node that, at a given moment, is classified as fire- or smoke-affected, the planner activates logic to move the search’s starting point to the safest neighboring node. In this case, the abandoned node (the agent’s former position) is also excluded from the graph for the purposes of the subsequent search. This guarantees that the route cannot subsequently pass back through it at a later step. The combination of the two mechanisms ensures that the recommended route never contains a fire or smoke node—neither as an intermediate point nor through a return to an already-vacated hazardous position.
5.4. Verification
Verification was conducted at two levels. An audit of the recommended route, applied across all thirteen scenarios, shows zero instances of a fire or smoke node in the recommended route after the correction, including Scenario 10. An audit of the executed movement—a stricter test, based on the agents_fire and agents_smoke metrics from Section 4.2. The result shows zero incidents across all one hundred runs (five configurations, each with twenty replicas) for twelve of the thirteen scenarios, summarized in Table 15.
5.5. Boundary Case (Scenario 12)
Scenario 12 is the only exception in Table 15: on average, about two evacuated agents per run show physical contact with fire or smoke during their movement. The number of incidents is virtually identical for all five ablation configurations in each of the twenty replicates — a strong indication that the cause lies outside the scope of the planner’s decisions, since if the number of incidents depended on route selection, the better-coordinated configurations would show a lower number.
A direct check of the position log confirmed this hypothesis: in every one of the affected cases, the agent was already located in the affected node at the moment the sensor system classified it as fire- or smoke-affected, since the agent’s position before and after classification coincides. The agent did not “enter” the hazard because of a routing decision but was overtaken by it in place. The reason is the speed of fire spread in this configuration is related to the sensor-check interval, illustrated in Figure 7. In this scenario, the agent physically does not have time to leave the node between the moment of detection and the moment of classification.
5.6. Tool for Interactive 3D Auditing of a Selected Route
In addition to the quantitative verification in the preceding subsections, the system includes a tool for interactive 3D reconstruction of the route of an arbitrarily selected agent in an arbitrarily selected scenario (the evacuation_3d_visualizer.py module, which uses building geometry extracted from the IFC model via the ifc_geometry_extractor.py module). An example of the evacuation path of agent Z001 in Scenario 11 (ZDB building) is shown in Figure 8.
The tool animates the agent’s movement through the building space, as well as the development of fire and smoke in the rooms. The higher the temperature or the higher the smoke concentration, the redder or whiter the color of the rooms.
The tool shows not only the final selected path but also the sequence of specific spaces and doors through which the agent passes (the “Actual route” panel), as well as an option to visualize the moments of route replanning (“Show replanning”)—a direct visual link to dynamic recomputation. It is available only for scenarios involving buildings with an available IFC model (Scenarios 9–13), since it requires a geometric envelope extracted from the BIM data.
5.7. Conclusion
It has been verified across all thirteen scenarios that the route recommended by the planner never contains a fire or smoke node. The sole class of recorded incidents involving physical contact between an agent and fire or smoke has a purely physical origin. It arises when the agent is already located in a node at the moment it is classified as hazardous, rather than because of a routing decision.
6. Discussion
6.1. Analysis of the Results
The three independent lines of analysis converge into a single, consistent explanation rather than three separate observations: the sensitivity analysis (Section 4.4), the comparative Monte Carlo study (Section 4.5), and the regulatory-compliance verification (Section 5). The reason all eight of the eight calibratable weights show limited sensitivity is the same reason weight-vector calibration shows no statistically measurable contribution to any output metric in the comparative study: the lexicographic criterion (Equation 6a) guarantees that the calibratable cost decides only between routes that are already equally safe. This architectural feature is also the premise on which the regulatory-compliance mechanism from Section 5 is built. The hard exclusion of fire and smoke nodes from the planning graph operates independently of any weight configuration, which explains why the verification in Section 5.4 finds not a single violation in any of the five ablation configurations.
The real, statistically confirmed contribution of the proposed algorithm stems from two mechanisms distinct from weight calibration: coordination among agents through virtual load, and dynamic route recomputation upon a change in hazard. Both mechanisms bypass the lexicographic risk-gate, since they do not participate in determining . Coordination affects the distribution of agents among exits that are already equally safe, while dynamic replanning responds to a change in the hazard classification itself, rather than to a change in the calibrated cost.
6.2. Architectural Conclusions
The finding from Section 4.4 has significance beyond the specific implementation examined in this paper. Any evacuation-route-selection architecture that applies a hard, priority safety criterion (as does in the present system) ahead of a calibratable cost component structurally limits the extent to which that component can influence the final decision, regardless of how precisely it is calibrated. This is not a shortcoming. On the contrary, a system in which a calibratable component could override a risk assessment would represent a more substantial safety risk, since an error or drift in calibration could directly lead to a more dangerous choice. The architectural decision applied in the present system follows a safety-first principle, familiar from other areas of critical-systems engineering: the learned or calibratable components are permitted to optimize only within the bounds already set by a deterministic safety criterion.
The practical implication for researchers working with similar systems is methodological: demonstrating that a calibrated or “trained” component of a given system has no measurable effect on the result is not necessarily an indication of a calibration error or of unsuitable training data. It can be a direct, verifiable consequence of the architecture in which the component is embedded, as shown empirically in Section 4.4.3 through direct instrumentation of the algorithm rather than merely observation of the aggregated results.
6.3. Coordination Design
The results from Section 4.5 reveal a trade-off between evacuation speed and load uniformity across exits, whose direction and magnitude depend on building scale. In smaller buildings (Group B, Section 4.5.3), coordination substantially improves load balance (Cliff’s delta up to 1.00) at the cost of a higher mean evacuation time. Agents are deliberately redirected from a nearby but potentially overloaded exit toward a more distant but less occupied one. In larger buildings with richer topology (Group C, Section 4.5.4), the same mechanism improves load balance at practically no cost in mean time, since the available buffer of alternative routes is large enough to absorb the redistribution without materially lengthening individual paths.
Further analysis of the variance of maximum evacuation time (a metric reflecting the predictability of the worst-case evacuation outcome, not merely its mean duration) reveals a third, separate benefit of coordination and dynamic replanning, most pronounced in the largest-scale scenarios. In Scenarios 11 and 12, the standard deviation of the maximum evacuation time under PROPOSED is 4.26 s and 4.87 s respectively, versus 11.68 s and 23.68 s for the uncoordinated, statically weighted baseline algorithm (KSP_BASELINE)—a reduction on the order of 3 to 5 times (see Figure 9). This pattern is not universal across all thirteen scenarios (PROPOSED shows the lowest variance in eight of thirteen scenarios), but it appears systematically precisely in the scenarios where predictability of emergency-response time is practically essential.
The practical implication for deployment is that the value of the coordination coefficient λ (Equation 8) probably should not be a fixed universal constant, but a parameter whose calibration accounts for the scale and topology of the specific building. This is a conclusion that the present study formulates based on the observed dependence across scenario groups, but does not test directly through a dedicated sensitivity analysis on λ.
6.4. Regulatory Compliance
Section 5 empirically verifies a single, albeit central, regulatory requirement: avoidance of fire and smoke nodes along the route. Beyond this check, the individual mechanisms of the algorithm described in Section 3 are, by design, consistent with a broader set of requirements from the applicable regulatory framework, summarized in Table 16. Unlike Section 5, the correspondences in this table are not subject to separate quantitative verification in the present study and should be regarded as documented design justification rather than as an additional, independently tested result.
6.5. Computational Considerations
The proposed algorithm uses a value of K=5. A direct comparison with a larger, but practically applicable, value (K=200) shows that, for twelve of the thirteen scenarios, the number of evacuated agents remains completely identical to that at K=5, while the runtime of a single execution of the algorithm increases by approximately a factor of 12. In the single scenario with a measurable difference in outcome (Scenario 9), K=200 yields one fewer evacuated agent, not more. This is a counterintuitive result, but explainable by the fact that, with a significantly larger number of candidate routes sharing the same minimal primary value , the secondary tie-break criterion begins choosing among a much wider set of practically equivalent alternatives, which can lead to different, but not necessarily better, coordination among agents in a topology with a single critical congestion point.
This finding suggests that, for an architecture with a lexicographic risk-gate criterion (Section 3.5), increasing K beyond a value sufficient to cover the diversity of routes with different primary values incurs mainly computational cost, without a corresponding improvement in the quality of the final choice. This is because the additional candidate paths typically differ only in the secondary term , a criterion with limited influence on the outcome (Section 4.4.3, Mechanism B). A practical recommendation for systems with similar architecture is that K should be determined empirically, through comparison of the output metrics at increasing values, rather than accepting the value specified in a configuration file without verification.
6.6. Limitations of the Study
Validation through simulation only. All results presented in Section 4 stem from a simulation environment with a crowd-movement model implemented as a cellular automaton, rather than from observations of a real evacuation or a controlled drill with human participants. The absolute values of evacuation time should not be interpreted as a direct prediction of real-world behavior during a fire; the comparative conclusions between configurations (Section 4.5) are more robust, since they rely on a paired, controlled comparison under identical hazard conditions, but they remain bound by the assumptions of the movement model.
Latency of sensor detection. The boundary case in Scenario 12 (Section 5.5) shows that the interval between the physical onset of a hazard and its sensor-based classification can exceed the time needed for an affected agent to voluntarily leave the node. The present study characterizes this effect quantitatively but does not test alternative, more frequent sensor-checking intervals, which could reduce the frequency of such cases at the cost of higher computational load.
Statistical power for small scenarios. Group A (Section 4.5.2) shows an effect size comparable in magnitude to that in the larger groups, but statistically unreliable significance, due to the limited number of possible outcome configurations with 3–8 agents. The conclusions regarding the presence of a real effect in this group are based on consistency with the larger groups rather than on standalone statistical significance.
Scope of the buildings studied. The thirteen scenarios cover four buildings, represented through two different topology-extraction methods (manual description and automatic extraction from IFC). Generalizability of the findings to buildings with fundamentally different topology (for example, very tall buildings with a central stairwell core, or buildings with irregular, non-hierarchical connectivity) has not been tested directly.
Single regulatory jurisdiction. The conformities documented in Section 6.4 are based on European regulations. The applicability of the same mechanisms to jurisdictions with different requirements (for example, different minimum standards for the number of independent exits, or different smoke-tolerance criteria) requires separate verification against the corresponding local regulations.
6.7. Directions for Future Research
Whether the lexicographic route-sorting criterion (TWO_TIER) should be reconsidered in favor of an alternative formulation remains an open architectural question, as discussed in the study’s supplementary material. Such a change directly affects a decision related to human safety and should be the subject of a dedicated development effort involving a certifying fire-safety engineer, rather than a unilateral algorithmic decision.
The dependence of the trade-off between speed and load fairness on building scale (Section 6.3) motivates a dedicated sensitivity analysis on the coordination coefficient λ, analogous to the one conducted for the eight calibratable weights, with the aim of deriving a recommendation for its value as a function of the number of agents and the number of available exits, rather than a single fixed constant.
7. Conclusion
The present paper introduced a fully deterministic approach to intelligent fire-evacuation support in multi-storey buildings. The system combines continuous multi-sensor risk assessment with hysteresis, a calibrated composite model for graph-edge costs, a threshold-based table for adaptive node priority, multi-agent coordination through virtual load, and a cellular automaton for modeling evacuee movement. Not a single trainable or “black-box” component is used, with the aim of full traceability, auditability, and compliance with fire-safety regulatory requirements.
The evaluation, conducted across thirteen scenarios in four real buildings (the Rectorate, the University Library, the Institute, and the ZDB building) with up to 120 agents per scenario, shows that offline calibration of the weight vector makes no statistically measurable contribution to the final results — architecturally explained by the lexicographic risk-gate criterion, which subordinates the calibratable cost to a hard safety priority. The real, statistically significant contribution stems from coordination among agents and dynamic route recomputation upon a change in hazard: the combination of the two mechanisms achieves up to 2.7–4.9 times lower standard deviation of maximum evacuation time relative to an uncoordinated baseline algorithm in the largest-scale scenarios. This is a result of direct practical significance for the predictability of emergency response time.
Verification of regulatory compliance confirms that the recommended route never contains a fire or smoke node across all thirteen scenarios. The sole recorded class of incidents involving physical contact with fire or smoke has a purely physical origin (sensor latency under exceptionally rapid fire spread in a specific scenario) and is handled correctly through an immediate emergency-services notification mechanism.
These results demonstrate that adaptivity to dynamically evolving fire scenarios is achievable without trainable or hard-to-verify components. This is an architectural choice that ensures full traceability of every evacuation decision and constitutes a prerequisite for practical certification of such systems in safety-critical environments.
Future work will be directed toward integration with high-fidelity CFD models for fire and smoke spread, the use of real-time real IoT sensor streams, extending the system to large-scale, multi-building evacuation scenarios, a dedicated sensitivity analysis of the coordination coefficient relative to building scale, and extending the quantitative verification of regulatory compliance to the full set of requirements documented in the regulatory-positioning table.
Supplementary Materials
The following supporting information can be downloaded at: https://.../s1, software (code folder): contains the Python code used to generate all results (23 Python files); results (folder with all results): contains output files in JSON format with results generated by the software; docs (documents folder): contains three PDF files with project structure, software description, and 3D visualizer description.
Funding
This research received no external funding.
Data Availability Statement
The source code, configuration files, sensor input data, and simulation outputs supporting the findings of this study are openly available as Supplementary Material accompanying this article.
References
- Ivanov, R. An Algorithm for On-the-Fly K Shortest Paths Finding in Multi-Storey Buildings Using a Hierarchical Topology Model. Int. J. Geogr. Inf. Sci. 2018, 32, 2362–2385. [Google Scholar] [CrossRef]
- Qi, X.; Li, X.; Zhang, J.; Song, W. Pedestrian Evacuation in Fire Environments: Scientometric Analysis and Systematic Evaluation. Phys. A 2026, 131323. [Google Scholar] [CrossRef]
- Muthukumar, S.; Rajesh, S.; Talpallikar, A.; Mishra, T.K. A Systematic Review of Artificial Intelligence Frameworks for Holistic Disaster Management. Discov. Artif. Intell. 2026, 6, 308. [Google Scholar] [CrossRef]
- Leong, C.S.; Lau, S.H.; Liew, H.H. Conceptual Fire Risk Management Framework of Building Information Modeling and Fire Dynamic Simulator †. Engineering Proceedings, 2025. [Google Scholar] [CrossRef]
- Zhang, Q.; Hu, Y.; Li, X. Research on Fire Scenario Analysis and Emergency Response Strategies for L-Shaped Buildings Using FDS. PLoS ONE 2026, 21, e0346927. [Google Scholar] [CrossRef] [PubMed]
- Sharma, J.; Andersen, P.A.; Granmo, O.C.; Goodwin, M. Deep Q-Learning with Q-Matrix Transfer Learning for Novel Fire Evacuation Environment. IEEE Trans. Syst. Man. Cybern. Syst. 2021, 51, 7363–7381. [Google Scholar] [CrossRef]
- Feng, Z.; Wang, C.; An, J.; Zhang, X.; Liu, X.; Ji, X.; Kang, L.; Quan, W. Emergency Fire Escape Path Planning Model Based on Improved DDPG Algorithm. J. Build. Eng. 2024, 95. [Google Scholar] [CrossRef]
- Fang, H.; Tam, W.C.; Lovreglio, R.; Emon, M.I.S.; Huang, M.X. Development of a Tenability-Based Path Planning Model for Building Fire Evacuations Using Reinforcement Learning. J. Build. Eng. 2026, 118. [Google Scholar] [CrossRef]
- Sun, L.; Liu, H.; Fan, B.; Li, X.; Li, W. Multi-Agent Deep Reinforcement Learning-Based Path Planning for Crowd Evacuation in Buildings. J. Build. Eng. 2025, 111. [Google Scholar] [CrossRef]
- Xie, C.Z.T.; Chen, Q.; Zhu, B.; Lee, E.W.M.; Tang, T.Q.; Yin, X.; Yuan, Z.; Zhang, B. Coordinating Dynamic Signage for Evacuation Guidance: A Multi-Agent Reinforcement Learning Approach Integrating Mesoscopic Crowd Modeling and Fire Propagation. Chaos Solitons Fractals 2025, 194. [Google Scholar] [CrossRef]
- Omidbeyk, S.; Ghavami, S.M. Multi-Agent Simulation of Population Evacuation during Dynamic Fire Using Reinforcement Learning Based on Integration of Geographic Information Systems and Building Information Modeling. J. Build. Eng. 2025, 111. [Google Scholar] [CrossRef]
- Deng, H.; Fan, Z.; Wei, X.; Deng, Y. An Ontology-Based Approach to Dynamic Indoor Fire Emergency Evacuation Path Planning with BIM Integration. J. Build. Eng. 2025, 106. [Google Scholar] [CrossRef]
- Jiang, S.; Wei, Y.; Zhang, B. Fire Evacuation Design Optimization of Public Buildings Based on Building Information Modeling Semantic Enrichment for Fire Simulation Requirements. Reliab. Eng. Syst. Saf. 2026, 113173. [Google Scholar] [CrossRef]
- Shih, G.R.; Tsai, P.H. Safest-Path Planning Approach for Indoor Fire Evacuation. Int. J. Disaster Risk Reduct. 2023, 93. [Google Scholar] [CrossRef]
- Guan, W.; Hou, S.; Yu, G.; Gong, H.; Guan, S.; Zhao, J. Dynamic Evacuation Path Planning for Multi-Exit Building Fire: Bi-Objective Model and Algorithm. Fire Technol. 2023, 59, 2853–2876. [Google Scholar] [CrossRef]
- Yen, H.H.; Lin, C.H.; Tsao, H.W. Novel Smoke-Aware Individual Evacuation and Congestion-Aware Group Evacuation Algorithms in IoT-Enabled Multi-Story Multi-Exit Buildings. IEEE Access 2022, 10, 119402–119418. [Google Scholar] [CrossRef]
- Li, N.; Huang, G.; Jiang, H.; Gao, X.; Zhou, L. Fire Propagation-Driven Dynamic Intelligent Evacuation Model in Multifloor Hybrid Buildings. Adv. Eng. Inform. 2023, 57. [Google Scholar] [CrossRef]
- Bai, J.; Lv, X.; Nie, L.; Fang, M. Evacuation Route Determination in Indoor Architectural Environments Based on Dynamic Fire Risk Assessment. Buildings 2025, 15. [Google Scholar] [CrossRef]
- Xu, L.; Huang, K.; Liu, J.; Li, D.; Chen, Y.F. Intelligent Planning of Fire Evacuation Routes Using an Improved Ant Colony Optimization Algorithm. J. Build. Eng. 2022, 61. [Google Scholar] [CrossRef]
- Zhang, Y.Q.; Wang, J.H.; Wang, Y.; Jia, Z.C.; Sun, Q.; Pei, Q.Y.; Wu, D. Intelligent Planning of Fire Evacuation Routes in Buildings Based on Improved Adaptive Ant Colony Algorithm. Comput. Ind. Eng. 2024, 194. [Google Scholar] [CrossRef]
- Zuo, S.; Mao, Z.; Fan, C.; Chen, X.; Gong, M.; Ren, J.; Fan, X.; Guo, Y. Dynamic Planning of Crowd Evacuation Path for Metro Station Based on Dynamic Avoid Smoke A-Star Algorithm. Tunn. Undergr. Space Technol. 2024, 154. [Google Scholar] [CrossRef]
- Golshani, F.; Fang, L. A Fire Navigation Model: Considering Travel Time, Impact of Fire, and Congestion Severity. Reliab. Eng. Syst. Saf. 2025, 259. [Google Scholar] [CrossRef]
- Shi, J.; Li, M.; Jiang, N.; Yu, H.; Yang, H.; Zhou, X.; Yang, L. A Multi-Agent Deep Reinforcement Learning Model for Crowd Coordinated Evacuation Simulation in Complex Environments. Simul. Model. Pract. Theory 2026, 147. [Google Scholar] [CrossRef]
- Yu, A.; Bu, H.; Luan, T.; Gai, W. Integrated Multi-Agent-Based Outpatient Building Fire Response Modeling for Risk-Driven Resource Use and Retrofitting Strategies: A Case Study. Reliab. Eng. Syst. Saf. 2025, 260. [Google Scholar] [CrossRef]
- Bahmani, H.; Ao, Y.; Yang, D.; Xu, Q.; Zhao, J. Enhancing Evacuation Safety in Urban Primary Schools: An Agent-Based Model Integrating Child Development Behaviour and Health Dynamics. Reliab. Eng. Syst. Saf. 2026, 265. [Google Scholar] [CrossRef]
- Saravanan, T.; Singhal, U.; Magadum, N.; Ramasamy, P.; Paramanandam, K. AI-Driven Crowd Behavior Simulation for Emergency Evacuation Management. In International Conference on Data Science and Applications; Springer Nature Switzerland: Cham, Switzerland, 2025; pp. 65–78. [Google Scholar] [CrossRef]
- Yang, S.; Ceferino, L.; Zhang, Y.; Gu, C.; Guo, T.; Kondo, G. When Agents Learn to Think: Large Language Model-Enhanced Agent-Based Modeling for Crowd Evacuation in Disaster Scenarios. Reliab. Eng. Syst. Saf. 2026, 269. [Google Scholar] [CrossRef]
- Lin, J.R.; Chen, K.Y.; Song, S.Y.; Cai, Y.H.; Pan, P.; Deng, Y.C. Digital Twin of Buildings and Occupants for Emergency Evacuation: Framework, Technologies, Applications and Trends. Adv. Eng. Inform. 2025, 66. [Google Scholar] [CrossRef]
- Pishahang, M.; Ruiz-Tagle, A.; Ramos, M.A.; Droguett, E.L.; Mosleh, A. A Bayesian Agent-Based Model and Software for Wildfire Safe Evacuation Planning and Management. Proceedings of the Institution of Mechanical Engineers, Part O: Journal of Risk and Reliability 2025, 239, 515–534. [Google Scholar] [CrossRef]
- Sun, H.; Chen, M.; Zhang, Y.; Zhang, T.; Hu, P.; Ye, X.; et al. EvacuNet: An Intelligent Decision Support Framework for Real-Time Evacuation Assessment in Complex Buildings. Expert Syst. Appl. 2026, 132898. [Google Scholar] [CrossRef]
- National Fire Protection Association. NFPA 92: Standard for Smoke Control Systems; NFPA: Quincy, MA, USA, 2024; Available online: https://www.nfpa.org/codes-and-standards/nfpa-92-standard-development/92 (accessed on 18.08.2026).
- European Committee for Standardization. EN 1991-1-2:2002: Eurocode 1 — Actions on Structures — Part 1-2: General Actions — Actions on Structures Exposed to Fire; CEN: Brussels, Belgium, 2002. [Google Scholar]
- Alpert, R.L. Calculation of Response Time of Ceiling-Mounted Fire Detectors. Fire Technol. 1972, 8, 181–195. [Google Scholar] [CrossRef]
- British Standards Institution. BS 9999:2017: Fire Safety in the Design, Management and Use of Buildings — Code of Practice; BSI: London, UK, 2017; Available online: https://knowledge.bsigroup.com/products/fire-safety-in-the-design-management-and-use-of-buildings-code-of-practice (accessed on 18.08.2026).
- National Fire Protection Association. NFPA 101: Life Safety Code; NFPA: Quincy, MA, USA, 2024; Available online: https://www.nfpa.org/product/nfpa-101-life-safety-code/p0101code/nfpa-101-life-safety-code-2024/10124 (accessed on 18.08.2026).
- British Standards InTablestitution. PD 7974-6:2019: Application of Fire Safety Engineering Principles to the Design of Buildings — Part 6: Human Factors: Life Safety Strategies — Occupant Evacuation, Behaviour and Condition; BSI: London, UK, 2019; Available online: https://knowledge.bsigroup.com/products/application-of-fire-safety-engineering-principles-to-the-design-of-buildings-human-factors-life-safety-strategies-occupant-evacuation-behaviour-and-condition-sub-system-6 (accessed on 18.08.2026).
- Karlsruhe Institute of Technology; Institute for Automation and Applied Informatics. AC20-Institute-Var-2 [IFC Test Model]; IfcWiki, 2017. Available online: https://www.ifcwiki.org/images/9/98/AC20-Institute-Var-2.ifc (accessed on 18.08.2026).
- Fischer, S.; Schranz, C.; Urban, H.; Pfeiffer, D.; Flamm, L. Real-World Test Model for Escape Route Analysis in IFC Format (Version 2.0.0) [Data Set]; TU Wien, 2024. [Google Scholar] [CrossRef]
- ASTM International. ASTM E1355-23: Standard Guide for Evaluating the Predictive Capability of Deterministic Fire Models; ASTM International: West Conshohocken, PA, USA, 2023; Available online: https://store.astm.org/e1355-23.html (accessed on 18.08.2026).
- Ministry of Regional Development and Public Works. Regulation No. Iz-1971 on Construction-Technical Rules and Standards for Ensuring Fire Safety. 2009. (in Bulgarian). Available online: https://www.mrrb.bg/bg/naredba-z-1971-ot-29-oktomvri-2009-g-za-stroitelno-tehnicheski-pravila-i-normi-za-osiguryavane-na-bezopasnost-pri-pojar/ (accessed on 18.08.2026).
Figure 1.
Algorithmic architecture of the proposed system.
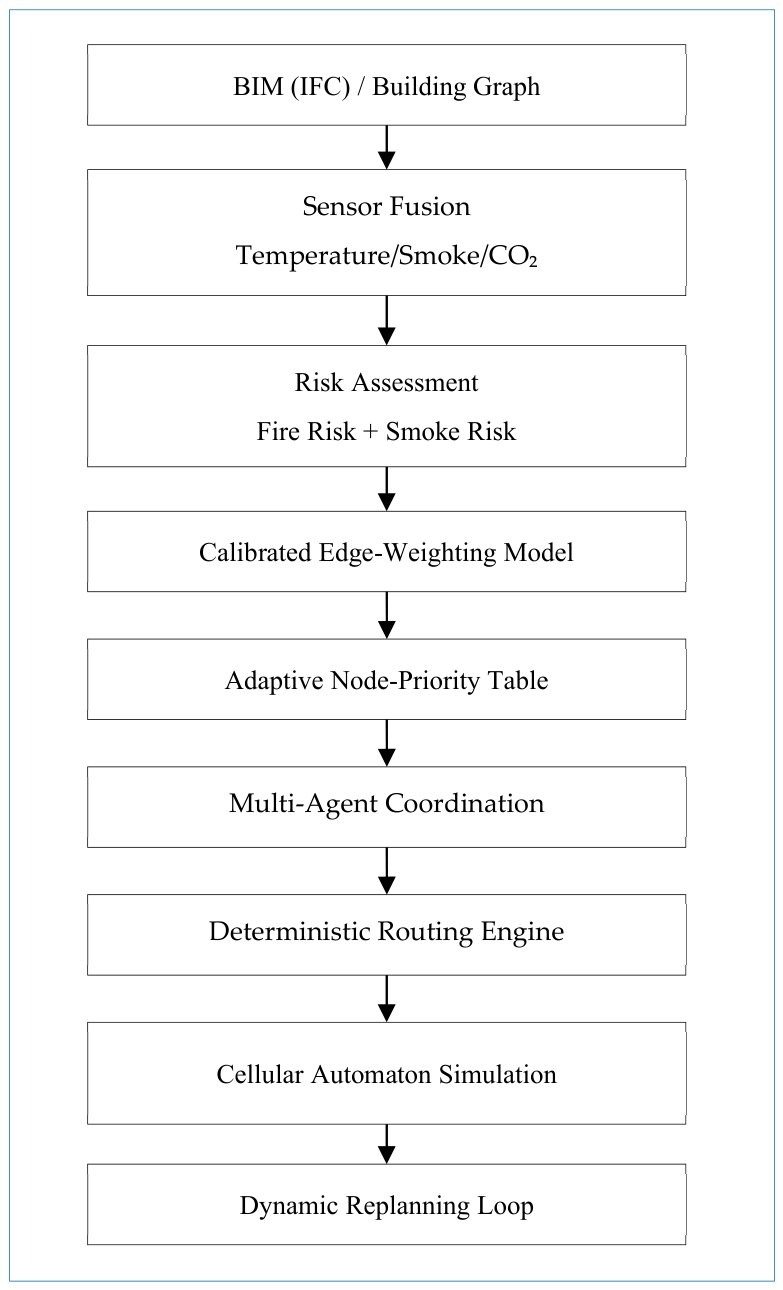
Figure 2.
3D views of the four studied buildings: a) Rectorate, b) University Library, c) Institute, d) ZDB.
Figure 2.
3D views of the four studied buildings: a) Rectorate, b) University Library, c) Institute, d) ZDB.
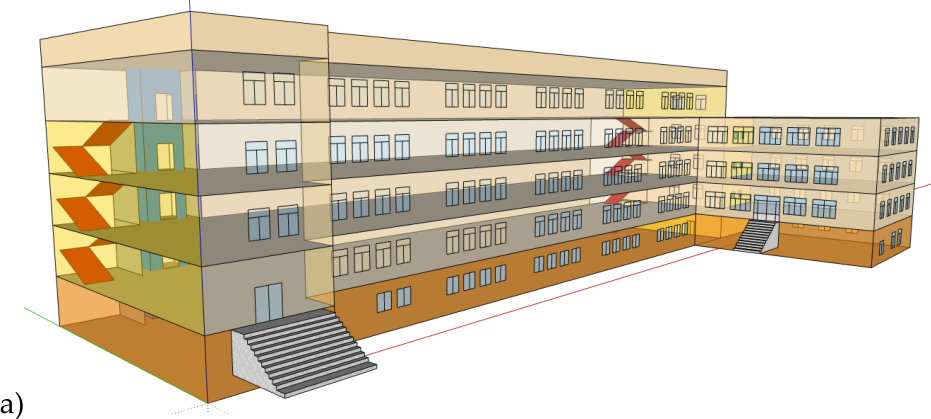
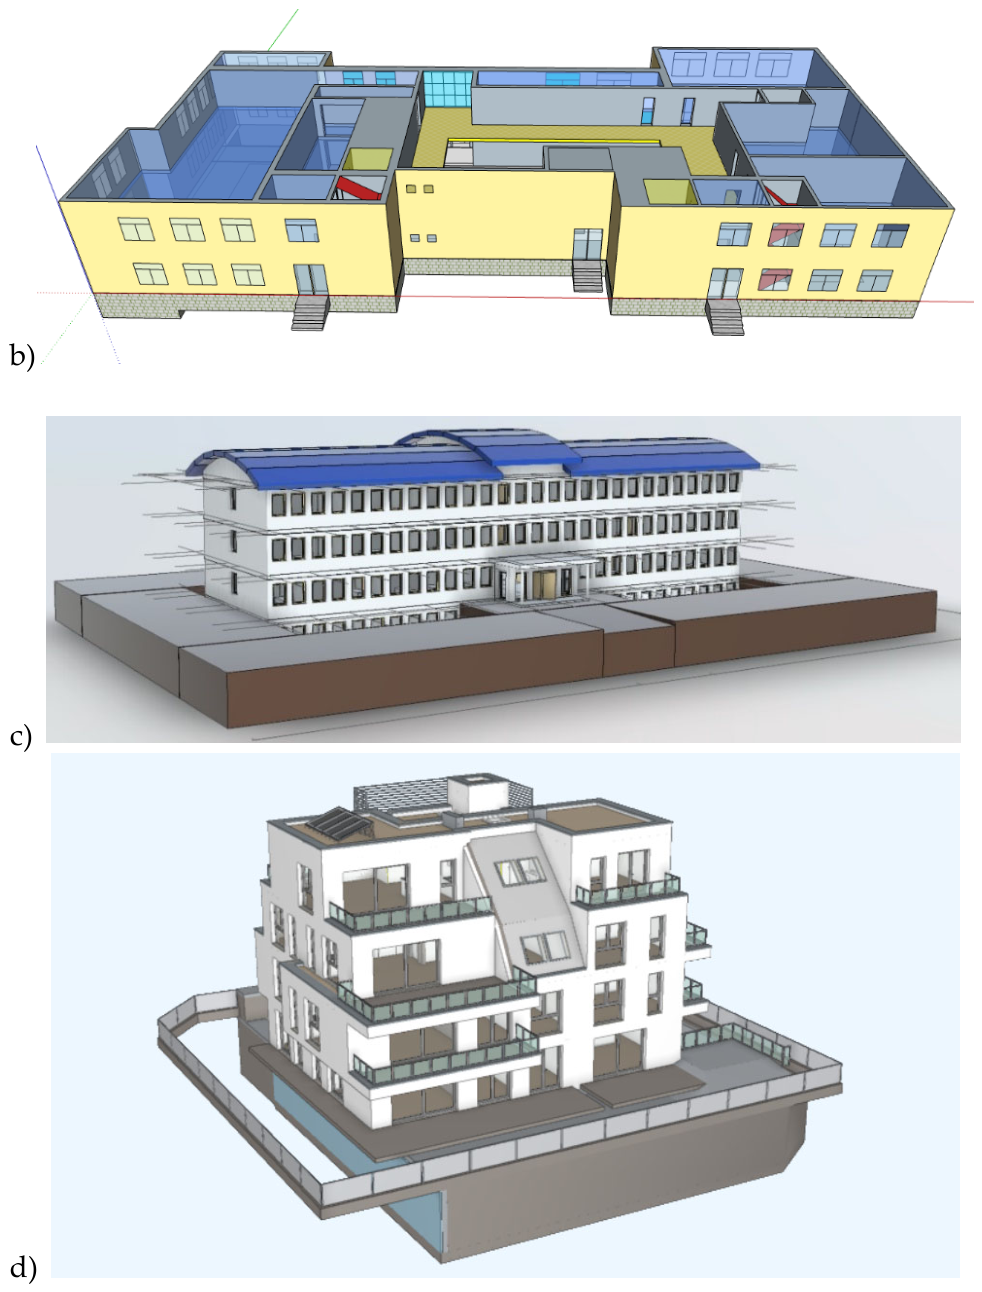
Figure 3.
OAT local sensitivity analysis for the eight calibratable weights, Scenario 10. Flat panels (constant line) indicate the absence of a measurable effect across the entire range studied.
Figure 3.
OAT local sensitivity analysis for the eight calibratable weights, Scenario 10. Flat panels (constant line) indicate the absence of a measurable effect across the entire range studied.
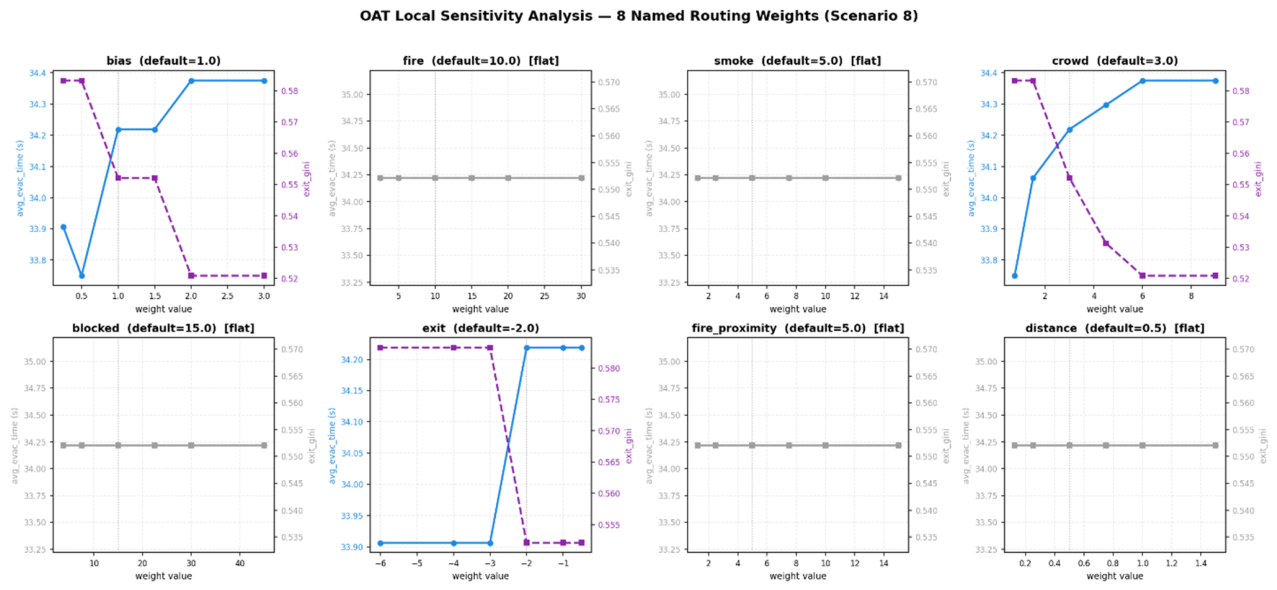
Figure 4.
PROPOSED versus each baseline configuration by number of evacuated agents, for all thirteen scenarios (W = statistically significant win, -- = no significant difference, p<0.05).
Figure 4.
PROPOSED versus each baseline configuration by number of evacuated agents, for all thirteen scenarios (W = statistically significant win, -- = no significant difference, p<0.05).
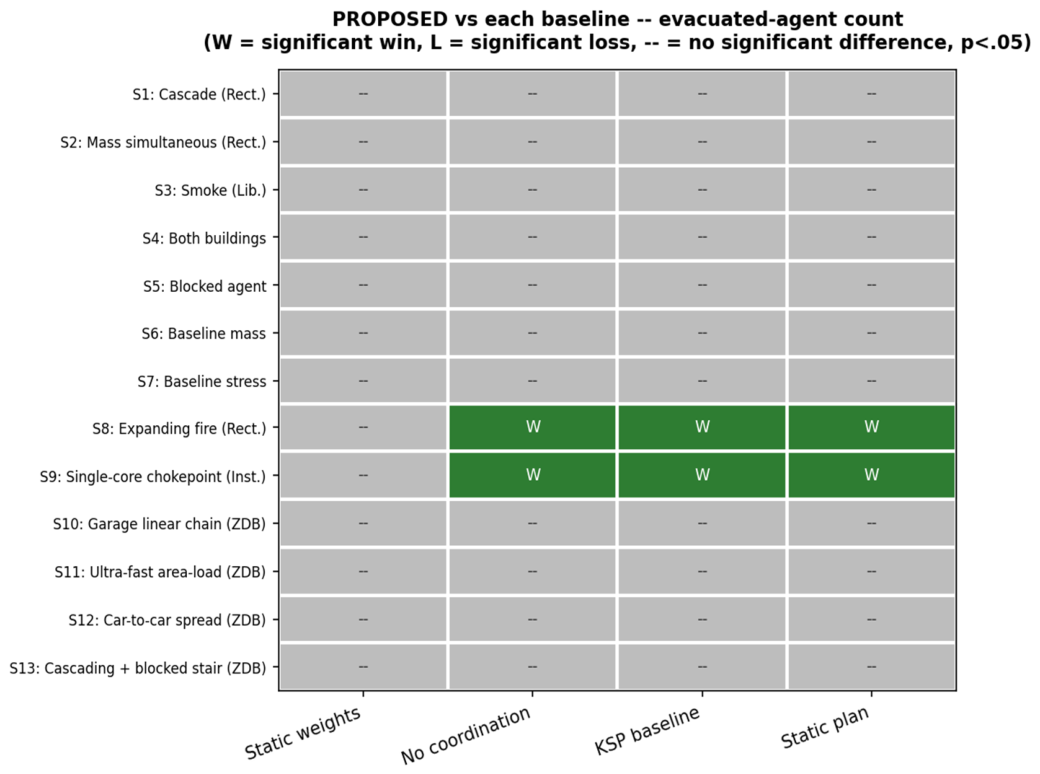
Figure 5.
Gini coefficient of exit load, by configuration, for Scenario 6 (values averaged over 20 Monte Carlo replicates).
Figure 5.
Gini coefficient of exit load, by configuration, for Scenario 6 (values averaged over 20 Monte Carlo replicates).
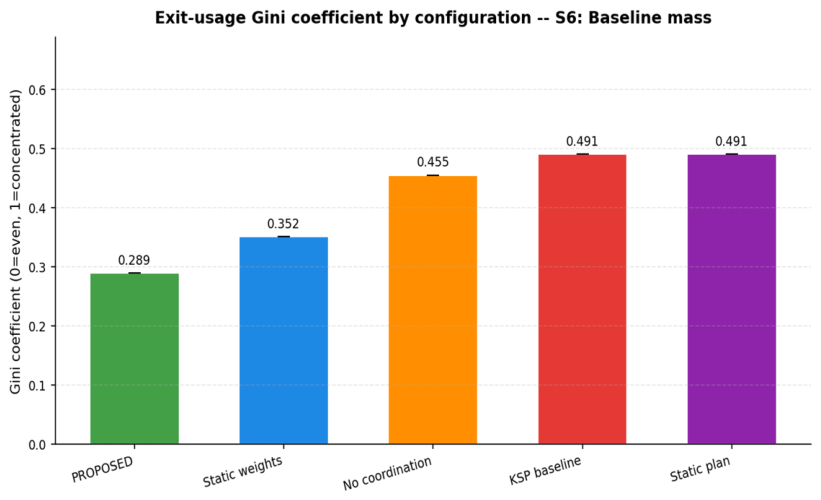
Figure 6.
Distribution of evacuated agents across exits for Scenario 10 (ZDB building), extracted from the console output of dynamic_simulation.py for a single illustrative run.
Figure 6.
Distribution of evacuated agents across exits for Scenario 10 (ZDB building), extracted from the console output of dynamic_simulation.py for a single illustrative run.
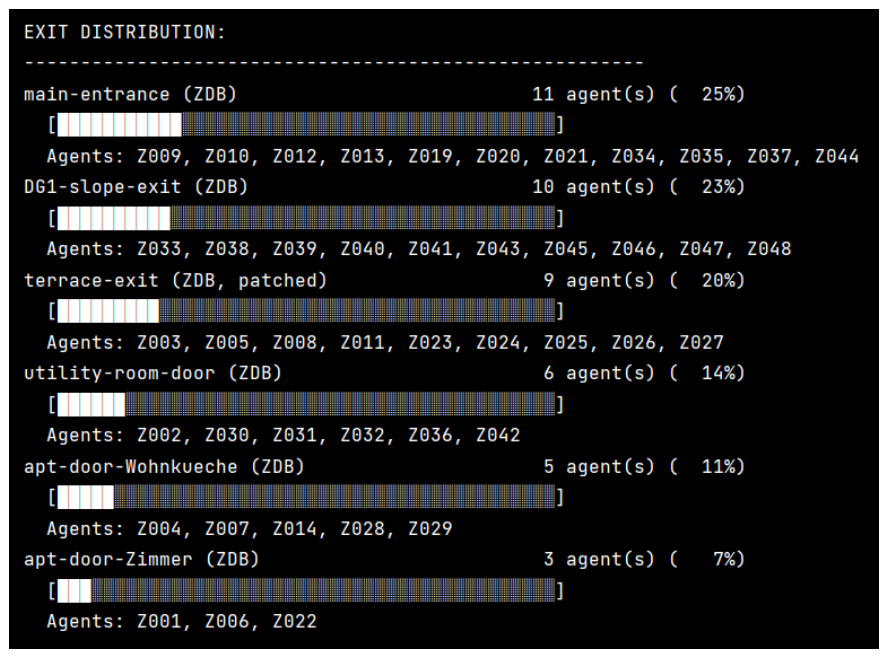
Figure 7.
Temporal dynamics of fire and smoke spread across nodes for Scenario 12, showing the rapid transition from smoke (orange) to active fire (red) at each individual node.
Figure 7.
Temporal dynamics of fire and smoke spread across nodes for Scenario 12, showing the rapid transition from smoke (orange) to active fire (red) at each individual node.
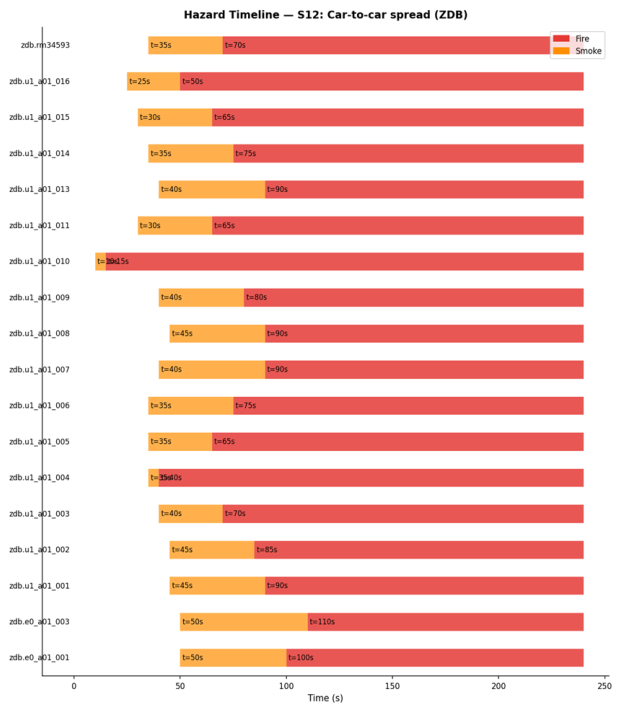
Figure 8.
Interactive 3D reconstruction of the actual route of agent Z001 in Scenario 11 (ZDB building), with fire and smoke nodes marked, the actual sequence of doors and spaces traversed, and a slider for time animation and elevation range.
Figure 8.
Interactive 3D reconstruction of the actual route of agent Z001 in Scenario 11 (ZDB building), with fire and smoke nodes marked, the actual sequence of doors and spaces traversed, and a slider for time animation and elevation range.
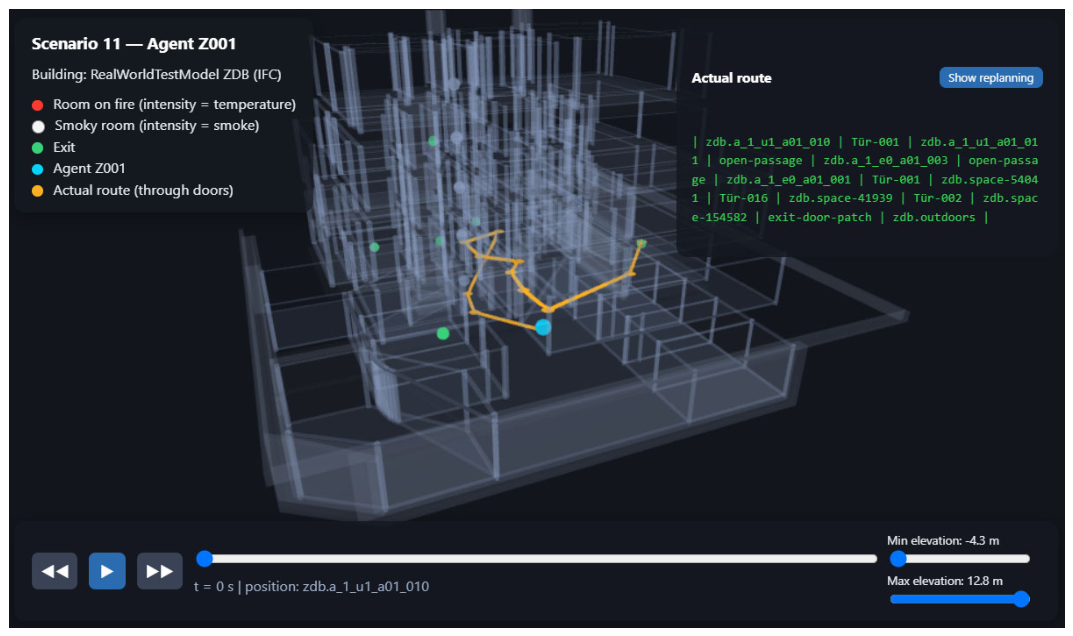
Figure 9.
Mean versus standard deviation of maximum evacuation time, by configuration, for all thirteen scenarios with available Monte Carlo results.
Figure 9.
Mean versus standard deviation of maximum evacuation time, by configuration, for all thirteen scenarios with available Monte Carlo results.
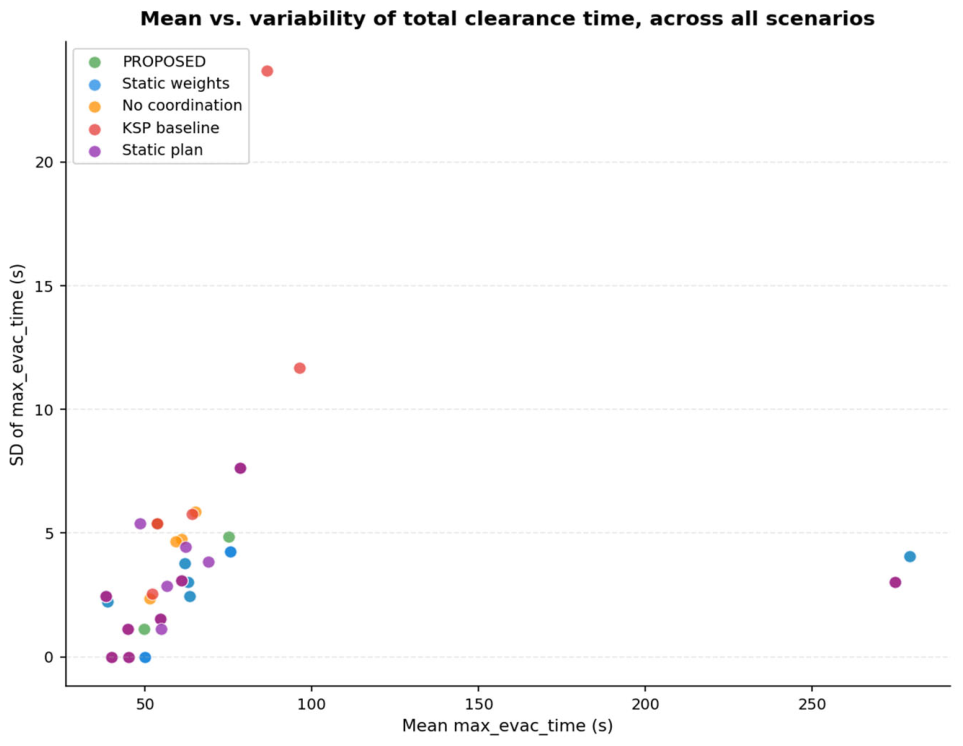

Table 1.
Comparison of the proposed approach with representative methods from literature.
| Approach | Dynamic evacuation | Logic type | Explainability | Graph structure | Real time | Multi-agent coordination | Potential for regulatory compliance |
|---|---|---|---|---|---|---|---|
| Classical routing algorithms [14,15] | Partial | Deterministic (rule-based) | High | Yes | Limited | No | High |
| ACO/A*/risk-oriented approaches [16,18,19,20,21] | Yes | Deterministic (rule-based) | Medium | Yes | Yes | No | Medium |
| Single-agent Reinforcement Learning [6,7,8] | Yes | Trainable | Low | No | Yes | No | Low |
| Multi-Agent Reinforcement Learning [9,10,11] | Yes | Trainable | Low | Partial | Yes | Yes | Low |
| BIM/FDS [4,5,12] | Partial | Deterministic (rule-based) | High | Yes | Limited | No | Medium |
| Integrated AI platforms [26] | Yes | Trainable | Low | Yes | Yes | Partial | Low |
| Proposed approach | Yes | Deterministic | High | Yes | Yes | Yes | High |
Table 2.
Maximum crowding capacity by node type, used for density normalization.
| Node type | Maximum capacity (people) |
|---|---|
| Corridor | 20 |
| Stairwell | 10 |
| Room | 15 |
| Elevator | 8 |
| Safe zone (exit) | 100 |
| Undefined type (default) | 15 |
Table 3.
Sensor-type confidence weights are used in the aggregation of fire risk and smoke risk.
| Sensor type | Fire weight | Smoke weight |
| Temperature | 0.95 | 0.70 |
| Smoke | 0.70 | 0.85 |
| CO₂ | 0.40 | 0.80 |
| Crowd | 0.00 | 0.00 |
Table 4.
Hysteresis thresholds for classifying a node as fire-affected or smoke-affected.
| Hazard type | Entry threshold | Exit threshold |
| Fire | risk ≥ 0.45 | risk < 0.30 |
| Smoke | risk ≥ 0.25 | risk < 0.15 |
Table 5.
Eight-dimensional feature vector f computed for each edge of the graph.
| Index | Feature | Semantics |
| f₀ | bias | Constant base cost per hop (minimum number of steps) |
| f₁ | fire_risk | Continuous fire risk score (or 0.9 for a binary indicator) |
| f₂ | smoke_risk | Continuous smoke risk score (or 0.5 for a binary indicator) |
| f₃ | crowd_density | Crowd density at the node, [0,1] |
| f₄ | blocked | 1.0 if the connecting door is marked as blocked |
| f₅ | exit_bonus | 1.0 if the node is an exit |
| f₆ | fire_proximity | 1.0 − normalized distance to the nearest fire node |
| f₇ | distance | Geometric distance along the edge, normalized to 5 meters |
Table 6.
Default weight vector for the edge-cost model.
| Weight | Feature | Value | Direction of effect |
| bias | 1.0 | Minimum cost per hop | |
| fire_risk | 10.0 | Higher value → stronger avoidance of fire nodes | |
| smoke_risk | 5.0 | Higher value → stronger avoidance of smoke-affected nodes | |
| crowd | 3.0 | Higher value → stronger avoidance of congested nodes | |
| blocked | 15.0 | Higher value → stronger avoidance of blocked doors | |
| exit_bonus | −2.0 | Negative value → attracts toward exit nodes | |
| fire_proximity | 5.0 | Higher value → earlier, anticipatory avoidance of fire zones | |
| distance | 0.5 | Higher value → preference for geometrically shorter paths |
Table 7.
Threshold-based corrections to the online table of node values .
| Event | Correction to P(node) |
|---|---|
| The node is in a fire zone | −15.0 |
| The node is in a smoke-affected zone | −5.0 |
| The node is a free exit | +10.0 |
| The node is overcrowded | −3.0 |
Table 8.
Overview of the thirteen evacuation scenarios used for the experimental evaluation.
| No. | Building | Agents | Nature of the hazard |
| 1 | Rectorate, 3rd floor | 5 | Cascading evacuation, fire in the stairwell |
| 2 | Rectorate, floors 2–4 | 8 | Simultaneous mass evacuation |
| 3 | Library, floors 1–3 | 6 | Cascading evacuation with smoke |
| 4 | Rectorate + Library | 6 | Mixed evacuation from two buildings |
| 5 | Rectorate | 3 | Blocked agent, fire-department notification |
| 6 | Rectorate + Library | 32 | Mass planned evacuation |
| 7 | Rectorate + Library | 32 | Mass evacuation under stress |
| 8 | Rectorate | 64 | Expanding fire (floors 2/3/4) |
| 9 | Institute | 80 | Congestion at a single connectivity core |
| 10 | ZDB | 48 | Fire spread from several vehicles |
| 11 | ZDB | 120 | CFD-type fire (area-based modeling) |
| 12 | ZDB | 120 | CFD-type fire, car-to-car |
| 13 | ZDB | 80 | Cascading fire with stairwell blockage |
Table 9.
Ablation configurations used in comparative study.
| Configuration | Calibrated weights | Online adaptation | Coordination | Dynamic replan |
| PROPOSED | yes | yes | 0.35 | yes |
| STATIC_WEIGHTS | no | no | 0.35 | yes |
| NO_AGENTS_COORD | yes | yes | 0.0 | yes |
| KSP_BASELINE | no | no | 0.0 | yes |
| STATIC_PLAN | no | no | 0.0 | no |
Table 10.
Number of weights with no measurable effect (“flat” weights) out of eight total, per scenario.
Table 10.
Number of weights with no measurable effect (“flat” weights) out of eight total, per scenario.
| Scenario | Flat weights | Which weights |
| 1–5, 7 | 8/8 | bias, fire, smoke, crowd, blocked, exit, fire_proximity, distance |
| 6, 8, 9, 10 | 5/8 | fire, smoke, blocked, fire_proximity, distance (for Scenario 9: + exit) |
| 11, 12, 13 | 6/8 | fire, smoke, blocked, exit, fire_proximity, distance |
Table 11.
Number of scenarios (out of 13 total) with p<0.05 (Mann–Whitney U) when comparing PROPOSED against each baseline configuration, by metric.
Table 11.
Number of scenarios (out of 13 total) with p<0.05 (Mann–Whitney U) when comparing PROPOSED against each baseline configuration, by metric.
| Metric | vs STATIC_WEIGHTS | vs NO_AGENTS_COORD | vs KSP_BASELINE | vs STATIC_PLAN |
| Evacuated (count) | 0/13 | 2/13 | 2/13 | 2/13 |
| Mean evac. time | 1/13 | 9/13 | 9/13 | 11/13 |
| Max. evac. time | 0/13 | 7/13 | 6/13 | 9/13 |
| Number of exits | 0/13 | 8/13 | 9/13 | 11/13 |
| Gini coefficient | 3/13 | 8/13 | 8/13 | 9/13 |
Table 12.
Significance (number of scenarios out of 5, p<0.05) and mean effect size (|Cliff’s delta|) for Group A.
Table 12.
Significance (number of scenarios out of 5, p<0.05) and mean effect size (|Cliff’s delta|) for Group A.
| Metric | vs STATIC_WEIGHTS | vs NO_AGENTS_COORD | vs KSP_BASELINE | vs STATIC_PLAN |
| Mean evac. time | 0/5 (δ=0.01) | 3/5 (δ=0.33) | 3/5 (δ=0.33) | 4/5 (δ=0.43) |
| Number of exits | 0/5 (δ=0.00) | 3/5 (δ=0.64) | 3/5 (δ=0.64) | 4/5 (δ=0.80) |
| Gini coefficient | 0/5 (δ=0.02) | 3/5 (δ=0.65) | 3/5 (δ=0.65) | 4/5 (δ=0.80) |
Table 13.
Significance and mean effect size for Group B.
| Metric | vs STATIC_WEIGHTS | vs NO_AGENTS_COORD | vs KSP_BASELINE | vs STATIC_PLAN |
| Mean evac. time | 1/3 (δ=0.29) | 3/3 (δ=1.00) | 3/3 (δ=0.98) | 3/3 (δ=0.90) |
| Max. evac. time | 0/3 (δ=0.02) | 2/3 (δ=0.71) | 2/3 (δ=0.68) | 3/3 (δ=0.91) |
| Number of exits | 0/3 (δ=0.00) | 2/3 (δ=0.67) | 2/3 (δ=0.67) | 3/3 (δ=1.00) |
| Gini coefficient | 2/3 (δ=0.55) | 3/3 (δ=1.00) | 3/3 (δ=1.00) | 3/3 (δ=0.80) |
Table 14.
Significance and mean effect size for Group C.
| Metric | vs STATIC_WEIGHTS | vs NO_AGENTS_COORD | vs KSP_BASELINE | vs STATIC_PLAN |
| Mean evac. time | 0/5 (δ=0.07) | 3/5 (δ=0.53) | 3/5 (δ=0.58) | 4/5 (δ=0.59) |
| Max. evac. time | 0/5 (δ=0.01) | 5/5 (δ=0.75) | 4/5 (δ=0.61) | 5/5 (δ=0.75) |
| Number of exits | 0/5 (δ=0.01) | 3/5 (δ=0.51) | 4/5 (δ=0.60) | 4/5 (δ=0.60) |
| Gini coefficient | 1/5 (δ=0.14) | 2/5 (δ=0.40) | 2/5 (δ=0.31) | 2/5 (δ=0.40) |
Table 15.
Number of evacuated agents with physical contact with fire (agents_fire) or smoke (agents_smoke) during movement, summed over all one hundred runs (5 configurations × 20 replicates) per scenario.
Table 15.
Number of evacuated agents with physical contact with fire (agents_fire) or smoke (agents_smoke) during movement, summed over all one hundred runs (5 configurations × 20 replicates) per scenario.
| Scenario | agents_fire | agents_smoke |
| 1–11, 13 (12 scenarios) | 0 | 0 |
| 12 | 230 | 230 |
Table 16.
Correspondence between the algorithm’s mechanisms and selected requirements from the applicable regulatory framework (design justification; only the requirement from Section 5 is empirically verified).
Table 16.
Correspondence between the algorithm’s mechanisms and selected requirements from the applicable regulatory framework (design justification; only the requirement from Section 5 is empirically verified).
| Requirement | Regulatory act | Algorithm mechanism |
| Route to a safe zone | Regulation Iz-1971, Art. 31–32 | Search restricted to explicitly defined exit nodes (Section 3.3) |
| Minimum of two independent exits | Regulation Iz-1971, Art. 33 | Coordination through virtual load (Section 3.7) |
| Elevators are not an evacuation route | Regulation Iz-1971, Art. 3; Directive 92/91/EEC | Permanent structural exclusion from the graph (Section 3.3) |
| Dynamic response to a new hazard | Directive 89/654/EEC | Hysteresis classification and recomputation trigger (Section 3.2) |
| A safer route takes precedence over a faster one | ISO 23932; SFPE Handbook | Lexicographic sorting (risk_level, total_cost) (Section 3.5) |
| Monitoring of route load | Regulation Iz-1971, Art. 33 | Crowd density in risk_score, edge_cost, and node_priority (Section 3.4 and Section 3.5) |
| Notification for blocked individuals | Directive 89/654/EEC; SFPE Handbook | Rescue-notification mechanism (Section 3.7) |
Disclaimer/Publisher’s Note: The statements, opinions and data contained in all publications are solely those of the individual author(s) and contributor(s) and not of MDPI and/or the editor(s). MDPI and/or the editor(s) disclaim responsibility for any injury to people or property resulting from any ideas, methods, instructions or products referred to in the content. |
© 2026 by the authors. Licensee MDPI, Basel, Switzerland. This article is an open access article distributed under the terms and conditions of the Creative Commons Attribution (CC BY) license (http://creativecommons.org/licenses/by/4.0/).
Copyright: This open access article is published under a Creative Commons CC BY 4.0 license, which permit the free download, distribution, and reuse, provided that the author and preprint are cited in any reuse.