

Submitted:
22 August 2026
Posted:
25 August 2026
You are already at the latest version
Abstract
Paralytic shellfish toxins (PSTs), potent neurotoxic alkaloids produced by marine dinoflagellates and cyanobacteria, pose severe risks to human health via contaminated seafoods and waters. Current detection methods suffer from low specificity, matrix interference, or ethical concerns. Here we report a novel screening approach using vanadium pentoxide as an oxidant to convert PSTs into characteristic oxidation products, followed by high-performance liquid chromatography-tandem mass spectrometry (HPLC‒MS/MS) analysis. Under optimized conditions, vanadium pentoxide oxidizes both hydroxylated and non-hydroxylated toxins into distinct major products (P1‒P7), identified by high-performance liquid chromatography‒tandem high-resolution mass spectrometry (HPLC‒MS/HRMS). Vanadium pentoxide oxidation affords excellent product selectivity and, for most PSTs, superior signal intensities, enabling unambiguous differentiation of toxin subgroups. HPLC‒MS/MS on MRM mode was developed and yielded detection limits of 0.3‒1.5 ng/mL for a broad-spectrum of 14 PSTs in spiked plasma, recovery percentages of 81.8‒102.2%, and excellent repeatability with intra- and inter-day relative standard deviation (RSDs) ranged from 0.3% to 10.4%. Application to the First Trial OPCW (the Organisation for the Prohibition of Chemical Weapons) Biotoxin Proficiency Test samples successfully identified STX/neoSTX, confirming its practical utility for trace PSTs detection in complex biological matrices.
Keywords:
paralytic shellfish toxins
; liquid chromatography-tandem mass spectrometry
; oxidation reaction
; saxitoxin
1. Introduction
The paralytic shellfish toxins (PSTs), such as derivatives of saxitoxin (STX), are a group of naturally occurring neurotoxic alkaloids primarily produced by both marine dinoflagellates and freshwater cyanobacteria, which can be categorized into three generic groups based on their net charge state (Figure1) .[1,2,3,4,5] Saxitoxin is also unique in that it is the only marine natural product that is listed to the controlled chemicals in the Chemical Weapons Convention.[6] Bioaccumulation of the toxins by the tissues of fish, molluscs, and crustaceans makes human consumers vulnerable to exposure to the toxins.[3] Furthermore, cyanobacterial blooms producing PSTs result in the contamination of drinking and recreational water resources.[7] The toxic effect of STX and related PSTs stems from their high affinity to voltage-gated sodium channels.[8,9] PST poisoning manifests as symptoms ranging from mild perioral paraesthesia and numbness to lethal respiratory paralysis.[10] The maximum permitted level for PSTs in bivalve molluscs is 800 μg STX equivalents per kilogram of shellfish tissue (800 μg STX eq./kg) in many countries.[11]
Various detection techniques have been used to monitor commercially harvested shellfish and manage hazards associated with PSTs. Initially, mouse bioassay (MBA) method was developed for the identification of STX.[12,13,14] However, the limitations such as inability to distinguish toxin analogs, low selectivity, and animal ethics controversies restrict their widespread application. Subsequently, enzyme-linked immunosorbent assay (ELISA) method,[15,16,17] thin-layer chromatography [18], capillary electrophoresis [19] and high-performance liquid chromatography-fluorescence detection (HPLC‒FLD) [4,20,21,22,23] have been proposed for the determination of PSTs. Among them, HPLC‒FLD method has become the official European Union reference method for the determination of PSTs in shellfish. Because the high polarity of PSTs, they exhibit poor retention on reversed-phase liquid chromatographic (RPLC) columns and susceptibility to matrix interferences. As a result, hydrogen peroxide and periodate are utilized in HPLC‒FLD method to oxidize PSTs into fluorescent derivatives with good retention on RPLC columns [22]
Currently, high-performance liquid chromatography‒tandem mass spectrometry (HPLC‒MS/MS) has emerged as the dominant analytical approach in the detection of PSTs. Compared with HPLC‒FLD, which relies solely on retention times for identification and suffers from fluorescence interferences originating from sample matrices, HPLC-MS/MS offers superior accuracy and specificity by using both retention times and characteristic fragment ions for confirmation, even in the absence of reference chemicals. Direct detection of PSTs by hydrophilic interaction liquid chromatography‒tandem mass spectrometry (HILIC‒MS/MS) has been widely used,[24,25,26,27,28] despite it exhibits the susceptibility to matrix interferences. Currently, the oxidized products of some PSTs were identified by high-performance liquid chromatography-tandem mass spectrometry (HPLC-MS/MS), [29,30] which makes it possible to screen PSPs by detecting these oxidized products using HPLC-MS/MS
Herein, we propose an novel oxidation strategy that can efficiently oxidize 14 PSTs congeners and establish a corresponding HPLC-MS/MS (MRM) method towards the resultant oxidized products. Peroxide can only oxidize the non-hydroxylated toxins such as STX, dcSTX, GTX2/3, dcGTX2/3, GTX5, C1/2, while periodate can oxidize most PSTs. However, the oxidation efficiency by periodate is poor for several PSTs. These issues motivate the search for more suitable oxidants.
In this study, vanadium pentoxide was used the oxidizing reagent to convert PSTs in plasma to characteristic oxidation products. These products were structurally characterized by high-performance liquid chromatography‒tandem high-resolution mass spectrometry (HPLC-MS/HRMS), and the HPLC-MS/MS method on MRM mode based on these typical products was established for screening PSTs in plasma
2. Results and Discussion
2.1. Identification of Vanadium Pentoxide Oxidation Products of PSTs
The PSTs are classified into non-hydroxylated toxins and hydroxylated toxins based on the presence or absence of a hydroxyl group at the N1 position, as shown in Figure 1. Periodate can oxidize non-hydroxylated toxins and hydroxylated toxins to fluorescent products, while peroxide can only oxidize the non-hydroxylated toxins such as STX, dcSTX, GTX2/3, dcGTX2/3, GTX5, C1/2 to fluorescent products.
2.1.1. Oxidation of STXs
Here we performed oxidation of STX and dcSTX with vanadium pentoxide in basic solution (Figure S1A and S1B), and the reaction products were subsequently characterized using HPLC-MS/HRMS. The chromatograms and MS/HRMS mass spectra of STX oxidation products are shown in Figure 2A and Figure S2A, respectively. The oxidation of STX produced the minor product P1 and major product P2. Meanwhile, dcSTX was extensively oxidized into P1 (Figure2B and Figure S2B). These results indicate that vanadium pentoxide possesses the potential to serve as an oxidant for STXs (Figure 1). We further applied vanadium pentoxide to oxidize other STXs, such as neoSTX and dcneoSTX. As shown in Figure S1C and Figure 2C, neoSTX mainly yielded product P2, accompanied by small quantities of P1 and P3 (the corresponding mass spectra are shown in FigureS2C). And dcneoSTX was also oxidized into major product P1 and minor product P3 (Figure 2D, Figure S1D and S2D). The results demonstrated that during vanadium pentoxide oxidation reaction, P2 represents the predominant oxidation product of STX and neoSTX, whereas P1 constitutes the main oxidation product of dcSTX and dcneoSTX. These products were formed by cleavage of the C4-C12 bond in the parent compounds, accompanied by the loss of four hydrogen atoms and the elimination of the N-1-hydroxy group (if present).
2.1.2. Oxidation of GTXs
Based on the above results, we hypothesized that vanadium pentoxide serves as an excellent alternative to periodic acid for the oxidative detection of hydroxylated and non-hydroxylated toxins. Accordingly, this approach was applied to GTXs (Figure 1), and the products were characterized by HPLC-MS/HRMS.
GTX1 and GTX4 are epimeric compounds. Since pure GTX1 and GTX4 standards could not be obtained, oxidation was performed using a GTX1/4 mixed standard. After vanadium pentoxide oxidation (Figure S1E and S1F), there were a predominant product designated as P4 with molecular ion at m/z 312.1052, as well as a minor product designated as P5 with a molecular ion at m/z 269.0993 in the full-scan mass spectra (data is not shown). The chromatograms and MS/HRMS spectrum of GTX1/4 oxidation products are shown in Figure 2E and Figure S2E, respectively. P4 exhibited a response intensity nearly two orders of magnitude higher than P5. The proposed fragmentation pathways are shown in Figure S2E based on the fragmentation ions obtained. Notably, products P5 and P3 share the same molecular weight, but obvious differences were observed in their MS/HRMS fragments (Figure S2C and Figure S2E), which further verify them as distinct compounds. Since GTX1/4 contains sulfonate groups, we also detected the oxidation product in negative ion mode, and a peak at m/z 390.0474 was observed at the retention position of P4 and the corresponing MS/HRMS mass spectra is shown in Figure S2E. By integrating mass spectrometric data acquired under both positive ion and negative ion modes, the structure of P4 was further corroborated. Characteristic neutral loss of SO3 (Δm=80 Da) from the sulfonate group is clearly observed in positive ion mode.[31,32] The product P4 was formed by cleavage of the C4-C12 bond in the parent compound, accompanied by the loss of four hydrogen atoms and the elimination of the N-1-hydroxy group. It should be noted that P4 generated from GTX1 and GTX4, respectively, are also epimers. Multiple attempts failed to achieve their chromatographic separation and thus they were regarded as one single product in this study. This treatment is also applicable to product P5 and P7 in the following sections.
The oxidation product distribution of GTX2/3 is consistent with that of GTX1/4 (Figure S1G and S1H). The chromatogram is shown in Figure 2F, and the corresponding MS/HRMS mass spectra are displayed in Figure S2F. The predominant product P4 was formed by cleavage of the C4-C12 bond in the parent compound, accompanied by the loss of four hydrogen atoms. Product P4 represents the common major characteristic oxidation product of GTX1/4 and GTX2/3, and could potentially act as a marker to confirm the presence of these toxins.
After vanadium pentoxide oxidation, GTX5 was oxidized to product P1 and product P6 (Figure S1I) with molecular ion at m/z 253.1043 and 376.0675, respectively. Their intensity is comparable. The chromatogram and MS/HRMS mass spectra of GTX5 oxidation products are shown in Figure 2G and Figure S2G, respectively. The proposed fragmentation pathway is shown in Figure S2G based on the fragmentation ions obtained. Product P6 was formed from the parent toxin via cleavage of the C4-C12 bond together with the loss of four hydrogen atoms. Especially, product P6 also was detected in negative ion mode, the corresponding mass spectra is shown in Figure S2G. The oxidation product distribution of GTX6 was consistent with that of GTX5 (Figure S1J). The chromatogram is shown in Figure 2H, and the corresponding MS/HRMS mass spectra is displayed in Figure S2H. Product P4 represents the characteristic oxidation product of GTX5 and GTX6, and could potentially act as a marker for verifying these toxins.
Upon oxidation of dcGTX2/3 (Figure S1K and S1L), product P5 with a molecular ion at m/z 269.0993 was obtained. The chromatogram and MS/HRMS mass spectra of dcGTX2/3 oxidation products are shown in Figure 2I and Figure S2I, respectively. In the negative ion mode, product P5 displays an ion molecular ion peak at m/z 347.0415 The proposed fragmentation pathway is shown in Figure S2I based on the fragmentation ions obtained. Owing to the presence of a sulfonate group, facile neutral loss of SO3 (Δm=80 Da) is observed in positive ion ESI mode. The product P5 was formed by cleavage of the C4-C12 bond in the parent compound, accompanied by the loss of four hydrogen atoms.
2.1.3. Oxidation of C1/2 Toxins
As shown in Figure 2J and Figure S2J, the oxidation of the C1/2 toxins yielded product P5 and product P7 (Figure S1M and S1N) with a molecular ion at m/z 269.0993 and m/z 392.0619, respectively. Their responses are comparable. In the negative ion mode, product P5 and P7 displayed an ion peak at m/z 347.0415 and m/z 470.0042, respectively. The proposed fragmentation pathway is shown in Figure S2J. Owing to the presence of a sulfonate group, facile neutral loss of SO3 (Δm=80 Da) is observed in positive ion ESI mode. The product P7 was formed by cleavage of the C4-C12 bond in the parent compound, accompanied by the loss of sulfonate groups in C11. It represents the characteristic oxidation product of C1 and C2, and could potentially act as a marker for verifying these toxins.
Collectively, these experimental results demonstrate that multiple toxin analogs share common oxidation products, with the majority affording one major product. Accordingly, detection of these characteristic major products can be utilized for qualitative and quantitative analysis of target toxins.
2.2. Reaction Condition Optimization
Subsequently, a HPLC-MS/MS method on MRM mode was developed based on the result of HPLC-MS/HRMS. The collision energy (CE) values and ion transitions are shown in Table S1. The precursor-product ion transition with the highest signal was selected for quantification, while the secondary product ion and the abundance ratio of two transitions were used for confirmation.
2.2.1. The pH of the Reaction Buffer
With the HPLC-MS/MS (MRM) method in hand, we investigated the influence of the pH of the reaction buffer, reaction temperature and time on the reaction products.[33] We carried out reaction optimization within the pH range of 9.6‒12.2 on 14 kinds of PSTs and the results are shown in Figure S3. It can be seen that the optimum pH for the hydroxylated toxins (neoSTX, dcneoSTX, GTX1/4, GTX6) is about 10.2, and the optimum pH for the non-hydroxylated toxins (STX, dcSTX, GTX2/3, dcGTX2/3, GTX5, C1/2) is about 11.6. We hope that there is a pH at which it would produce predominantly single product for GTX5, GTX6 and C1/2. However, there were no apparent variations in product distribution across all tested pH condition. The optimum pH for the non-hydroxylated toxins is higher than that for the hydroxylated toxins. This trend is consistent with that reported periodate oxidation reaction.[33] The difference is that the optimum pH of the periodate reaction is lower than that of the vanadium pentoxide-mediated reaction. The reason may be that here we optimize pH of the reaction buffer, while vanadium pentoxide can further interact with alkaline buffer solutions in high temperature, thereby altering the final pH of the reaction solution. Nevertheless, during toxin screening of actual samples, the specific toxin components are unknown, so the most suitable pH condition cannot be ensured. A universal pH is required for the oxidation reaction in PSPs screening. For instance, a buffer at pH 8.2 is routinely used for periodate oxidation, the well-established AOAC derivatization method. Here, sodium hydrogen phosphate buffer (0.3M, pH 11.6) was adopted for the screening reaction.
2.2.2. Reaction Temperature and Time
Temperature exerted a substantial effect on the oxidation reaction. STX, GTX1/4 and GTX5 were selected as the research targets for the optimization of reaction temperature and time. The corresponding results are presented in Figure 3. The MS response intensities of the major product measured by HPLC-MS/MS after 60 min of reaction at different temperatures are shown in Figure 3A. The major product increased significantly with increasing temperature. Comparable responses were obtained at 80 °C and 90 °C, so the reaction temperature was set as 80 °C. On this basis, reaction time was further optimized, and the results are illustrated in Figure 3B. No obvious further enhancement in the response of major product was observed when the reaction time was prolonged beyond 15 min. Accordingly, 15 min was adopted as the optimal reaction time.
2.2.3. Reaction Products and Distribution
Under the optimized reaction conditions, a comparison with periodate oxidation adopted in AOAC Official Method was performed to evaluate the signal intensities of the main reaction products and the product distribution. The final concentrations of the corresponding PSTs were identical in both oxidation reactions and the results are presented in Figure S4. For STX and neoSTX (Figure S4A and S4B), P2 was the predominant product in both vanadium pentoxide and periodate oxidation. The intensity of P2 in vanadium pentoxide oxidation was approximately 2‒8 times higher than that in the periodate oxidation. Besides, periodate oxidizes neoSTX to yielded P1 and P3 with considerable signal responses, leading to poor selectivity. For dcSTX and dcneoSTX (Figure S4C and S4D), P1 was the predominant product in both oxidation reaction. The intensity of P1 in vanadium pentoxide oxidation was approximately 2‒50 times higher than that in the periodate oxidation.
P4 is the unique formed upon oxidation of GTX1/4 and GTX2/3 (Figure S4E and S4F). Upon oxidation of GTX1/4, vanadium pentoxide oxidation afforded product P4 with approximately 5 times higher than that obtained with periodate oxidation. Besides, vanadium pentoxide oxidation of GTX1/4 exhibited excellent selectivity, yielding predominantly P4 with negligible amounts of P5. In comparison, periodate oxidized GTX1/4 to yield some P5. Exceptionally, both oxidants can convert GTX2/3 to P4, but the amount of P4 obtained under vanadium pentoxide oxidation is half of that observed from periodate oxidation. Meanwhile, P5 was the predominant oxidation product of dcGTX2/3 for both reactions (Figure S4G), and its intensity in vanadium pentoxide oxidation was roughly half that of the periodate oxidation. Although vanadium pentoxide oxidation of GTX2/3 and dcGTX2/3 yielded lower abundances of their main products relative to periodate, it exhibited better product selectivity in oxidizing GTXs. These findings reveal that vanadium pentoxide oxidation enables the discrimination of GTX1/2/3/4 from other PSTs.
P6 is the unique formed upon oxidation of GTX5 and GTX6. Upon oxidation of GTX5 (Figure S4H), both oxidation reactions yield P1 and P6 and their abundances from vanadium pentoxide oxidation are nearly 3 times of those from periodate oxidation. Notably, vanadium pentoxide oxidation of GTX6 afforded P1 and P6 (Figure S4I), as observed for GTX5, while periodate oxidation of GTX6 afforded P1 and P2, rather than P1 and P6. These findings reveal that vanadium pentoxide oxidation enables the discrimination of GTX5/6 from other PSTs, whereas periodate oxidation cannot.
P7 is the unique formed upon oxidation of C1/2 (Figure S4J). Oxidation of C1/2 gave identical product profiles for both reactions, with P4 and P7 formed under both conditions. The product intensity from periodate oxidation are about 3 times of those obtained in vanadium pentoxide oxidation.
Collectively, vanadium pentoxide oxidation delivers more main products for most PSTs, whereas periodate favors more reaction products only for GTX2/3, dcGTX2/3 and C1/2. Most notably, vanadium pentoxide oxidation of PSTs achieves better product selectivity and specificity, which is well suited for the screening of PSTs. P2, P4, P6, and P7 represents the exclusive vanadium pentoxide oxidation products of STX/neoSTX, GTX1/2/3/4, GTX5/6, and C1/2. The presence and relative mass spectrum response of P5 and P7 could be used to determine whether dcGTX2/3 or C1/2 is present. Similarly, the mass spectrum response ratio of P1 to P6 can differentiate dcSTX/dcneoSTX from GTX5/6.
2.3. Method Valiation
The method of the vanadium pentoxide oxidation combined with HPLC-MS/MS (MRM) was applied in detecting plasma samples for confirming its practical utility for trace PSTs detection in complex biological matrices. Prior to HPLC-MS/MS (MRM) analysis, the blank plasma and the spiked plasma samples were treated with purification and vanadium pentoxide oxidation in the experiment section. The results showed that no impurity peak appeared in the blank plasma matrix compared to the all the target peak positions.
2.3.1. LODs, LOQs and Linearity
The calibration curves were plotted with a series of concentrations of PSTs standard solutions against the response intensities of their major oxidation products generated upon vanadium pentoxide oxidation. The linear ranges of the calibration curves are shown in Figure S5 and summarized in Table 1. All correlation coefficient were greater than 0.9958. The limits of detection (LODs) and limits of quantitation (LOQs) were defined as the analyte concentrations yielding signal-to-noise ratios of ~3 and ~10, respectively, for the target peak in plasma matrix. Method LODs ranged from 0.3 to 1.5 ng/mL, and LOQs ranged from 1 to 5 ng/mL in human plasma.
2.3.2. Stability
The stability of the major oxidation product was assessed by storing the standard solutions (LOQs and 50 ng/mL) after vanadium pentoxide oxidation at 15 °C for 48 h, and comparing the response intensities before and after incubation. As shown in Table S2, the stability were greater than 84.7% for all main products of PSTs.
2.3.3. Precisions
As displayed in Table S3, the recoveries of all toxins range from 81.8% to 102.2% for spiked plasma samples. The intra-day and inter-day precisions were obtained by spiking the human plasma with two levels (LOQ and 50 ng/mL) of PSTs, performing detection for four-consecutive days and six replicates per day respectively. As shown in Table 1, the relative standard deviation (RSD) of intra-day ranged from 0.4% to 9.8%, and the RSDs of inter-day ranged from 0.3% to 10.4%. The results manifested that this method had good precisions and was well adopted for analysis of trace PSTs in plasma.
2.3.4. Application
In addition, this method was applied in screening the plasma samples from the First Trial OPCW Biotoxin Proficiency Test. The results of the HPLC-MS/MS analysis are presented in Figure 4. Only product P2 was detected in sample TBT011, TBT013, TBT014 and TBT015, suggesting that STX and/or neoSTX are present in these samples. The OPCW issued spiking list of the First Trial OPCW Biotoxin Proficiency Test showed that sample TBT011, TBT013, TBT014 and TBT015 all contain STX, validating the practicality of the method.
3. Materials and Methods
3.1. Materials
LC-MS grade acetonitrile (ACN), methanol (MeOH), water (H2O), and formic acid (FA), ammonium formate (AF), ammonium bicarbonate (NH4HCO3) were supplied by Merk (Darmstadt, Germany). Acetic acid (CH3COOH, AcOH), human plasma, potassium dihydrogen phosphate, and dipotassium hydrogen phosphate were purchased from Sigma-Aldrich (Saint Louis, USA). Ammonium hydroxide (NH3·H2O, analytical reagent, 25%) and periodic acid was obtained from J&K Scientific Ltd. (Beijing, China). Four types of SPE columns were evaluated: Oasis® PRiME HLB (3 cc, 60 mg) and Oasis MCX (3 cc, 60 mg) from Waters (Milford, MA, USA); Bond-Elute-Si (3 cc, 500 mg) from Agilent Technologies (Palo Alto, CA, USA); SupelcleanTM ENVI-CarbTM (3 cc, 250 mg) from Supelco Analytical (Bellefonte, PA, USA). The Certified reference chemicals (Table 1) including STX (61.4 μM), neoSTX(65.1 μM), dcSTX (65.3 μM), dcneoSTX (30.4 μM), GTX1/4 (62.3 and 14.7 μM, respectively), GTX2/3 (102.6 and 43.5 μM, respectively), GTX5 (53.6 μM), GTX6 (13.2 μM), dcGTX2/3 (107 and 21 μM, respectively) and C1/2 (93.8 and 27.4 μM, respectively) were acquired from the Canadian National Research Council (Halifax, Canada).
3.2. Plasma Sample Preparation
Spiked plasma sample (200 μL) in the sealed polypropylene tubes was adjusted to about pH 11 with NH3·H2O. A 250 mg ENVI-CarbTM cartridge (Supelco, Bellefonte, PA, USA) was used for sample purificaion according to the reported method. The plasma sample was loaded on the ENVI-CarbTM cartridge preconditioned with 2.0 mL of 20%ACN containing 1% AcOH and 2.0 mL of 50 mM NH4HCO3. The cartridge was washed with 2.0 mL of 50 mM NH4HCO3 to remove the background interference. The analyte was eluted with 2.0 mL of 20%ACN containing 1% AcOH. The eluent was collected and evaporated to dryness at 30 °C using a centrifugal vacuum evaporator. Finally, sample was reconstituted with 50 μL water.
3.3. Vanadium Pentoxide Oxidation
An aliquot of 10 μL sample was mixed with 2 μL of 0.3 M ammonium formate aqueous solution, 30 μL of potassium phosphate aqueous solution (0.2 M, pH 11.6) and 20 μL of aqueous vanadium pentoxide suspension (5 mg/mL). After incubated in 80 °C with shaking at 1500 rpm for 15 min. The resulting solution was cooled to room temperature centrifuged at 12000 r/min for 5 min to collect the supernatant for HPLC-MS analysis. The pH of aqueous potassium phosphate solution, reaction temperature, and reaction time were altered when optimizing the reaction conditions.
3.4. Periodate Oxidation
Mixing equal volumes of 0.03 M periodic acid, 0.3 M ammonium formate solution and 0.3 M potassium phosphate and adjusting the pH to 8.2 with 0.2 M NaOH. To 50 μL of oxidant solution, 10 μL of sample was added. The mixture was held at room temperature for 1 min, Finally, 2 μL of acetic acid was added to stop the reaction.
3.5. HPLC-MS/HRMS Analysis
HPLC-MS/HRMS analysis was performed on an UltiMate 3000 liquid chromatograph (Dionex, Sunnyvale, CA, USA) coupled to a Q Exactive Focus mass spectrometer (Thermo Fisher Scientific, San Jose, CA, USA). A reversed-phase Agilent Zorbax Eclipse Plus C18 column (2.1 × 150 mm, 1.8 μm particle size) was used for separation. All target compounds were chromatographed at 30 °C with a mobile phase consisting of formic acid in water (0.1% v/v, A) and formic acid in acetonitrile (0.1% v/v, B) at a flow rate of 0.3 mL/min. Gradient elution was applied: 2% B for 3 min, to 20% B in 2 min, to 50% B in 2 min, to 100% B in 0.1 min, hold for 2.9 min, to 2% B in 0.1 min, hold for 2.9 min.
All target compounds were simultaneously analyzed using the full-scan and PRM modes of HPLC−MS/HRMS. Mass spectrometry conditions: positive mode and negative mode, scanning range of 50−750 m/z, resolution 35000. The automatic gain control (AGC) was set to 5e4, and the maximum injection time (MIT) was set to automatic. The isolation window was set to 3.0 m/z. Mass tolerance was 5 ppm.
3.6. HPLC-MS/MS (MRM) Analysis
The HPLC‒MS/MS (MRM) analysis was performed on an Agilent 1290 Infinity II HPLC system coupled to a triple quadrupole spectrometer (6495C, Agilent). A reversed-phase Agilent Zorbax Eclipse Plus C18 column (2.1×150 mm, 1.8 μm particle size) was used for separation. All target compounds were chromatographed at 30 °C with a mobile phase consisting of formic acid in water (0.1% v/v, A) and formic acid in acetonitrile (0.1% v/v, B) at a flow rate of 0.3 mL/min. Gradient elution was applied: 2% B for 3 min, to 20% B in 2 min, to 25% B in 2 min, to 100% B in 0.1 min, hold for 2.9 min, to 2% B in 0.1 min, hold for 2.9 min.
All target compounds were quantified in multiple reaction monitoring (MRM) mode using a jet stream electrospray ionization source in positive ion mode and negative mode. Parameters are listed in Table S1. Ionization source parameters were as follows: gas temperature, 250 °C; gas flow rate, 11 L/min; nebulizer gas pressure, 35 psi; sheath gas temperature, 300 °C; sheath gas flow rate, 12 L/min; capillary voltage, 3500 V; nozzle voltage, 0 V; fragmentation voltage, 166 V.
3.7. Method Validation
Specificity was evaluated by comparing chromatograms of blank plasma matrix and spiked plasma samples after sample preparation and oxidation.
The limits of detection (LODs) and limits of quantitation (LOQs) were determined to be ~3 times and 10 times signals to noise ratios (S/N) of the target peak area response in the blank plasma matrix. Linearity was assessed by standard solution at a series of concentration. The calibration curve for each analyte was the concentration of PSTs versus the peak area of main products.
The intra-day and inter-day precisions were obtained by spiking the human plasma with two levels (LOQ and 50 ng/mL) of toxin references, performing detection for four-consecutive days and six replicates per day respectively. Plasma samples spiked with PSTs at 20 ng/mL were subjected to pretreatment followed by vanadium pentoxide oxidation. For blank plasma samples, the same pretreatment was performed, and PSTs were spiked at 20 ng/mL prior to vanadium pentoxide oxidation. Two samples were injected for analysis, and recoveries were calculated by comparing the peak areas of their major oxidation products. The stability of the major oxidation product was assessed by storing the reference solution (LOQs and 50 ng/mL) after vanadium pentoxide oxidation at 15 °C for 48 h, and comparing the response intensities before and after incubation.
3.8. Analysis of Samples from the First Trial OPCW Biotoxin Proficiency Test
The established method was applied to the analysis of six samples from the First Trial OPCW Biotoxin Proficiency Test.
4. Conclusions
In this study, we present a robust HPLC-MS/MS (MRM) method for PSTs screening based on vanadium pentoxide-mediated oxidation. This oxidant efficiently converts a broad-spectrum of 14 kinds of PSTs into characteristic major products (P1, P2, P4, P5 P6, P7) via cleavage of the C4-C12 bond, accompanied by loss of four hydrogen atoms and, where relevant, elimination of N-1-hydroxy or C-11 sulfonate groups. These unique markers enable unambiguous differentiation of PSTs subgroups (STX/neoSTX, GTX1/2/3/4, GTX5/6, and C1/2), while product distribution patterns further distinguish dcSTX/dcneoSTX from GTX5/6 and dcGTX2/3 from C1/2. Compared with periodate, vanadium pentoxide offers superior product selectivity and, for most toxins, significantly higher signal intensities. This method enables qualitative and quantitative analysis of PSTs in complex samples. The method was comprehensively validated in human plasma and demonstrated excellent analytical performance. Moreover, the successful detection of STX and/or neoSTX in samples from the First Trial of the OPCW Biotoxin Proficiency Test confirmed its practical applicability. This approach offers a reliable tool for trace-level screening of PSTs in complex biological matrices, and holds promise for broader use in food safety, clinical diagnostics, and forensic toxicology.
Supplementary Materials
The following supporting information can be downloaded at: https://www.mdpi.com/article/doi/s1, Figure S1: Reaction scheme for vanadium pentoxide oxidize 14 PSPs; Figure S2: MS/HRMS spectrum of the products derived from 14 PSPs standard solution after vanadium pentoxide oxidation;Figure S3: Influence of pH of the reaction buffer in vanadium pentoxide oxidation on the yield of main products of 14 PSPs; Figure S4: TIC from HPLC−MS/MS chromatograms of 14 PSPs standard solution after peridoate oxidation and vanadium pentoxide oxidation; Figure S5: Calibration plots of 14 PSPs concentration against mass spectrum intensity for their main oxidation products after vanadium pentoxide oxidation. Table S1: Optimized ion transition parameters for PSTs oxidation products; Table S2: Stability of main PSTs oxidation products; Table S3: Recovery of 14 PSTs in plasma.
Author Contributions
Conceptualization, Y.M. and S.L.; methodology, Y.M. and L.L.; validation, H.Y. and B.C.; formal analysis, Y.M., X.L. and B.C.; investigation, Y.M. and H.Y.; data curation, Y.M. and X.L.; writing—original draft preparation, Y.M. and L.L.; writing—review and editing, S.L and L.L. All authors have read and agreed to the published version of the manuscript.
Funding
This research received no external funding.
Data Availability Statement
The original data presented in the study are included in the article/Supplementary Material; further inquiries can be directed to the corresponding author.
Conflicts of Interest
The authors declare no conflicts of interest.
Abbreviations
The following abbreviations are used in this manuscript:
| HPLC‒MS/MS | High-performance liquid chromatography-tandem mass spectrometry |
| RSDs | Relative standard deviation |
| PSTs | The paralytic shellfish toxins |
| STX | Saxitoxin |
| MBA | Mouse bioassay |
| ELISA | Enzyme-linked immunosorbent assay |
| HPLC‒FLD | High-performance liquid chromatography-fluorescence detection |
| RPLC | reversed-phase liquid chromatographic |
| HILIC‒MS/MS | Hydrophilic interaction liquid chromatography‒tandem mass spectrometry |
| HPLC-MS/HRMS | High-performance liquid chromatography‒tandem high-resolution mass spectrometry |
| CE | Collision energy |
| LODs | Limits of detection |
| LOQs | Limits of quantitation |
| STX | Saxitoxin |
References
- Etheridge, S.M. Paralytic shellfish poisoning: Seafood safety and human health perspectives. Toxicon 2010, 56, 108–122. [Google Scholar] [CrossRef]
- Christensen, V.G.; Khan, E. Freshwater neurotoxins and concerns for human, animal, and ecosystem health: A review of anatoxin-a and saxitoxin. Sci. Total Environ. 2020, 736. [Google Scholar] [CrossRef]
- Wiese, M.; D’Agostino, P.M.; Mihali, T.K.; Moffitt, M.C.; Neilan, B.A. Neurotoxic Alkaloids: Saxitoxin and Its Analogs. Mar. Drugs 2010, 8, 2185–2211. [Google Scholar] [CrossRef]
- Boundy, M.J.; Selwood, A.I.; Harwood, D.T.; McNabb, P.S.; Turner, A.D. Development of a sensitive and selective liquid chromatography-mass spectrometry method for high throughput analysis of paralytic shellfish toxins using graphitised carbon solid phase extraction. J. Chromatogr. A 2015, 1387, 1–12. [Google Scholar] [CrossRef]
- Scientific Opinion of the Panel on Contaminants in the Food Chain on a request from the European Commission on Marine Biotoxins in Shellfish – Saxitoxin Group. EFSA J. 2009, 1019, 1–76.
- OPCW. Annex on Chemicals. Available online: https://www.opcw.org/chemical-weapons-convention/annexes/annex-chemicals/annexchemicals.
- Gawankar, S.; Masten, S.J.; Lahr, R.H. Review of the occurrence, treatment technologies, and detection methods for saxitoxins in freshwaters. J. Water Health 2024, 22, 1472–1490. [Google Scholar] [CrossRef]
- Cestèle, S.; Catterall, W.A. Molecular mechanisms of neurotoxin action on voltage-gated sodium channels. Biochimie 2000, 82, 883–892. [Google Scholar] [CrossRef]
- Zhang, F.; Xu, X.X.; Li, T.T.; Liu, Z.H. Shellfish Toxins Targeting Voltage-Gated Sodium Channels. Mar. Drugs 2013, 11, 4698–4723. [Google Scholar] [CrossRef]
- Knutsen, H.K.; Alexander, J.; Barregård, L.; Bignami, M.; Bruschweiler, B.; Ceccatelli, S.; Cottrill, B.; Dinovi, M.; Edler, L.; Grasl-Kraupp, B.; et al. Risks for public health related to the presence of tetrodotoxin (TTX) and TTX analogues in marine bivalves and gastropods. EFSA J. 2017, 15. [Google Scholar] [CrossRef]
- Wekell, J.C.; Hurst, J.; Lefebvre, K.A. The origin of the regulatory limits for PSP and ASP toxins in shellfish. J. Shellfish Res. 2004, 23, 927–930. [Google Scholar]
- Turner, A.D.; Dhanji-Rapkova, M.; Algoet, M.; Suarez-Isla, B.A.; Cordova, M.; Caceres, C.; Murphy, C.J.; Casey, M.; Lees, D.N. Investigations into matrix components affecting the performance of the official bioassay reference method for quantitation of paralytic shellfish poisoning toxins in oysters. Toxicon 2012, 59, 215–230. [Google Scholar] [CrossRef]
- Van Dolah, F.M.; Fire, S.E.; Leighfield, T.A.; Mikulski, C.M.; Doucette, G.J. (Eds.) Determination of Paralytic Shellfish Toxins in Shellfish by Receptor Binding Assay: Collaborative Study. In J. AOAC Int.; 2012; Volume 95, pp. 795–812. [Google Scholar]
- Usleber, E.; Donald, M.; Straka, M.; Märtlbauer, E. Comparison of enzyme immunoassay and mouse bioassay for determining paralytic shellfish poisoning toxins in shellfish. Food Addit. Contam. 1997, 14, 193–198. [Google Scholar] [CrossRef]
- Micheli, L.; Di Stefano, S.; Moscone, D.; Palleschi, G.; Marini, S.; Coletta, M.; Draisci, R.; Quadri, F.D. Production of antibodies and development of highly sensitive formats of enzyme immunoassay for saxitoxin analysis. Anal. Bioanal. Chem. 2002, 373, 678–684. [Google Scholar] [CrossRef]
- Wharton, R.E.; Feyereisen, M.C.; Gonzalez, A.L.; Abbott, N.L.; Hamelin, E.I.; Johnson, R.C. Quantification of saxitoxin in human blood by ELISA. Toxicon 2017, 133, 110–115. [Google Scholar] [CrossRef]
- Huang, X.; Hsu, K.H.; Chu, F.S. Direct competitive enzyme-linked immunosorbent assay for saxitoxin and neosaxitoxin. J. Agric. Food Chem. 1996, 44, 1029–1035. [Google Scholar] [CrossRef]
- Buckley, L.J.; Ikawa, M.; Sasner, J.J., Jr. Isolation of Gonyaulax tamarensis toxins from soft shell clams (Mya arenaria) and a thin-layer chromatographic-fluorometric method for their detection. J. Agric. Food Chem. 1976, 24, 107–111. [Google Scholar] [CrossRef]
- Keyon, A.S.A.; Guijt, R.M.; Gaspar, A.; Kazarian, A.A.; Nesterenko, P.N.; Bolch, C.J.; Breadmore, M.C. Capillary electrophoresis for the analysis of paralytic shellfish poisoning toxins in shellfish: Comparison of detection methods. Electrophoresis 2014, 35, 1496–1503. [Google Scholar] [CrossRef]
- Oshima, Y. Postcolumn Derivatization Liquid Chromatographic Method for Paralytic Shellfish Toxins. J. AOAC Int. 1995, 78, 528–532. [Google Scholar] [CrossRef]
- Dean, K.J.; Hatfield, R.G.; Turner, A.D. Performance Characteristics of Refined LC–FLD and HILIC–MS/MS Methods for the Determination of Paralytic Shellfish Toxins in Shrimp, Whelk, and Crab. J. AOAC Int. 2021, 104, 1022–1035. [Google Scholar] [CrossRef]
- Lawrence, J.F.; Niedzwiadek, B.; Menard, C. (Eds.) Quantitative Determination of Paralytic Shellfish Poisoning Toxins in Shellfish Using Prechromatographic Oxidation and Liquid Chromatography with Fluorescence Detection: Collaborative Study. In J. AOAC Int.; 2005; Volume 88, pp. 1714–1732. [Google Scholar]
- Lawrence, J.F.; Wong, B.; Menard, C. Determination of decarbamoyl saxitoxin and its analogues in shellfish by prechromatographic oxidation and liquid chromatography with fluorescence detection. J. AOAC Int. 1996, 79, 1111–1115. [Google Scholar] [CrossRef]
- Dell’Aversano, C.; Hess, P.; Quilliam, M.A. Hydrophilic interaction liquid chromatography-mass spectrometry for the analysis of paralytic shellfish poisoning (PSP) toxins. J. Chromatogr. A 2005, 1081, 190–201. [Google Scholar] [CrossRef]
- Turner, A.D.; McNabb, P.S.; Harwood, D.T.; Selwood, A.I.; Boundy, M.J. Single-Laboratory Validation of a Multitoxin Ultra-Performance LC-Hydrophilic Interaction LC-MS/MS Method for Quantitation of Paralytic Shellfish Toxins in Bivalve Shellfish. J. AOAC Int. 2015, 98, 609–621. [Google Scholar] [CrossRef]
- Zhuo, L.Y.; Yin, Y.C.; Fu, W.S.; Qiu, B.; Lin, Z.Y.; Yang, Y.Q.; Zheng, L.M.; Li, J.R.; Chen, G.N. Determination of paralytic shellfish poisoning toxins by HILIC-MS/MS coupled with dispersive solid phase extraction. Food Chem. 2013, 137, 115–121. [Google Scholar] [CrossRef]
- Liang, L.H.; Li, C.Z.; Fang, J.J.; Li, H.; Wu, S.M.; Zhao, J.Q.; Li, J.X.; He, K.; Dong, F.T. An integrated screening method for paralytic shellfish toxins and their analogues based on fragmentation characteristics using an orbitrap-based ultrahigh-performance liquid chromatography-high-resolution mass spectrometry. Food Chem. 2024, 434. [Google Scholar] [CrossRef]
- Ochi, N. Simultaneous determination of ten paralytic shellfish toxins and tetrodotoxin in scallop and short-necked clam by ion-pair solid-phase extraction and hydrophilic interaction chromatography with tandem mass spectrometry. J. Chromatogr. A 2021, 1651. [Google Scholar] [CrossRef]
- Quilliam, M.A.; Janeček, M.; Lawrence, J.F. Characterization of the oxidation products of paralytic shellfish poisoning toxins by liquid chromatography/mass spectrometry. Rapid Commun. Mass Spectrom. 1993, 7, 482–487. [Google Scholar] [CrossRef]
- Bates, H.A.; Rapoport, H. A chemical assay for saxitoxin, the paralytic shellfish poison. J. Agric. Food Chem. 1975, 23, 237–239. [Google Scholar] [CrossRef]
- Gallo, P.; Lambiase, S.; Duro, I.; Esposito, M.; Pepe, A. Paralytic Shellfish Poisoning (PSP) Toxins in Bivalve Molluscs from Southern Italy Analysed by Liquid Chromatography Coupled with High-Resolution Mass Spectrometry (UHPLC-HRMS/MS). Toxins 2024, 16. [Google Scholar] [CrossRef]
- Smith, Z.J.; Arlinghaus, K.M.; Boyer, G.L.; Hapeman, C.J. A Fresh Perspective on Cyanobacterial Paralytic Shellfish Poisoning Toxins: History, Methodology, and Toxicology. Mar. Drugs 2025, 23. [Google Scholar] [CrossRef]
- Gago-Martínez, A.; Moscoso, S.A.; Martins, J.M.L.; Vázquez, J.A.R.; Niedzwiadek, B.; Lawrence, J.F. Effect of pH on the oxidation of paralytic shellfish poisoning toxins for analysis by liquid chromatography. J. Chromatogr. A 2001, 905, 351–357. [Google Scholar] [CrossRef]
Figure 1.
Chemical structures of 14 kinds of paralytic shellfish toxins (PSTs), grouped by charge state. TEF:Toxicity Equivalence Factor.
Figure 1.
Chemical structures of 14 kinds of paralytic shellfish toxins (PSTs), grouped by charge state. TEF:Toxicity Equivalence Factor.
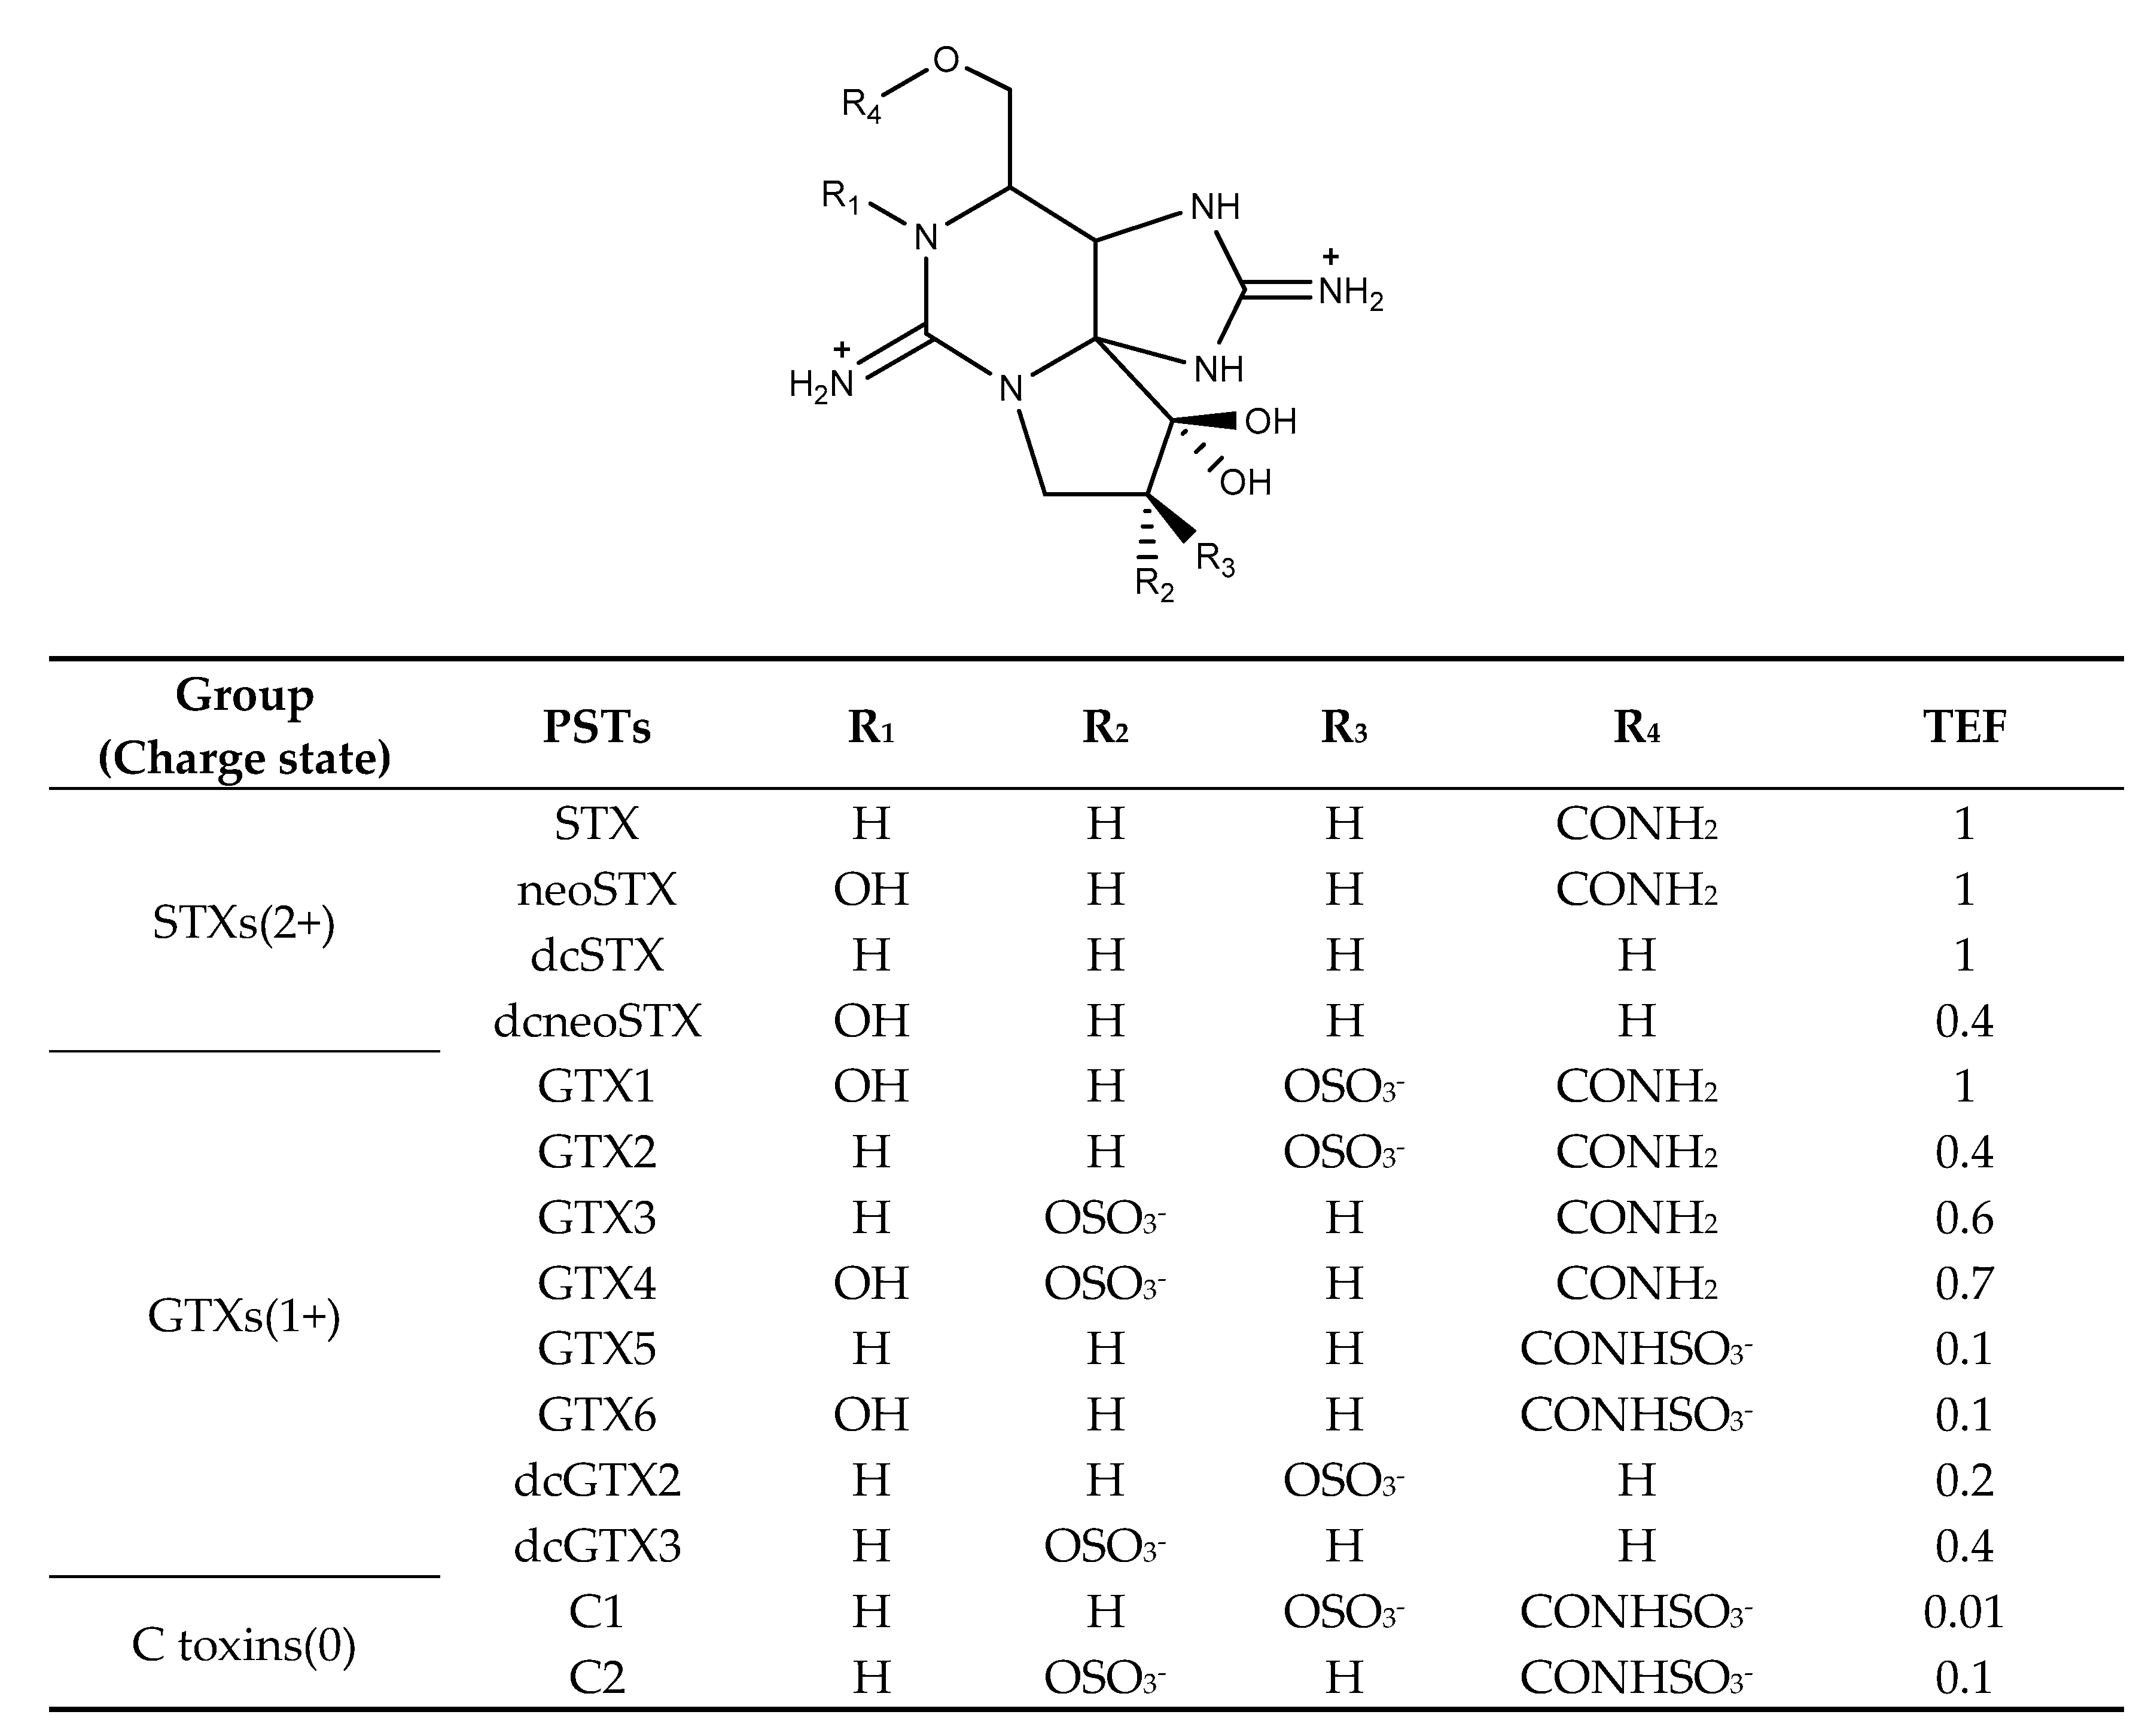
Figure 2.
TICs from HPLC−MS/HRMS of STX (A), dcSTX (B), neoSTX (C), dcneoSTX (D), GTX1/4 (E), GTX2/3 (F), GTX5(G), GTX6 (H), dcGTX2/3 (I), and C1/2 (J) reference solution after vanadium pentoxide oxidation.
Figure 2.
TICs from HPLC−MS/HRMS of STX (A), dcSTX (B), neoSTX (C), dcneoSTX (D), GTX1/4 (E), GTX2/3 (F), GTX5(G), GTX6 (H), dcGTX2/3 (I), and C1/2 (J) reference solution after vanadium pentoxide oxidation.
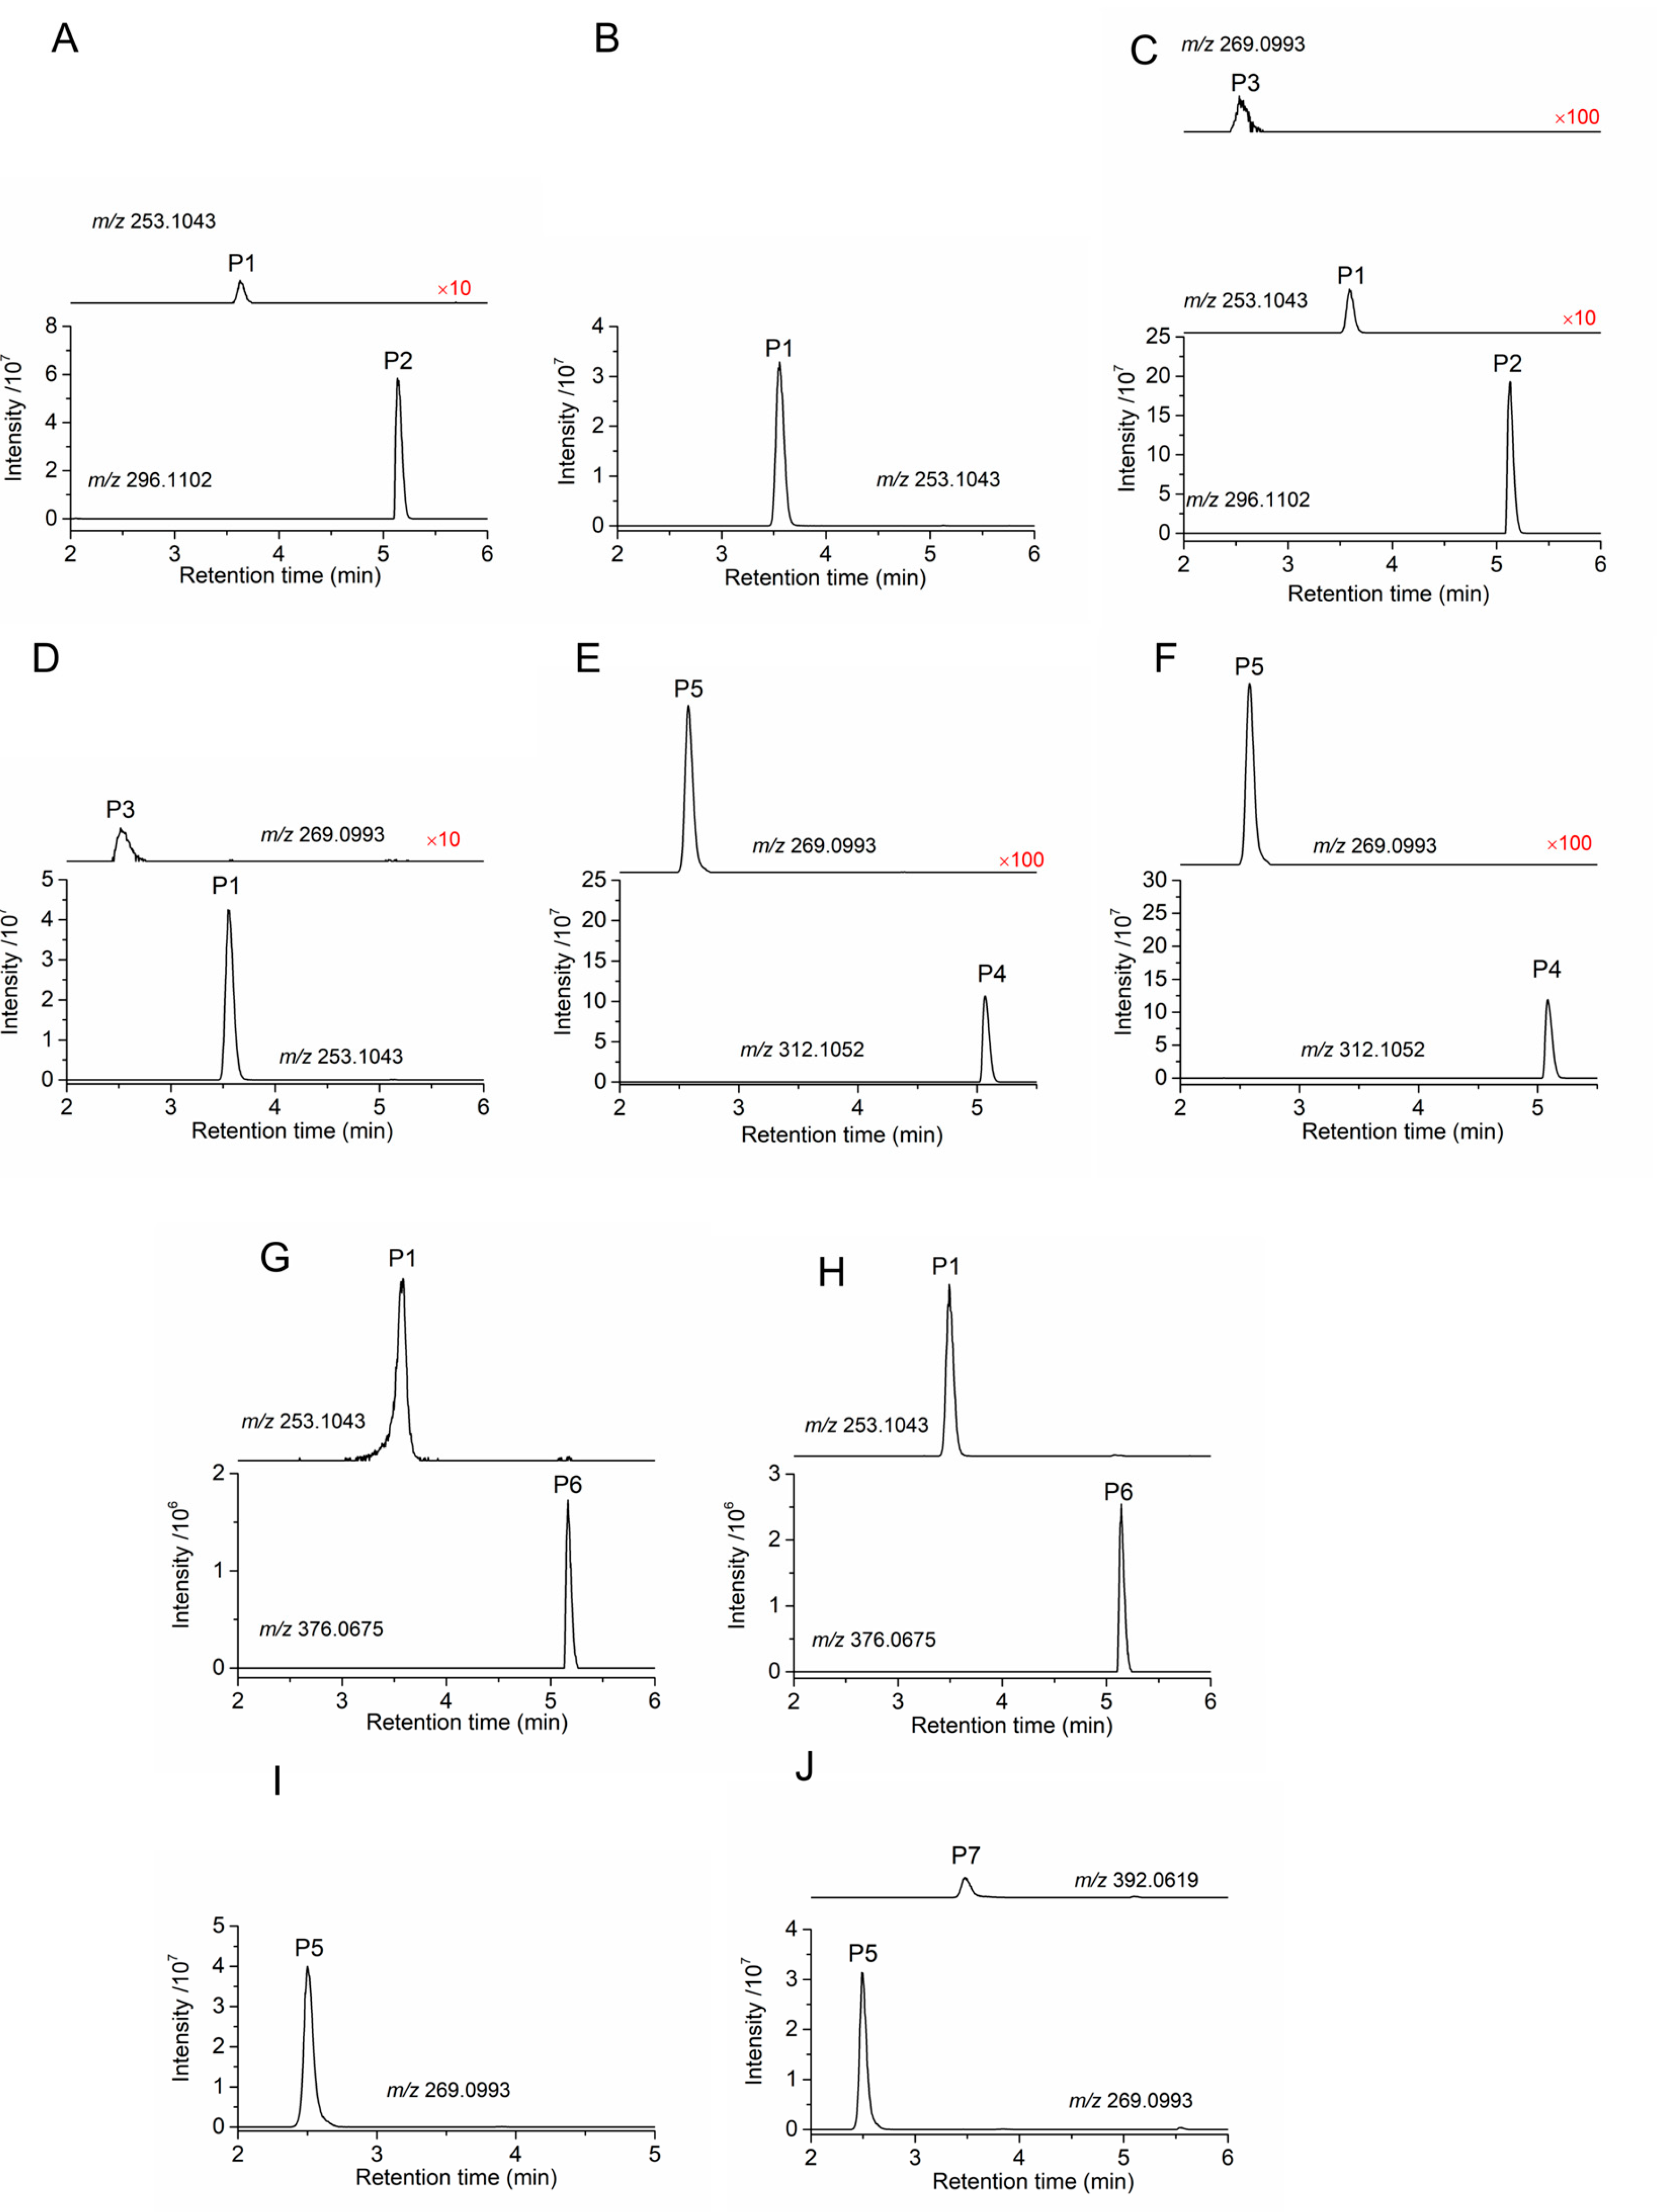
Figure 3.
Optimization of reaction temperature (A) and reaction time (B) for STX, GTX1/4 and GTX5 in vanadium pentoxide oxidation reaction.
Figure 3.
Optimization of reaction temperature (A) and reaction time (B) for STX, GTX1/4 and GTX5 in vanadium pentoxide oxidation reaction.
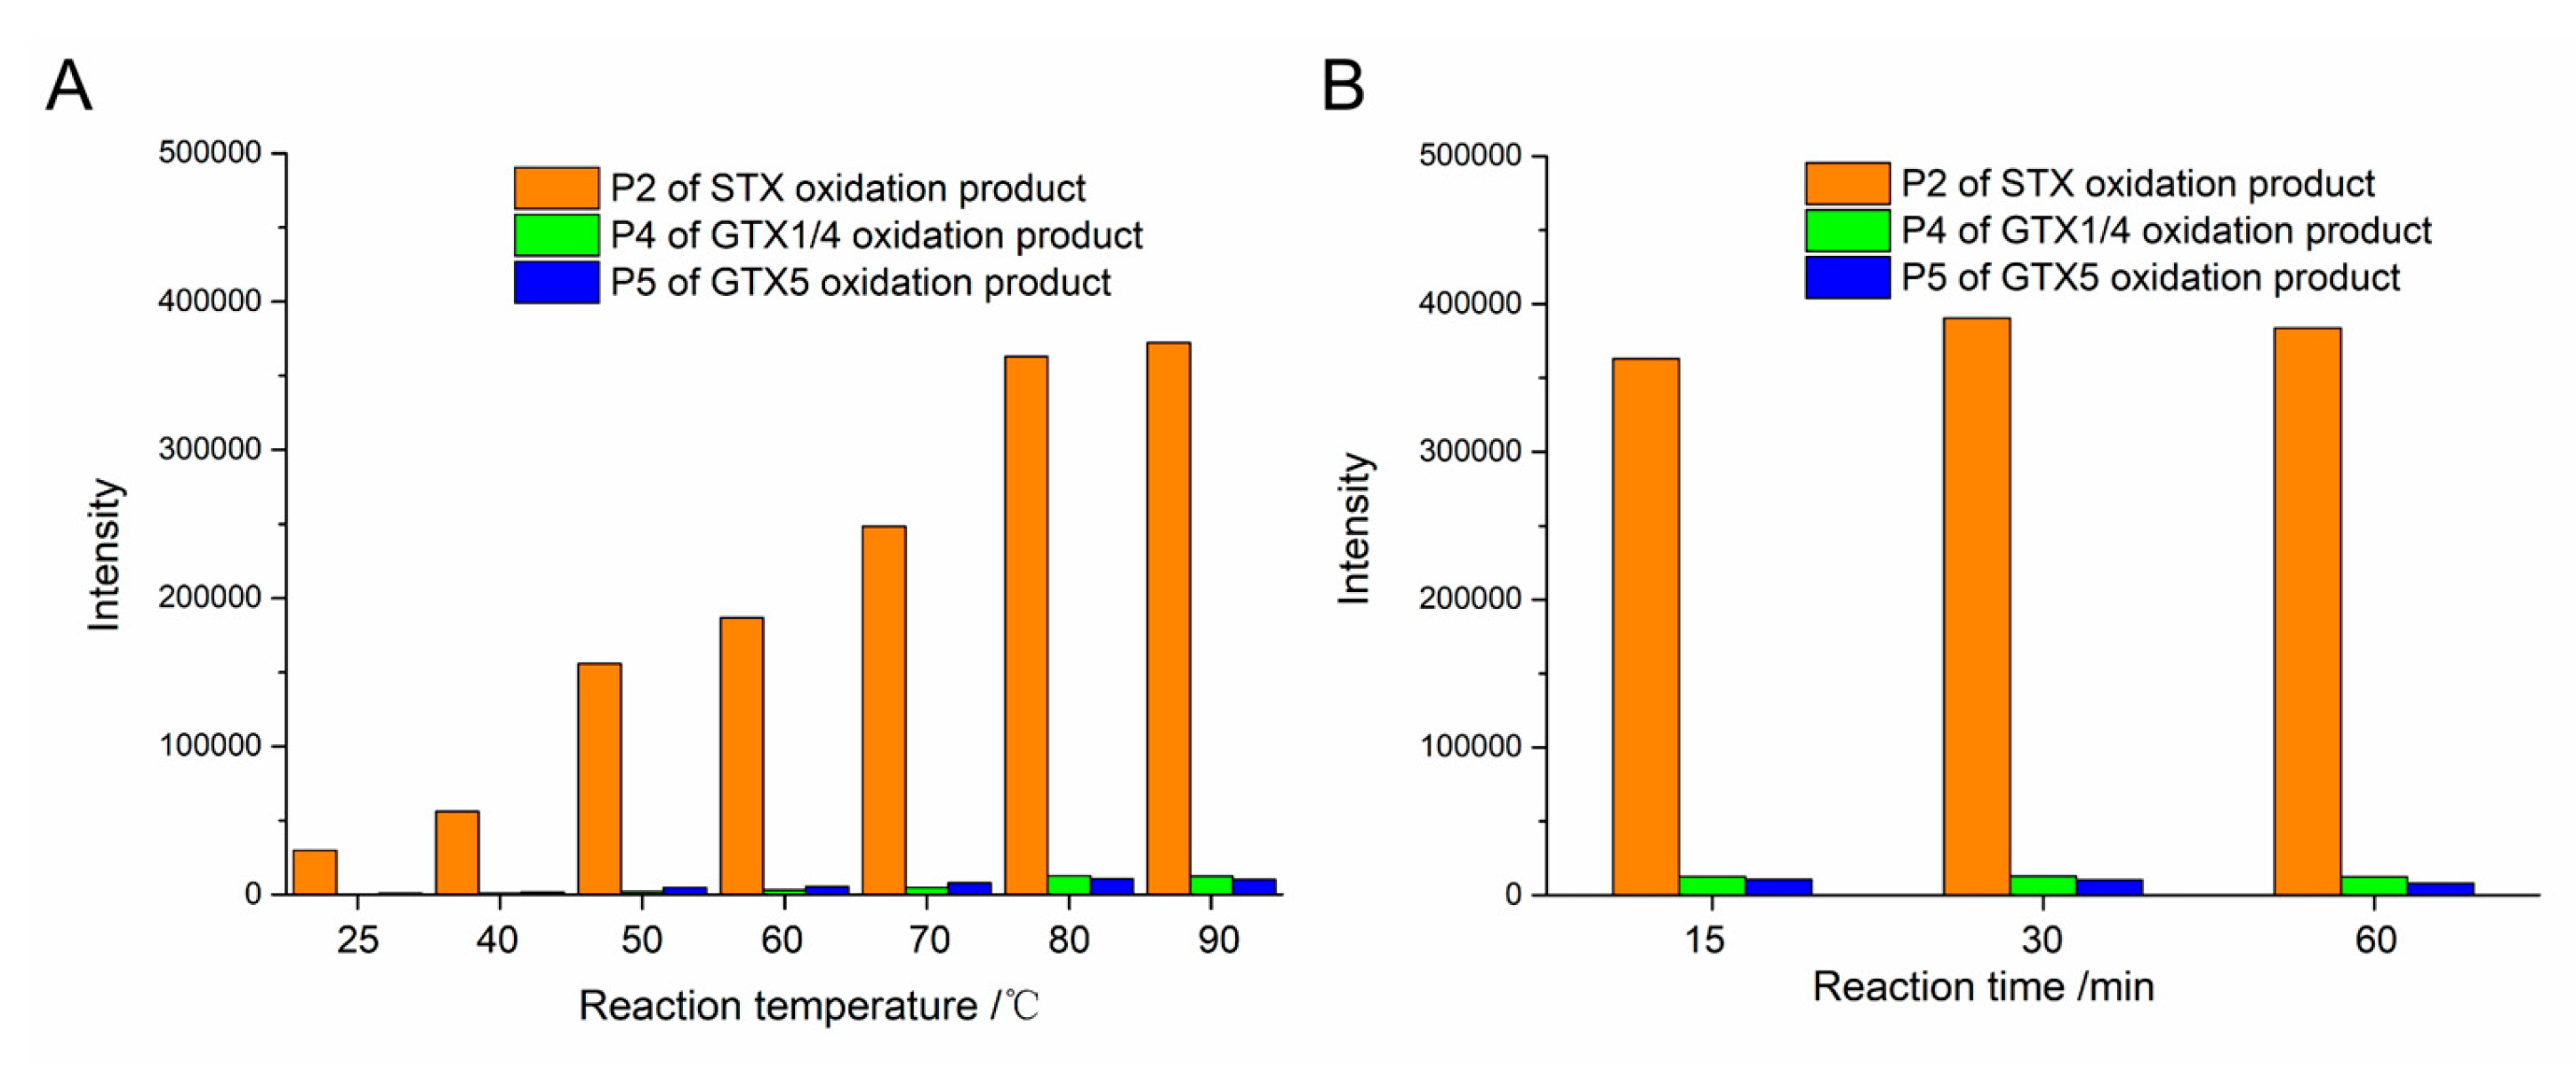
Figure 4.
The HPLC-MS/MS (MRM) analysis of six samples from the First Trial OPCW Biotoxin PT after oxidation by vanadium pentoxide.
Figure 4.
The HPLC-MS/MS (MRM) analysis of six samples from the First Trial OPCW Biotoxin PT after oxidation by vanadium pentoxide.
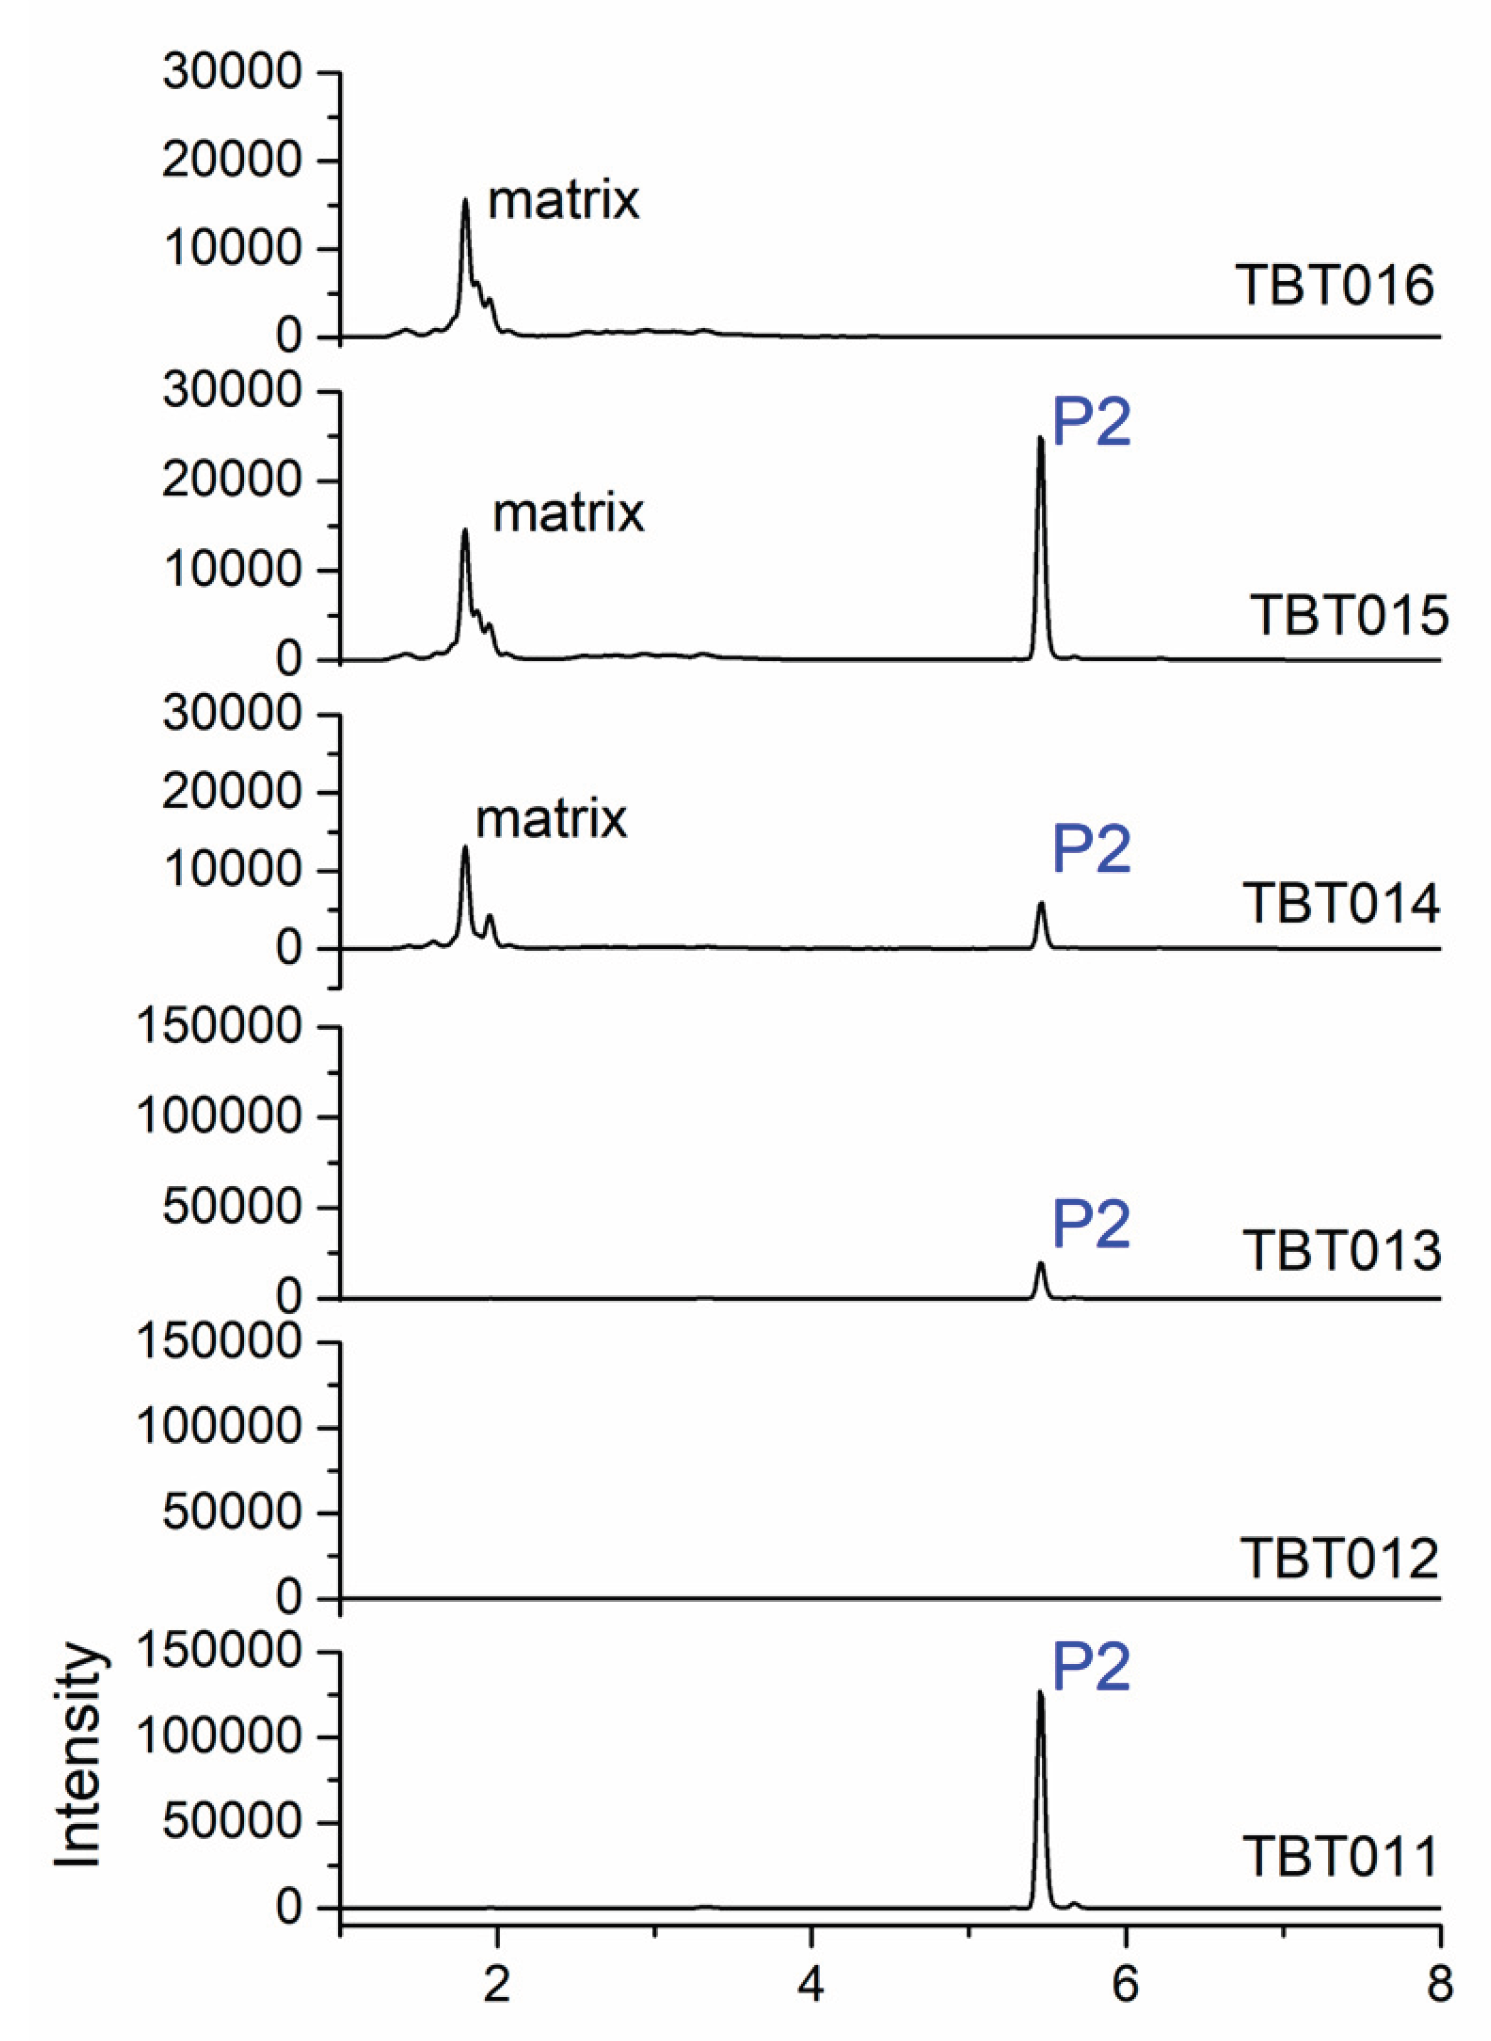

Table 1.
Linear dynamic ranges, calibration curves, LODs and accuracy (intra- and inter-day) of PSTs based on vanadium pentoxide oxidation and HPLC-MS/MS analysis.
Table 1.
Linear dynamic ranges, calibration curves, LODs and accuracy (intra- and inter-day) of PSTs based on vanadium pentoxide oxidation and HPLC-MS/MS analysis.
| Analytes | Regression equation | Correlation coefficient (r2) | Linear ranges ng/mL |
LOD (ng/mL) |
LOQ (ng/mL) |
Accuracy/RSD Intra-day (n=6) |
Accuracy/RSD Inter-day (n=4) |
||
|---|---|---|---|---|---|---|---|---|---|
| LOQ | 50 ng/mL | LOQ | 50 ng/mL | ||||||
| STX | y=6849x+312 | 0.9986 | 0.1~50 | 0.3 | 1.0 | 96.6/0.4 | 100.3/5.4 | 99.8/4.5 | 96.5/0.3 |
| dcSTX | y=6377x+254 | 0.9958 | 0.2~50 | 0.3 | 1.0 | 96.6/0.9 | 94.5/9.8 | 99.4/4.0 | 101.4/8.7 |
| neoSTX | y=7496x+341 | 0.9996 | 0.1~50 | 0.3 | 1.0 | 94.7/5.6 | 96.2/3.6 | 96.5/2.6 | 93.6/6.2 |
| dcneoSTX | y=3370x+159 | 0.9999 | 0.2~50 | 0.3 | 1.0 | 93.5/4.7 | 94.2/0.6 | 97.2/5.2 | 93.8/9.3 |
| GTX1/4 | y=528x+107 | 0.9999 | 0.5~75 | 1.0 | 3.0 | 91/3.7 | 95.6/0.9 | 98.1/10 | 95/6.9 |
| GTX2/3 | y=510+12 | 0.9995 | 0.5~75 | 1.0 | 3.0 | 92.6/0.6 | 102.2/8.1 | 100/10.4 | 91.9/2.4 |
| GTX5 | y=573x+16 | 0.9989 | 0.5~50 | 0.5 | 1.5 | 96/3.3 | 97.7/2.2 | 97.9/2.8 | 96.1/3.6 |
| GTX6 | y=391x+241 | 0.9984 | 0.5~75 | 0.5 | 1.5 | 93.2/3.2 | 101.9/7.7 | 102.6/9.1 | 96.4/2.6 |
| dcGTX2/3 | y=156x+30 | 0.9998 | 0.5~75 | 1.0 | 3.0 | 96.3/7.9 | 90.4/1.6 | 94.9/2.0 | 89.3/5.1 |
| C1/2 | y=123x+143 | 0.9967 | 0.5~75 | 1.5 | 5.0 | 100.6/4.9 | 98.2/7.5 | 103.4/3.9 | 92.9/8.6 |
Disclaimer/Publisher’s Note: The statements, opinions and data contained in all publications are solely those of the individual author(s) and contributor(s) and not of MDPI and/or the editor(s). MDPI and/or the editor(s) disclaim responsibility for any injury to people or property resulting from any ideas, methods, instructions or products referred to in the content. |
© 2026 by the authors. Licensee MDPI, Basel, Switzerland. This article is an open access article distributed under the terms and conditions of the Creative Commons Attribution (CC BY) license (http://creativecommons.org/licenses/by/4.0/).
Copyright: This open access article is published under a Creative Commons CC BY 4.0 license, which permit the free download, distribution, and reuse, provided that the author and preprint are cited in any reuse.