

Submitted:
18 August 2026
Posted:
20 August 2026
You are already at the latest version
Abstract
In natural, continuous sport settings, it remains unclear how athletes use an existing motor schema to parameterize an already learned skill for a new target and how subsequent actions are organized once outcome information becomes available. This study examined initial parameterization after landing-location change and prior-outcome associations with the immediately subsequent serve during continuous table-tennis serving. Twelve male athletes completed the serving task together with task-switching, stop-change, and N-back tasks. Three-dimensional movements were recorded using VICON motion capture, and trial-level generalized estimating equations modeled binary hit outcome and seven kinematic deviations from individualized stable-serving templates. In Stage 1, hit probability was lower under Target change than Target maintenance. Temporal-phasing deviation showed a stronger negative association with hit probability under Target change, suggesting that relative timing was particularly relevant to initial parameterization. Longer training duration was associated with smaller temporal-phasing deviation, while the association between change-trial accuracy and hit probability varied by target context. In Stage 2, a successful t0 outcome was associated with a higher probability of a t1 hit. Although t0 outcome was not consistently associated with t1 kinematic deviations themselves, the associations of t1 temporal-phasing and elbow-velocity deviations with hit probability differed according to the preceding outcome. Training duration and change-trial accuracy were also associated with smaller t1 temporal-phasing and elbow-velocity deviations, respectively. Overall, the findings support initial schema-based parameterization after landing-location change and provide partial observational evidence for prior-outcome associations with next-trial organization.
Keywords:
table tennis
; motor control
; schema theory
; target change
; temporal phasing
; cognitive control
1. Introduction
Skilled sport performance requires both the stability to reproduce a well-learned movement and the flexibility to adapt that movement when the action goal changes (Bernstein, 1967; Schmidt, 1975; Newell, 1986). In many sport skills, adaptation does not require switching to an entirely different movement. Instead, athletes often need to preserve the overall structure of an established skill while respecifying parameters such as movement direction, force, racket orientation, and timing (Schmidt, 1975; Diedrichsen & Kornysheva, 2015). However, it remains unclear how such reparameterization is achieved in continuous sport actions, where changing task demands must be accommodated within an ongoing sequence of skilled performance. This issue is particularly important because controlled laboratory tasks have provided much of the evidence on motor adaptation, whereas sport-specific settings place adaptation within natural movement goals, whole-body coordination, and task-specific timing demands (Carius et al., 2024).
Schema theory provides a useful framework for this question. According to Schmidt’s schema theory, skilled actions are guided by generalized relationships among initial conditions, intended outcomes, movement parameters, sensory consequences, and actual outcomes, rather than by a separate fixed motor program for every possible situation (Schmidt, 1975). Although schema theory is a classic account, recent discussions of human motor skill learning continue to emphasize that skilled behavior involves generalized action structures, anticipated sensory consequences, and the use of outcome information to refine later performance (Singh et al., 2023). When an action goal is specified, the recall schema supports parameter selection before execution, whereas the recognition schema supports evaluation after the movement. This distinction is particularly relevant to table-tennis serving. Each serve is self-initiated, and the required landing location is known before movement onset. A single serve can therefore be regarded as a largely open-loop execution in which key parameters must be specified before the action is launched (Rosenbaum, 1980; Schmidt, 1975). Across repeated serves, however, the athlete can use the result of one attempt to maintain or adjust the parameter configuration of the next attempt (Shadmehr & Krakauer, 2008; Wolpert et al., 2011). Continuous serving with landing-location changes therefore allows two aspects of schema-guided adaptation to be examined: initial parameterization before target-specific feedback is available, and early regulation after outcome information becomes available.
The first executed serve after a landing-location change provides the primary window into initial parameterization. At this point, the athlete knows the new landing location but has not yet received outcome information from a serve executed toward that location in the current sequence. Performance on this trial therefore reflects the flexibility and precision with which an established motor schema can be used to configure the same serving action for a new target. If the selected parameters are not well matched to the new landing location, hit probability should decrease relative to target maintenance. This decrease is not treated here as a generic task-switching cost, because the athlete continues to perform the same serve type. Rather, it is interpreted as a cost of parameterizing that serve for a new landing location. Because hit outcome alone cannot indicate which part of the parameter configuration was poorly specified, kinematic deviations from each athlete’s stable serving template were used to characterize movement organization. This approach is consistent with the idea that the same task outcome can arise from different combinations of movement variables (Todorov & Jordan, 2002; Shmuelof et al., 2012).
Among the kinematic measures, temporal-phasing deviation was treated as the focal candidate because skilled actions depend not only on isolated movement amplitudes or velocities, but also on the temporal organization of movement elements (Schmidt, 1975; Diedrichsen & Kornysheva, 2015). In the present task, temporal-phasing deviation indexed the departure of peak racket speed timing from an athlete-, serve-type-, and landing-location-specific stable template. It should therefore be interpreted as a measure of relative event timing within the serving movement, rather than as an exact measure of ball–racket contact timing. In schema terms, temporal phasing provides an observable index of timing parameterization. We therefore expected temporal-phasing deviation to show a stronger negative association with hit probability after a landing-location change than during target maintenance.
After the first execution under a new landing location, outcome information becomes available. A successful attempt may indicate that the current parameter configuration can be maintained, whereas an unsuccessful attempt may indicate that further adjustment is needed. The immediately subsequent serve to the same landing location therefore provides a secondary observational window into early regulation after feedback. Because the outcome of the first attempt was naturally occurring rather than experimentally manipulated, this analysis was interpreted as an adjacent-trial association rather than as causal evidence for feedback-based adaptation.
Training duration and cognitive indicators were examined as secondary correlates of behavioral and kinematic performance. Longer sport-specific training may reflect more extensive calibration between target demands and movement parameters, and may therefore support more precise use of the motor schema (Schmidt, 1975; Ericsson et al., 1993; Diedrichsen & Kornysheva, 2015). Change-trial accuracy from the stop-change task was considered the most relevant cognitive indicator because it reflects the ability to replace an initially prepared response with an alternative response (Logan & Cowan, 1984; Verbruggen & Logan, 2008; Verbruggen et al., 2019). This operation has a closer correspondence with the target-change demand in the serving task than do the other cognitive indicators. Stopping speed, working-memory load cost, and task-switching cost were therefore included as comparison indicators of related but less directly matched control processes (Miyake et al., 2000; Monsell, 2003; Owen et al., 2005; Kiesel et al., 2010).
The present study addressed two main questions. First, we asked whether the first serve after a landing-location change reveals a cost of initial parameterization, and whether this cost is especially related to temporal-phasing deviation. We expected lower hit probability after landing-location change than during target maintenance, and expected temporal-phasing deviation to show a stronger negative association with hit probability after landing-location change. Second, we asked whether the outcome of this first target-change attempt was associated with performance and movement organization on the immediately subsequent attempt to the same landing location. This second question was treated as a secondary observational analysis of early regulation after outcome information became available. Finally, training duration and cognitive indicators were examined as secondary correlates. We expected longer training duration and higher change-trial accuracy to provide preliminary individual-difference evidence related to target-change performance and movement organization.
2. Methods
2.1. Participants
Twelve male, right-handed table-tennis athletes participated in the study. All participants had long-term formal training experience in table tennis and were actively engaged in systematic practice at the time of testing. They were 21–31 years old (M = 23.92, SD = 3.18), with 10.00–22.83 years of training experience (M = 14.35, SD = 3.67). Recruitment was constrained by the availability and training schedules of experienced table-tennis athletes and by the resource-intensive protocol involving synchronized VICON motion capture, repeated serving trials, and three cognitive tasks; sample size was therefore determined by feasibility. All 12 participants completed the continuous serving motion-capture task, task-switching task, stop-change task, and N-back task, and reported their age and training duration. The resulting sample was comparable in scale to those used in intensive repeated-measures kinematic studies of competitive table-tennis players (Iino et al., 2008, 2017; Malagoli Lanzoni et al., 2018; Bańkosz & Winiarski, 2020). Participant demographics, training background, serving performance, and cognitive indicators are presented in Supplementary Table S1. All participants provided written informed consent before testing. The study protocol was reviewed and approved in 2024 by the Ethics Committee of Shanghai University of Sport (No. 102772024RT032) and was conducted in accordance with the Declaration of Helsinki.
2.2. Study Design and Procedure
A within-participant continuous serving design was used to examine how athletes adapted their serving performance when the required landing location changed. The serving task and target-change manipulation are summarized in Figure 1a. Each athlete first completed the table-tennis serving task with landing-location changes, followed on the same day by the task-switching, stop-change, and N-back tasks, with approximately 5 min of rest between tasks. For each serve, the required serve type, landing location, hit outcome, and three-dimensional movement trajectories were recorded concurrently. The three cognitive tasks, shown with the other participant-level variables in Figure 1b, yielded four cognitive indicators: change-trial accuracy, stop-signal reaction time (SSRT), N-back load cost (Δd′), and task-switching cost based on the inverse efficiency score (ΔIES). Statistical analyses were organized around the two research questions shown in Figure 1c: initial parameterization after a landing-location change and adjacent-trial associations after outcome information became available. Detailed definitions and calculations of all indicators are provided in the Supplementary Methods.
2.3. Table-Tennis Serving Target-Change Task
Athletes stood near the center of the end line on one side of a standard table-tennis table and performed continuous serves toward designated landing areas on the opposite side of the table. Four serve types were used: forehand topspin serve, forehand backspin serve, backhand topspin serve, and backhand backspin serve. Forehand and backhand referred to the serving action type rather than to the athlete’s standing position; all athletes served from a central standing position.
Seven landing areas were marked near the far end line of the opposite table half. These areas were arranged from left to right across the table, with three areas on the left side, one around the midline, and three on the right side. Each landing area was approximately the size of an A4 sheet of paper (210 × 297 mm) and was outlined with white tape during testing. A serve was coded as a hit when the ball landed within the currently designated area, including the marked boundary. Serves landing outside this area were coded as misses. Hit outcome was recorded online as a binary trial-level variable (hit = 1, miss = 0). Throughout the analyses, hit probability refers to the model-estimated probability of a hit derived from the binary-outcome models.
The task was organized hierarchically by serve type and landing location. For each serve type, athletes completed the seven landing-location sequences before moving to the next serve type. Within each landing-location sequence, athletes repeatedly performed the same serve type toward the same designated landing area until they had accumulated eight successful serves. The required landing location was then changed, while the serve type remained the same. After all seven landing locations had been completed for one serve type, the next serve type began. Thus, the principal target-change manipulation concerned changes in landing location within the same serve type, rather than changes in the serving action itself.
Trial classification was based on the original behavioral trial order before excluding trials with incomplete kinematic data. For the first serve-type block, the first trial directed to the first landing location was coded as a block-start trial because it had no preceding trial. The corresponding first trials of the remaining three serve-type blocks were coded as serve-type transitions. For each subsequent landing location within a serve-type block, the first executed trial after the landing-location change was labeled t0 and classified as Target change. Trials following t0 within the same serve type and landing location were classified as Target maintenance until the athlete accumulated eight successful serves and moved to the next landing location. Serve-type transitions were coded separately because they involved a change in serving action as well as the start of a new set of landing-location sequences.
Importantly, t0 was defined by its position in the original trial sequence, not by whether the serve was successful and not by whether complete kinematic data were available. A t0 serve could therefore be either a hit or a miss. If the actual first trial after a landing-location change lacked valid kinematic data, that target-change event was excluded from analyses requiring t0 kinematics rather than redefining a later valid trial as t0. The immediately subsequent executed trial under the same serve type and landing location was labeled t1. Stage 2 included only adjacent transitions for which complete hit-outcome and kinematic data were available for both t0 and t1. Because athletes were required to accumulate eight successful serves before moving to the next landing location, a successful t0 represented only the first success under the new landing location and did not by itself trigger another landing-location change.
The cleaned dataset comprised 3,398 valid serves: 3,103 Target-maintenance trials, 247 Target-change trials, 12 block-start trials, and 36 serve-type-transition trials. Stage 1 included 3,350 trials with a defined target context. Stage 2 included 247 complete t0-to-t1 transitions. In all trial-level models, serve type and landing location were included as task-requirement covariates to account for differences in difficulty across serve actions and target areas.
2.4. Motion-Capture Recording and Kinematic Processing
Serving movements were recorded at 100 Hz using a VICON motion capture system (Vicon Motion Systems, Oxford, UK). Short gaps in the raw trajectories were reconstructed using cubic spline interpolation. The trajectories were then smoothed using a fourth-order zero-phase Butterworth low-pass filter with a 6-Hz cutoff frequency, consistent with the cutoff used in prior table-tennis motion-capture work (Iino et al., 2022). The continuous recordings were segmented into individual serves and matched to the corresponding serve type, landing location, and hit outcome records. Trial labels were assigned according to the original behavioral order before trials with incomplete kinematic data were excluded. Only trials with complete participant identifiers, serve type and landing location information, hit outcomes, racket trajectory anchors, and computable kinematic measures were retained for the trial-level analyses.
The segment end anchor of each serve was defined as the terminal frame of the retained movement segment. The median duration of the retained segments was approximately 1.18 s. At a sampling frequency of 100 Hz, each frame represented 10 ms. Temporal phasing was referenced to this segment end anchor and was interpreted as a relative timing index within the terminal part of the serving movement, rather than as an exact measure of ball and racket contact timing. The racket center was calculated as the frame-by-frame mean of the three-dimensional coordinates of four racket markers. Framewise velocity magnitudes of the racket, shoulder, elbow, and wrist were calculated as the Euclidean norm of the three dimensional displacement between consecutive frames divided by the sampling interval of 0.01 s. Racket tilt was calculated as the angle between the normal vector of the racket face and the vertical axis. Racket and wrist relative motion was operationalized as the magnitude of the difference between the framewise displacement vectors of the racket center and the wrist. Because the sampling interval was fixed at 0.01 s, this measure was linearly proportional to relative velocity (Cappozzo et al., 1995; Wu et al., 2005; Winter, 2009; Iino et al., 2008; Bańkosz et al., 2020).
Seven trial-level kinematic measures were extracted: temporal phasing, racket velocity, shoulder velocity, elbow velocity, wrist velocity, racket and wrist relative motion, and racket tilt. Temporal phasing was defined as the frame position of peak racket speed relative to the segment-end anchor within the final 21 frames of the retained movement segment, from 20 frames before the anchor through the anchor itself. This window corresponded to approximately 210 ms and was used to characterize event timing during the terminal serving segment. Racket and wrist relative motion was defined as the maximum value of the displacement-based proxy over the same window. Racket, shoulder, elbow, and wrist velocities were defined as the maximum corresponding framewise velocity magnitude across the entire retained segment. Racket tilt was defined as the maximum angle between the racket face normal vector and the vertical axis across the segment. Full equations and temporal windows for all measures are provided in the Supplementary Methods.
For each athlete, serve type, and landing location, an individualized stable-serving template was constructed using the mean value of each kinematic measure across successful Target-maintenance trials. Trial-level kinematic deviation was defined as the absolute difference between the observed value and the corresponding template mean. For temporal phasing specifically, temporal-phasing deviation quantified the extent to which the timing of peak racket speed departed from the athlete’s stable relative-timing pattern for the same serve type and landing location. Larger values therefore indicated greater departure from the athlete's stable movement pattern for the same serve type and landing location. All seven deviation measures were z-standardized before inferential analysis. To examine whether the results depended on the template definition, sensitivity analyses used three alternative templates. The first excluded the focal trial when constructing the template. The second excluded all reference trials from the continuous landing-location sequence containing the focal trial. The third was constructed from all Target-maintenance trials rather than successful Target-maintenance trials only. Kinematic deviations were recalculated under each definition.
2.5. Cognitive Tasks
The task-switching, stop-change, and N-back tasks yielded four cognitive indicators: change-trial accuracy, SSRT, N-back load cost, and task-switching cost. These indicators were used as secondary athlete-level variables because they varied between athletes rather than between trials.
The task-switching task assessed cognitive flexibility when switching between task rules or stimulus response mappings (Rogers & Monsell, 1995; Monsell, 2003; Kiesel et al., 2010). The formal task comprised 160 trials, including 128 repetition trials and 32 switch trials. The inverse efficiency score was calculated as the mean correct response time in each condition divided by the corresponding accuracy. Task-switching cost was calculated by subtracting repetition condition IES from switch condition IES, with larger values indicating greater performance cost when switching between task rules.
The stop-change task comprised go, stop, and change trials. It assessed response stopping and the implementation of an alternative response after interruption of the original response (Logan & Cowan, 1984; Verbruggen & Logan, 2008; Verbruggen et al., 2019). Each participant completed 200 trials, including 120 go trials, 40 stop trials, and 40 change trials. The stop-signal delay in stop and change trials was adjusted adaptively according to participant performance. SSRT was estimated using the integration method. The relevant percentile of the go response time distribution was determined from the probability of responding on stop trials, and the mean stop-signal delay was then subtracted. Go omissions were assigned the task response time limit of 1,000 ms. Change-trial accuracy was defined as the proportion of change trials on which the alternative response was implemented correctly.
The N-back task comprised 1-back and 2-back conditions and assessed the change in performance associated with increased working memory load. Each condition contained 80 trials, including 26 target trials and 54 non-target trials. Signal detection sensitivity, d′, was calculated from hit and false alarm rates (Stanislaw & Todorov, 1999), with extreme proportions corrected using the Hautus method (Hautus, 1995). N-back load cost was calculated as 1-back d′ minus 2-back d′, with larger values indicating a greater decline in discrimination sensitivity as working memory load increased.
All four cognitive indicators were z-standardized before inferential analysis. Prediction plots involving change-trial accuracy were displayed on its original proportional scale. Further details of all calculations are provided in the Supplementary Methods.
2.6. Statistical Analysis
2.6.1. General Analytic Strategy
Trial-level associations were estimated using generalized estimating equations, with athlete specified as the clustering unit to account for within-participant dependence among repeated observations (Liang & Zeger, 1986; Hanley et al., 2003). Binary hit outcome (hit = 1, miss = 0) was modeled using a binomial distribution with a logit link. Continuous kinematic deviations were modeled using a Gaussian distribution with an identity link. An exchangeable working correlation structure was specified, and standard errors were calculated using a robust sandwich estimator. Models report regression coefficients, 95% confidence intervals, and two-sided p values. For binary-outcome models, odds ratios (ORs) and their 95% confidence intervals are additionally reported, while model-estimated hit probabilities are presented where appropriate to facilitate interpretation on the response scale.
All primary models included age as a continuous covariate and serve type and landing location as categorical task-requirement covariates. Continuous predictors were z-standardized before modeling. In Stage 1, target context was effect-coded, with Target maintenance coded as -0.5 and Target change coded as +0.5. The main effect of a continuous predictor therefore represented its average association across the two contexts, whereas the predictor by target context interaction represented the difference between the two context-specific slopes. Because training duration and the cognitive indicators varied only between athletes, the independent information for these associations came from 12 athletes. These results were therefore interpreted as secondary evidence.
In Stage 2, a successful t0 outcome was coded as 1 and an unsuccessful t0 outcome as 0 in the core behavioral model. For models estimating conditional slopes after successful and unsuccessful t0 outcomes, the coding was adjusted so that the slope after a successful outcome could be estimated directly. Stage 2 analyses were treated as secondary analyses of associations between adjacent trials, because the study observed naturally occurring outcomes rather than experimentally manipulating feedback.
Parallel tests were corrected using the Benjamini and Hochberg false discovery rate procedure. Correction families were defined according to the study stage, predictor type, and outcome type. Tests that addressed the same research question were corrected within the same family. Single core hypothesis tests were not adjusted for multiple comparisons. Figures display unadjusted two-sided p values, whereas the main text and supplementary materials report the corresponding false-discovery-rate-adjusted q values. The size of each correction family is stated in the text. Complete correction families are described in the Supplementary Methods.
2.6.2. Stage 1: Initial Parameterization after Landing-Location Change
Stage 1 included 3,350 Target maintenance and Target change trials with a defined target context. Detailed trial classification and inclusion for both stages are reported in Supplementary Table S4. Target change was defined as the first executed trial after a landing-location change within the same serve type. Target maintenance trials were subsequent trials performed with the same serve type toward the same landing location. Trial labels were assigned from the original behavioral sequence before excluding trials with incomplete kinematic data. If the actual first trial after a landing-location change lacked valid kinematic data, that transition was excluded from analyses requiring t0 kinematics rather than redefining a later valid trial as t0.
First, hit outcome was modeled to estimate the difference in hit probability between Target maintenance and Target change. Separate models were fitted for each of the seven kinematic deviations. Each model included kinematic deviation, target context, and their interaction; the interaction tested whether the association between kinematic deviation and hit probability differed between Target maintenance and Target change.
Training duration and the four cognitive indicators were entered separately as athlete-level predictors in trial-level models. Behavioral models used binary hit outcome as the dependent variable and included each indicator, target context, and their interaction; effects were interpreted on the hit-probability scale. Kinematic models tested the association of each indicator with each of the seven kinematic deviations and whether these associations differed by target context.
2.6.3. Stage 2: Adjacent-Trial Associations After Outcome Information
Stage 2 included 247 complete t0-to-t1 transitions. The first executed trial after a landing-location change within the same serve type was labeled t0. The immediately subsequent executed trial under the same serve type and landing location was labeled t1. Stage 2 included only adjacent t0-to-t1 transitions with complete hit-outcome and kinematic data for both trials. Because athletes were required to accumulate eight successful serves before moving to the next landing location, a successful t0 did not by itself trigger another location change. Thus, t1 remained within the same serve type and landing location as t0.
Stage 2 examined associations across adjacent trials in three steps. First, observed t0 outcome (success vs. failure) was used to predict binary t1 hit outcome, and model estimates were expressed as the probability of a t1 hit. Second, t0 outcome was used to predict each of the seven t1 kinematic deviations. Each model adjusted for the corresponding kinematic deviation at t0, age, serve type, and landing location. The individualized kinematic templates used in Stage 2 were re-estimated after excluding the continuous landing-location sequence containing the focal transition. Third, we tested whether the association between t1 kinematic deviation and the probability of a t1 hit differed according to t0 outcome. Each model included t1 kinematic deviation, t0 outcome, and their interaction, with conditional associations between t1 kinematic deviation and t1 hit probability estimated separately following successful and unsuccessful t0 outcomes.
Training duration and the four cognitive indicators were entered separately into the Stage 2 behavioral and kinematic models. Behavioral models used binary t1 hit outcome as the dependent variable and included each athlete-level indicator, t0 outcome, and their interaction; effects were interpreted on the t1 hit-probability scale. Kinematic models tested the association of each indicator with the seven t1 kinematic deviations and whether these associations differed according to t0 outcome.
2.6.4. Sensitivity Analyses
Sensitivity analyses examined whether the results depended on the definition of the stable kinematic template and on selected model adjustment decisions. In Stage 1, the principal analyses were repeated using a leave-one-trial-out template, a leave-one-sequence-out template, and an alternative template constructed from all Target maintenance trials. Kinematic deviations were recalculated under each definition. Models involving training duration and the cognitive indicators were also re-estimated after additionally including temporal phasing deviation and its interaction with target context.
In Stage 2, an alternative template was constructed from all Target maintenance trials after excluding the continuous landing-location sequence containing the focal transition. The t0 and t1 kinematic deviations were then recalculated, and the behavioral, kinematic, and kinematic hit models were repeated. The kinematic hit models were also re-estimated after removing the corresponding athlete-level indicator and its interaction with t0 outcome. Complete unadjusted p values, q values adjusted for the false discovery rate, and sensitivity-analysis results are reported in the supplementary material.
3. Results
3.1. Initial Parameterization after Landing-Location Change
In Stage 1, Target change referred to the first executed serve after a landing-location change within the same serve type, whereas Target maintenance referred to subsequent serves to the same landing location. Model-estimated hit probability was lower under Target change than Target maintenance (64.8% versus 79.3%; Figure 2a). The GEE model confirmed an association between Target change and lower hit probability (logit β = −0.738, 95% CI [−1.105, −0.371], OR = 0.478, 95% CI [0.331, 0.690], p < .001).
Parallel analyses of the seven kinematic measures showed that the association between temporal-phasing deviation and hit probability differed by target context (interaction β = −0.277, 95% CI [−0.439, −0.115], p < .001, q = .006; Figure 2b). Temporal-phasing deviation indexed how far the timing of peak racket speed departed from the athlete’s stable template for the same serve type and landing location. Under Target maintenance, temporal-phasing deviation was not clearly associated with hit probability (β = 0.021, 95% CI [−0.114, 0.156], p = .759). Under Target change, greater temporal-phasing deviation was associated with lower hit probability (β = −0.256, 95% CI [−0.387, −0.124], p < .001). None of the remaining six kinematic measures showed a target-context interaction that remained statistically significant after false discovery rate correction (Supplementary Figure S1).
3.2. Individual Differences in Initial Parameterization
The association between training duration and hit probability differed by target context (interaction β = 0.238, 95% CI [0.026, 0.449], p = .028; Figure 3a). The conditional association between training duration and hit probability was not significant under either Target maintenance (β = −0.097, 95% CI [−0.327, 0.133], p = .410) or Target change (β = 0.141, 95% CI [−0.129, 0.411], p = .306). Longer training duration was also associated with smaller temporal-phasing deviation (β = −0.641, 95% CI [−0.826, −0.457], p < .001, q < .001; Figure 3b), and this association did not differ significantly by target context (interaction β = −0.081, p = .385, q = .588).
The association between change-trial accuracy and hit probability also differed by target context (interaction β = 0.357, 95% CI [0.138, 0.577], p = .001, q = .006; Figure 3c). Under Target maintenance, change-trial accuracy was not clearly associated with hit probability (β = 0.011, 95% CI [−0.159, 0.180], p = .902). Under Target change, higher change-trial accuracy was associated with higher hit probability (β = 0.368, 95% CI [0.066, 0.670], p = .017).
Within the 28-test family spanning four cognitive indicators and seven kinematic measures, change-trial accuracy showed a negative but non-significant association with temporal-phasing deviation (β = −0.382, 95% CI [−0.795, 0.030], p = .069, q = .161; Figure 3d). In the complete analysis of all seven kinematic measures, higher change-trial accuracy was associated with smaller elbow-velocity deviation (β = −0.245, 95% CI [−0.344, −0.145], p < .001, q < .001), although this association did not show an interaction with target context that remained statistically significant after false discovery rate correction (interaction β = −0.114, p = .020, q = .145; Supplementary Table S8). Figure 3 focuses on temporal phasing to align the participant-level results with the only kinematic measure whose association with hit probability differed by target context after false discovery rate correction in Stage 1; complete results for all seven measures are provided in Supplementary Table S8.
None of the other three cognitive indicators showed a target-context-specific association with hit probability that remained statistically significant after false discovery rate correction. In the kinematic analyses, the cross-context association between SSRT and temporal-phasing deviation remained statistically significant after false discovery rate correction within the family of 28 tests (β = 0.416, 95% CI [0.103, 0.728], p = .009, q = .037). Task-switching cost was positively associated with temporal phasing before correction, but the association did not remain statistically significant after false discovery rate correction (β = 0.213, 95% CI [0.001, 0.424], p = .048, q = .136). Together, these findings suggest that training duration was most clearly related to the stability of temporal organization, whereas change-trial accuracy was more closely related to successful performance after landing-location change. Complete Stage 1 hit-outcome results for the four cognitive indicators are presented in Supplementary Table S2; their associations with the seven kinematic deviations are reported in Supplementary Figure S1 and Supplementary Table S8.
3.3. Adjacent-Trial Associations after the First Target-Change Attempt
Across the 247 complete t0-to-t1 transitions, t1 hit probability was higher after a successful than after an unsuccessful t0 outcome (β = 0.943, 95% CI [0.175, 1.711], OR = 2.57, p = .016; Figure 4a). After adjustment for the corresponding t0 kinematic deviation, none of the seven direct associations between t0 outcome and t1 kinematic deviation survived false discovery rate correction (minimum q = .085; Supplementary Table S6). Thus, t0 outcome was associated with t1 hit probability, but no specific t1 kinematic deviation showed a difference according to the preceding outcome that survived false discovery rate correction.
3.4. Kinematic-Hit Associations and Secondary Correlates in Stage 2
The principal kinematic evidence in Stage 2 concerned whether the relationship between t1 kinematic deviation and t1 hit probability differed according to the preceding outcome. The association between t1 temporal-phasing deviation and hit probability differed by t0 outcome (interaction β = 1.138, 95% CI [0.244, 2.032], p = .013, q = .044; Figure 4b). Following a successful t0 outcome, the negative temporal-phasing slope was nominally significant before correction (β = −1.045, 95% CI [−1.942, −0.148], p = .022, q = .157). Following an unsuccessful outcome, the association was not significant (β = 0.093, 95% CI [−0.341, 0.527], p = .674, q = .871).
The association between t1 elbow-velocity deviation and hit probability also differed according to t0 outcome (interaction β = −0.785, 95% CI [−1.272, −0.299], p = .002, q = .011; Figure 4c). Following a successful outcome, elbow-velocity deviation was not clearly associated with t1 hit probability (β = 0.116, 95% CI [−0.242, 0.474], p = .526, q = .849). Following an unsuccessful outcome, greater elbow-velocity deviation was associated with lower t1 hit probability (β = −0.670, 95% CI [−1.018, −0.322], p < .001, q = .001). Thus, the behavioral relevance of next-trial temporal-phasing and elbow-velocity deviations depended on the preceding outcome, even though t0 outcome was not associated with a mean difference in either deviation that survived false discovery rate correction. Complete results for the seven kinematic-deviation–hit models are provided in Supplementary Table S5.
As secondary athlete-level analyses, we then examined associations of training duration and cognitive indicators with next-trial kinematics. Training duration was negatively associated with t1 temporal-phasing deviation following both successful and unsuccessful t0 outcomes. Following a successful outcome, the conditional slope was β = −0.197 (95% CI [−0.285, −0.108], p < .001, q < .001); following an unsuccessful outcome, the conditional slope was β = −0.445 (95% CI [−0.665, −0.226], p < .001, q < .001). The difference between these slopes did not remain statistically significant after false discovery rate correction across the seven kinematic measures (interaction β = −0.249, p = .016, q = .057; Figure 4d; Supplementary Table S7).
Within the 28-test family spanning four cognitive indicators and seven kinematic measures, change-trial accuracy was negatively associated with t1 elbow-velocity deviation following both outcomes. Following a successful outcome, the conditional slope was β = −0.224 (95% CI [−0.381, −0.066], p = .005, q = .050); following an unsuccessful outcome, the conditional slope was β = −0.251 (95% CI [−0.412, −0.090], p = .002, q = .015). The two slopes did not differ significantly (interaction β = −0.028, p = .712, q = .766; Figure 4e). Training duration and change-trial accuracy were therefore associated with next-trial temporal-phasing and elbow-velocity organization, respectively, but these associations did not differ significantly between successful and unsuccessful t0 outcomes after false discovery rate correction.
The conditional associations of training duration with t1 hit outcome following successful and unsuccessful t0 outcomes, and its interaction with t0 outcome, were all non-significant (p = .457, .824, and .619, respectively). The corresponding tests for the four cognitive indicators did not remain statistically significant after false discovery rate correction within the family of four tests (minimum q = .183). Complete results are presented in Supplementary Figure S3–S4.
3.5. Sensitivity Analyses
The Stage 1 temporal-phasing results were stable across alternative template definitions. After excluding the focal trial from its own template, both the cross-context association of temporal-phasing deviation (β = −0.113, 95% CI [−0.222, −0.005], p = .041) and its interaction with target context (β = −0.291, 95% CI [−0.456, −0.125], p < .001, q = .004) were retained. Results were similar when all reference trials from the landing-location sequence containing the focal trial were excluded: the cross-context association was β = −0.116 (95% CI [−0.222, −0.010], p = .032), and the target-context interaction was β = −0.289 (95% CI [−0.442, −0.135], p < .001, q = .002). This analysis retained all 3,350 trials. When the alternative template was constructed from all Target-maintenance trials, the cross-context slope remained negative but was not statistically significant (β = −0.110, p = .052), whereas its interaction with target context remained supported (β = −0.291, p < .001, q = .002; Supplementary Table S3). After further adjustment for temporal-phasing deviation and its interaction with target context, the training duration × target context and change-trial accuracy × target context associations were attenuated to p = .248 and p = .109, respectively (Supplementary Table S3).
The alternative-template analysis in Stage 2 retained all 247 adjacent transitions. When the template was constructed from all Target-maintenance trials after excluding the current landing-location sequence, the association between a successful t0 outcome and higher t1 hit probability was retained (β = 0.943, 95% CI [0.174, 1.712], OR = 2.57, p = .016), whereas none of the seven direct t0 outcome–t1 kinematic-deviation associations remained statistically significant after false discovery rate correction (minimum q = .067). The conditional associations of training duration with t1 temporal-phasing deviation following successful and unsuccessful outcomes were both retained (q < .001 for both). For change-trial accuracy and t1 elbow-velocity deviation, the failure-condition slope survived the 28-test cognitive correction (q = .028), whereas the success-condition slope did not (q = .072). Under the alternative template, greater elbow-velocity deviation remained associated with lower hit probability after unsuccessful outcomes (β = −0.621, q < .001), and the difference between successful and unsuccessful outcome conditions was retained (interaction β = −0.736, q = .028). Neither the temporal-phasing slope after successful outcomes nor its outcome interaction survived the seven-test correction under the alternative template (q = .631 and .276, respectively). Finally, after removing the corresponding athlete-level indicator and its interaction with t0 outcome from the primary-template models, both the temporal phasing × t0 outcome interaction (β = 1.103, q < .001) and the elbow velocity × t0 outcome interaction (β = −0.773, q = .006) were retained. Complete sensitivity-analysis results are provided in Supplementary Table S9.
4. Discussion
This study examined how athletes adapt an established table-tennis serve when the required landing location changes. Two aspects of schema-guided adaptation were considered: initial parameterization before outcome information from the new landing location was available, and adjacent-trial organization after the first outcome had been obtained. Stage 1 provided relatively clear evidence for initial parameterization: hit probability was lower after landing-location change than during target maintenance, and temporal-phasing deviation showed a stronger negative association with hit probability after landing-location change. Stage 2 provided more limited observational evidence: a successful t0 outcome was associated with higher t1 hit probability, and selected kinematic–hit associations differed according to the preceding outcome, but t0 outcome was not consistently associated with mean differences in t1 kinematic deviations. Training duration and change-trial accuracy were associated with different aspects of movement organization and were interpreted as secondary individual-difference evidence.
4.1. Initial Parameterization after Target Change
The first execution following a target change captures the point at which an established skill must first be configured for a newly specified goal. In the present study, hit probability was lower under Target change than under Target maintenance, despite athletes continuing to perform the same serve type. The resulting performance cost therefore cannot be readily attributed to switching between different skills. Instead, athletes had to retain the established serving action while respecifying the parameters required by a new landing location. Thus, the performance cost under Target change is more consistent with the demands of rapidly reparameterizing an established action for a new landing location than with switching between different skills.
This interpretation is consistent with schema theory, in which an acquired action can be adapted to different task demands through the specification of appropriate movement parameters (Schmidt, 1975). Experimental work on movement preparation likewise shows that advance information can support the specification of movement parameters before execution (Rosenbaum, 1980; Horn & Marchetto, 2021). Importantly, however, knowledge of the new landing location does not mean that an effective movement configuration has already been established for that target. Within this framework, t0 can therefore be interpreted as an initial schema-based parameterization window: the target is known, but outcome information from an execution toward that target is not yet available. Performance at t0 consequently provides a behavioral indication of how effectively an established action can be parameterized for the new landing location before target-specific outcome information can contribute to subsequent regulation.
The kinematic findings further indicate that this initial parameterization was particularly expressed in temporal organization. Among the seven kinematic deviations examined, temporal-phasing deviation was the only measure whose association with hit probability reliably differed between Target change and Target maintenance. Under Target maintenance, temporal-phasing deviation was not clearly related to hit probability, whereas under Target change, larger departures from the athlete-specific stable timing pattern were associated with lower hit probability. This pattern suggests that relative timing became particularly behaviorally relevant when the established serve had to be parameterized for a new landing location. This interpretation is consistent with previous evidence linking the temporal organization of movement to successful performance in table tennis and other goal-directed actions (Bootsma & van Wieringen, 1990; Cohen & Sternad, 2012). The absence of comparable context-dependent associations for the other kinematic deviations argues against a nonspecific disruption of movement execution and instead points to relative timing as a particularly informative dimension of initial parameterization.
4.2. Adjacent-Trial Organization after Outcome Information
Once the first execution toward the new landing location had been completed, the informational state of the task changed: athletes now had access to the outcome of an action performed under the current target requirement. In the present study, t1 hit probability was higher following a successful than an unsuccessful t0 outcome, indicating that performance across adjacent same-target trials was not independent. Within schema theory, movement outcome provides information for evaluating whether the recently selected parameter configuration was compatible with the intended goal (Schmidt, 1975). A successful outcome indicates that the current configuration was at least sufficient to satisfy the task requirement, whereas an unsuccessful outcome indicates that some mismatch remained. Importantly, however, t0 outcome was not consistently associated with any specific t1 kinematic deviation. Thus, success or failure on the preceding trial did not correspond to a uniform increase or decrease in a particular movement characteristic. The behavioral difference between outcome conditions therefore did not map onto a consistent shift in a specific kinematic deviation, consistent with evidence that task success and movement trajectory can show partly dissociable patterns during motor learning (Shmuelof et al., 2012).
More informative was the finding that the preceding outcome was related to which kinematic characteristics were associated with successful performance on the next trial. The relationships of both temporal-phasing and elbow-velocity deviations with t1 hit probability differed according to t0 outcome. Following a successful t0 outcome, the negative relationship between temporal-phasing deviation and subsequent performance was more apparent, whereas following an unsuccessful outcome, smaller elbow-velocity deviation was more clearly associated with a higher probability of a t1 hit. One possible interpretation is that once a newly parameterized movement configuration has produced the intended outcome, subsequent success may depend more strongly on preserving aspects of its recently effective coordinative organization, particularly the relative timing among key movement events. When the first execution fails to meet the target requirement, by contrast, successful subsequent performance may depend more strongly on the organization of more localized execution parameters. Such an interpretation is consistent with accounts in which task success emerges from the coordinated organization of multiple movement components rather than from the independent regulation of isolated parameters (Todorov & Jordan, 2002; Diedrichsen & Kornysheva, 2015).
Stage 2 should therefore be interpreted as observational evidence about adjacent-trial organization after outcome information became available, rather than as direct evidence for feedback-based correction. The preceding outcome was associated with next-trial hit probability and with the behavioral relevance of selected kinematic deviations, but it did not correspond to a consistent mean shift in the measured next-trial kinematics. Thus, the Stage 2 findings suggest that recent outcome information may be related to how subsequent actions are organized, while the specific regulatory process remains to be tested with experimental manipulation of feedback availability, endpoint error, or outcome information.
4.3. Training Duration and Cognitive Correlates Across Stages
The athlete-level findings further suggest that sport-specific experience and response-updating ability may be related to different, although not mutually exclusive, aspects of skilled action adaptation. Training duration showed its clearest and most consistent association with temporal organization. In Stage 1, athletes with longer training duration exhibited smaller temporal-phasing deviations, and the relative hit disadvantage under Target change also varied with training duration. In Stage 2, longer training duration was again associated with smaller temporal-phasing deviation following both successful and unsuccessful t0 outcomes. The recurrence of this relationship across the two stages suggests that long-term sport-specific practice may be associated with a more stable calibration of relative timing rather than with an advantage confined to a particular outcome condition.
Such an interpretation is consistent with the broader view that expertise does not simply reduce movement variability, but progressively organizes variability around task-relevant solutions. With practice, performers may become better able to coordinate multiple movement components while allowing nonessential dimensions to vary, thereby stabilizing features that are especially relevant to successful task execution (Müller & Sternad, 2004; Cohen & Sternad, 2012). Evidence from table tennis similarly shows that skilled performers can exploit joint-level variability while maintaining functionally important racket states (Iino et al., 2017). From this perspective, the association between training duration and smaller temporal-phasing deviation may reflect experience-dependent calibration of the relative timing among movement components. The Stage 1 interaction with target context is also compatible with the possibility that such calibration helps limit the relative performance cost when an established action must be parameterized for a new landing location, although the present data do not imply that longer training uniformly improves hit probability across all conditions.
Change-trial accuracy showed a different pattern. In Stage 1, higher change-trial accuracy was associated with higher hit probability specifically under Target change and with smaller elbow-velocity deviation across target contexts; its association with temporal-phasing deviation was also in the same direction, although less pronounced. In Stage 2, higher change-trial accuracy was again associated with smaller elbow-velocity deviation following both successful and unsuccessful t0 outcomes. This pattern is consistent with the operational demands of the stop-change task, in which successful performance requires interruption of a prepared response and correct implementation of an alternative response (Verbruggen et al., 2008). A change in serving target similarly requires an already prepared or recently used configuration to be replaced by one appropriate for the updated goal. Change-trial accuracy should therefore not be regarded as a direct measure of the motor schema itself, but it may index a more general capacity for correctly implementing an updated response configuration. The recurring association with elbow velocity is compatible with this interpretation because elbow velocity represents a relatively localized component of upper-limb execution that contributes to racket motion in table tennis (Iino et al., 2008).
Taken together, the athlete-level results suggest a useful distinction between experience-dependent calibration and response updating. Training duration was most consistently related to temporal organization across stages, whereas change-trial accuracy was related to successful performance when the target changed and to the organization of specific execution characteristics, most robustly elbow velocity. At the same time, the associations were not strictly dimension-specific: change-trial accuracy also showed a directional relationship with temporal phasing, and temporal organization itself was related to other cognitive characteristics. Thus, the present findings are better interpreted as partially overlapping correlates of skilled adaptation than as evidence for a one-to-one mapping between sport experience, cognitive control, and individual kinematic parameters. Among the cognitive measures examined, change-trial accuracy nevertheless showed the clearest correspondence with the response-reconfiguration demands imposed by a change in serving target.
4.4. Strengths, Limitations and Implications
A principal strength of the present study was that it combined sport-specific realism with an explicitly defined temporal structure of adaptation following a target change. Because serving was self-initiated, landing-location requirements could be changed without changing the serve type, allowing the parameterization of an established skill for a new landing location to be examined within a natural continuous action sequence. More importantly, t0 and the immediately adjacent t1 provided two consecutive observational windows with different informational states: at t0, outcome information for the current target was not yet available, whereas at t1, information from the preceding execution could contribute to subsequent regulation. This design allowed initial schema-based parameterization and adjacent-trial organization after outcome information to be examined within the same sequence of skilled actions. The study also combined hit performance with seven kinematic deviations derived from individualized stable-serving templates and examined the robustness of the findings across alternative template definitions. This reduced reliance on behavioral outcome alone when inferring movement organization and avoided restricting the analysis to a single kinematic feature. More broadly, the design is consistent with calls to study skilled behavior under task conditions that preserve important features of the performance environment (Pinder et al., 2011).
Several limitations should nevertheless be considered. First, although the trial-level dataset was relatively large, the analyses were based on only 12 athletes, and both training duration and cognitive indicators varied at the athlete level. The individual-difference findings therefore require replication in larger and more diverse samples. Second, successful and unsuccessful t0 outcomes arose naturally rather than through experimental manipulation. Associations between the preceding outcome and subsequent performance or movement organization therefore cannot establish that outcome information causally produced a particular next-trial adjustment. Third, the study recorded binary hit outcome rather than continuous endpoint error. It was consequently not possible to determine the direction or magnitude of an unsuccessful serve or to test whether the subsequent action contained a correspondingly directed and scaled parameter correction. Finally, training duration and the cognitive indicators were measured cross-sectionally, so their associations with performance and kinematic organization should not be interpreted as longitudinal effects of training or as causal effects of cognitive control on sport-specific performance. Future studies combining larger athlete samples, continuous endpoint-error measures, and experimental manipulation of outcome feedback could more directly distinguish persistence of recent movement states, parameter exploration, and directional trial-to-trial adjustment.
Despite these limitations, the present findings identify several testable directions for skilled training. Beyond stable repetition under relatively constant target conditions, the present findings suggest that the first execution following a target change may itself constitute a distinct phase of adaptation. Practice designs could therefore incorporate more frequent landing-location changes within the same skill and evaluate first-attempt performance separately from subsequent stable executions. The Stage 2 findings further suggest that the behavioral relevance of different movement characteristics may vary according to the preceding outcome, providing a basis for future feedback studies to examine which aspects of movement organization are best preserved or adjusted after successful and unsuccessful attempts. The association between change-trial accuracy and Target-change performance also identifies a potential direction for further investigation, although the present findings do not establish that cognitive training would improve sport-specific performance. Randomized intervention studies could test the effects of sport-specific target-change practice, stopping-and-replacement training, and their combination on first-attempt performance and subsequent movement organization.
5. Conclusions
In conclusion, landing-location changes in continuous table-tennis serving revealed a clear cost of initial parameterization when athletes adapted an established serve to a new landing location. This cost was most consistently reflected in temporal-phasing deviation, suggesting that the relative timing of key movement events is an important kinematic marker of schema-based parameterization. After outcome information became available, the preceding outcome was associated with next-trial hit probability and selected kinematic–hit associations, providing partial observational evidence for adjacent-trial organization after the first attempt. Training duration and change-trial accuracy showed preliminary associations with different aspects of movement organization. Overall, the findings suggest that skilled action adaptation involves both configuring appropriate parameters for a new goal and organizing subsequent performance in light of recent outcome information.
Funding
This work was supported by grants from the National Natural Science Foundation of China (No. 32471131).
Data Availability Statement
The de-identified derived data and analysis code supporting the reported models are available from the corresponding author upon reasonable request.
Disclosure Statement
The authors declare no conflicts of interest.
References
- Bańkosz, Z.; Winiarski, S. Kinematic parameters of topspin forehand in table tennis and their inter- and intra-individual variability. J. Sports Sci. Med. 2020, 19, 138–148. [Google Scholar] [PubMed]
- Bańkosz, Z.; Winiarski, S.; Malagoli Lanzoni, I. Gender differences in kinematic parameters of topspin forehand and backhand in table tennis. Int. J. Environ. Res. Public Health 2020, 17(16), 5742. [Google Scholar] [CrossRef] [PubMed]
- Bernstein, N. A. The co-ordination and regulation of movements; Pergamon Press, 1967. [Google Scholar]
- Bootsma, R. J.; van Wieringen, P. C. W. Timing an attacking forehand drive in table tennis. J. Exp. Psychol. Hum. Percept. Perform. 1990, 16(1), 21–29. [Google Scholar] [CrossRef]
- Cappozzo, A.; Catani, F.; Della Croce, U.; Leardini, A. Position and orientation in space of bones during movement: Anatomical frame definition and determination. Clin. Biomech. 1995, 10(4), 171–178. [Google Scholar] [CrossRef] [PubMed]
- Cohen, R. G.; Sternad, D. State space analysis of timing: Exploiting task redundancy to reduce sensitivity to timing. J. Neurophysiol. 2012, 107(2), 618–627. [Google Scholar] [CrossRef] [PubMed]
- Carius, D.; Kaminski, E.; Clauß, M.; Schewe, Y.; Ryk, L.; Ragert, P. Quantifying motor adaptation in a sport-specific table tennis setting. Sci. Rep. 2024, 14, 601. [Google Scholar] [CrossRef] [PubMed]
- Diedrichsen, J.; Kornysheva, K. Motor skill learning between selection and execution. Trends Cogn. Sci. 2015, 19(4), 227–233. [Google Scholar] [CrossRef] [PubMed]
- Ericsson, K. A.; Krampe, R. T.; Tesch-Römer, C. The role of deliberate practice in the acquisition of expert performance. Psychol. Rev. 1993, 100(3), 363–406. [Google Scholar] [CrossRef]
- Hanley, J. A.; Negassa, A.; Edwardes, M. D. deB.; Forrester, J. E. Statistical analysis of correlated data using generalized estimating equations: An orientation. Am. J. Epidemiol. 2003, 157(4), 364–375. [Google Scholar] [CrossRef] [PubMed]
- Hautus, M. J. Corrections for extreme proportions and their biasing effects on estimated values of d′. Behav. Res. Methods Instrum. Comput. 1995, 27(1), 46–51. [Google Scholar] [CrossRef]
- Horn, R. R.; Marchetto, J. D. Approximate target pre-cueing reduces programming quiet eye and movement preparation time: Evidence for parameter pre-programming? Research Quarterly for Exercise and Sport 2021, 92(4), 787–795. [CrossRef] [PubMed]
- Iino, Y.; Mori, T.; Kojima, T. Contributions of upper limb rotations to racket velocity in table tennis backhands against topspin and backspin. J. Sports Sci. 2008, 26(3), 287–293. [Google Scholar] [CrossRef] [PubMed]
- Iino, Y.; Yoshioka, S.; Fukashiro, S. Uncontrolled manifold analysis of joint angle variability during table tennis forehand. Hum. Mov. Sci. 2017, 56, 98–108. [Google Scholar] [CrossRef] [PubMed]
- Iino, Y.; Yoshioka, S.; Fukashiro, S. Validation of lower limb muscle activation estimated using musculoskeletal modeling against electromyography in the table tennis topspin forehand and backhand. Int. J. Racket Sports Sci. 2022, 4(2), 1–10. [Google Scholar] [CrossRef]
- Kiesel, A.; Steinhauser, M.; Wendt, M.; Falkenstein, M.; Jost, K.; Philipp, A. M.; Koch, I. Control and interference in task switching—A review. Psychol. Bull. 2010, 136(5), 849–874. [Google Scholar] [CrossRef] [PubMed]
- Liang, K.-Y.; Zeger, S. L. Longitudinal data analysis using generalized linear models. Biometrika 1986, 73(1), 13–22. [Google Scholar] [CrossRef]
- Logan, G. D.; Cowan, W. B. On the ability to inhibit thought and action: A theory of an act of control. Psychol. Rev. 1984, 91(3), 295–327. [Google Scholar] [CrossRef]
- Malagoli Lanzoni, I.; Bartolomei, S.; Di Michele, R.; Fantozzi, S. A kinematic comparison between long-line and cross-court top spin forehand in competitive table tennis players. J. Sports Sci. 2018, 36(23), 2637–2643. [Google Scholar] [CrossRef] [PubMed]
- Miyake, A.; Friedman, N. P.; Emerson, M. J.; Witzki, A. H.; Howerter, A.; Wager, T. D. The unity and diversity of executive functions and their contributions to complex “frontal lobe” tasks: A latent variable analysis. Cogn. Psychol. 2000, 41(1), 49–100. [Google Scholar] [CrossRef] [PubMed]
- Monsell, S. Task switching. Trends Cogn. Sci. 2003, 7(3), 134–140. [Google Scholar] [CrossRef] [PubMed]
- Müller, H.; Sternad, D. Decomposition of variability in the execution of goal-oriented tasks: Three components of skill improvement. J. Exp. Psychol. Hum. Percept. Perform. 2004, 30(1), 212–233. [Google Scholar] [CrossRef] [PubMed]
- Newell, K. M. Constraints on the development of coordination. In Motor development in children: Aspects of coordination and control; Wade, M. G., Whiting, H. T. A., Eds.; Martinus Nijhoff, 1986; pp. 341–360. [Google Scholar] [CrossRef]
- Owen, A. M.; McMillan, K. M.; Laird, A. R.; Bullmore, E. N-back working memory paradigm: A meta-analysis of normative functional neuroimaging studies. Hum. Brain Mapp. 2005, 25(1), 46–59. [Google Scholar] [CrossRef] [PubMed]
- Pinder, R. A.; Davids, K.; Renshaw, I.; Araújo, D. Representative learning design and functionality of research and practice in sport. J. Sport Exerc. Psychol. 2011, 33(1), 146–155. [Google Scholar] [CrossRef] [PubMed]
- Rogers, R. D.; Monsell, S. Costs of a predictable switch between simple cognitive tasks. J. Exp. Psychol. General. 1995, 124(2), 207–231. [Google Scholar] [CrossRef]
- Rosenbaum, D. A. Human movement initiation: Specification of arm, direction, and extent. J. Exp. Psychol. General. 1980, 109(4), 444–474. [Google Scholar] [CrossRef] [PubMed]
- Schmidt, R. A. A schema theory of discrete motor skill learning. Psychol. Rev. 1975, 82(4), 225–260. [Google Scholar] [CrossRef]
- Shadmehr, R.; Krakauer, J. W. A computational neuroanatomy for motor control. Exp. Brain Res. 2008, 185(3), 359–381. [Google Scholar] [CrossRef] [PubMed]
- Shmuelof, L.; Krakauer, J. W.; Mazzoni, P. How is a motor skill learned? Change and invariance at the levels of task success and trajectory control. J. Neurophysiol. 2012, 108(2), 578–594. [Google Scholar] [CrossRef] [PubMed]
- Singh, T.; Verma, A.; Ranganathan, R. Reflecting on what is “skill” in human motor skill learning. Front. Hum. Neurosci. 2023, 17, 1117889. [Google Scholar] [CrossRef] [PubMed]
- Stanislaw, H.; Todorov, N. Calculation of signal detection theory measures. Behav. Res. Methods Instrum. Comput. 1999, 31(1), 137–149. [Google Scholar] [CrossRef] [PubMed]
- Todorov, E.; Jordan, M. I. Optimal feedback control as a theory of motor coordination. Nat. Neurosci. 2002, 5(11), 1226–1235. [Google Scholar] [CrossRef] [PubMed]
- Verbruggen, F.; Aron, A. R.; Band, G. P. H.; Beste, C.; Bissett, P. G.; Brockett, A. T.; Brown, J. W.; Chamberlain, S. R.; Chambers, C. D.; Colonius, H.; Colzato, L. S.; Corneil, B. D.; Coxon, J. P.; Dupuis, A.; Eagle, D. M.; Garavan, H.; Greenhouse, I.; Heathcote, A.; Huster, R. J.; Jahfari, S.; Kenemans, J. L.; Leunissen, I.; Li, C.-S. R.; Logan, G. D.; Matzke, D.; Morein-Zamir, S.; Murthy, A.; Paré, M.; Poldrack, R. A.; Ridderinkhof, K. R.; Robbins, T. W.; Roesch, M.; Rubia, K.; Schachar, R. J.; Schall, J. D.; Stock, A.-K.; Swann, N. C.; Thakkar, K. N.; van der Molen, M. W.; Vermeylen, L.; Vink, M.; Wessel, J. R.; Whelan, R.; Zandbelt, B. B.; Boehler, C. N. A consensus guide to capturing the ability to inhibit actions and impulsive behaviors in the stop-signal task. eLife 2019, 8, e46323. [Google Scholar] [CrossRef] [PubMed]
- Verbruggen, F.; Logan, G. D. Response inhibition in the stop-signal paradigm. Trends Cogn. Sci. 2008, 12(11), 418–424. [Google Scholar] [CrossRef] [PubMed]
- Verbruggen, F.; Schneider, D. W.; Logan, G. D. How to stop and change a response: The role of goal activation in multitasking. J. Exp. Psychol. Hum. Percept. Perform. 2008, 34(5), 1212–1228. [Google Scholar] [CrossRef] [PubMed]
- Winter, D. A. Biomechanics and motor control of human movement, 4th ed.; John Wiley & Sons, 2009. [Google Scholar] [CrossRef]
- Wolpert, D. M.; Diedrichsen, J.; Flanagan, J. R. Principles of sensorimotor learning. Nat. Rev. Neurosci. 2011, 12(12), 739–751. [Google Scholar] [CrossRef] [PubMed]
- Wu, G.; van der Helm, F. C. T.; Veeger, H. E. J.; Makhsous, M.; Van Roy, P.; Anglin, C.; Nagels, J.; Karduna, A. R.; McQuade, K.; Wang, X.; Werner, F. W.; Buchholz, B. ISB recommendation on definitions of joint coordinate systems of various joints for the reporting of human joint motion—Part II: Shoulder, elbow, wrist and hand. J. Biomech. 2005, 38(5), 981–992. [Google Scholar] [CrossRef] [PubMed]
Figure 1.
Study design and two analysis stages. Note. Figure 1a shows the table-tennis serving task, motion-capture recording, four serve types, seven landing locations, and the operational definitions of Target change and Target maintenance. Within a given serve type, t0 denotes the first executed trial after a landing-location change (Target change), and t1 denotes the immediately subsequent trial at the same serve type and landing location (Target maintenance). Thin lines and translucent points show unadjusted athlete-level conditional hit rates; large points and error bars show population estimates and 95% confidence intervals. Figure 1b shows training duration, the three cognitive tasks from which four cognitive indicators were derived, and age, shown separately as a covariate. Figure 1c presents two temporally linked stages: initial schema-based parameterization at t0, followed by prior-outcome associations with next-trial organization from the t0 outcome to t1. At each stage, hit outcome and kinematic organization are treated as complementary readouts, whereas training duration and the cognitive indicators are examined separately as participant-level variables. Dashed arrows indicate tested associations of training duration and the cognitive indicators with stage-specific hit outcomes and kinematic organization. Stage 2 paths denote observable associations used to evaluate the regulatory construct rather than established causal effects. Age was included as a participant-level covariate but is omitted for visual clarity; serve type and landing location were included as trial-level covariates and are not shown.
Figure 1.
Study design and two analysis stages. Note. Figure 1a shows the table-tennis serving task, motion-capture recording, four serve types, seven landing locations, and the operational definitions of Target change and Target maintenance. Within a given serve type, t0 denotes the first executed trial after a landing-location change (Target change), and t1 denotes the immediately subsequent trial at the same serve type and landing location (Target maintenance). Thin lines and translucent points show unadjusted athlete-level conditional hit rates; large points and error bars show population estimates and 95% confidence intervals. Figure 1b shows training duration, the three cognitive tasks from which four cognitive indicators were derived, and age, shown separately as a covariate. Figure 1c presents two temporally linked stages: initial schema-based parameterization at t0, followed by prior-outcome associations with next-trial organization from the t0 outcome to t1. At each stage, hit outcome and kinematic organization are treated as complementary readouts, whereas training duration and the cognitive indicators are examined separately as participant-level variables. Dashed arrows indicate tested associations of training duration and the cognitive indicators with stage-specific hit outcomes and kinematic organization. Stage 2 paths denote observable associations used to evaluate the regulatory construct rather than established causal effects. Age was included as a participant-level covariate but is omitted for visual clarity; serve type and landing location were included as trial-level covariates and are not shown.
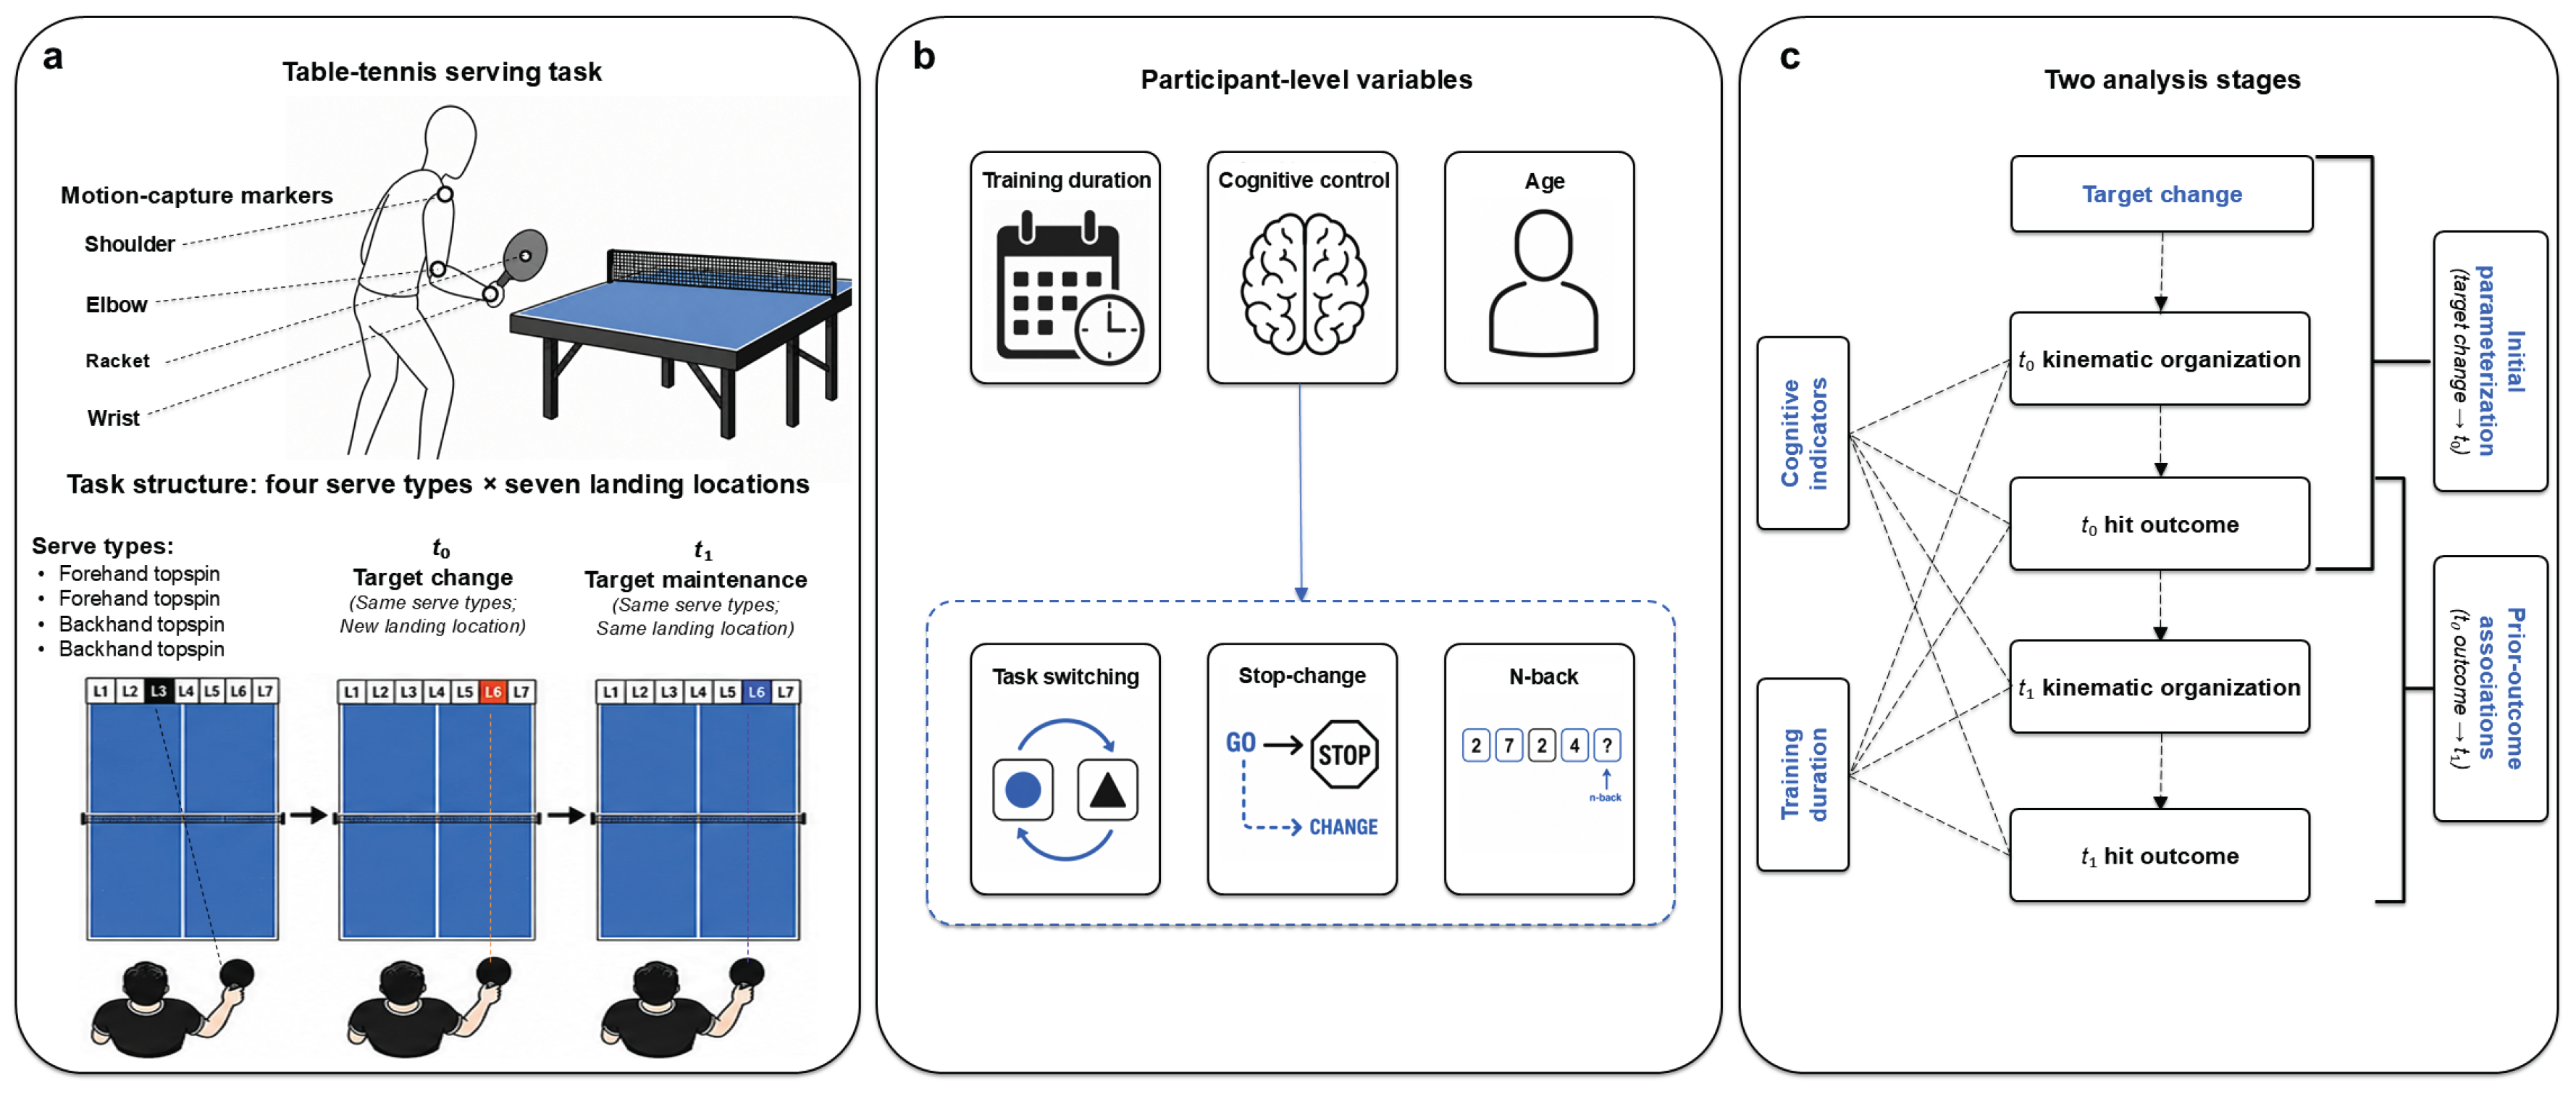
Figure 2.
Behavioral and kinematic signatures of initial schema-based parameterization. Note. Target-change trials represent the t0 observations in Stage 1, whereas Target-maintenance trials provide the reference context. Figure 2a shows estimated hit probability under Target maintenance and Target change. Thin lines and translucent points show unadjusted athlete-level conditional hit rates; large points and error bars show population estimates and 95% confidence intervals. Figure 2b shows model-estimated hit probability across temporal-phasing deviation in the two target contexts. Lines and shaded bands show adjusted GEE estimates and 95% confidence intervals. Annotations report unadjusted two-sided p values; q values adjusted for the false discovery rate are reported in the Results and supplementary materials. Stage 1 models include 3,350 trials and adjust for age, serve type, and landing location, with observations clustered within athlete.
Figure 2.
Behavioral and kinematic signatures of initial schema-based parameterization. Note. Target-change trials represent the t0 observations in Stage 1, whereas Target-maintenance trials provide the reference context. Figure 2a shows estimated hit probability under Target maintenance and Target change. Thin lines and translucent points show unadjusted athlete-level conditional hit rates; large points and error bars show population estimates and 95% confidence intervals. Figure 2b shows model-estimated hit probability across temporal-phasing deviation in the two target contexts. Lines and shaded bands show adjusted GEE estimates and 95% confidence intervals. Annotations report unadjusted two-sided p values; q values adjusted for the false discovery rate are reported in the Results and supplementary materials. Stage 1 models include 3,350 trials and adjust for age, serve type, and landing location, with observations clustered within athlete.
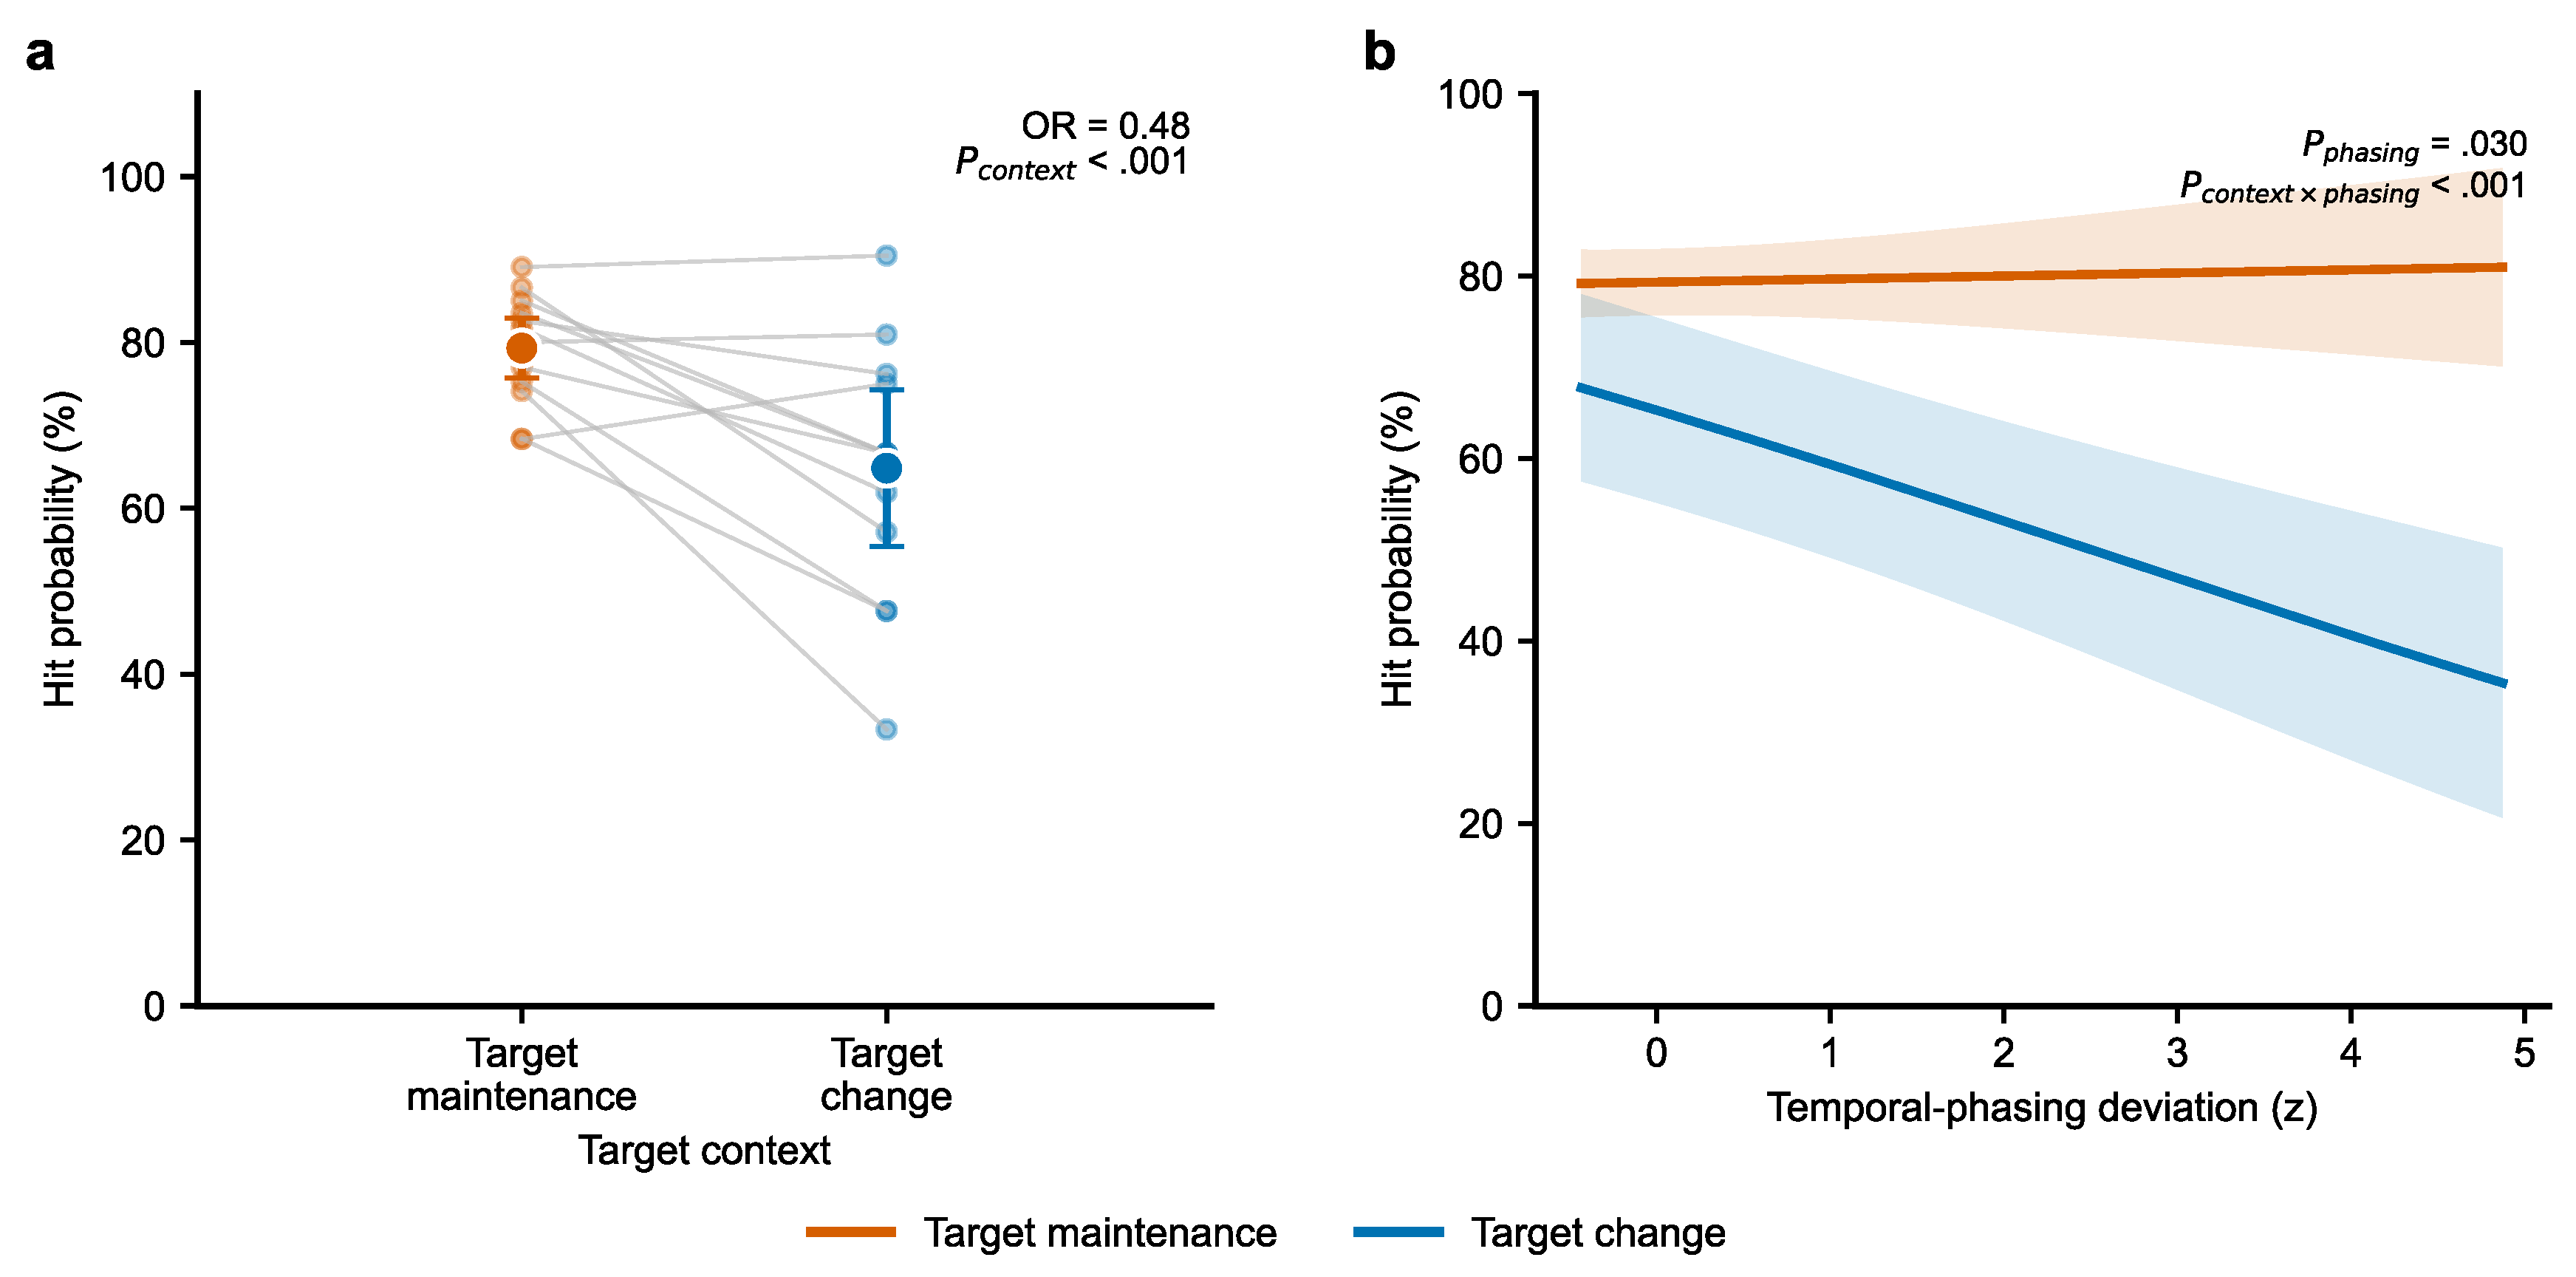
Figure 3.
Associations of training duration and change-trial accuracy with hit probability and temporal-phasing deviation during initial schema-based parameterization. Note. Figure 3a–b show associations of training duration with hit probability and temporal-phasing deviation. Figure 3c–d show the corresponding associations for change-trial accuracy. Lines and shaded bands show adjusted GEE estimates and 95% confidence intervals for Target maintenance and Target change. Annotations report unadjusted two-sided Wald p values for the conditional slopes and predictor × target context interactions. Multiplicity-adjusted results are reported in the main text and Supplementary Table S8.
Figure 3.
Associations of training duration and change-trial accuracy with hit probability and temporal-phasing deviation during initial schema-based parameterization. Note. Figure 3a–b show associations of training duration with hit probability and temporal-phasing deviation. Figure 3c–d show the corresponding associations for change-trial accuracy. Lines and shaded bands show adjusted GEE estimates and 95% confidence intervals for Target maintenance and Target change. Annotations report unadjusted two-sided Wald p values for the conditional slopes and predictor × target context interactions. Multiplicity-adjusted results are reported in the main text and Supplementary Table S8.
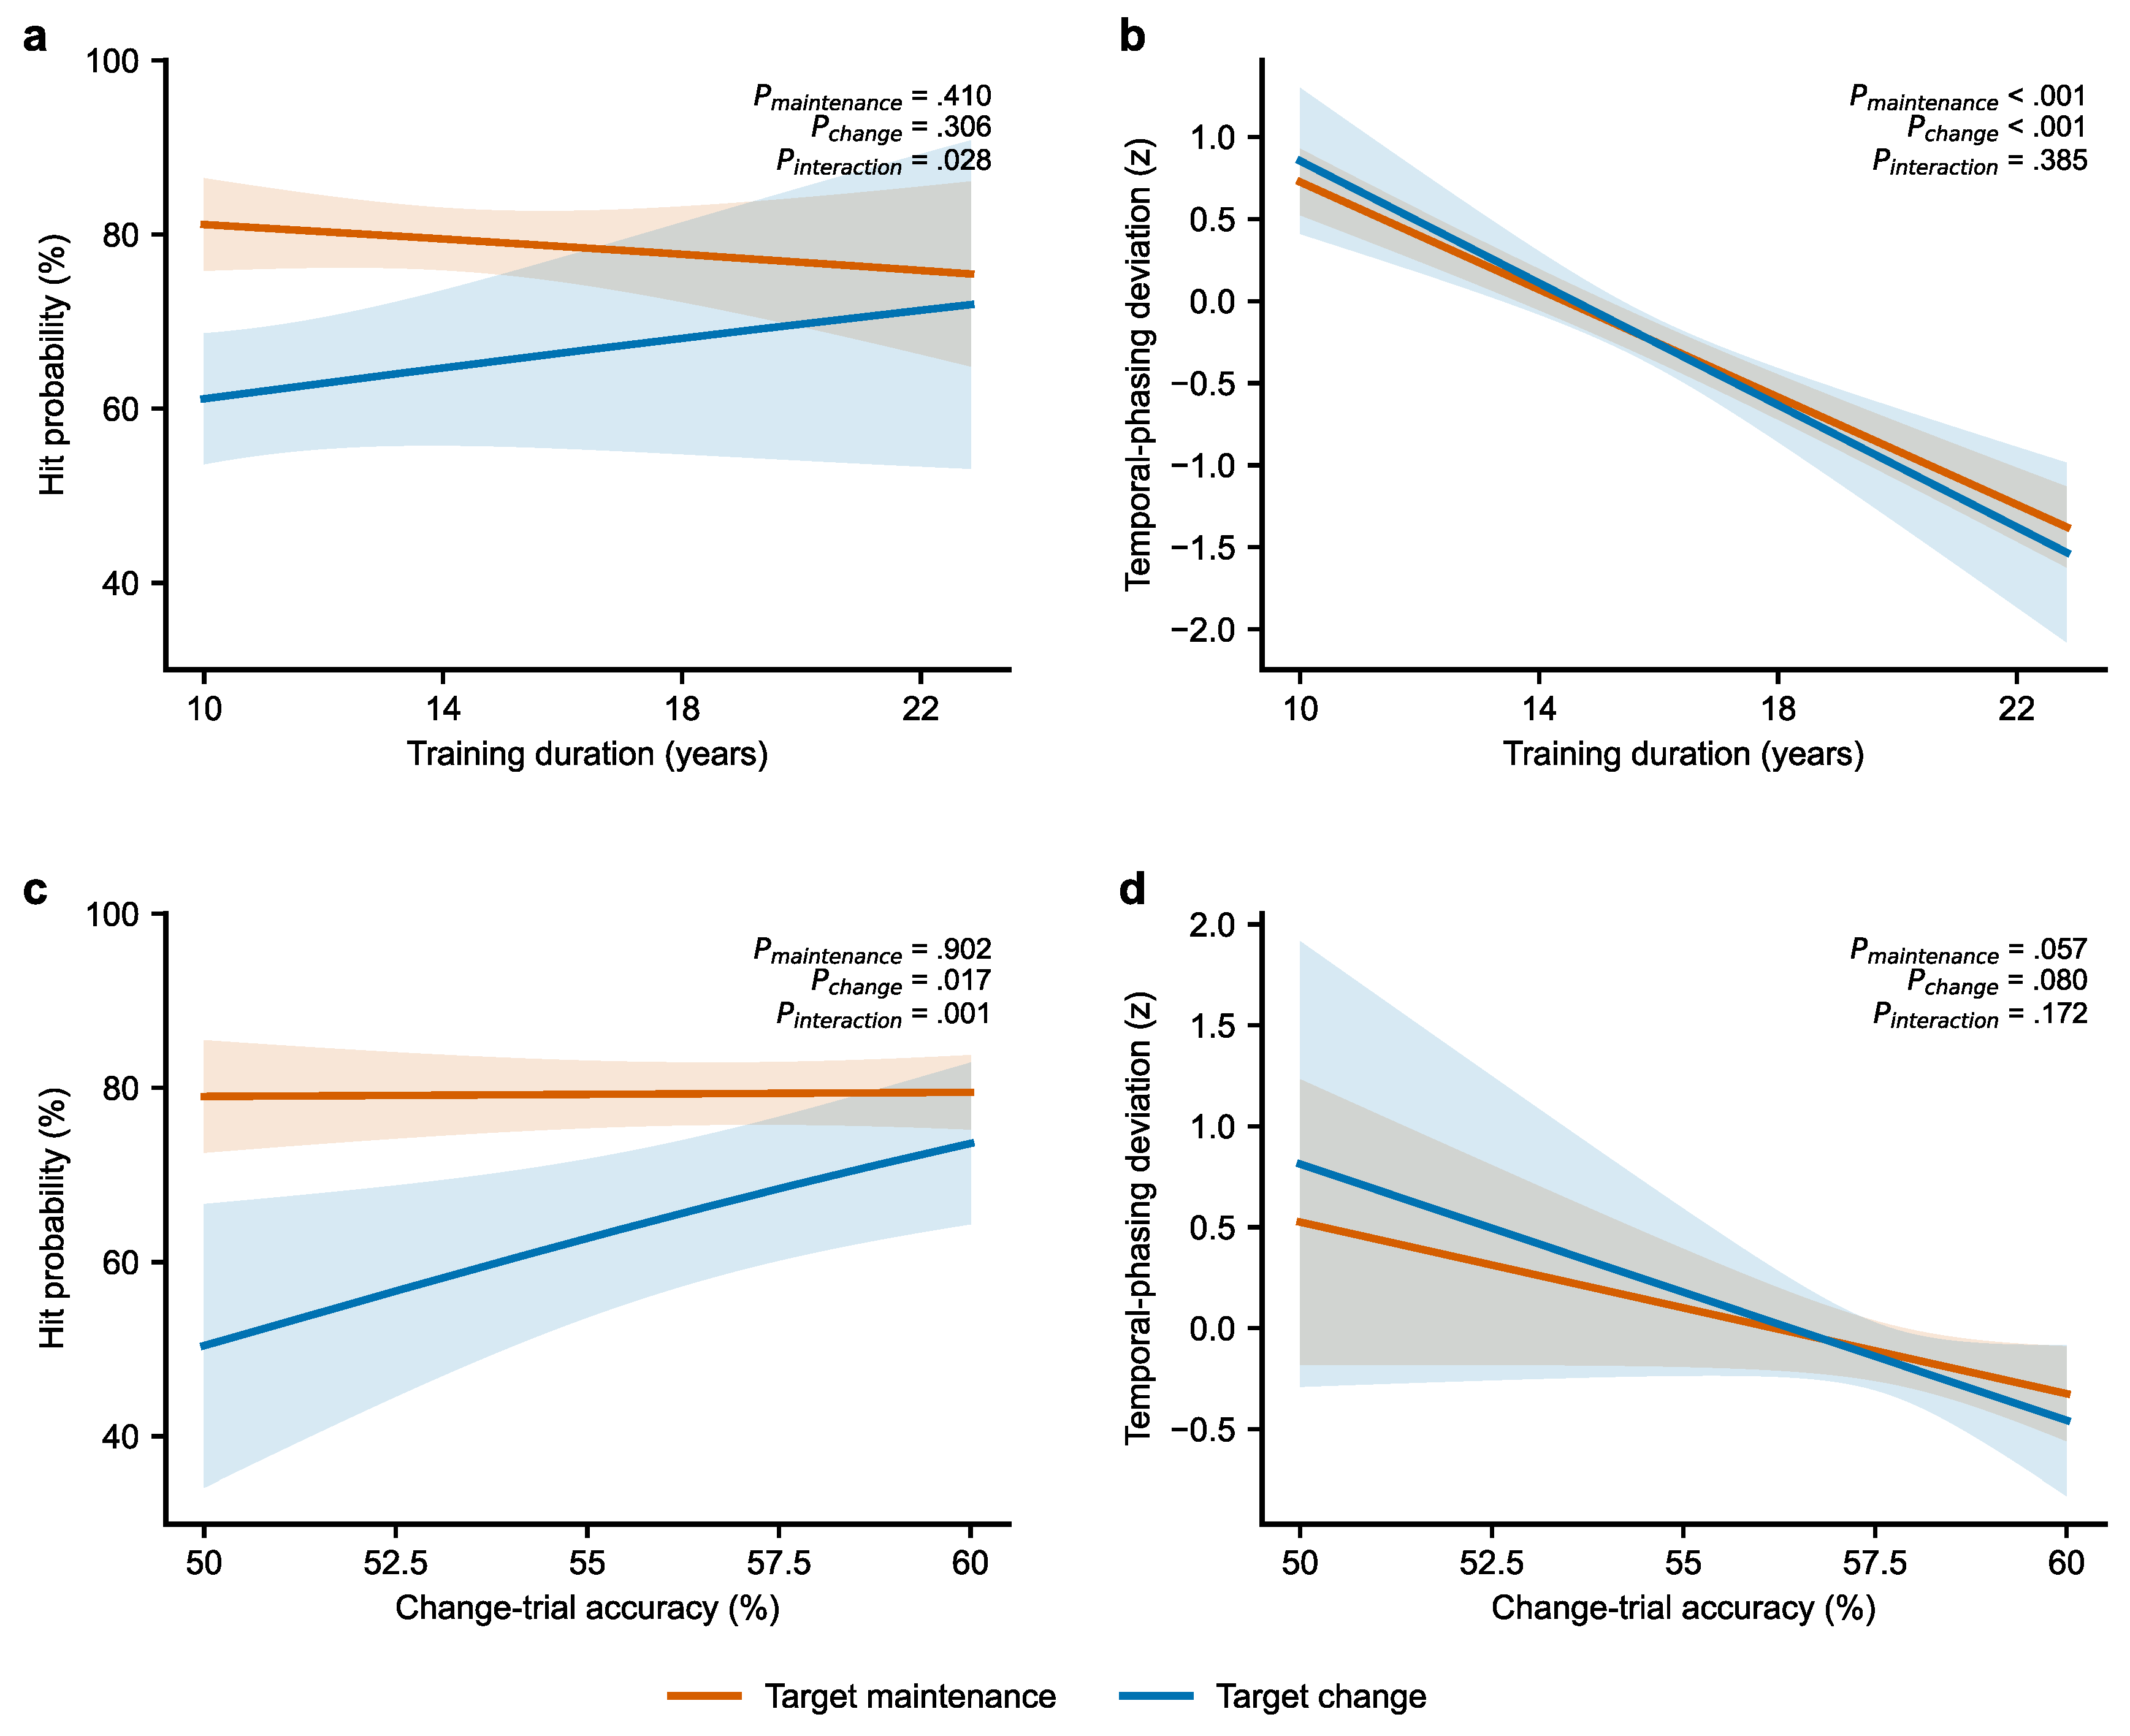
Figure 4.
Adjacent-trial associations within the Stage 2 window. Note. Figure 4a shows estimated t1 hit probability following successful versus unsuccessful t0 outcome. Figure 4b–c show predicted t1 hit probability across t1 temporal-phasing and elbow-velocity deviations, respectively, following successful and unsuccessful t0 outcomes. Figure 4d shows predicted t1 temporal-phasing deviation across training duration. Figure 4e shows predicted t1 elbow-velocity deviation across change-trial accuracy. Kinematic models adjust for the corresponding t0 kinematic deviation; all trial-level models additionally adjust for age, serve type, and landing location, with observations clustered within athlete. Lines and shaded bands show marginal estimates and 95% confidence intervals. Annotations report unadjusted two-sided p values. Multiplicity-adjusted results for Figure 4b and Figure 4c are reported in Supplementary Table S5; results for Figure 4d and Figure 4e are reported in Supplementary Table S7.
Figure 4.
Adjacent-trial associations within the Stage 2 window. Note. Figure 4a shows estimated t1 hit probability following successful versus unsuccessful t0 outcome. Figure 4b–c show predicted t1 hit probability across t1 temporal-phasing and elbow-velocity deviations, respectively, following successful and unsuccessful t0 outcomes. Figure 4d shows predicted t1 temporal-phasing deviation across training duration. Figure 4e shows predicted t1 elbow-velocity deviation across change-trial accuracy. Kinematic models adjust for the corresponding t0 kinematic deviation; all trial-level models additionally adjust for age, serve type, and landing location, with observations clustered within athlete. Lines and shaded bands show marginal estimates and 95% confidence intervals. Annotations report unadjusted two-sided p values. Multiplicity-adjusted results for Figure 4b and Figure 4c are reported in Supplementary Table S5; results for Figure 4d and Figure 4e are reported in Supplementary Table S7.
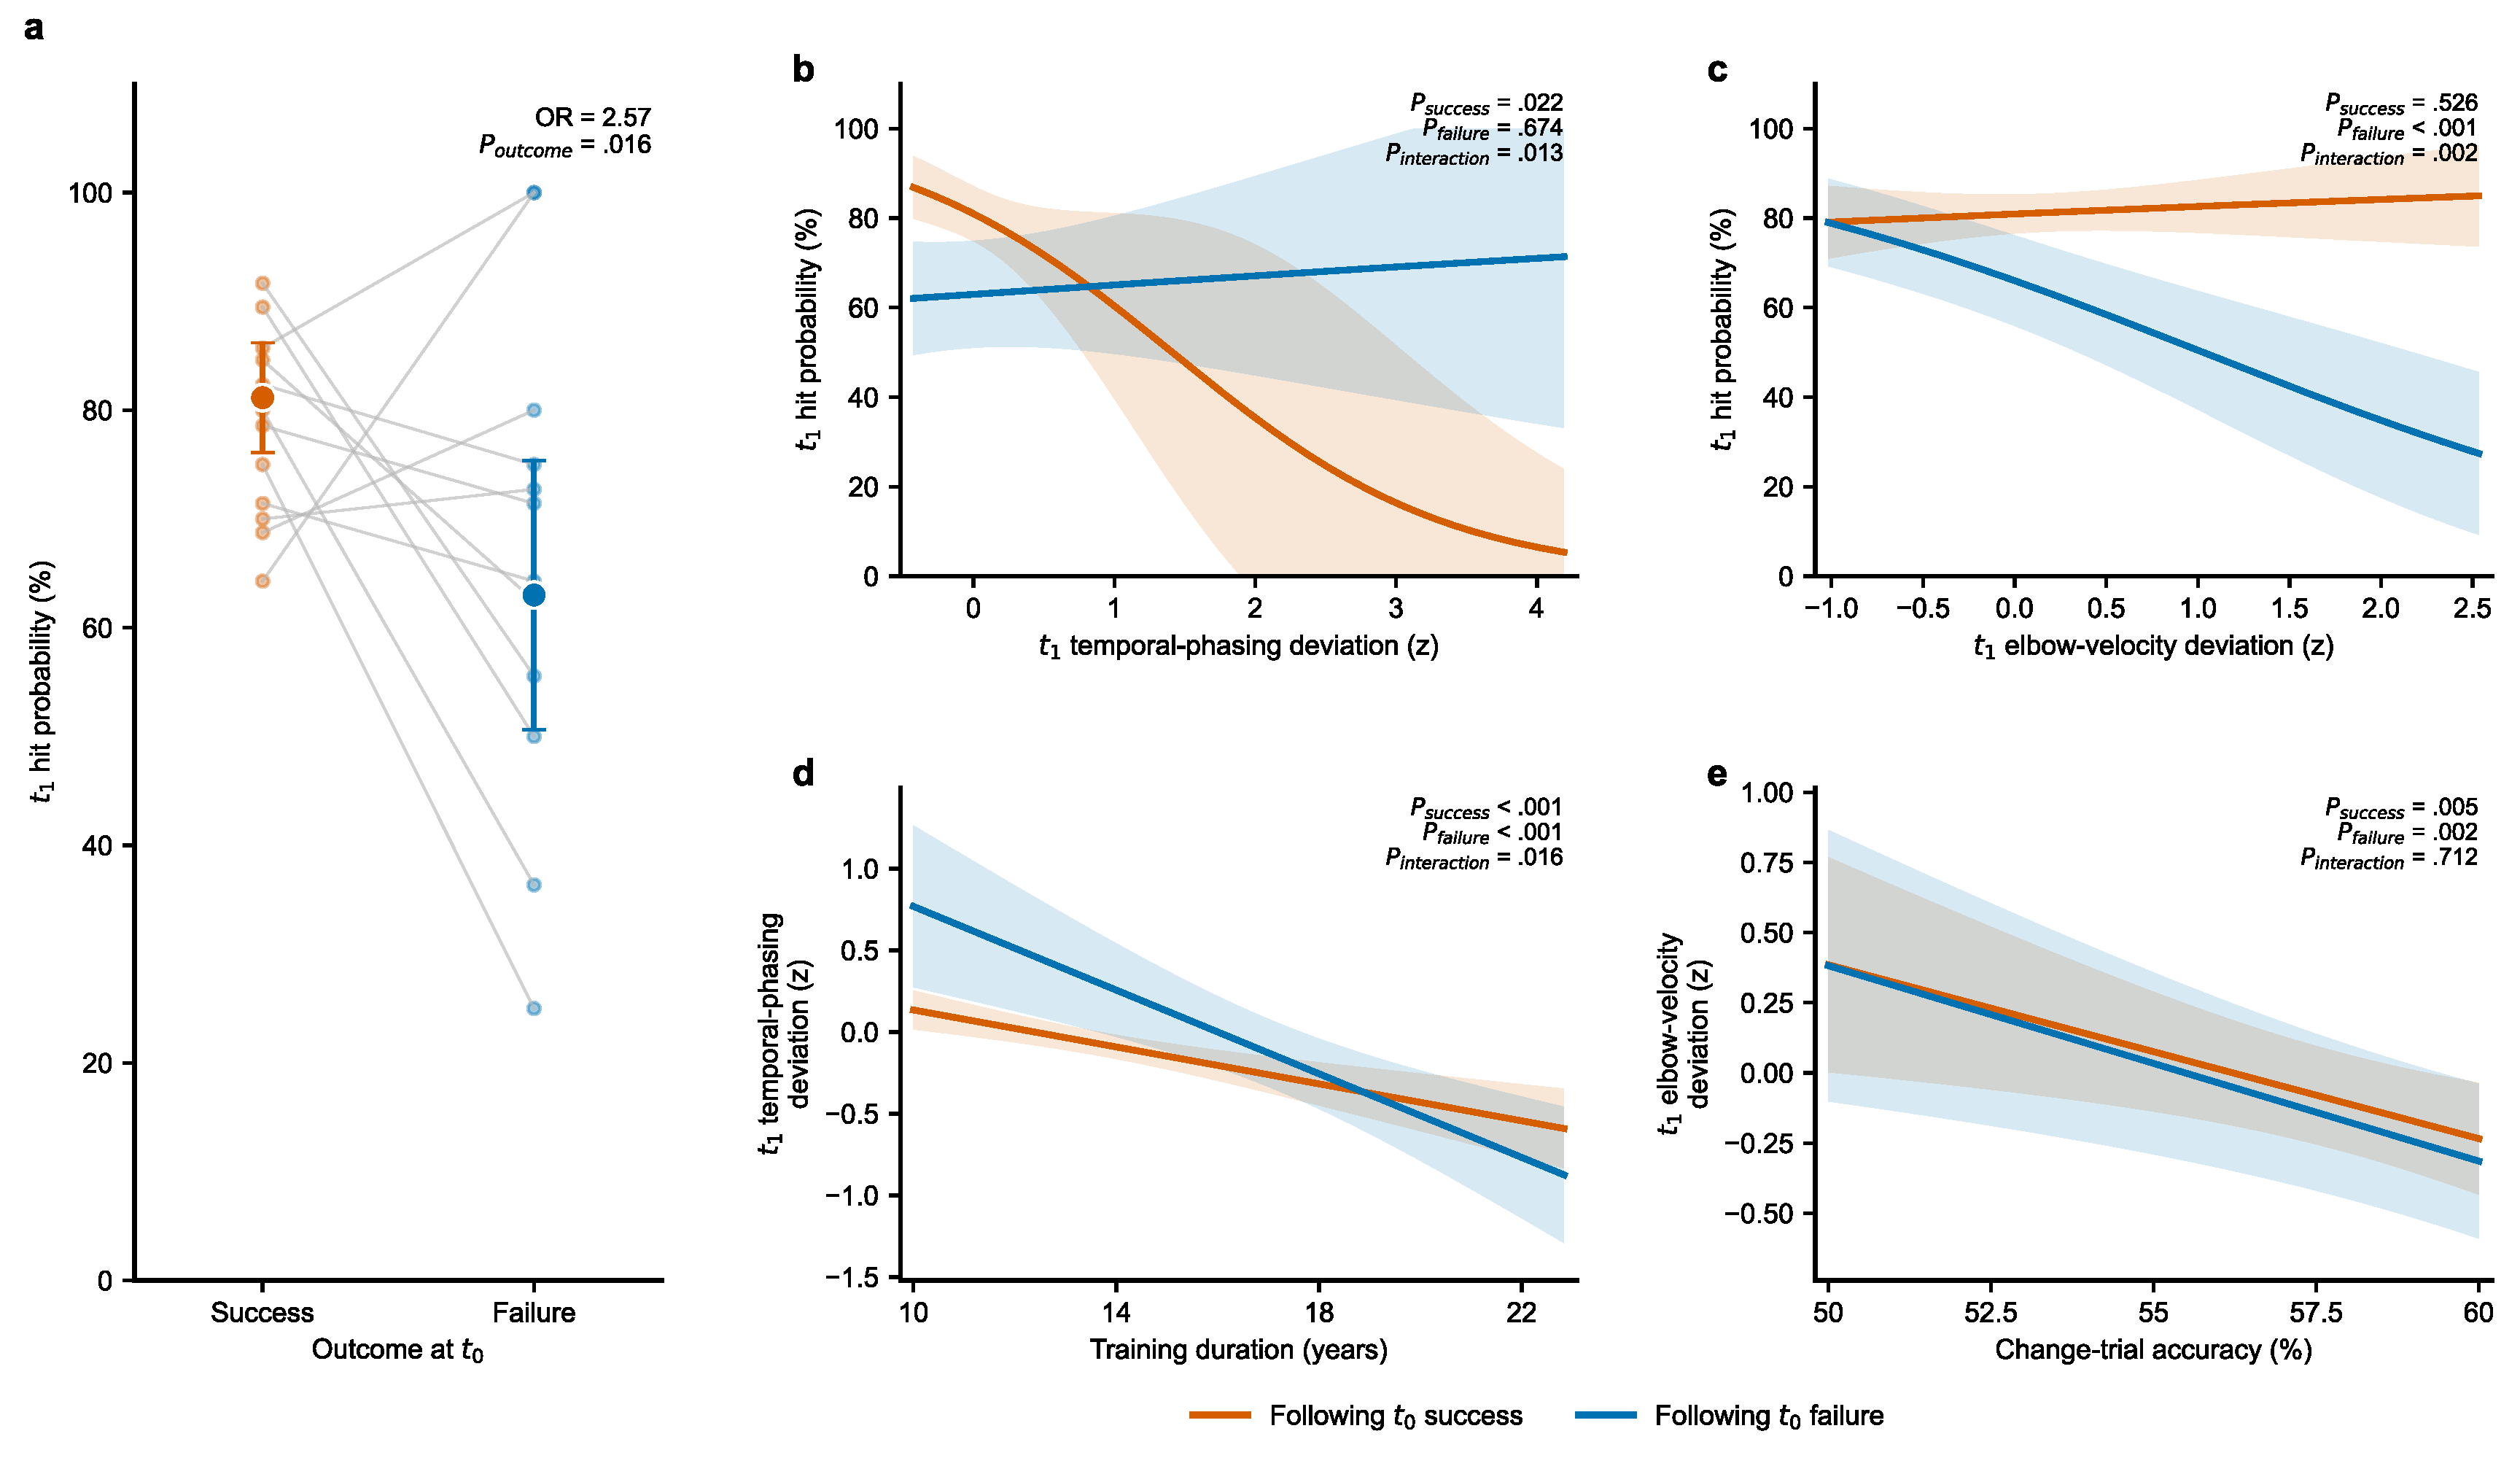
Disclaimer/Publisher’s Note: The statements, opinions and data contained in all publications are solely those of the individual author(s) and contributor(s) and not of MDPI and/or the editor(s). MDPI and/or the editor(s) disclaim responsibility for any injury to people or property resulting from any ideas, methods, instructions or products referred to in the content. |
© 2026 by the authors. Licensee MDPI, Basel, Switzerland. This article is an open access article distributed under the terms and conditions of the Creative Commons Attribution (CC BY) license (http://creativecommons.org/licenses/by/4.0/).
Copyright: This open access article is published under a Creative Commons CC BY 4.0 license, which permit the free download, distribution, and reuse, provided that the author and preprint are cited in any reuse.