

Submitted:
19 August 2026
Posted:
20 August 2026
You are already at the latest version
Abstract
The transition towards near zero-energy buildings requires advanced envelope solutions to mitigate thermal transmission losses and microclimatic discomfort inherent to highly glazed façades. Conventional passive triple glazing frequently induces a ‘cold-pane’ effect during extreme winter conditions, causing radiant asymmetry and buoyancy-driven convective downdraughts. This study empirically evaluates an active triple-glazed unit integrated with a transparent resistive heating layer. Investigations within a dual-zone climatic chamber simulated severe sub-zero boundary conditions down to −25 °C. Conjugate heat transfer was quantified using high-resolution thermography and heat-flux sensor arrays, whilst local discomfort was assessed applying Fanger’s criteria (ISO 7730). The findings reveal that passive operation at −25 °C depresses inner surface temperatures to 12.4 °C, yielding heat losses up to −65.0 W/m² and severe perimeter dissatisfaction (predicted percentage of dissatisfied, PPD > 20.4%). Under such conditions, architectural window-to-wall ratios (WWR) must be restricted to 24.6%. Conversely, activating the heating setpoint to 40 °C establishes a near-adiabatic thermal barrier (mean flux −8.2 W/m²), effectively suppressing downdraughts and ensuring microclimatic stability (PPD < 10%). Consequently, dynamic thermal modulation via active glazing significantly relaxes traditional architectural constraints; while passive configurations necessitate a restrictive WWR limit of approximately 25% under sub-zero conditions, the active system demonstrates the feasibility of an unconstrained 100% WWR, provided that the associated electrical energy demand is managed through intelligent control strategies to ensure holistic nZEB compliance.
Keywords:
active glazing
; thermal comfort
; near zero-energy buildings
; convective downdraught
; conjugate heat transfer
; window-to-wall ratio
1. Introduction
The global built environment is currently exposed to a dual pressure: rapidly increasing urban density and the urgent need to reduce greenhouse gas emissions. The building and construction sectors remain major contributors to global energy-related carbon dioxide emissions and final energy demand. [1,2,3,4]. Within this context, building operation is a dominant driver of energy use, with space heating accounting for a substantial share of total demand in European residential and commercial sectors [5,6,7]. This challenge is particularly acute in rapidly growing megacities characterized by high-density, highly glazed commercial high-rise typologies. Historically, the design paradigms of the late 20th and early 21st centuries favored expansive glass curtain walls to enhance daylighting and aesthetic appeal. However, these envelope configurations have introduced substantial thermal liabilities, resulting in acute microclimatic perturbations, high solar heat gains in summer, and severe steady-state transmission losses in winter, which fundamentally compromise perimeter thermal equilibrium. [8,9,10]
The dual seasonal thermal penalty of highly glazed envelopes is schematically illustrated in Figure 1.
The thermal performance of modern building envelopes is defined by a fundamental thermodynamic asymmetry: while contemporary opaque wall assemblies routinely achieve low thermal transmittances 0.15 W/(m²·K) [11,12].The high-performance triple-glazed units typically remain constrained to significantly higher values W/(m²·K) [13,14]. This persistent thermal resistance gap establishes transparent components as the primary thermal vulnerability of the building envelope across all operational seasons. As visualised in Figure 2, the severe thermal transmittance differential between the opaque wall assembly and the triple-glazed unit induces acute microclimatic perturbations across the envelope interface.
During summer, expansive transparent facades transmit substantial solar radiation, significantly increasing indoor temperatures and cooling loads [15,16]. In hot climates, solar radiation ingress can create a marked indoor-outdoor temperature differential, raising the inner glass surface temperature to as much as 43 °C and increasing the mean radiant temperature above the indoor air temperature [17]. Even highly insulated glazing can suffer from poor thermal performance in summer if solar control is inadequate, potentially causing indoor overheating [18]. The reliance on high-power air conditioning to counteract this solar heat gain drives building energy consumption far beyond that of opaque wall configurations [15]. Furthermore, the high solar reflectance of some advanced facades can cut cooling energy needs but may inadvertently increase outdoor heat stress in urban canyons [19].
In winter, the same glazing systems become a primary source of heat loss due to their characteristically high thermal transmittance compared to well-insulated opaque walls [20,21,22,23]. Under cold external conditions and standard indoor air setpoints, the internal surface temperature of passive triple glazing depresses. This low surface temperature triggers two distinct microclimatic failure modes:
- -
- radiant temperature asymmetry ). The cool glass surface creates directional long-wave radiative loss from an occupant’s body, depressing local :where is the internal surface temperature of the active window pane, K; represents the surface temperatures of surrounding opaque internal boundaries K; is the person-to-surface view factor is the occupant-to-window geometric view factor; n is the total count of internal enclosure boundaries;
- -
- buoyancy-driven convective downdraughts. Room air in direct contact with the chilled glass undergoes rapid cooling and density increase. This chilled air mass detaches from the glass boundary, cascading downwards as a high velocity convective plume ( 0.15—0.30 m/s) [24]. Upon reaching the floor, it spreads laterally, penetrating the occupied perimeter zone (0.5–1.0 m) and elevating the draught rate at ankle height.
Consequently, passive glazing creates a thermodynamic conflict: maintaining a nominal air temperature (Tint= +20 ) fails to prevent localized dissatisfaction (PPD > 10%) near the perimeter [25].
To overcome the physical limitations of static, passive barriers, “active” glazing technologies have emerged as a highly promising alternative. Electrically heated windows, which integrate a transparent conductive coating or an ultra-thin polymer-based heating foil within the glazing cavity, can actively modulate the glass surface temperature [26,27,28]. By regulating to match or slightly exceed , active glazing replaces the cold boundary with a controlled radiant surface, eliminating radiant temperature asymmetry and suppressing boundary-layer downdraughts [29,30]. Rather than calculating comfort metrics based on fixed window dimensions, thermal comfort criteria are specified as mandatory boundary conditions (e.g., ISO 7730 category B: ). This allows direct mathematical optimization of the window-to-wall ratio (WWR) and active surface heat flux density (qelec) [31,32]. Empirical studies show that active TGUs can direct up to 85% of generated thermal energy indoors, reducing overall heating demand by up to 65.6% under targeted control [33,34]. To render these systems fully sustainable and mitigate the risk of grid overloading during peak winter hours, contemporary research advocates for the integration of localised energy buffering. By coupling the active facade with decentralised renewable sources, such as building-integrated photovoltaics and advanced storage mediums, these systems offer a realistic pathway toward self-powering, high-performance architectural envelope [35,36].
To provide a comprehensive technical baseline of how passive, active, and dynamic glazing solutions influence building energy management and microclimatic stability, Table 1 systematically maps recent state-of-the-art literature.
As evidenced by the synthesized literature mapped in Table 1, dynamic technological strides have profoundly enhanced the energy autonomy and operational efficiency of active glazing systems. However, existing building physics research predominantly evaluates transparent active envelopes through macro-level building performance metrics, specifically bulk thermal transmittance (U-value), overall solar heat gain coefficients (SHGC), and integrated annual space-heating loads. While minimising transmission heat loss remains paramount for nearly zero-energy building regulatory compliance, the ultimate operational mandate of any architectural envelope is to sustain a stable, healthy, and thermally acceptable indoor microclimate for its occupants. Consequently, energy conservation strategies must not be decoupled from their direct biothermal impact on local human thermal comfort.
The complex conjugate heat transfer and biothermal interactions between the human body and the highly asymmetrical radiant field generated by a passive cold window, as opposed to an actively modulated transparent thermal barrier, remain insufficiently quantified in current literature. Traditional multi-pane glazing units, despite incorporating low-emissivity coatings and noble gas cavities, inherently induce acute localized discomfort during winter periods. This degradation stems from three primary physical mechanisms: depressed inner glass surface temperatures (), high plane radiant temperature asymmetry ()., and buoyancy-driven convective downdraughts ( > 0.20 m/s ).
In contrast, active electrically heated glazing transforms the transparent envelope from a structural thermal bridge into a controlled, low-temperature radiant heating surface. To address the existing knowledge gap, Fanger’s classic heat balance framework must be integrated directly into the thermodynamic evaluation of the envelope boundary layer. Fanger’s model provides the theoretical bridge between environmental heat fluxes and human thermal sensation, quantified via the predicted mean vote (PMV) and predicted percentage of dissatisfied (PPD) indices (ISO 7730; ASHRAE Standard 55).
Prior computational fluid dynamics and empirical investigations confirm that low surface temperatures on vertical transparent barriers generate intense convective cooling loops, initiating air detachment that severely degrades the microclimate in perimeter zones. Microclimatic analyses by Manz and Frank [66] alongside foundational turbulence models established by Fanger et al. [67], demonstrate that these boundary-layer downdraughts trigger unacceptable draught rates (DR > 20%) within immediate occupant spaces. Conversely, elevating via conductive transparent oxide layers directly elevates the local mean radiant temperature () and neutralises convective downdraught boundary layers, thereby expanding the usable floor area towards the envelope perimeter [68,69].
To bridge this critical knowledge gapbetween macro-level building energy efficiency and localized indoor environmental quality by formulating, empirically validating, and energetically optimizing an autonomous electro-thermal active glazing system designed to eliminate cold-pane effects and guarantee thermal comfort across severe sub-zero boundary conditions.
To achieve this overarching goal, the study addresses the following specific objectives:
- -
- to empirically quantify conjugate heat transfer mechanisms, surface temperature dynamics, and boundary-layer suppression across an active triple-glazed unit subjected to simulated exterior conditions down to −25.0 °C within a dual-zone climatic chamber;
- -
- to evaluate microclimatic impacts and human thermal comfort performance at critical workstation proximities (x = 0.5 m to 1.0 m) using high-resolution spatial mapping of Fanger’s indices (PMV, PPD, and DR) under both passive and active operating regimes;
- -
- to investigate transient control stability and energetic viability by assessing closed-loop PID response metrics, thermal inertia, and continuous electrical power density scaling across variable climate transitions;
- -
- to establish an architectural scalability model that determines the maximum permissible window-to-wall ratio WWRmax enabled by active thermal regulation, successfully reconciling high transparency demands with stringent indoor comfort mandates.
2. Materials and Methods
2.1. Dual-Zone Climatic Chamber, Envelope Component Configuration and Experimental Setup
To evaluate the conjugate heat transfer dynamics and localized microclimatic perturbations across the building envelope interface under severe winter operational regimes, empirical investigations were performed using a specialised dual-zone climatic chamber at the Laboratory of Energy-Efficient Technologies, Kielce University of Technology. The central dividing septum incorporates a highly insulated opaque wall envelope (=0.15 W/(m2⋅K) accommodating a representative modular double-cavity triple-glazed unit (TGU) with a clear vision aperture of 520 mm × 780 mm (aspect ratio H/W = 1.5) and a nominal thermal transmittance of =1.1 W/(m2⋅K). The transparent assembly features a symmetrical 4/18/4/18/4 mm pane configuration (K-Glass ESG 4 / 18 Ar / Float 4 / 18 Ar / K-Glass ESG 4). The outer and inner boundary panes consist of 4mm toughened safety glass coated with a durable pyrolytic low-emissivity layer (K-Glass), whereas the central pane comprises an un-toughened 4 mm clear float glass. Perimeter structural integrity and gas containment are provided by 18 mm aluminium spacer bars backfilled with a molecular sieve desiccant, connected at the corners via primary butyl-sealed poly-vinyl chloride key connectors. Secondary weatherproofing, edge-seal protection, and mechanical adhesion are established using a single-component neutral-cure silicone sealant (Modesil NO 33, Lakma). The experimental facility comprises an exterior environmental compartment engineered to maintain sub-zero ambient temperatures down to under controlled convective conditions, and an interior occupant compartment regulated at a constant indoor setpoint of Tin= 20 ℃ with a relative humidity of RH = 50% ± 2.5% (Figure 3).
Non-contact surface temperature distribution and thermal gradient uniformity across the entire transparent area were verified using a calibrated Testo 872s thermal imaging camera. Continuous heat flux density profiles (qsurf, W/m2) were recorded across the 3 x 3 grid using nine Hukseflux FHF05 sensors connected to the HIOKI LR8432 logger. (Figure 4). To systematically track boundary layer development, edge losses, and thermal heat injection from the heating element, the 18 sensors were mapped in Cartesian coordinate matrix across the 520 mm × 780 mm aperture (Figure 4b).
An active resistive heating element (ThermoTECH flexible heating foil, Conrad Electronic) with a nominal electrical power rating of was centered horizontally along the lower boundary on Surface 5. In addition to gas and surface temperature monitoring, localized surface heat flux densities and effective thermal transmittance were continuously tracked using nine Hukseflux FHF05 thin-film flexible heat flux sensors possessing a nominal sensitivity of approximately 20 µV /(W/m2) (Figure 4b). Output signals from this flexible array were acquired and logged via a high-precision Hioki heat flow logger LR8432. In order to guarantee metrological fidelity and the exact reproducibility of the experimental setup, a comprehensive overview of the technical specifications, sensor accuracy, and functional roles of all utilized equipment is detailed in Table 2.
2.2. Microclimatic Comfort Assessment and Fanger Thermal Comfort Model
To comprehensively evaluate the indoor environmental quality benefits and potential localized discomfort risks induced by the active glazing assembly, multi-point microclimatic measurements were conducted within a specialized full-scale climatic chamber facility featuring an integrated external wall and window test bench. Measurements were performed across the full spectrum of standardized ISO 7730 vertical elevations: z = 0.1 m (ankle level), z = 0.6 m (lumbar height), z = 1.1 m (seated head height), and z = 1.7 m (standing head height)) at two critical horizontal offsets from the internal glass surface (x = 0.5 m representing the immediate proximity zone and x = 1.0 m denoting the standard human occupancy zone). All physical parameters were captured via a Testo 400 multifunction IAQ meter equipped with high-accuracy sensors (air temperature accuracy of , air velocity accuracy of , and a class 1 globe thermometer). The thermal performance and resulting human thermal comfort indices of the active facade were systematically investigated across a wide-ranging spectrum of external boundary conditions (spanning from ). Complete parametric datasets for all evaluated external temperatures are compiled in the supplementary materials (Table S1–S6).
The thermal load on the human body (L) represents the differential between internal metabolic heat production and the total heat flux density dissipated to the surrounding domain, :
The aggregated internal and external heat loss density is formulated as:
where is the partial water vapour pressure, Pa, is the outer clothing surface temperature, ∘C, and is the convective heat transfer coefficient, W/(m2⋅K). The clothing surface temperature is determined iteratively via energy equilibrium:
where is the metabolic rate, corresponding to sedentary office activity; is external mechanical work (W = 0 W/), is water vapour partial pressure, Pa; is local air temperature, ; is mean radiant temperature, ; is the clothing surface area factor. Standard winter clothing insulation of = 1.0 clo (0.155 m2 K/W) was assumed.
The predicted percentage of dissatisfied (PPD) index is directly linked to
Local convective boundary-layer acceleration and turbulence intensity (TU) were logged at ankle height (z = 0.1 m) using the Testo omnidirectional hot-wire anemometer. The local draught rate (DR, %) was evaluated as:
where TU is the empirical turbulence intensity, % logged at 10Hz., . TU=
Spatial compliance is categorized strictly against ISO 7730 thresholds:
Category A:
Category B:
Category C:
2.3. Microclimate Characterisation and Boundary Assumptions
All microclimatic measurements were conducted under steady-state nocturnal winter design conditions, assuming zero short-wave solar irradiance (Gsol = 0 W/m2). The localized mean radiant temperature ( was derived directly from long-wave equilibrium energy balance captured by the Testo black globe thermometer probe following ISO 7726:
where is the equilibrium globe temperature, , is the local air temperature is the local air velocity m/s; is the globe surface emissivity, = 0.95; and D is the globe diameter, D= 0.15 m. The operational temperature was subsequently evaluated as.
Plane radiant temperature asymmetry across the vertical glazing boundary was calculated in accordance with ISO 7730 based on directional surface emissivities and surface-to-point view factors ():
2.3. Analytical Derivation of the Maximum Permissible Window-to-Wall Ratio
To extend the empirical findings obtained from the modular active glazing specimen (820 mm x 560mm) to a full-scale building envelope configuration, an analytical optimisation model was formulated. Rather than evaluating the building envelope solely at a singular peak design load, the model evaluates the maximum permissible window-to-wall ratio (WWRmax) across a continuous outdoor temperature domain This thermal sweep encompasses the full operational spectrum, from extreme sub-zero peak winter conditions ( = ) to typical mild winter and shoulder-season regimes ( = 5.0).
The objective of the model is to derive the WWRmax that guarantees compliance with ISO 7730 Category A standards (maintaining PPDperimeter ≤ 6% while simultaneously minimising active electrical energy consumption. Under a regulated indoor air setpoint of = 20.0 , Category A mandates a minimum spatial mean radiant temperature threshold of .
The inner surface temperature of the unheated glass pane (surface 6), is governed by the steady-state thermal resistance network between the indoor environment () and the variable outdoor cold sink ():
where =1.1 W/(m2⋅K) is the nominal glazing thermal transmittance, and is the standardized internal combined convective-radiative heat transfer coefficient in accordance with EN 673, = 7.7 W/(m2⋅K).
Upon energising the integrated ThermoTECH active heating layer at an electrical power flux density with a thermal transformation efficiency of 0.95, the modulated active inner surface temperature is expressed as:
Expressing the spatial radiant field as a function of the transparent envelope fraction (WWR = and the occupant-to-window view factor yields the dynamic envelope optimization constraint:
where represents the internal surface temperature of the highly insulated opaque wall assembly, .
Explicitly rearranging equation (11) yields the governing equation for under active dynamic regulation:
3. Results
3.1. Conjugate Heat Transfer and Surface Heat Flux Density Profiles
3.1.1. Spatial Experimental Heat Flux Profiles Under Extreme Sub-Zero Boundary Conditions
The spatiotemporal thermal behaviour of the room-facing glass surface (Surface 6) was mapped using a 3 x 3 array of thin-foil Hukseflux FHF05 heat flux sensors under controlled environmental conditions. The experimental protocol evaluated the glazing assembly across an external climate chamber temperature range of . Comparative evaluations were conducted between the baseline unheated (passive) state and three active heating set points (=30, 40, and 45.
Under the unheated extreme cold baseline condition (Figure 5a), the glazing assembly operates purely as a passive thermal barrier. In this state, heat flux density across all nine sensor locations remains strictly negative, oscillating between and , with a space-averaged mean of = across the central aperture. Heat transfer is governed by a series conductive-convective thermal resistance network driven by the macro-scale thermal differential between the ambient indoor environment ( = 20 )) and the cold environmental chamber (). Spatial non-uniformity across the 3x3 grid is notable even in the passive state. Sensors along the bottom edge (C7, C8, C9) record consistently more negative values than those in the upper tier (C1, C2, C3) (Figure 4b). This spatial thermal heterogeneity stems directly from the interplay of two coupled heat transfer mechanisms. Firstly, conductive thermal bridging through the peripheral warm-edge spacer frame depresses localized surface temperatures along the glazing margin. Secondly, buoyancy-driven natural convection within the hermetically sealed argon cavity causes dense, cooled gas to cascade along the outer pane and pool near the lower spacer, thereby establishing a persistent, localized thermal sink at the base of Surface 5. The bottom tier of the glass assembly, tracked by Sensors 7, 8, and 9 (Figure 5a), suffers from the most severe thermal losses, with heat flux values ranging from W/m² down to W/m² (space-averaged mean . This significant acceleration of heat loss at the base of the glazing is driven by two synergistic physical phenomena. As argon gas within the cavity is cooled along the exterior pane (Surface 4), its density increases rapidly. The cooled gas cascades downward as a high-velocity boundary layer downdraft and pools at the bottom of the cavity. This cold gas reservoir creates a severe localized heat sink on the cavity side of Surface 5, dramatically steepening the conductive thermal gradient across the bottom section of the inner glass pane. Conductive short-circuiting through the lower warm-edge spacer assembly and frame interface further depresses the local surface temperature ). Consequently, cold room air cascades downward along Surface 6, creating a localized cold-draft zone that significantly degrades occupant indoor thermal comfort and increases condensation risk along the lower edge.
3.1.2. Parametric Heat Flux Response Across Active Thermal Setpoints
The experimental internal surface heat flux densities and corresponding mean inner pane temperatures are illustrated in Figure 6.
The empirical evaluation of the nine-node active glazing array (C1–C9) conducted within a controlled climatic chamber environment under varying thermal setpoints reveals profound spatial heterogeneities in heat transfer dynamics across the building envelope interface. As delineated in Figure 6, the internal surface heat flux density () exhibits a strong non-linear dependency on external ambient temperatures descending to , a condition primarily driven by coupled conductive and radiative interactions between the centre of glass and perimeter edge zones. Under low-temperature operation at a modest , all sensor nodes (C1–C9) remain within the negative heat flux regime, signifying a persistent net heat loss towards the internal environment, wherein the upper and central nodes experience severe thermal depression reaching values as low as = at an external temperature of . Conversely, the perimeter edge nodes (C7–C9) demonstrate significantly attenuated heat loss profiles, a phenomenon attributable to frame-induced thermal bridging and localised insulation effects that modulate the convective exchange. Elevating the interlayer setpoint to shifts the baseline thermal flux curves upward, thereby mitigating extreme negative heat fluxes at the upper perimeter; however, a pronounced convergence and overlapping of intermediate nodes (C2–C6) is observed under severe sub-zero boundary conditions of , which indicates that uniform internal heating fails to adequately compensate for the multidimensional edge cooling effect in the absence of dynamic power modulation. This interplay reaches a critical juncture at the maximum experimental setpoint of , where a distinct thermodynamic phenomenon of gradient inversion occurs. Whilst the nodes (C1–C6) maintain a conventional negative heat loss profile even under extreme cold, the lower perimeter edge nodes (C8 and C9) transition into the positive quadrant, achieving peak inward heat flux densities of at .
3.1.3. Active Perimeter Heating Dynamics and Rayleigh–Bénard Convective Regimes Under Extreme Sub-Zero Boundary Conditions
Energising the ThermoTech polyester heating foil located along the lower perimeter of Surface 5 fundamentally restructures the conjugate heat transfer dynamics across the inner glass pane. Heat generated at the Surface 5 interface conducts transversely through the glass pane thickness () to Surface 6 according to Fourier’s law:
As the active setpoint is systematically increased from =30 to =45 (Figures 5b–5d), the indoor surface temperature () elevates, shifting the entire heat flux matrix upward toward the zero-loss boundary () (Table 3).
At setpoint =30 and at = (Figure 6b) thermal losses along the bottom perimeter are significantly attenuated. The heat flux recorded by Sensor 8 (bottom center) rises from its passive baseline value of to an average of , cutting transmission losses along the lower edge by 54.2%.
At setpoint (Figure 6c) the system establishes a near-adiabatic thermal barrier along the lower central axis. Sensor 8 operates at a mean heat flux of (with transient minimum losses of ). His localized thermal injection eutralizes the cold draft originating from the environmental chamber. In setpoint (Figure 6d) maximum active heating forces heat flux values across the lower glazing region to cross the zero-loss threshold into positive territory. Sensor 8 reaches an average flux of 9.4 during steady state, but experiences transient positive peaks up to 14.9 . Similarly, Sensor 9 reaches 14.6 . At this setpoint, Surface 6 transitions from a net energy sink into an active low-temperature radiant panel, delivering direct net thermal gains into the indoor room.
A prominent feature of the transient flux response under high active setpoints ( and ) is the appearance of high-frequency temporal signal oscillations across all sensor channels (Figure 6c and Figure 6d). This behavior is driven by fluid flow instabilities within the sealed argon-filled cavity II. When the lower portion of Surface 5 is heated to against an external pane temperature near , an intense horizontal temperature gradient ) is established across the cavity gap width (b). This differential elevates the local Rayleigh number above its critical value :
where is the gravitational acceleration; is the volumetric thermal expansion coefficient of argon, is the kinematic viscosity, and is thermal diffusivity.
Exceeding this critical buoyancy threshold incites Rayleigh–Bénard natural convection within the gas domain, effectively transitioning the argon gap from a quiescent state into a dynamically recirculating thermal regime. This fluid-dynamic transition proceeds via a dual-boundary-layer circulation mechanism. Firstly, a buoyancy-driven ascending plume develops along the heated lower segment of Surface 5. Argon gas immediately adjacent to this thermal boundary undergoes rapid volumetric expansion and consequent density reduction, generating a positive buoyancy vector that accelerates the fluid upward. Concurrently, a descending cold plume dominates the opposing boundary; upon impinging on the upper cavity limit and transferring thermal energy to the cold outer glazing (Surface 4), the gas experiences a sharp increase in density, cascading downward as a chilled down-draught.
Within the cavity core, these counter-flowing boundary-layer streams interact intensely, establishing a high-shear zone. This velocity differential induces flow instabilities characterized by periodic vortex shedding. As these turbulent eddies intermittently impinge upon Surface 5, they provoke localized, transient perturbations in the internal convective heat transfer coefficient (). Consequently, these thermal pulses propagate conductively through the glazing thickness and are recorded by the room-side sensors as the high-amplitude, high-frequency heat flux oscillations observed during active thermal regulation.
3.2. Thermographic Surface Mapping and Spatial Temperature Profiles on the Inner Glazing Surface Across Climatic Regimes
To evaluate the conjugate heat transfer dynamics and localised microclimatic perturbations across the triple-glazed unit, experimental investigations were conducted within a specialised dual-zone climatic chamber. Instead of presenting a continuous sequence of thermograms for every temperature increment, the analysis synthesises the system’s thermal response by focusing on four discrete, representative winter boundary conditions. This approach highlights the baseline performance under extreme frost while mapping the parametric trends across a broader operational spectrum. High-resolution thermographic images captured by the calibrated Testo 872s IR camera confirmed the spatial uniformity of the thermal boundary layer across the active sightline area 520 mm × 780 mm, while surface temperatures across the inner glazing were additionally measured using array-mounted Hukseflux sensors, with all experimental data continuously recorded via a high-precision Hioki data acquisition system.
Under the passive baseline regime at an external ambient temperature of (Figure 7a), the room-side glazing surface (Surface 6) exhibited pronounced thermal bridging effects. Infrared thermography and synchronized hukseflux sensor—hioke logs revealed a highly heterogeneous temperature distribution governed by multidimensional conductive heat transfer through the structural aluminium spacer bars, coupled with internal convective down-draughts. Quantitatively, under this severe boundary condition, the minimum surface temperature at the lower-edge perimeter plummeted to (against a nominal indoor air temperature of = 20. This sharp local depression generated an intense thermal sink, creating an elevated risk of surface condensation and significant occupant discomfort driven by localized radiant asymmetry.
; (b) Passive baseline (; (c) Active heating setpoint =30 ; (d) Active heating setpoint =40 (isothermal lower boundary achieved); € Active heating setpoint =45 (full surface transition to a radiant emitter).
Upon energising the lower-perimeter heating foil (Surface 5), the thermal profile of the triple-glazed unit was fundamentally restructured (Figure 7c–e). As the active set-point was sequentially increased from 30 to 40 and 45, both the thermographic and high-precision logging data captured a progressive upward propagation of the thermal front. At a heating set-point of (Figure 7c), the minimum perimeter temperature rose moderately to , effectively mitigating the severe thermal bridge identified during the passive baseline regime . Elevating the set-point to (Figure 7d) successfully neutralised the local edge cooling effect, elevating the perimeter temperature to , and establishing a near-isothermal temperature distribution across the lower quartile of the TGU aperture.
Under maximum thermal regulation () (Figure 7e), the perimeter temperature reached causing the entire fenestration surface to transition into an active low-temperature radiant emitter that completely suppressed cold down-draughts. Extending the empirical evaluation across the broader climatic setpoints , parametric thermographic and heat-flux sensor analysis confirms that the electrical power input required to maintain a strictly adiabatic boundary ) on Surface 6 scales linearly with the external temperature depression. Specifically, maintaining neutrality at required a proportional reduction in heating power of approximately 38.5% relative to the baseline. This highly predictable linear response verifies the operational stability of the system, enabling seamless integration with advanced building energy management systems for predictive, demand-responsive control.
To corroborate the thermographic findings and quantify the surface temperature distribution across the entire active aperture within the specialised climatic chamber, data gathered from the array of nine Hukseflux sensors and continuously logged via the Hioki high-precision data acquisition system were subjected to rigorous steady-state analysis. Figure 8 illustrates the extended steady-state thermal response of the room-side glazing surface, spatially averaged across the sensor matrix as a function of external ambient temperature under varying active heating set-points (30 °C, 40 °C, and 45 °C). Following data validation and spatial processing, the internal glazing temperature exhibits a robust, highly linear correlation across all tested thermal load regimes. Decreasing the external ambient temperature from +5 °C down to -25 °C induces a proportional reduction in , directly reflecting exacerbated conductive and convective heat losses through the building envelope.
The thermal performance curves systematically shift upward with incremental increases in the internal heater supply set-points. This demonstrates that under extreme conditions of , elevating the set-point from to raises the mean internal glazing temperature from approximately to . This consistent upward shift effectively mitigates downdraught phenomena and maintains inner surface temperatures well above critical dew-point thresholds. Furthermore, the near-parallel trajectories of the characteristic curves indicate stable, invariant heat transfer coefficients throughout the tested climatic range, confirming the reliability and repeatability of the dataset.
3.3. Microclimatic and Thermal Comfort Assessment Near the Active Glazing Assembly
Evaluating microclimatic conditions near active building envelopes is essential to ensure that integrated heating technologies successfully eliminate localized discomfort, such as cold downdraughts or thermal stratification, while maintaining adequate indoor environmental quality. Building upon the experimental framework and measurement procedures detailed in Section 2.2, the empirical data obtained from the full-scale climatic chamber tests are analyzed to quantify the spatial thermal performance of the active glazing assembly. It must be noted that while this controlled chamber environment enables precise parametric mapping under defined thermal boundaries, it inherently abstracts from stochastic real-world phenomena, such as variable solar irradiance, dynamic wind pressures, and transient internal gains. Consequently, the findings reflect idealized boundary interactions rather than full operational complexity. While complete numerical datasets for all tested boundary conditions are compiled in the supplementary materials (Table S1 and Table S2), the following subsections examine key microclimatic parameters, including local temperatures, air velocity, and thermal comfort indices (PMV, PPD, and DR), across representative operational regimes.
3.3.1. Perimeter Down-Draught Mitigation and Microclimatic Dynamics Under Extreme Sub-Zero Environmental Condition
Under extreme sub-zero environmental condition, the structural and thermal resilience of the active façade undergoes a rigorous stress evaluation. As visualised in the vertical profiles for the near-window boundary at x = 0.5 m (Figure 9), operating under a low heating setpoint (), results in local microclimatic conditions that are heavily penalised by radiant asymmetry and aggressive convective cooling along the internal glass pane. The low mean radiant temperature near the unconditioned perimeter causes the PMV at ankle level (z = 0.1 m) at x = 0.5 m to drop to , corresponding to an elevated PPD of 20.4% and a draught rate (DR) of 14.2%, thereby confirming the persistence of cold downdraught phenomena driven by natural convective cooling along the internal pane. Moving outward to x = 1.0 m (Figure 10), these adverse gradients attenuate moderately, yet local discomfort persists with an ankle-level PMV of and PPD of 13.0%.
Elevating the transparent resistive heating layer setpoint to significantly mitigates these spatial heterogeneities, raising the indoor operative temperature profile and reducing local PPD below the 10% threshold recommended by ISO 7730 for standard conditioned spaces across both horizontal offsets. At the maximum operational setpoint the active glazing successfully transitions into an active radiant heating source. The radiant asymmetry is entirely reversed, raising interior surface and globe temperatures to generate a slight positive PMV (+0.39 at z = 1.1 m for x = 0.5 m, and +0.43 for x = 1.0 m) that effectively counteracts envelope-induced thermal dissatisfaction, albeit requiring sophisticated, dynamic modulation controls to prevent minor localized warmth sensations in immediate proximity to the façade.
3.3.2. Microclimatic Dynamics Under Intermediate Winter Boundary Conditions
Under moderate sub-zero environmental forcing (), the structural stress on the active façade diminishes significantly compared to extreme frost conditions, allowing for more energy-efficient operational regimes. As visualised in the vertical microclimatic profiles for the near-window boundary at x = 0.5 m (Figure 11), operating under a baseline heating setpoint (),) results in a mild suppression of local air temperatures, yielding an ankle-level (z = 0.1 m) local air temperature of 17.8 and a corresponding PMV of Crucially, due to the reduced thermal head across the glazing assembly, the PPD at ankle level remains at 11.2%, hovering just above the 10% threshold stipulated by ISO 7730 for Category B environments, while the DR peaks moderately at 10.1%. Moving outward to the extended occupancy zone at x = 1.0 m (Figure 12), convective currents attenuate further, with baseline local discomfort subsiding such that the PPD fully complies with standard criteria across all elevations. The implementation of an intermediate active heating setpoint completely eradicates localized cold discomfort, stabilising the indoor microclimate. At this setpoint, the ankle-level PPD drops well below 6%, and the thermal comfort indices achieve optimal uniformity across both horizontal offsets (x = 0.5 m and x = 1.0 m). Conversely, elevating the active glazing to the maximum operational setpoint () under these intermediate external conditions leads to an over-correction. The thermal output generates strong buoyant plumes that elevate upper-level PMV values up to +0.72 at z = 1.7 m, accompanied by an elevated PPD of 8.2% driven by minor local warmth sensations.
3.3.3. Over-Heating Risks and Setpoint Modulation in Mild Regimes
Under mild transitional winter conditions (), the thermal demand on the active building envelope decreases substantially, shifting the operational focus from severe cold mitigation to fine-tuned indoor environmental quality control and overheating prevention. As visualised in the vertical microclimatic profiles for the near-window boundary at x = 0.5 m (Figure 13), operating under a baseline heating setpoint yields stable local air temperatures ranging from 18.3 at ankle level z = 0.1 m to 20.0 at head level z = 1.7 m.
Despite the mild exterior temperature, the PMV at the perimeter remains slightly negative, registering at ankle level and improving to at the upper boundary. Crucially, the PPD remains well below the 10% threshold mandated by ISO 7730, peaking at 8.5% near the floor and dropping to 7.4% at z = 1.7 m, while the DR remains acceptable with a maximum of 9.2%. Moving to the extended occupancy zone at x = 1.0 m (Figure 14), these profiles shift further towards thermal neutrality, with baseline PPD values stabilising near or below 6.2%.
Deploying an intermediate active heating setpoint successfully eliminates any remaining sub-neutral bias, aligning indoor thermal conditions closely with optimal comfort standards. At this intermediate setting, the PPD across the vertical profile at x = 0.5 m flattens uniformly at approximately 5.1%, while global operative temperatures reach comfortable levels. Conversely, applying the maximum operational setpoint under a mild external forcing of 0.0 leads to pronounced thermal over-servicing. The excessive radiant and convective output elevates upper-level PMV values up to +0.82 at z = 1.7 m (x = 0.5 m) and drives the PPD at x = 1.0 m as high as 19.0% due to local thermal dissatisfaction associated with overheating.
3.4. Transient Dynamic Response and Closed-Loop PID Control Stabilityand Power Demand Analysis
The transient thermal response of the active glazing assembly was evaluated by subjecting the system to standardized step-change perturbations in external boundary conditions, simulating sudden transition from mild to severe winter design scenarios. The closed-loop control framework, managed by the Lumel RE72 PID controller, was monitored with a temporal resolution of using the HIOKI LR8432 data acquisition system. The primary feedback loop utilized surface-mounted Omega SA3-K thermocouples (Type K, Class 1) to provide real-time surface temperature to the PID algorithm. Simultaneously, the HIOKI logger captured the active power density by monitoring the RMS voltage drop across the ThermoTECH heating foil. This high-fidelity synchronous logging enabled the calculation of the controller’s transient performance indicators, providing a comprehensive metric of the system’s ability to maintain the target setpoint despite fluctuating external thermal loads. The derived performance metrics are synthesized in in Table 4.
An analysis of the dynamic performance indicators compiled in Table 4 reveals distinct behavioural trends governed by the macro-thermal inertia of the active triple-glazed units. As environmental severity increases, with external temperatures dropping from to alongside proportional setpoint elevations, the required active heat flux density expands significantly. This operational shift results in a proportional elongation of both the rise time, which increases from 12.4 min to 22.6 min, and the settling time, scaling from 28.6 min to 51.8 min. Such responses highlight the robust thermal mass damping capacity inherent in advanced multifunctional glazing systems. Despite aggressive actuator modulation necessitated by severe sub-zero thermal gradients reaching down to, the refined PID tuning framework effectively restricts percentage overshoot to OS3.1%. This tight constraint prevents localized thermal expansion stresses that could otherwise compromise the structural integrity of pyrolytic low-emissivity coatings. Furthermore, the cumulative tracking penalty, quantified by the Integral of Time-weighted absolute error (ITAE) index over an evaluation horizon of . Furthermore, (ITAE) index scales from under mild operational conditions to under severe winter environments, accurately capturing the extended transient adjustment phase required to stabilise massive thermal loads. Crucially, across all evaluated operational profiles, the steady-state error remains tightly bounded between ±0.03 and ±0.05 .
To maintain a raised inner surface temperature against aggressive external thermal forcing the active coating must supply a precise heat flux density. Under steady-state conditions, the required active heat flux compensates for the total outward thermal losses through the triple-glazed unit envelope, governed by the the overall thermal transmittance (U-value) of the assembly. The steady-state active heat flux density and total electrical power demand were quantified across the complete spectrum of environmental boundary conditions. Given the aperture area of A = 0.4056 m2 and a maximum rated heating capacity of Pmax= 60.0 W at a severe design gradient of = 70.0 K, the thermal power demand scales linearly with boundary severity (Table 5).
As demonstrated in Table 5, the steady-state heat flux density increases from , 21.43 W) under mild transition conditions () up to a peak design load of ) under severe winter conditions.
3.5. Parametric Validation of the Maximum Permissible Window-to-Wall Ratio
To evaluate the scalability and practical architectural impact of the proposed active electro-thermal glazing system, the empirical parameters validated on the laboratory test specimen were rigorously extrapolated to a standard architectural window module representative of modern facades dimensions 1.23 m×1.48 m. Maintaining the validated area coverage ratio , the active heating foil area was scaled proportionally to . This methodological transition ensures that the local electrical power density translates into a consistent global effective active power flux density of = across the entire standard fenestration. Furthermore, the occupant-to-window angle factor was adjusted to reflect a typical perimeter workstation distance of 1.0 m . The analytical matrix was executed across a continuous winter outdoor temperature domain from −25.0 to +5.0 with a ΔT=5.0K resolution. The boundary conditions incorporated an indoor air setpoint of , an internal convective heat transfer coefficient of = 7.7 W/(m2⋅K), and a highly insulated opaque wall thermal transmittance of W/(m2⋅K). o reflect realistic engineering practices and address potential over-conservatism in architectural design, the optimization model was evaluated across three distinct indoor environmental quality thresholds based on ISO 7730 standards:
- -
- category A: strict comfort requiring a spatial mean radiant temperature
- -
- category B: moderate comfort allowance,
- -
- category C: relaxed threshold for rare, extreme weather events,
The resulting inner surface thermal states and corresponding maximum permissible window-to-wall ratios WWRmax under both passive and active regimes are synthesized in Table 6.
As evidenced by the numerical data in Table 6, relying on conventional passive triple-glazed assemblies =1.1 W/(m2⋅K). severely restricts architectural design freedom during severe winter conditions. At an external design temperature of , the inner glass surface temperature drops critically to +13.57, forcing architects to restrict the facade transparency ratio to a restrictive 24.6% to prevent localized thermal discomfort.In stark contrast, activating the closed-loop electro-thermal heating system elevates the inner glass pane temperature above the indoor ambient setpoint, maintaining even under extreme boundary conditions. This effectively eliminates the cold radiant sink, allowing a fully unconstrained WWRmax = 100.0% across the entire temperature spectrum. However, in standard engineering practice, designing strictly for category A under highly infrequent meteorological extremes is rarely economically or practically justified. If design criteria are relaxed to ISO 7730 category B or C during these severe frost periods, the maximum permissible passive WWR expands significantly, reaching 60.7% and 98.6% respectively at . This highlights a fundamental architectural trade-off: vast transparent envelopes can indeed be achieved passively, provided that occupants accept minor, transient microclimatic degradation during extreme weather peaks. In stark contrast, activating the closed-loop electro-thermal heating system decouples facade architectural layout from these physiological compromises. By elevating the inner glass pane temperature above the indoor ambient setpoint (maintaining even at , the active system effectively eliminates the cold radiant sink. This allows a fully unconstrained WWRmax = 100.0%while rigorously sustaining premium Category A comfort across the entire climatic spectrum, albeit accompanied by operational electrical energy input.
4. Discussion
The empirical and analytical findings of this study provide a comprehensive quantitative evaluation of conjugate heat transfer and local biothermal interactions across active electrically heated triple-glazed units under severe winter operating conditions. While contemporary building physics literature extensively validates the macro-level energy efficiency of passive high-performance glazing systems through bulk thermal transmittance (-values) and solar heat gain coefficients, the results of this investigation demonstrate that static thermal barriers remain constrained in their ability to maintain localized indoor environmental quality (IEQ) near transparent building envelopes.
4.1. Conjugate Heat Transfer and Surface Thermal Dynamics
Under the passive baseline regime , the room-facing glass surface ) exhibited severe thermal depressions down to 12.4, driving negative heat flux densities ranging from W/m2, as mapped across the 3x3 Hukseflux FHF05 sensor array (Figure 4 b). In alignment with the foundational observations in [24,66,70], this pronounced surface cooling triggered acute radiant temperature asymmetry and buoyancy-driven convective downdraughts. Consequently, occupants situated within the perimeter zone (x = 0.5m) experienced elevated local discomfort, characterized by predicted mean vote values dropping to PMV=and predicted percentage dissatisfied indices exceeding PDD=20.4% (Figure 10 and Figure 11), thus violating ISO 7730 Category B and C comfort thresholds. Conversely, integrating an active resistive heating foil along the lower perimeter of Surface 5 fundamentally restructured the thermodynamic boundary layer (Figure 4a). As evidenced by the spatial heat flux mappings in Figure 5b–d and Figure6, modulating the internal surface temperature via closed-loop PID control successfully eliminated the cold-pane effect across all evaluated thermal load regimes. At an active setpoint of , the glazing assembly established a near-adiabatic thermal shield along the lower boundary ; Table 3), suppressing perimeter draught rates and reducing PPD below the mandatory 10% threshold. Operating at the maximum experimental setpoint () induced a gradient inversion, transforming the fenestration surface into a low-temperature radiant emitter that delivered net inward thermal gains up to +43.1; Figure 6d). Furthermore, the steady-state thermal response curves illustrated in Figure 8 confirm a highly linear correlation between internal glazing temperatures and external ambient temperatures, verifying the predictive reliability of the thermal boundary model.
From a fluid-dynamic perspective, the emergence of high-frequency temporal heat flux oscillations under high active setpoints and underscores the complex conjugate interactions within argon-filled cavities. When horizontal temperature differences across Cavity II exceeded critical Rayleigh number thresholds (Ra > ), the gas domain transitioned from a quiescent state into a dynamically recirculating Rayleigh–Bénard convection regime. Periodic vortex shedding and thermal plume interactions generated transient fluctuations in convective heat transfer coefficients, highlighting the necessity of advanced predictive control algorithms to stabilize active facade performance.
Authors should discuss the results and how they can be interpreted from the perspective of previous studies and of the working hypotheses. The findings and their implications should be discussed in the broadest context possible. Future research directions may also be highlighted.
4.2. Microclimatic Implications and Human Thermal Comfort Performance
A critical contribution of this study is the high-resolution spatial mapping of microclimatic parameters across standardized vertical elevations and horizontal offsets (Figure 9, Figure 10, Figure 11, Figure 12, Figure 13 and Figure 14). Under extreme sub-zero conditions , passive configurations create severe microclimatic stratification, where ankle-level discomfort z = 0.1 m dominates due to the convergence of cooled boundary-layer air plumes. Implementing intermediate active heating successfully harmonized vertical temperature gradients, ensuring that PPD values remained strictly within ISO 7730 Category A and B limits (Figure 9c and Figure 10c, 11c, 12c). However, the microclimatic profiling under intermediate , and mild , boundary conditions (Figure 11, Figure 12, Figure 13 and Figure 14) revealed that static high-temperature setpoints can induce localized thermal over-servicing. Specifically, excessive radiant output under mild exterior forcing elevated upper-level PMV values up to +0.82 and increased PPD up to 19.0% due to local warmth dissatisfaction (Figure 14). This underscores the operational necessity of weather-compensated, adaptive PID control algorithms rather than fixed-temperature heating schedules.
4.3. Transient Control Stability and Energetic Viability
The closed-loop PID control framework demonstrated robust stability across all evaluated climatic transitions, as summarized in the dynamic performance indices compiled in Table 4. While rising external severity from from −25.0 to +5.0 naturally extended the thermal rise time from 12.4 to 22.6 min and settling time from 28.6 to 51.8 min due to the substantial thermal inertia of the triple-glazed assembly, the refined PID tuning restricted percentage overshoot to . This tight constraint is vital for preventing excessive thermal expansion stresses that could otherwise jeopardize the mechanical integrity of pyrolytic low-emissivity coatings. In terms of operational energy demand, steady-state active heat flux densities scaled proportionally with the external thermal gradient, ranging from 52.83 ( at to a peak design load of 147.93 () at (Table 5).
4.4. Architectural Scalability and Window-to-Wall Ratio Optimization
Extrapolating the empirical data to a standard architectural window module via the analytical optimization model yields profound implications for modern building (Table 6). Traditional passive glazing constraints force architects to restrict window-to-wall ratios WWR down to 24.6% at to avoid severe thermal discomfort near the perimeter. By maintaining active inner surface temperatures above through controlled electro-thermal regulation, the proposed system successfully eliminates cold radiant sinks, enabling an unconstrained maximum permissible window-to-wall ratio WWRmax=100% across the entire sub-zero temperature spectrum. This broadens the viable architectural design space, reconciling aesthetic and daylighting demands with stringent thermal comfort mandates. However, while achieving a fully unconstrained maximum window-to-wall ratio via active electro-thermal governance effectively eradicates cold radiant asymmetry and interior discomfort, the associated electrical power demand during extreme meteorological events warrants careful consideration regarding operational expenditures and grid stability. Unmitigated continuous operation under peak frost conditions would introduce a substantial burden on local electrical distribution networks. o reconcile high transparency with nearly zero-energy building (NZEB) mandates, the active glazing architecture must be integrated directly with building-integrated photovoltaics and localized electrical storage nodes. Because extreme sub-zero design temperatures typically coincide with high solar irradiation availability on vertical facades during clear winter days, BIPV generation can supply a significant fraction of the required low-voltage input. Furthermore, implementing advanced model predictive control frameworks ensures that thermal activation is neither continuous nor indiscriminate; instead, power is modulated dynamically—leveraging thermal inertia, targeted occupant zone occupancy, and predictive weather forecasting—to achieve effective peak shaving and maintain systemic energy neutrality.
4.5. Limitations and Future Research Directions
Despite the distinct advantages of utilizing a climatic chamber to isolate the thermodynamic performance of the active glazing system, certain methodological limitations must be addressed. While the controlled environment successfully eliminates external stochastic variables, it inherently restricts the direct replication of complex, multi-zone airflow interactions, dynamic occupant behaviours, and transient solar gains typical of fully occupied built environments. Additionally, idealized laboratory boundary conditions may deviate from the heterogeneous thermal fields encountered in real-world structures. Crucially, the empirical observations revealed that operating the active glazing at elevated surface set-points from to induces a transitional Rayleigh–Bénard convection regime within the argon-filled cavity, resulting in localized fluid-dynamic disturbances and transient heat flux oscillations. Furthermore, under milder winter conditions (e.g., ), unmodulated high-power inputs can cause thermal over-servicing, elevating the local PPD index up to 19% as a consequence of internal overheating. These findings underscore that active electro-thermal fenestration is highly sensitive to control methodologies; therefore, future implementation requires sophisticated, sensor-driven closed-loop algorithms (e.g., adaptive PID controllers) to dynamically modulate thermal output. Nevertheless, these controlled findings provide a robust and scientifically rigorous foundation for analytical optimisation models. Future research efforts will focus on long-term in-situ field monitoring within occupied nZEB testbed facilities to validate these active envelope strategies under genuine meteorological transients and adaptive user dynamics.
5. Conclusions
This study has comprehensively investigated the thermodynamic behaviour, conjugate heat transfer mechanisms, and localized microclimatic impacts of an autonomous, electrically heated active triple-glazed unit designed for nearly zero-energy buildings (NZEBs). By integrating Fanger’s thermal comfort framework with high-precision experimental data acquired from a dual-zone climatic chamber, the research bridges the critical gap between macro-level building energy efficiency and micro-level human thermal perception.
The principal findings of this investigation are summarized as follows:
- -
- under extreme sub-zero exterior boundary conditions, passive multi-pane glazing assemblies suffer from severe surface temperature depression along the lower edge perimeter, inducing acute radiant temperature asymmetry and buoyancy-driven convective downdraughts
- -
- energising the integrated low-voltage heating foil along the lower boundary of Surface 5 effectively restructured the boundary-layer dynamics. Active thermal regulation at set points from to successfully neutralized cold-pane effects, shifting the room-facing surface from a net thermal sink into a controlled, low-temperature radiant heating panel that delivered positive inward heat fluxes up to 43.1 ;
- -
- Spatial microclimatic mapping confirmed that active surface modulation successfully restored local thermal comfort within the critical occupant perimeter zone from x = 0.5 m to 1.0 m. The predicted percentage of dissatisfied (PPD) index was successfully maintained well below the ISO 7730 Category B threshold PPD < 10% across standardized vertical elevations;
Supplementary Materials
The following supporting information can be downloaded at the website of this paper posted on Preprints.org, Table S1. Microclimatic parameters and ISO 7730 comfort classification across experimental boundary conditions (x = 0.5 m, sedentary 1.2 met, 1.0 clo); Table S2. Comprehensive parametric microclimatic and thermal comfort performance at x = 1.0 m across all vertical elevations (z = 0.1, 0.6, 1.1, 1.7 m) with ISO 7730 classification.
Funding
This research was funded in whole or in part by the National Science Centre, Poland, Nr DEC—2025/57/B/ST8/01347, OPUS29 “Improving the efficiency of building energy systems in existing urban areas” . For the purpose of Open Access, the author has applied a CC-BY public copyright licence to any Author Accepted Manuscript AAM version arising from this submission.
Conflicts of Interest
The authors declare no conflicts of interest.
References
- Verma, S.K.; Sawai, N.M.; Patil, S. A systematic review of net zero energy buildings as components of climate neutral and sustainable cities. Discov. Sustain. 2026. [Google Scholar] [CrossRef]
- Liu, J.; Zhang, S.; Ma, M.; He, Y.; Wang, B. From Energy Efficiency to Carbon Neutrality: A Global Bibliometric Review of Energy Conservation and Emission Reduction in Building Stock. Buildings 2025, 15, 2051. [Google Scholar] [CrossRef]
- Rifaie, K.A.; Abu-Lebdeh, T.; Raees, N.A.; Fadiel, A.A.M. Cradle-to-Gate Assessment and Mitigation of Embodied Carbon in Commercial Buildings. Buildings 2026, 16, 928. [Google Scholar] [CrossRef]
- Guan, D.; Chen, Y.; Ren, K.; Sun, Y.; Wen, Q.; Liang, D.; Shan, Y. Urban morphology, not scale, dominates building-operational carbon emissions across 520 million buildings in China. 2025. [Google Scholar] [CrossRef] [PubMed]
- Eurostat. Energy Consumption in Households; European Commission: Luxembourg, 2024; Available online: https://ec.europa.eu/eurostat/statistics-explained/SEPDF/cache/58200.pdf (accessed on 15 July 2026).
- Luo, L.; Wu, R. Energy Saving Impact of an Inclined Solar Balcony in a Residential Building. Iran. J. Chem. Chem. Eng. 2026, e733973. [Google Scholar]
- Kosakiewicz, M.; Sitek, W.; Kurcjusz, M.; Jakimiuk, A. Decarbonization-Oriented Selection of Heating, Ventilation and Domestic Hot Water Systems in Multi-Family Buildings: Economic, Environmental, and Social Perspectives. Sustainability 2026, 18, 5603. [Google Scholar] [CrossRef]
- Radović, V. Density through the Prism of Supertall Residential Skyscrapers: Urbo-Architectural Type in Global Megacities. Sustainability 2020, 12, 1314. [Google Scholar] [CrossRef]
- Moghaddam, S.A.; Serra, C.; Gameiro da Silva, M.; Simões, N. Comprehensive Review and Analysis of Glazing Systems towards Nearly Zero-Energy Buildings: Energy Performance, Thermal Comfort, Cost-Effectiveness, and Environmental Impact Perspectives. Energies 2023, 16, 6283. [Google Scholar] [CrossRef]
- Al-Kodmany, K.; Ali, M.M. High-Performance Tall Buildings: An Overview of Recent Developments. Encyclopedia 2025, 5, 53. [Google Scholar] [CrossRef]
- Paulos, J.; Berardi, U. Optimizing the thermal performance of window frames through aerogel-enhancements. Appl. Energy 2020, 266, 114776. [Google Scholar] [CrossRef]
- Koshlak, H.; Piotrowski, J.Z.; Stepien, A.; Ciosek, A. Decarbonizing Residential Stock in Southern Poland: A Technical Roadmap to NZEB Standards Based on a Retrofit Through HVAC Modernisation and Nature-Based Solutions. Appl. Sci. 2026, 16, 1986. [Google Scholar] [CrossRef]
- Kitsopoulou, A.; Bellos, E.; Tzivanidis, C. An Up-to-Date Review of Passive Building Envelope Technologies for Sustainable Design. Energies 2024, 17, 4039. [Google Scholar] [CrossRef]
- Kowalczyk, Z.; Tomasik, M. Economic and Energy Analysis of the Operation of Windows in Residential Buildings in Poland. Energies 2023, 16, 6810. [Google Scholar] [CrossRef]
- Hwang, R.L.; Fang, P.L.; Chen, W.A. Impact of solar radiation on indoor thermal comfort near highly glazed façades in a hot-humid subtropical climate: An experimental evaluation. Build. Environ. 2023, 243, 110725. [Google Scholar] [CrossRef]
- Dong, Q.-Y.; Li, S.; Han, C. Numerical and experimental study of the effect of solar radiation on thermal comfort in a radiant heating system. J. Build. Eng. 2020, 101497. [Google Scholar] [CrossRef]
- Song, B.; Yang, L.; Bai, L. Field experimental study of the impact of solar radiation on the thermal comfort of occupants near the glazing area in an office building. Energy Build. 2025, 115422. [Google Scholar] [CrossRef]
- Marino, C.; Nucara, A.; Pietrafesa, M. Thermal comfort in indoor environment: Effect of the solar radiation on the radiant temperature asymmetry. Sol. Energy 2017, 144, 295–309. [Google Scholar] [CrossRef]
- Moreno Santamaría, B.; Del Ama Gonzalo, F.; Aguirregabiria, B.; Hernandez Ramos, J.A. Evaluation of Thermal Comfort and Energy Consumption of Water Flow Glazing as a Radiant Heating and Cooling System: A Case Study of an Office Space. Sustainability 2020, 12, 7596. [Google Scholar] [CrossRef]
- Kalmár, F.; Kalmár, T. Thermal Comfort Aspects of Solar Gains during the Heating Season. Energies 2020, 13, 1702. [Google Scholar] [CrossRef]
- Basok, B.; Davydenko, B.; Novikov, V.; Pavlenko, A.M.; Novitska, M.; Sadko, K.; Goncharuk, S. Evaluation of Heat Transfer Rates through Transparent Dividing Structures. Energies 2022, 15, 4910. [Google Scholar] [CrossRef]
- Larsson, U.; Moshfegh, B. Experimental investigation of downdraught from well-insulated windows. Build. Environ. 2002, 37, 1073–1082. [Google Scholar] [CrossRef]
- Chen, H.; Nie, J.; Liu, Y.; Li, Y. Theoretical Study on Impact of Solar Radiation Heat Gain on Thermal Comfort and Energy Efficiency in Glass Curtain Wall Buildings Based on PMV Index. Buildings 2025, 15, 2228. [Google Scholar] [CrossRef]
- Heiselberg, P. Draught risk from cold vertical surfaces. Build. Environ. 1994, 29, 297–301. [Google Scholar] [CrossRef]
- Sarmouk, M.; Merabtine, A.; Kheiri, A.; Mokraoui, S. On the mitigation of the overheating caused by floor heating systems exposed to long direct solar radiation and high occupation rates. Sol. Energy 2024, 112565. [Google Scholar] [CrossRef]
- Jammulamadaka, H.S. Evaluation of Energy Efficiency Performance of Heated Windows. Ph.D. Thesis, West Virginia University, Morgantown, WV, USA, 2017. [Google Scholar]
- Gadgil, C.; Ghosh, A.; Bhattacharjee, A.; Praveen, P.L. Electrically powered active smart windows. Next Sustain. 2024, 3, 100027. [Google Scholar] [CrossRef]
- Tian, J.; Cheng, W.; Xiu, M.; Zhang, H.; Han, C.; Ye, F.; Huang, Y. Multifunctional smart windows: Development and integration for smart net-zero buildings–A state-of-the-art review. Constr. Build. Mater. 2025, 495, 143524. [Google Scholar] [CrossRef]
- Flaga, S.; Dominik, I.; Szybiński, M. Testing the Uniformity of Surface Resistance on Large-Format Transparent Heating Glass. Sensors 2023, 23, 8738. [Google Scholar] [CrossRef] [PubMed]
- Koshlak, H.; Basok, B.; Pavlenko, A.; Goncharuk, S.; Davydenko, B.; Piotrowski, J. Experimental and Numerical Studies of Heat Transfer Through a Double-Glazed Window with Electric Heating of the Glass Surface. Sustainability 2024, 16, 9374. [Google Scholar] [CrossRef]
- Kurnitski, J.; Jokisalo, J.; Palonen, J.; Jokiranta, K.; Seppänen, O. Efficiency of electrically heated windows. Energy Build. 2004, 36, 1003–1010. [Google Scholar] [CrossRef]
- Lee, H.; Lee, K.; Kang, E.; Kim, D.; Oh, M.; Yoon, J. Evaluation of Heated Window System to Enhance Indoor Thermal Comfort and Reduce Heating Demands Based on Simulation Analysis in South Korea. Energies 2023, 16, 1481. [Google Scholar] [CrossRef]
- Lee, H.; Yoon, J. Heat Flux and Thermal Characteristics of Electrically Heated Windows: A Case Study. Sustainability 2022, 14, 481. [Google Scholar] [CrossRef]
- Koshlak, H. Thermal Performance and Heat Flux Dynamics of Electrically Heated Windows: A Foundation for Energy-Efficient Active Glazing Systems. Environ. Eng. 2026. Available online: https://www.scilit.com/publications/7ec22a448e849001c9a9dbdbed5e295a (accessed on 15 July 2026).
- Kasaeian, A.; Zirak, N.; Ghaziasgar, S.; Akbari, M.; Fadaei, N.; Khazanedari, K.; Pourfayaz, F. Application of transparent and semi-transparent photovoltaics in building windows: A review. Appl. Energy 2026, 405, 127264. [Google Scholar] [CrossRef]
- Wang, W.; Yang, H.; Xiang, C. The overall performance of a novel semi-transparent photovoltaic window with passive radiative cooling coating–A comparative study. Energy Build. 2024, 317, 114433. [Google Scholar] [CrossRef]
- Li, X.; Wu, Y. A review of complex window-glazing systems for building energy saving and daylight comfort: Glazing technologies and their building performance prediction. J. Build. Phys. 2025, 48, 496–540. [Google Scholar] [CrossRef]
- Lee, Y.J.; Kim, S.H.; Ryu, J.H.; Lee, K.H. Optimizing window glass design for energy efficiency in South Korean office buildings: A hierarchical analysis using energy simulation. Buildings 2023, 13, 2850. [Google Scholar] [CrossRef]
- Zheng, X.; Liang, Y.; Yang, H.; Zeng, Y.; Cui, H. Collaborative optimized design of glazing parameters and PCM utilization for energy-efficient Glass Curtain Wall buildings. Buildings 2024, 14, 256. [Google Scholar] [CrossRef]
- Michael, M.; Favoino, F.; Jin, Q.; Luna-Navarro, A.; Overend, M. A systematic review and classification of glazing technologies for building façades. Energies 2023, 16, 5357. [Google Scholar] [CrossRef]
- Aguilar-Santana, J.L.; Jarimi, H.; Velasco-Carrasco, M.; Riffat, S. Review on window-glazing technologies and future prospects. Int. J. Low.-Carbon Technol. 2020, 15, 112–120. [Google Scholar] [CrossRef]
- Nundy, S.; Mesloub, A.; Alsolami, B.M.; Ghosh, A. Electrically actuated visible and near-infrared regulating switchable smart window for energy positive building: A review. J. Clean. Prod. 2021, 301, 126854. [Google Scholar] [CrossRef]
- Bhatia, A.; Sangireddy, S.A.R.; Garg, V. An approach to calculate the equivalent solar heat gain coefficient of glass windows with fixed and dynamic shading in tropical climates. J. Build. Eng. 2019, 22, 90–100. [Google Scholar] [CrossRef]
- Koshlak, H.; Pavlenko, A. Mathematical model of particle free settling in a vortex apparatus. Rocz. Ochr. Sr. 2020, 22, 727–734. [Google Scholar]
- Hassani, A.R.; Domenighini, P.; Belloni, E.; Ihara, T.; Buratti, C. Evaluation of the solar heat gain coefficient of innovative aerogel glazing systems: Experimental campaigns and numerical results. J. Build. Eng. 2022, 62, 105354. [Google Scholar] [CrossRef]
- Gomaa, M.M.; Abdallah, A.S.H.; Aloshan, M.A.; Ragab, A. A Comparative Analysis of Advanced Glazing Technologies for Energy-Efficient Buildings in Jeddah City, Saudi Arabia. Buildings 2025, 15, 1477. [Google Scholar] [CrossRef]
- Wang, S.; Mi, W.; Pang, M.; Yang, F.; Hui, C. Analysis of Heat Transfer and Influencing Factors on the U-Values of Single-Pane and Insulating Glass. Buildings 2026, 16, 1506. [Google Scholar] [CrossRef]
- Allen, K.; Connelly, K.; Rutherford, P.; Wu, Y. Smart windows—Dynamic control of building energy performance. Energy Build. 2017, 139, 535–546. [Google Scholar] [CrossRef]
- Cannavale, A.; Ayr, U.; Fiorito, F.; Martellotta, F. Smart electrochromic windows to enhance building energy efficiency and visual comfort. Energies 2020, 13, 1449. [Google Scholar] [CrossRef]
- Krukovskyi, P.G.; Smolchenko, D.A.; Krukovskyi, G.P.; Deineko, А.І. Analysis of the heating capacity of electrically heated windows. Thermophys. Therm. Power Eng. 2021, 43, 62–67. [Google Scholar] [CrossRef]
- Samuelson, H.; Srivastava, C.; Baniassadi, A. Optimizing window solar heat gain coefficient for energy and carbon performance in a changing context of electrification and decarbonization. Energy Rep. 2025, 13, 1450–1466. [Google Scholar] [CrossRef]
- Deng, B.; Zhu, Y.; Wang, X.; Zhu, J.; Liu, M.; Liu, M.; Meng, H. An ultrafast, energy-efficient electrochromic and thermochromic device for smart windows. Adv. Mater. 2023, 35, 2302685. [Google Scholar] [CrossRef] [PubMed]
- Dutta, A.; Samanta, A. Determining factors of window glazing regarding reduction in electrical energy consumption. J. Energy Resour. Technol. 2020, 142, 032101. [Google Scholar] [CrossRef]
- Li, X.; Li, K.; Sun, Y.; Wilson, R.; Peng, J.; Shanks, K.; Wu, Y. Comprehensive investigation of a building integrated crossed compound parabolic concentrator photovoltaic window system: Thermal, optical and electrical performance. Renew. Energy 2024, 223, 119791. [Google Scholar] [CrossRef]
- Siddiq, N.A.; Kevin Hendinata, L. Assessing the Potential of Smart Windows for Energy Efficiency in Tropical Buildings: A Review of Current Research and Future Directions. J. Phys. Conf. Ser. 2024, 2828, 012008. [Google Scholar] [CrossRef]
- Maleki, P.; Wang, Y.; Gao, F. Design Approaches of Photovoltaic Shading Devices (PVSDs): A Systematic Review. Sustainability 2026, 18, 3006. [Google Scholar] [CrossRef]
- Alsehail, A.; Almhafdy, A. The effect of Window-To-Wall ratio (WWR) and window orientation (WO) on the thermal performance: A preliminary overview. Environ.-Behav. Proc. J. 2020, 5, 165–173. [Google Scholar] [CrossRef]
- Wei, S.; Yu, C.; Yi, L.; Line, D. Smart windows for sustainable learning: A multi-climate assessment of adaptive glazing technologies. Appl. Therm. Eng. 2026, 130026. [Google Scholar] [CrossRef]
- Yang, J.; Huang, Y.; Han, J.; Mai, H.; Li, P. Optical–thermal performance and energy efficiency of electrochromic glazing in hot summer and warm winter residential buildings. Sustainability 2025, 17, 1705. [Google Scholar] [CrossRef]
- Wang, H.; Tian, X.; Lu, Y.; Qi, T.; Qu, Z.; Zhou, W.; Zhao, G. Kinetic modeling of thermochromic smart windows: Quantifying the impact of transition speed on energy consumption and indoor comfort. Build. Simul. 2026, 19, 605–617. [Google Scholar] [CrossRef]
- Basok, B.; Pavlenko, A.; Novikov, V.; Koshlak, H.; Ciosek, A.; Moroz, M. Comprehensive investigation of the thermal performance of an electrically heated double-glazed window: A theoretical and experimental approach. Energies 2024, 17, 4491. [Google Scholar] [CrossRef]
- Iluyemi, D.C.; Nundy, S.; Shaik, S.; Tahir, A.; Ghosh, A. Building energy analysis using EC and PDLC based smart switchable window in Oman. Sol. Energy 2022, 237, 301–312. [Google Scholar] [CrossRef]
- Cannavale, A. Chromogenic Technologies for Energy Saving. Clean. Technol. 2020, 2, 462–475. [Google Scholar] [CrossRef]
- Salazar, S.L.; Yang, R.; Li, D.; Chagolla-Aranda, M.A.; Chávez-Chena, Y.; Simá, E. Advanced hybrid assessment of glazing systems: A comparative analysis using differential and global methods for precise thermal optimization and energy efficiency in building. J. Build. Eng. 2025, 100, 111711. [Google Scholar] [CrossRef]
- Carlucci, F.; Cannavale, A.; Campagna, L.M.; Fiorito, F. Evaluation of optimal thermo-optical properties for electrochromic windows in current and future climate scenarios: A multi-locations optimization. Energy Build. 2025, 343, 115913. [Google Scholar] [CrossRef]
- Manz, H.; Frank, T. Analysis of thermal comfort near cold vertical surfaces by means of computational fluid dynamics. Indoor Built Environ. 2004, 13, 233–242. [Google Scholar] [CrossRef]
- Fanger, P.O.; Melikov, A.K.; Hanzawa, H.; Ring, J. Air turbulence and sensation of draught. Energy Build. 1988, 12, 21–39. [Google Scholar] [CrossRef]
- Jin, H.-S.; Jang, Y.; Kim, Y.-W. Energy-Saving Performance and Economic Evaluation of Window Performance Grades in Single-Detached Houses, South Korea. Buildings 2026, 16, 2164. [Google Scholar] [CrossRef]
- Makhour, A.; Michaux, G.; Salagnac, P.; Bragança, P. Study of thermal comfort and air diffusion induced by a heated airflow window. 2026. [Google Scholar] [CrossRef]
- Koshlak, H.; Basok, B.; Davydenko, B. Heat transfer through double-chamber glass unit with low-emission coating. Energies 2024, 17, 1100. [Google Scholar] [CrossRef]
Figure 1.
Mechanisms of summer solar heat gain and winter transmission losses in glazed envelopes.
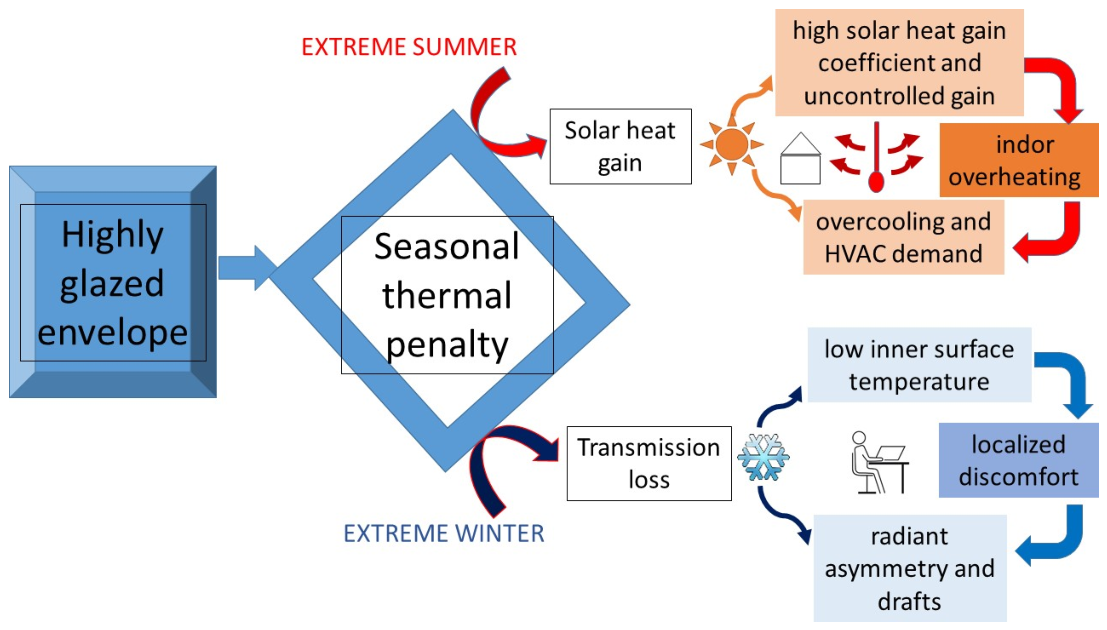
Figure 2.
The physical origin of the cold-pane effect and its implications for localized indoor discomfort: (a) Comparative thermal transmittance profile and inner surface temperature depression contrasting high-performance opaque wall assemblies against triple glazing; (b) Microclimatic failure vectors and the occupant workstation boundary.
Figure 2.
The physical origin of the cold-pane effect and its implications for localized indoor discomfort: (a) Comparative thermal transmittance profile and inner surface temperature depression contrasting high-performance opaque wall assemblies against triple glazing; (b) Microclimatic failure vectors and the occupant workstation boundary.
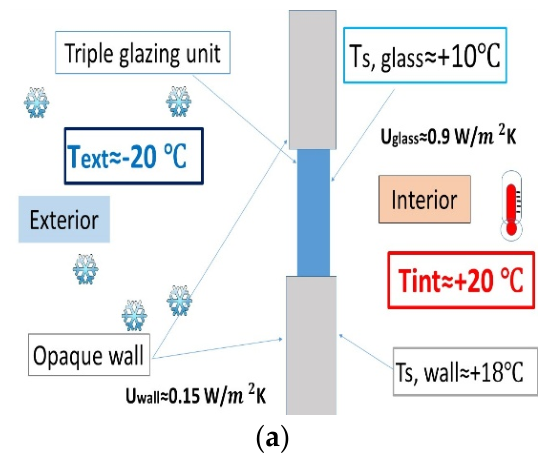
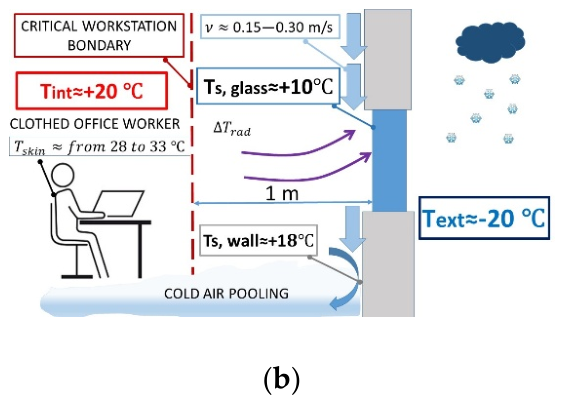
Figure 3.
Schematic diagram and experimental instrumentation architecture of the dual-zone climatic chamber facility for thermal performance characterisation of active glazing units.
Figure 3.
Schematic diagram and experimental instrumentation architecture of the dual-zone climatic chamber facility for thermal performance characterisation of active glazing units.
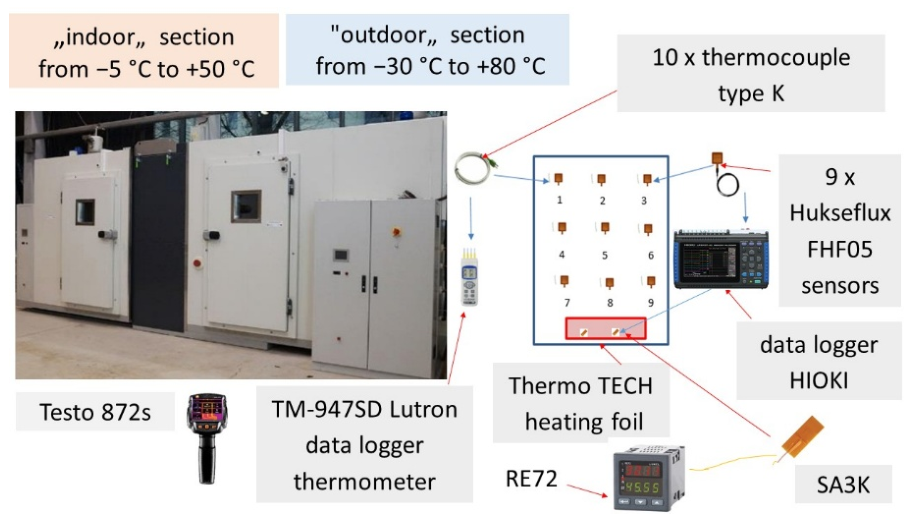
Figure 4.
Schematic diagram of the electrically heated triple-glazed window: (a) Cross-sectional schematic detailing glass surface numbering, cavity configuration, and heating foil placement; (b) Surface-mounted sensor grid mapping the Cartesian spatial distribution of the Hukseflux FHF05 heat flux sensor matrix (C1–C9) relative to the active heating zone.
Figure 4.
Schematic diagram of the electrically heated triple-glazed window: (a) Cross-sectional schematic detailing glass surface numbering, cavity configuration, and heating foil placement; (b) Surface-mounted sensor grid mapping the Cartesian spatial distribution of the Hukseflux FHF05 heat flux sensor matrix (C1–C9) relative to the active heating zone.
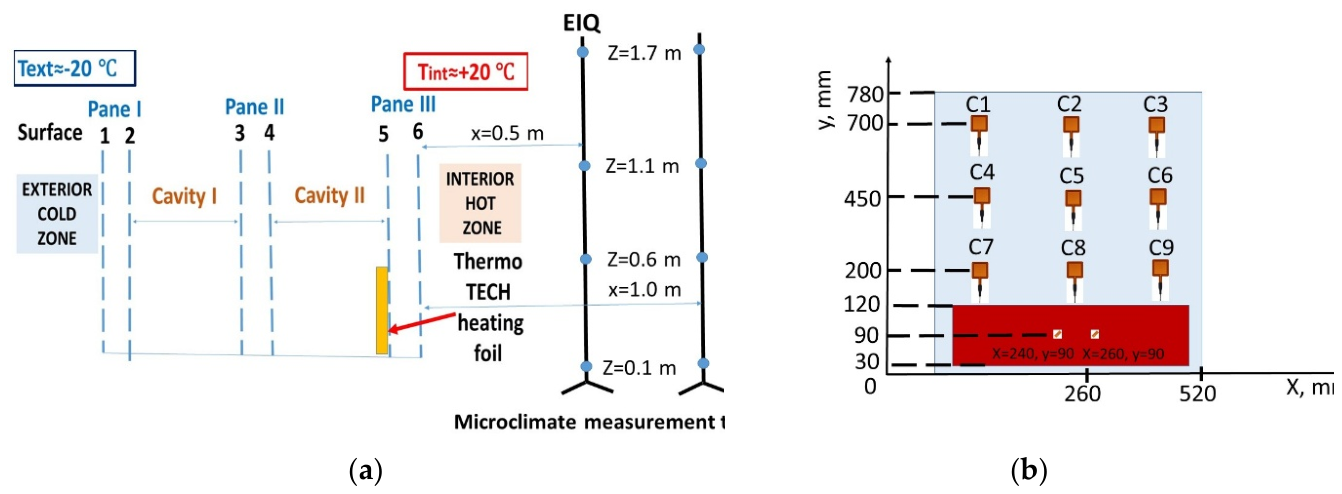
Figure 5.
Spatial two-dimensional heat flux density distribution (mapped across the 3x3 Hukseflux FHF05 sensor array on the inner glass surface (Surface 6) at = : (a) Baseline passive regime (; (b) Active setpoint; (c) Active setpoint ; (d) Active setpoint .
Figure 5.
Spatial two-dimensional heat flux density distribution (mapped across the 3x3 Hukseflux FHF05 sensor array on the inner glass surface (Surface 6) at = : (a) Baseline passive regime (; (b) Active setpoint; (c) Active setpoint ; (d) Active setpoint .
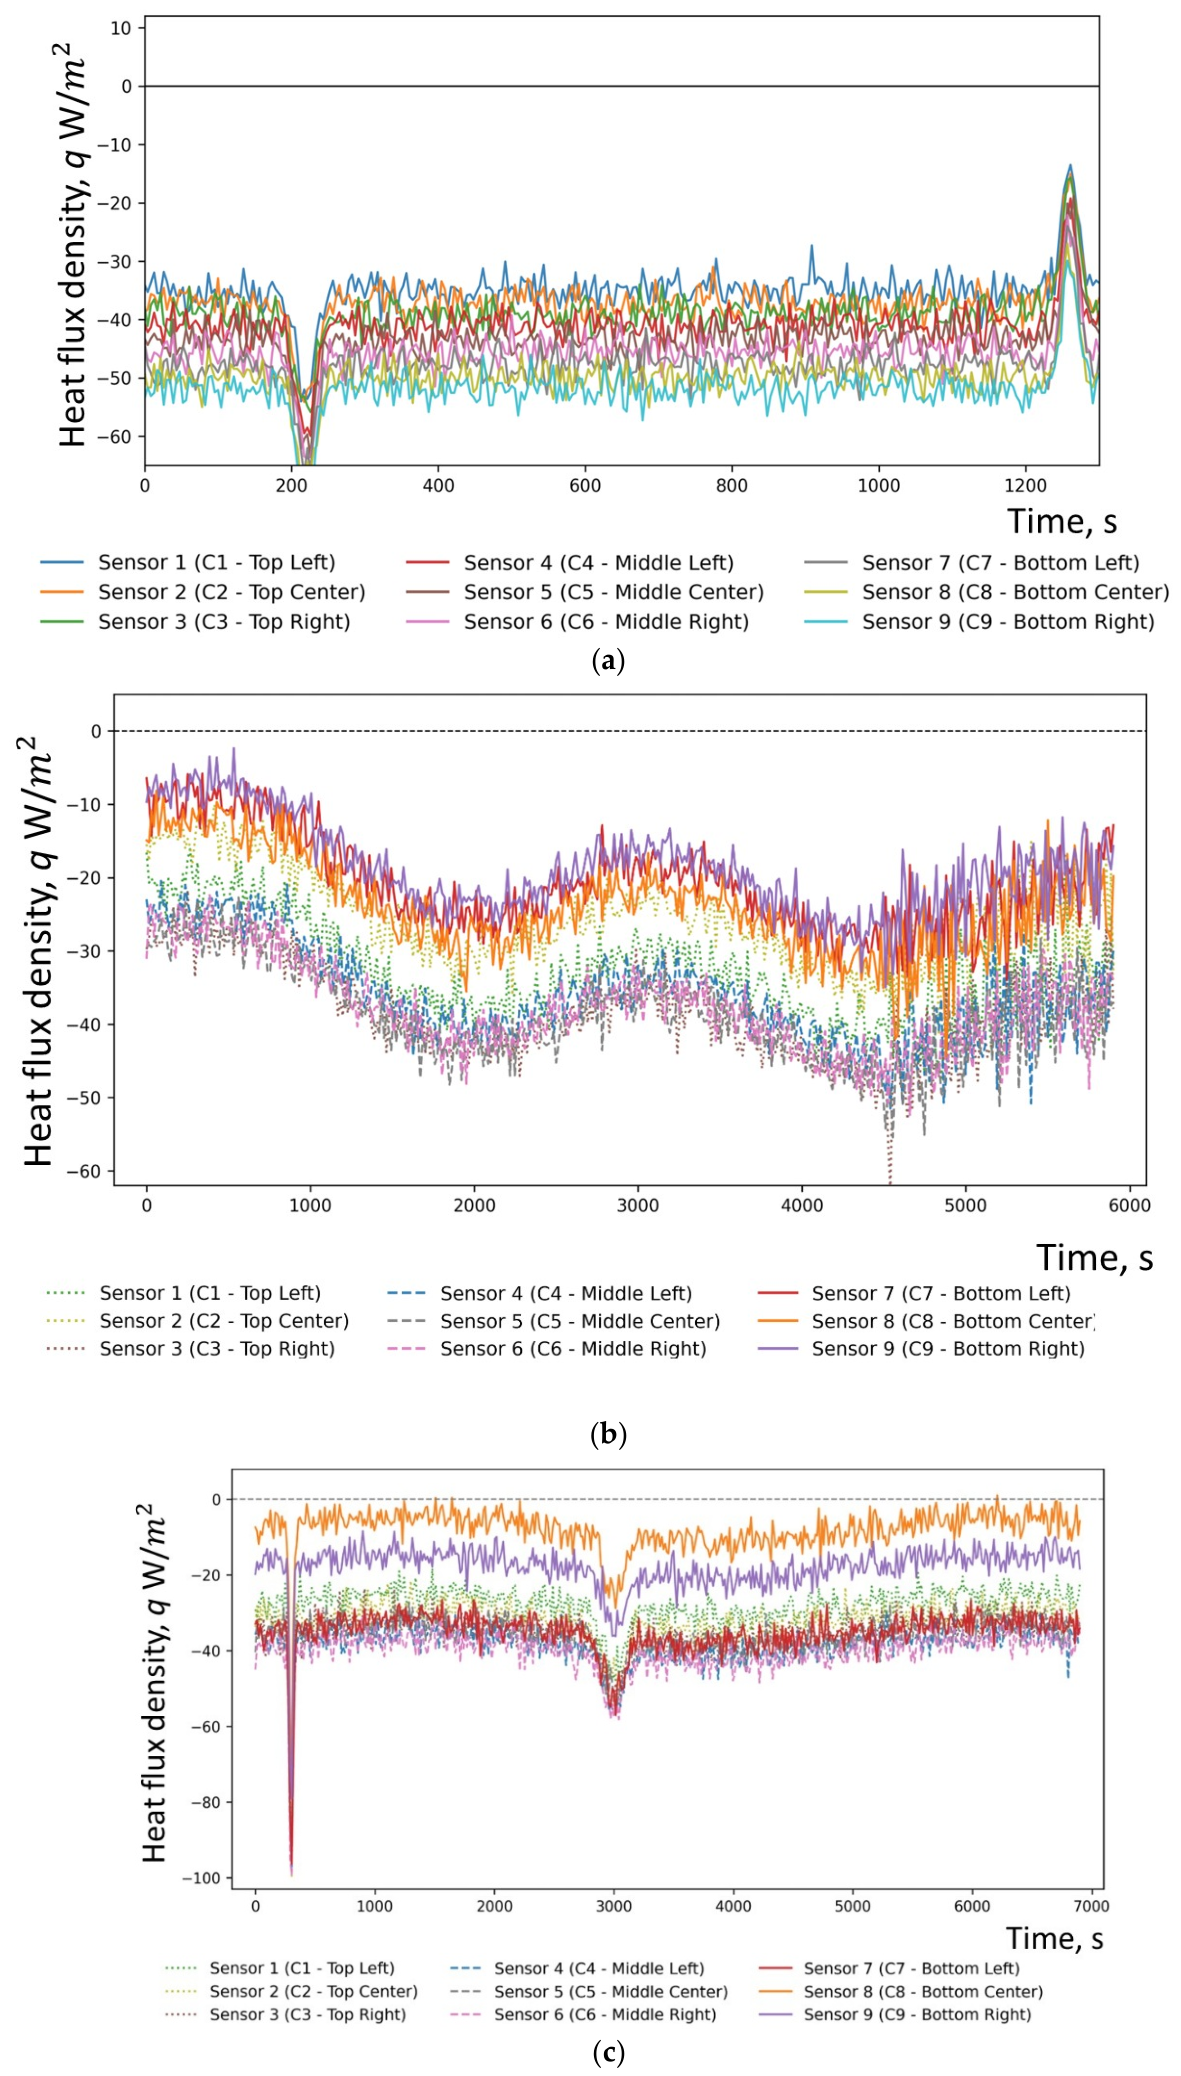
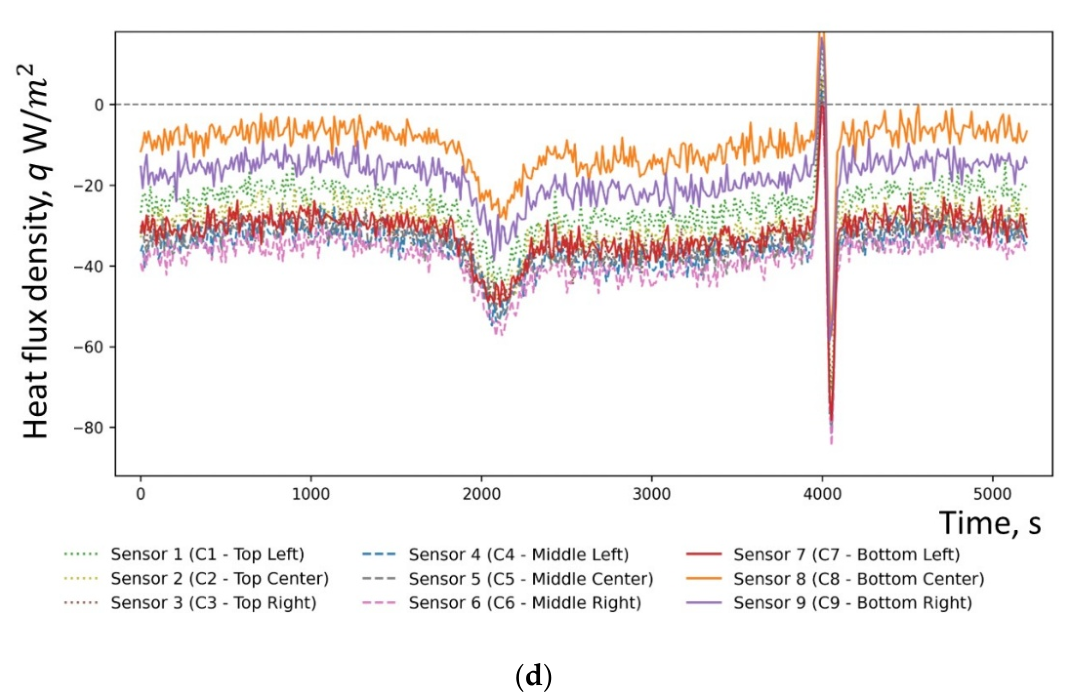
Figure 6.
Spatial heat flux density dynamics across active glazing: (a) ; (b) ; (c) .
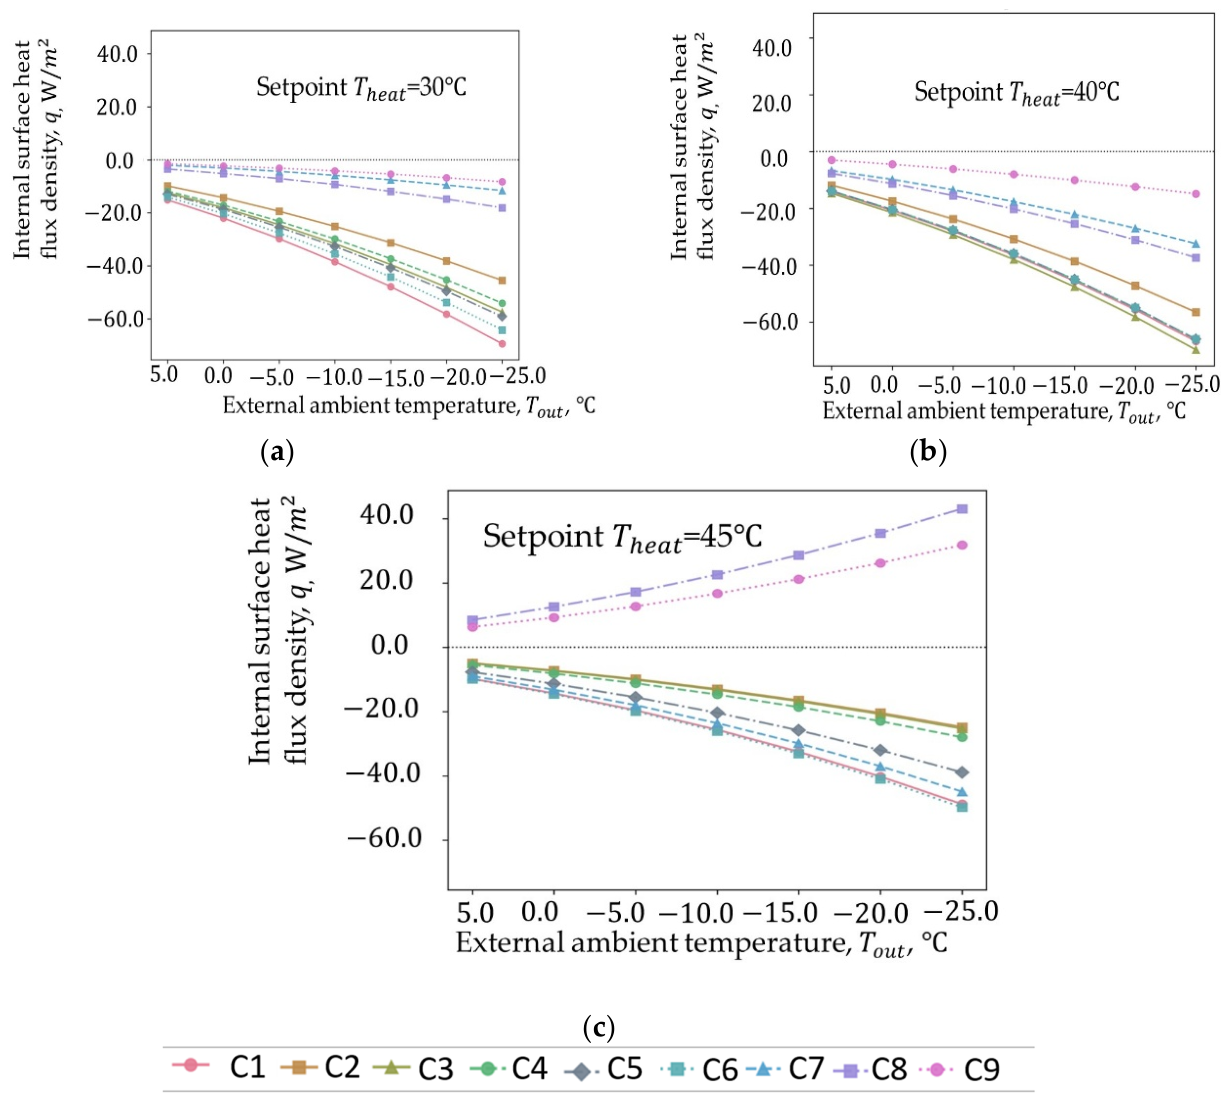
Figure 7.
Infrared thermograms illustrating the spatial temperature distribution and surface thermal gradients on the room-side glazing (Surface 6) at an external boundary condition (a) Passive baseline (
Figure 7.
Infrared thermograms illustrating the spatial temperature distribution and surface thermal gradients on the room-side glazing (Surface 6) at an external boundary condition (a) Passive baseline (
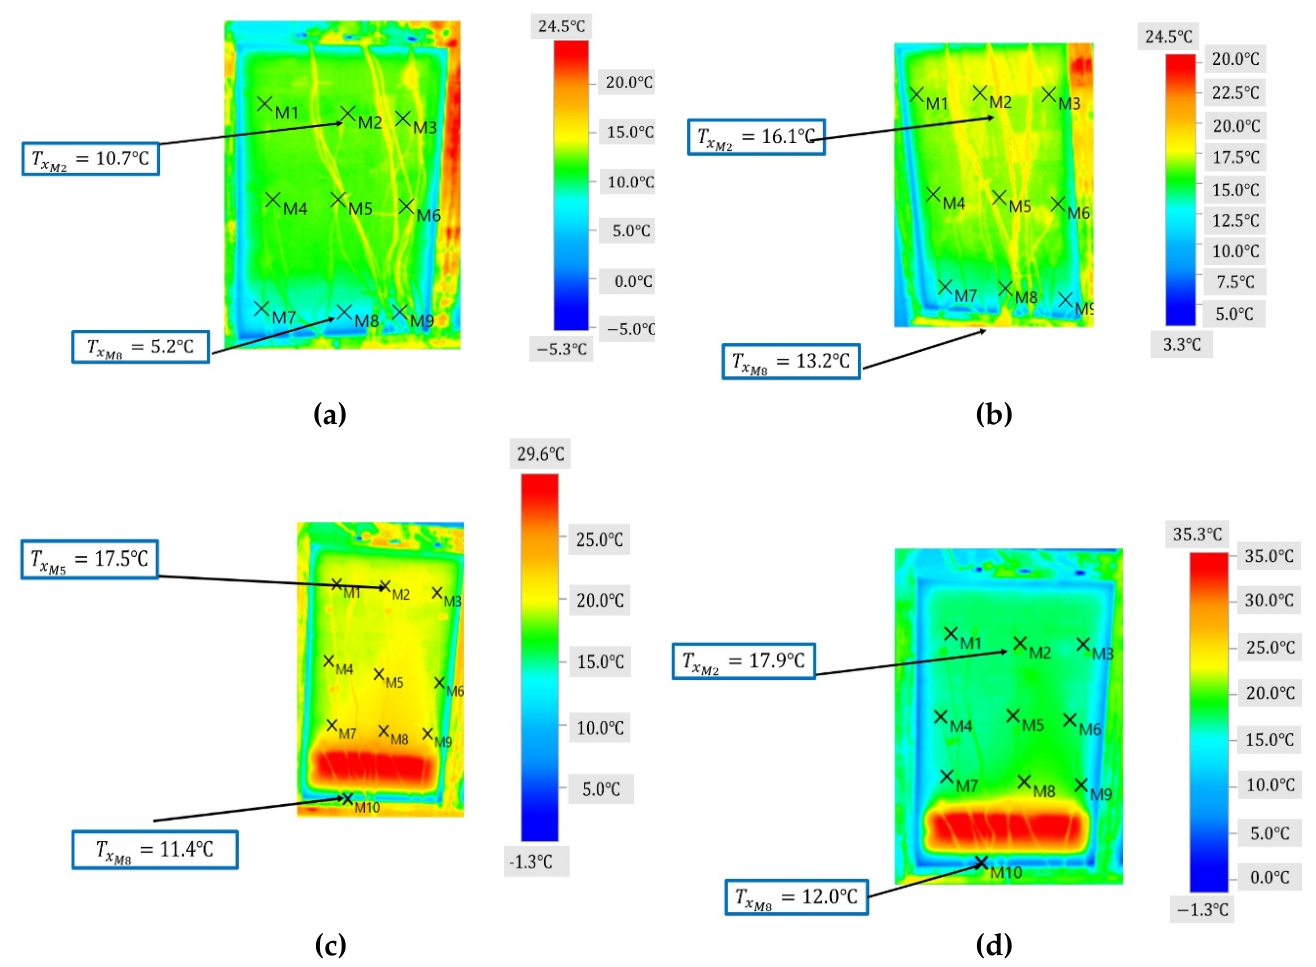
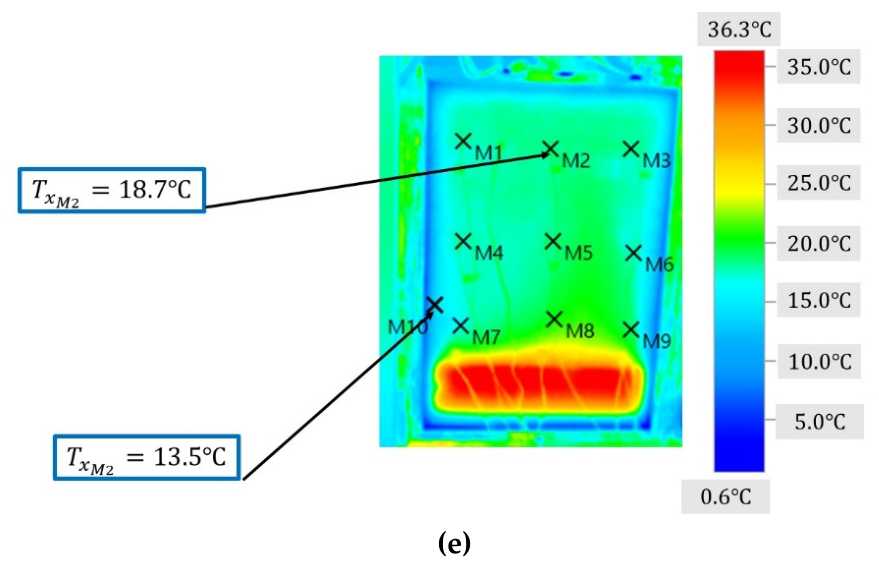
Figure 8.
Extended steady-state thermal response of the room-side glazing surface, as a function of external ambient temperature under varying active heating set-points 30 °C, 40 °C, and 45 °C.
Figure 8.
Extended steady-state thermal response of the room-side glazing surface, as a function of external ambient temperature under varying active heating set-points 30 °C, 40 °C, and 45 °C.
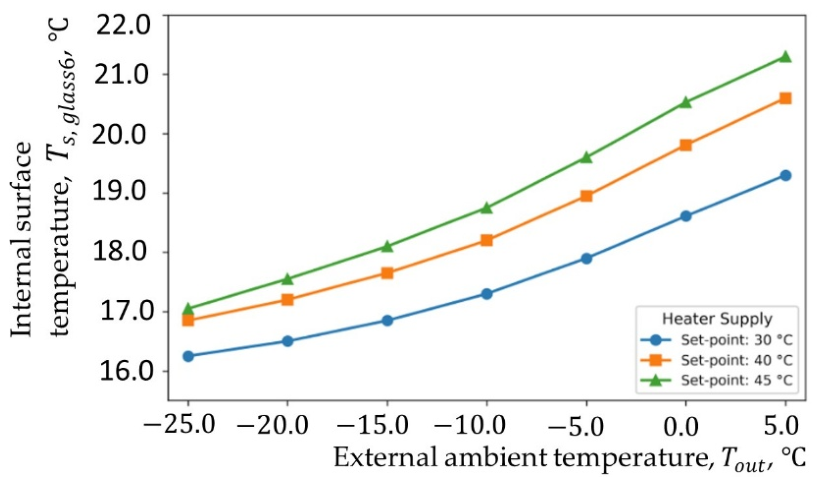
Figure 9.
Vertical microclimatic profiles evaluated at the immediate proximity zone (x = 0.5 m) under extreme sub-zero external boundary conditions (): (a) Local air temperature; (b) Predicted mean vote with the neutral comfort line; (c) Predicted percentage dissatisfied including the ISO 7730 category B threshold reference red line 10%; (d) Draught rate across distinct active glazing heating setpoints.
Figure 9.
Vertical microclimatic profiles evaluated at the immediate proximity zone (x = 0.5 m) under extreme sub-zero external boundary conditions (): (a) Local air temperature; (b) Predicted mean vote with the neutral comfort line; (c) Predicted percentage dissatisfied including the ISO 7730 category B threshold reference red line 10%; (d) Draught rate across distinct active glazing heating setpoints.
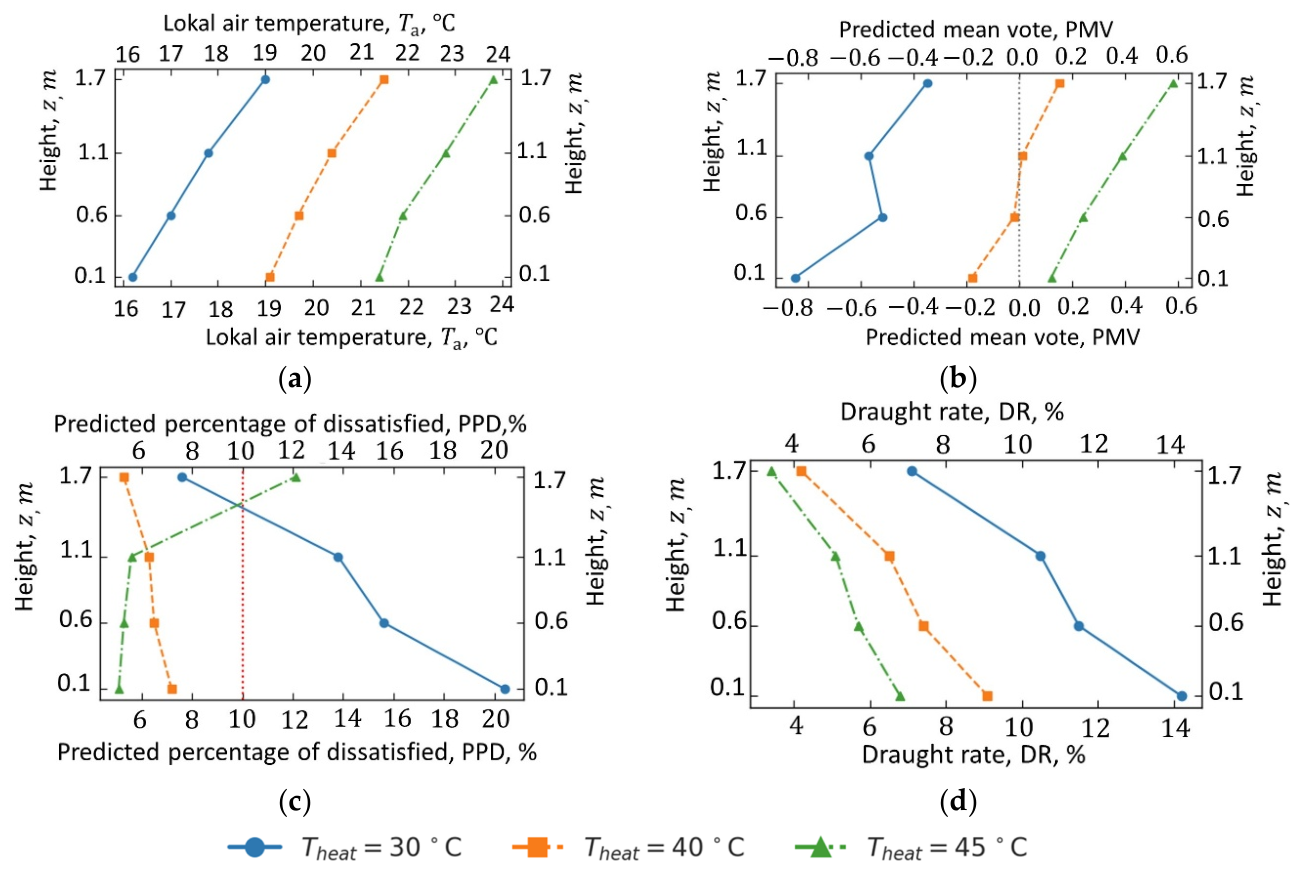
Figure 10.
Vertical microclimatic profiles evaluated at the immediate proximity zone (x = 1.0 m) under extreme sub-zero external boundary conditions (): (a) Local air temperature; (b) Predicted mean vote with the neutral comfort line; (c) Predicted percentage dissatisfied including the ISO 7730 category B threshold reference red line 10%; (d) Draught rate across distinct active glazing heating setpoints.
Figure 10.
Vertical microclimatic profiles evaluated at the immediate proximity zone (x = 1.0 m) under extreme sub-zero external boundary conditions (): (a) Local air temperature; (b) Predicted mean vote with the neutral comfort line; (c) Predicted percentage dissatisfied including the ISO 7730 category B threshold reference red line 10%; (d) Draught rate across distinct active glazing heating setpoints.
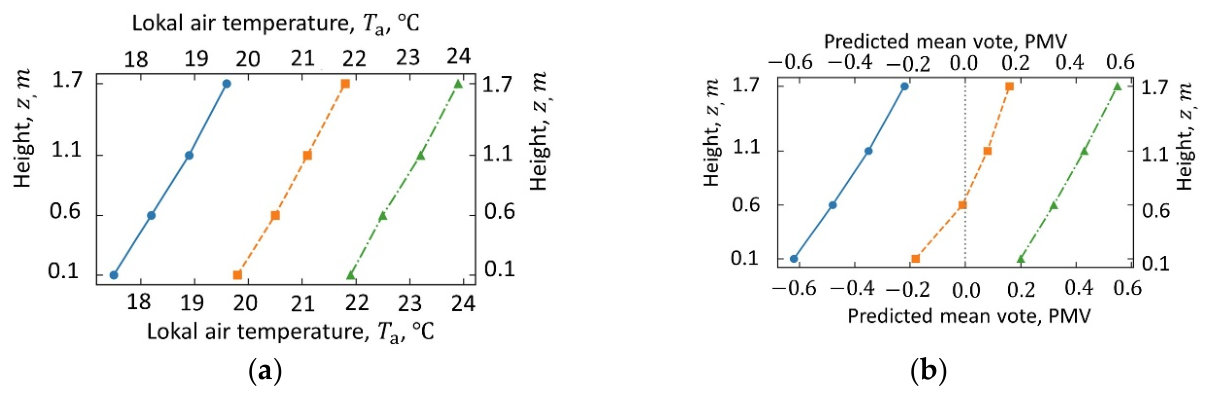
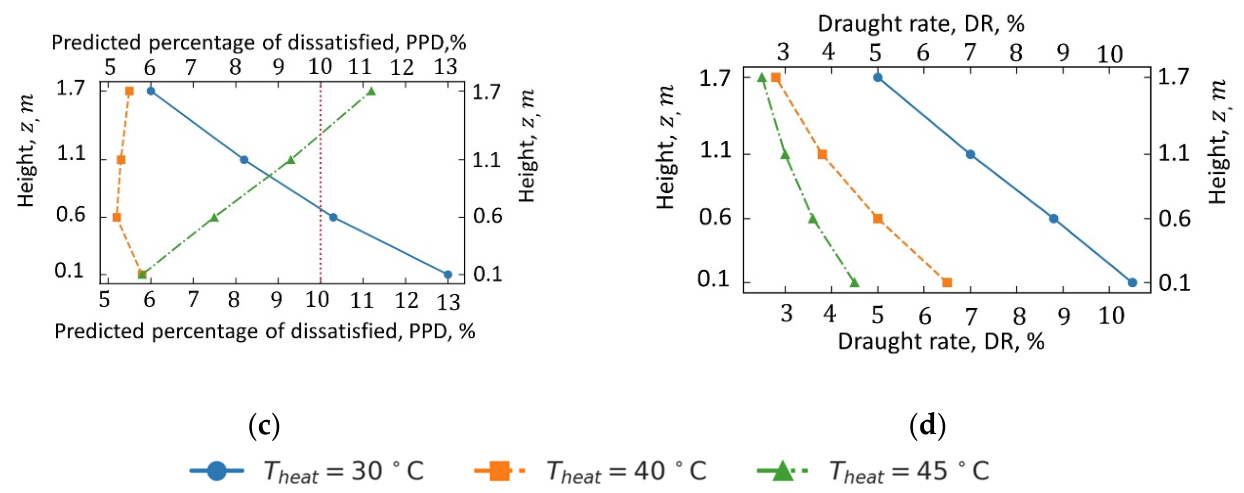
Figure 11.
Vertical microclimatic profiles evaluated at the immediate proximity zone (x = 0.5 m) under intermediate winter boundary conditions (): (a) Local air temperature ; (b) PMV with the neutral comfort line; (c) PPD including the ISO 7730 category B threshold reference red line (10%); (d) DR across distinct active glazing heating setpoints.
Figure 11.
Vertical microclimatic profiles evaluated at the immediate proximity zone (x = 0.5 m) under intermediate winter boundary conditions (): (a) Local air temperature ; (b) PMV with the neutral comfort line; (c) PPD including the ISO 7730 category B threshold reference red line (10%); (d) DR across distinct active glazing heating setpoints.
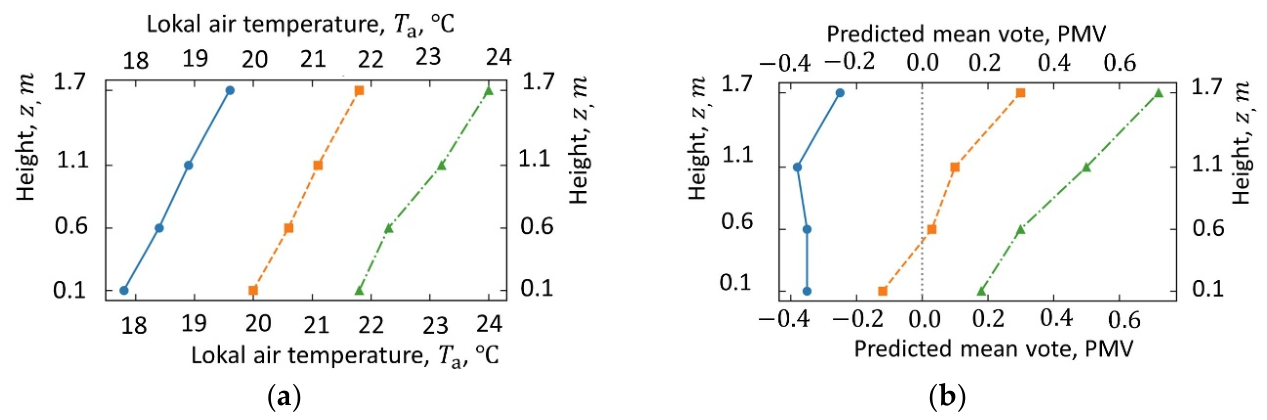
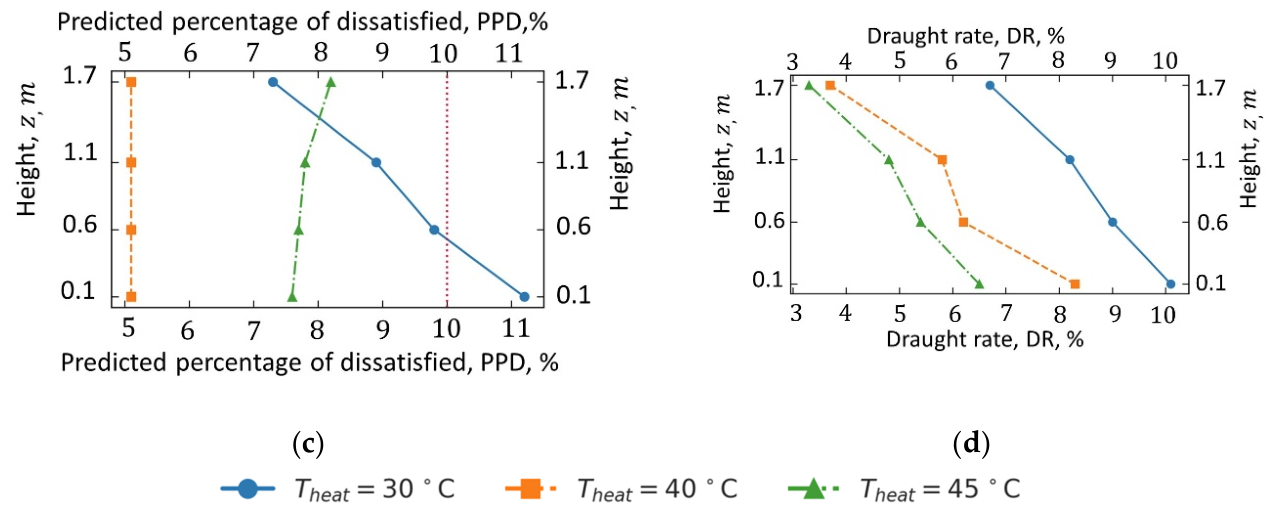
Figure 12.
Vertical microclimatic profiles evaluated at the immediate proximity zone (x = 1.0 m) under intermediate winter boundary conditions (): (a) Local air temperature ; (b) PMV with the neutral comfort line; (c) PPD including the ISO 7730 category B threshold reference red line (10%); (d) DR across distinct active glazing heating setpoints.
Figure 12.
Vertical microclimatic profiles evaluated at the immediate proximity zone (x = 1.0 m) under intermediate winter boundary conditions (): (a) Local air temperature ; (b) PMV with the neutral comfort line; (c) PPD including the ISO 7730 category B threshold reference red line (10%); (d) DR across distinct active glazing heating setpoints.
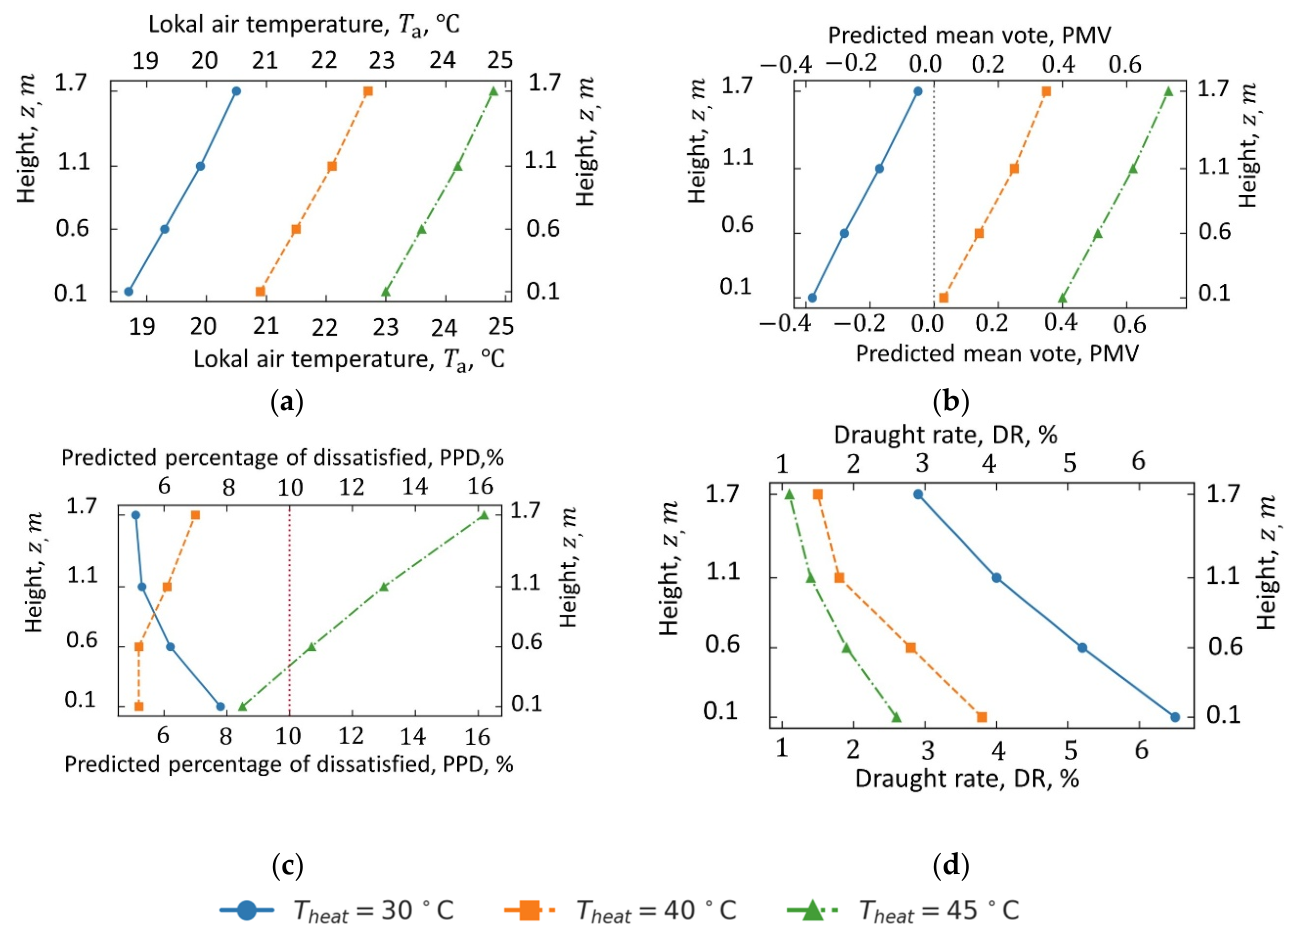
Figure 13.
Vertical microclimatic profiles evaluated at the immediate proximity zone (x = 0.5 m) under mild transitional winter conditions (): (a) Local air temperature; (b) Predicted mean vote with the neutral comfort line; (c) Predicted percentage dissatisfied including the ISO 7730 category B threshold reference red line 10%; (d) Draught rate across distinct active glazing heating setpoints.
Figure 13.
Vertical microclimatic profiles evaluated at the immediate proximity zone (x = 0.5 m) under mild transitional winter conditions (): (a) Local air temperature; (b) Predicted mean vote with the neutral comfort line; (c) Predicted percentage dissatisfied including the ISO 7730 category B threshold reference red line 10%; (d) Draught rate across distinct active glazing heating setpoints.
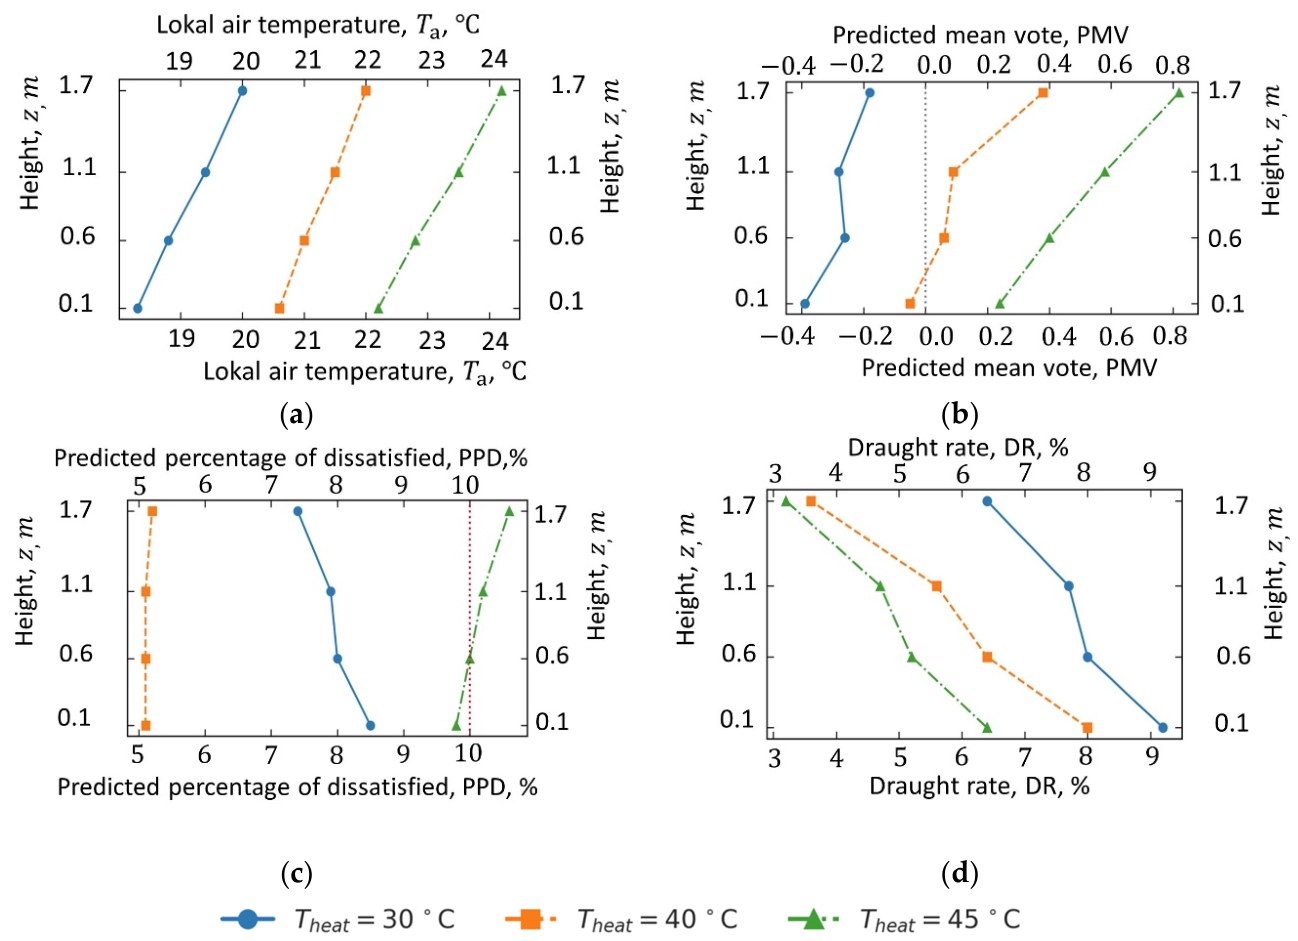
Figure 14.
Vertical microclimatic profiles evaluated at the immediate proximity zone (x = 1.0 m) mild transitional winter conditions (): (a) Local air temperature; (b) PMV with the neutral comfort line; (c) Pincluding the ISO 7730 category B threshold reference red line (10%); (d) DR across distinct active glazing heating setpoints.
Figure 14.
Vertical microclimatic profiles evaluated at the immediate proximity zone (x = 1.0 m) mild transitional winter conditions (): (a) Local air temperature; (b) PMV with the neutral comfort line; (c) Pincluding the ISO 7730 category B threshold reference red line (10%); (d) DR across distinct active glazing heating setpoints.
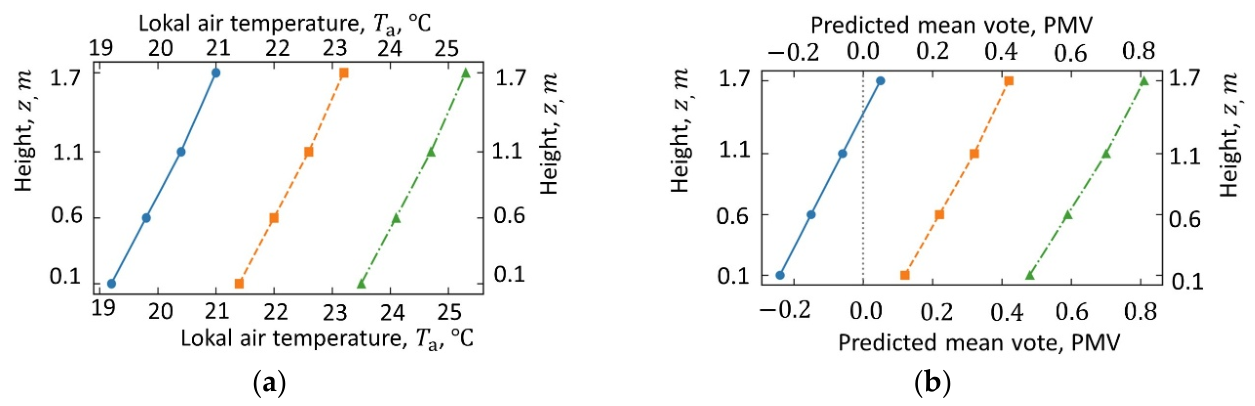
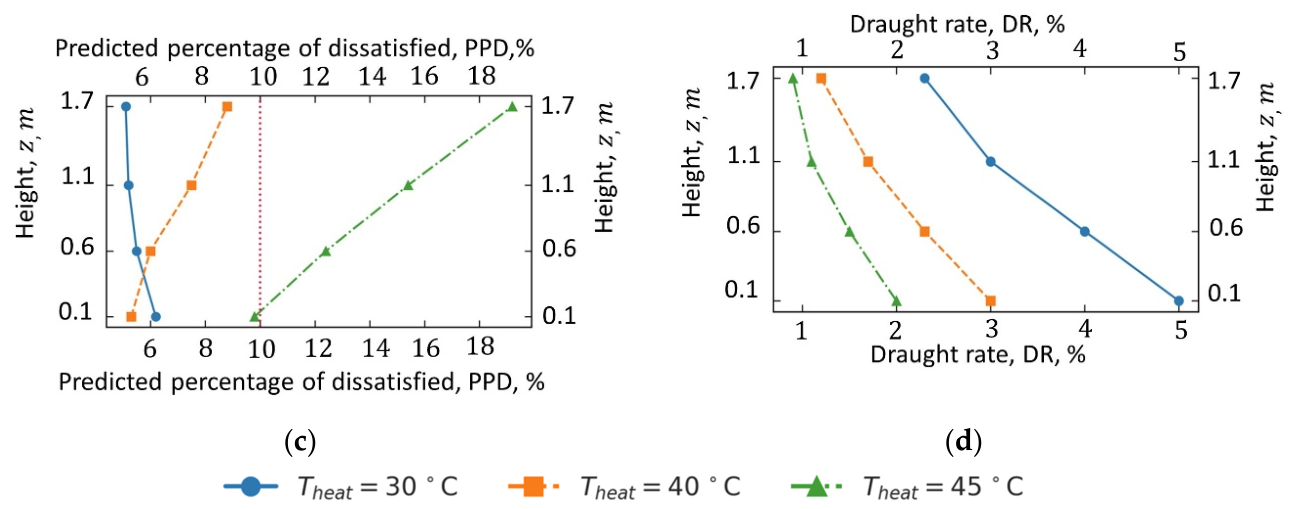

Table 1.
State-of-the-art summary of glazing systems, evaluation methods, and performance outcomes.
| Type of Windows or Independent Variable | Reference | Method | Main Dependent Variables | Main Results |
| Complex glazing systems | [37] | Review | U-value, SHGC, VT, energy, daylight comfort | Review of advanced glazing metrics and building-performance prediction |
| U-value, SHGC, VLT, WWR | [38] | Energy simulation | Heating and cooling load | SHGC showed the strongest effect on office energy performance |
| SHGC, U-value, PCM thickness | [39] | Simulation and sensitivity and RSM | Energy use, cost, thermal regulation | SHGC was the most influential energy variable across climate zones |
| Innovative window technologies | [40] | Review | U-value, heat flux | Heat-flux-meter testing provided satisfactory U-value estimates |
| Static and dynamic glazing technologies | [41] | Review | U-value, SHGC, visible transmittance | U-value remained a core comparison metric across glazing technologies |
| EC, SPD, and LC smart windows | [42] | Review | Energy-saving potential, operating principles | Electrically actuated smart windows mainly include EC, SPD, and LC systems |
| Electrically heated double glazing; heater size, power, location | [30] | CFD and experiment | Room energy use, convection patterns | Electric local heating reduced room energy use by 10–12% |
| Fixed and dynamic shading | [43] | Simulation method development | Equivalent SHGC, cooling implications | Proposed EnergyPlus-based equivalent SHGC approach for tropical façades |
| Energy-active window with low-grade heat | [44] | Heat-transfer model | Heating power demand, thermal efficiency | Heating demand fell by 2.2 W/m² floor area at −20 °C |
| Aerogel glazing systems | [45] | Experiment and analytical model | SHGC estimation, model agreement | Simulation and field SHGC values differed by 22–28% for aerogel cases |
| Aerogel, low-U, and low-SHGC glazing | [46] | Simulation | Cooling demand, indoor temperature, cost | Aerogel glazing reduced annual cooling demand by 48.6% in Jeddah |
| Glass thickness, cavity width, emissivity | [47] | Analytical model and validation | U-value sensitivity | Cavity-facing emissivity had the strongest influence on U-value |
| Thermotropic glazing, HPC concentration | [48] | Laboratory and simulation | Annual energy use, SHGC | 6 wt.% thermotropic glazing achieved 22% annual energy savings |
| Heated window heating and hybrid heating | [32] | Simulation | Heating load, PMV, comfort time | Heated windows reduced heating load by up to 65.60% |
| Electrochromic windows | [49] | Review | Energy use, visual comfort, control strategy | EC windows can substantially reduce cooling and lighting demand |
| Electrically heated windows as heating devices | [50] | Simulation / modeling | Heating capacity, room comfort conditions | Heating capacity depended on glazing share, room size, and outdoor temperature |
| SHGC permutations in cold climates | [51] | Simulation | Electricity use, peak load, carbon | Higher-than-code SHGC improved all tested metrics in colder cities |
| Electrochromic and thermochromic device | [52] | Device experiment | Switching speed, transmittance, insulation | Combined device reached 0.82/0.60 s switching and 6.4 °C insulation effect |
| U-value and SHGC across retrofit glass types | [53] | Calibrated simulation | Electrical energy consumption | Proper glazing selection reduced electrical energy use in tropical climate |
| Electrically heated windows in occupied house | [33] | Field experiment | Heat gain ratio, input energy, dew point | Night heat-gain ratio reached 75.2% south and 83.8% north |
| Photovoltaic window, crossed compound parabolic concentrator | [54] | Simulation | U-value, optical transmittance, electricity generation | exploring the thermal and optical transmittance of the CCPC-PV window under various conditions |
| Electrochromic, SPD, LC glazing | [55] | Review | SHGC, VT | Smart glazing was best suited to cooling-dominated climates |
| Semi-transparent photovoltaic glazing | [56] | Review | Insulation, shading, power generation | PV glazing combined thermal control with on-site electricity generation |
| Higher WWR with glazing optimization | [57] | Simulation | Total building energy | Larger WWR required optimized U-value and SHGC combinations |
| Smart glazing in offices | [58] | Simulation synthesis | Carbon emissions | electrochromic glazing was associated with up to 35–50% carbon reduction in cited cases |
| SPD glazing | [38] | Simulation synthesis | Cooling power, annual electricity use | SPD models reduced cooling power by 29.1% and annual power by 4.1% |
| Thermochromic glazing in hot and cool periods | [59] | Literature synthesis and simulation | Total energy use | Lower solar gain helped cooling but could penalize winter heating |
| Lower transition-temperature thermochromic glazing | [60] | Simulation interpretation | Solar gains, lighting demand | Smaller solar gains improved summer performance but risked higher lighting demand |
| Heater configuration variables | [61] | CFD and experiment | Thermal performance | Thermal behavior depended on heater size, power, and location |
| impact of electrically actuated smart switchable glazing systems particularly PDLC and EC types on the energy usage of a residential building in Oman | [62] | Simulation | Power supply mode | Electrically actuated electrochromic smart windows reduced energy consumption by 23.56% (EC) and 22.35% polymer dispersed liquid crystal (PDLC). Silver-coated PDLC offered minimal additional savings of 0.28% (121.03 kWh). |
| EC control by environmental conditions | [63] | Review | Energy consumption | Control strategy was central to EC energy performance |
| Indoor vs outdoor heat-transfer coefficients | [64] | Analytical model | U-value sensitivity | U-value was more sensitive to indoor than outdoor coefficients |
| EC façades in buildings | [65] | Review | Daylighting, visual comfort | EC glazing supports daylight use while controlling solar penetration |
Table 2.
Technical specifications, precision thresholds, and functional roles of the experimental apparatus and specimens.
Table 2.
Technical specifications, precision thresholds, and functional roles of the experimental apparatus and specimens.
| Category | Component | Model | Specifications, accuracy | Role in Experiment |
| climatic chamber | indoor compartment | custom mobile unit | temperature range from -5 °C to +50 °C; RH: 10–98% | simulates controlled indoor microclimate (+20 °C, 50% RH) |
| outdoor compartment | custom mobile unit | temperature range from -30 °C to +80 °C; wind simulation | simulates external sub-zero temperature profiles (0 °C to -25 °C) | |
| active heating element | Thermo TECH Heating Foil | Conrad electronic (PE) | 230 V AC; power 60 W, IPX4 protection | active surface heat source integrated at the lower glazing boundary |
| surface temperature system | surface temperature sensors |
Omega SA3-K thermocouples, heat flux sensors hukseflux FHF05 | class 1 K-type; self-adhesive; accuracy ± 1.5 °C; sensitivity 20 µV/(W/m²), thin-film |
|
| multi-channel thermometer | Lutron TM-947sd | 4-channel; resolution 0.1 °C; sd logging | auxiliary real-time logging of glass pane surface temperatures | |
| thermocouple array | 10x K-type Thermocouples | Pico SE059 | class 1; operating range from –40 to +1000 °C | spatially distributed across inner/outer glass panes and gas cavity domains |
| heat flux system, surface temperature system | heat flux sensors | hukseflux FHF05 | sensitivity 20 µV/(W/m²), thin-film | |
| data logging | heat flux logger | HIOKI LR8432 | measurement uncertainty < 0.1% | synchronous high-speed data acquisition for heat flux and temperature channels |
| heating system controller | temperature control | Lumel RE72 PID controller | accuracy 0.2% FS; closed-loop control | regulates heating foil electrical power density based on feedback sensors. |
| thermal imaging | infrared camera | Testo 872s | non-contact 2D thermal mapping of surface temperature uniformity across TGU | |
| IEQ Station | logger framework | Testo 400 multifunction IAQ meter and Testo IAQ standalone Logger mounted on ISO 7730 tripod stand |
to 5.00 m/s± 0.03 m/s + 4% m.v; varnothing 150 mm, class 1;; 5-95% ±2%; CO2 from 0–10000 ppm, (50 ppm ± 3% m.v.) |
, turbulence, draught rate, PMV, and PPDper ISO 7726 / ISO 7730 |
Table 3.
Spatiotemporal thermal performance parameters across Surface 6 under
| Operational regimes | S6, W/m² | Peak loss sensor nodes | Thermal state and primary flux direction | |
|---|---|---|---|---|
| baseline passive | unheated, | C7 / C9 (bottom edges) |
severe transmission loss, | |
| active setpoint 1 | +30.0 | C4 / C6 (mid edges) |
attenuated loss, | |
| active setpoint 2 | +40.0 | C7 (left bottom corner) |
near-adiabatic shield, | |
| active setpoint 3 | +45.0 | C7 / C6 (transient spikes) |
net thermal gain, |
Table 4.
Summary of transient dynamic response and closed-loop PID stability indices.
| External temperature, | Heating setpoint | Rise time, min | Settling time, min | Percentage overshoot OS, % | ITAE index, K⋅s2×103 | Steady-state error,, |
| +5.0 | +30.0 | 12.4 | 28.6 | 1.2 | 4.12 | ±0.03 |
| 0.0 | +32.5 | 13.8 | 31.2 | 1.5 | 4.85 | ±0.03 |
| +35.0 | 15.2 | 34.5 | 1.8 | 5.74 | ±0.04 | |
| +37.5 | 16.9 | 38.1 | 2.1 | 6.82 | ±0.04 | |
| 15.0 | +40.0 | 18.5 | 42.0 | 2.4 | 8.09 | ±0.04 |
| 20.0 | +42.5 | 20.4 | 46.6 | 2.7 | 9.55 | ±0.05 |
| 25.0 | +45.0 | 22.6 | 51.8 | 3.1 | 11.30 | ±0.05 |
Table 5.
Steady-state active heat flux density and power demand across environmental gradients.
| External temperature, | Heating setpoint | Thermal gradient ΔT, K | Total electrical power | Heat flux density, W/m2 | Specific energy consumption, Wh/m2⋅h |
| +5.0 | +30.0 | 25.0 | 21.43 | 52.83 | 52.83 |
| 0.0 | +32.5 | 32.5 | 27.86 | 68.68 | 68.68 |
| +35.0 | 40.0 | 34.29 | 84.53 | 84.53 | |
| +37.5 | 47.5 | 40.71 | 100.38 | 100.38 | |
| 15.0 | +40.0 | 55.0 | 47.14 | 116.23 | 116.23 |
| 20.0 | +42.5 | 62.5 | 53.57 | 132.08 | 132.08 |
| 25.0 | +45.0 | 70.0 | 60.00 | 147.93 | 147.93 |
Table 6.
Comparative parametric performance of the standard window module and maximum permissible WWR under passive versus active electro-thermal operating modes x = 1.0m, .
Table 6.
Comparative parametric performance of the standard window module and maximum permissible WWR under passive versus active electro-thermal operating modes x = 1.0m, .
| External temperature, | Opaque wall, | Passive glazing |
Category A, passive WWRmax, % |
Category B, passive WWRmax, % |
Category C, passive WWRmax, % |
Active glazing, | Category A, active WWRmax, % |
|---|---|---|---|---|---|---|---|
| +5.0 | +19.77 | +17.86 | 100.0 | 100.0 | 100.0 | +23.99 | 100.0 |
| 0.0 | +19.69 | +17.14 | 100.0 | 100.0 | 100.0 | +23.27 | 100.0 |
| +19.61 | +16.43 | 82.5 | 100.0 | 100.0 | +22.56 | 100.0 | |
| +19.53 | +15.71 | 58.7 | 100.0 | 100.0 | +21.84 | 100.0 | |
| 15.0 | +19.45 | +15.00 | 43.1 | 92.8 | 100.0 | +21.13 | 100.0 |
| 20.0 | +19.38 | +14.29 | 32.2 | 75.1 | 100.0 | +20.42 | 100.0 |
| 25.0 | +19.30 | +13.57 | 24.6 | 60.7 | 98.6 | +19.70 | 100.0 |
Disclaimer/Publisher’s Note: The statements, opinions and data contained in all publications are solely those of the individual author(s) and contributor(s) and not of MDPI and/or the editor(s). MDPI and/or the editor(s) disclaim responsibility for any injury to people or property resulting from any ideas, methods, instructions or products referred to in the content. |
© 2026 by the authors. Licensee MDPI, Basel, Switzerland. This article is an open access article distributed under the terms and conditions of the Creative Commons Attribution (CC BY) license (http://creativecommons.org/licenses/by/4.0/).
Copyright: This open access article is published under a Creative Commons CC BY 4.0 license, which permit the free download, distribution, and reuse, provided that the author and preprint are cited in any reuse.