

Submitted:
19 August 2026
Posted:
20 August 2026
You are already at the latest version
Abstract
Methane emissions from offshore installations are routinely monitored using gas detection systems that form an important component of operational safety management. Detector outputs are commonly used to support safety-critical decisions during helicopter approach, vessel transfer, inspection activities, and routine offshore operations. However, the extent to which atmospheric conditions influence the effectiveness of these safety barriers remains poorly quantified. This study presents a probabilistic modelling framework to assess methane detectability as a function of emission rate, atmospheric regime, receptor height, and sensor sensitivity, with particular focus on the implications of detection failure for offshore safety. A Gaussian plume dispersion model combined with Monte Carlo simulation was used to account for variability in wind speed and wind direction, allowing estimation of detection probability under realistic offshore conditions. Detection was evaluated at two representative receptor locations: helideck height (25 m), representative of helicopter operations, and near-surface level (~2 m), representative of vessel-based detection. Emissions were varied over a wide range (0.01–1000 g s⁻¹; approximately 0.04–3600 kg h⁻¹), while detection thresholds of 0.1, 1, and 10 ppm were used to represent different classes of methane monitoring systems. Results show that methane detectability is frequently controlled by plume geometry and atmospheric structure rather than emission magnitude alone. In the near field (< ~200 m), limited vertical dispersion results in plume–sensor misalignment, producing false-negative detection outcomes in which substantial methane releases remain undetected despite the presence of monitoring systems. Detection improves at intermediate distances (~400–800 m), where plume spreading increases the likelihood of plume interception, before decreasing again at larger distances due to dilution. Increasing detection thresholds significantly reduces detectability, with 10 ppm sensors failing to detect large emissions across wide operating conditions, particularly under stratified atmospheric regimes. These findings demonstrate that gas detection systems should be regarded as conditional safety barriers whose effectiveness depends on atmospheric transport processes as well as sensor performance. The absence of methane detection should therefore not be interpreted as evidence that a hazardous emission is absent. This has direct implications for offshore risk management, situational awareness, and safe-ty-critical operational decision-making.
Keywords:
methane detection
; offshore safety
; atmospheric dispersion
; detection probability
; sensor sensitivity
; fugitive emissions
; plume geometry
; boundary layer stability
; risk assessment
1. Introduction
Methane emissions from offshore oil and gas installations present both environmental and operational safety challenges [1,2,3,4,5,6]. While significant attention has been devoted to the climate impact of methane release, comparatively less emphasis has been placed on its detectability during routine offshore operations. In particular, the ability of personnel to identify fugitive emissions during approach, landing, or transfer operations is often implicitly assumed, yet the physical basis for this assumption remains poorly quantified.
In offshore environments, methane may be released from a variety of sources, including process equipment, storage systems, flanges, valves, and accidental failures [3,7,8,9,10,11]. These releases can vary widely in magnitude, ranging from minor leaks of a few kilograms per hour to large-scale emissions associated with equipment malfunction or system failure [5,6,7,10,11,12]. From a safety perspective, even relatively small emissions may pose risks in confined or poorly ventilated environments, while large emissions can lead to flammable atmospheres or hazardous operating conditions [13,14,15].
Offshore installations typically employ fixed and portable gas detection systems as part of their overall safety management strategy. Detector outputs may be used in conjunction with operational procedures, permit-to-work systems, helicopter operations, and marine transfers. The effectiveness of these measures depends not only on sensor performance but also on the ability of methane plumes to intersect detection locations.
A common feature of offshore operations is the reliance on gas detection systems to provide situational awareness. Methane detectors are routinely deployed on vessels, installations, and helicopters, with readings often used to inform operational decisions such as whether it is safe to approach or remain within a given area [16]. However, these measurements are typically interpreted in a binary sense, either gas is detected or it is not, without explicit consideration of the complex fluid-dynamic processes that govern the transport and dispersion of the gas.
In reality, the detectability of a gas plume is controlled by multiple interacting factors. These include the emission rate, wind speed, atmospheric stability, surface roughness, and the spatial relationship between the plume and the detection point [17]. Gaussian plume theory provides a well-established framework for modelling pollutant dispersion in the atmosphere, and has been widely applied in both environmental and safety analyses [18]. However, traditional applications often focus on concentration prediction at fixed locations rather than the probabilistic question of whether a plume will be detected under uncertain and variable conditions.
One particularly important consideration is the role of plume geometry. In the near field, a plume released from an elevated source tends to remain concentrated around its effective emission height, with limited vertical dispersion over short distances [18]. As a result, receptors located above or below the plume centreline may experience negligible concentrations, even when the emission rate is large. This raises an important question: to what extent can gas detection systems fail simply because the plume does not intersect the sensor location? A second key factor is atmospheric regime. Offshore environments are characterised by a range of stability conditions, from well-mixed neutral boundary layers to strongly stratified conditions in which vertical mixing is suppressed [19,20,21]. Under neutral conditions, turbulent mixing promotes plume dispersion, increasing the likelihood that a plume will intersect a detector at a given height [22]. In contrast, stratified conditions can confine the plume vertically, potentially allowing it to pass over or under a detection point without being detected [22]. These effects are further modulated by boundary layer height and sea surface roughness, both of which influence dispersion rates.
A third consideration is the role of sensor sensitivity. Methane detectors span a wide range of detection thresholds, from sub-ppm research-grade instruments to industrial detectors that trigger alarms at higher concentrations [23]. It is often assumed that improving sensor sensitivity will directly improve detection capability. However, if the limiting factor is plume–sensor alignment rather than absolute concentration, increasing sensitivity may yield diminishing returns. Despite the importance of these factors, there remains a lack of quantitative analysis linking plume physics to detection outcomes in offshore contexts. In particular, the relationship between emission rate, detection probability, and operational distance has not been systematically explored across multiple atmospheric regimes and receptor configurations. This gap limits the ability of operators to interpret detector readings accurately and to assess the likelihood of undetected emissions.
The issue may be particularly relevant for normally unattended installations (NUIs), where personnel are not continuously present and where routine monitoring, inspection, and maintenance are often conducted through periodic vessel or helicopter visits. Under such circumstances, a release may persist for some time prior to human intervention, increasing reliance on remote monitoring and approach-phase situational awareness. The effectiveness of methane detection during approach therefore becomes an important component of the overall safety case for such facilities.
The present study addresses this gap by developing a probabilistic modelling framework for methane plume detectability. A Gaussian plume formulation is combined with Monte Carlo simulation to account for variability in wind speed and direction, enabling the estimation of detection probability at specified receptor locations. Two operational scenarios are considered: detection at helideck height (25 m), representing helicopter approach, and detection near the sea surface (~2 m), representing vessel-based operations [2,7,24]. The analysis is performed across a range of emission rates (0.01–1000 g s-1, equivalent to approximately 0.04–3600 kg h-1) [5,6,7,10,11,12], atmospheric regimes (land neutral, marine neutral deep, marine shallow, and marine stratified) [19,20,21], and detection thresholds (0.1 ppm, 1 ppm, and 10 ppm) [23]. Detection probability is defined as the fraction of simulated conditions in which the plume concentration exceeds the sensor threshold, allowing the identification of critical emission rates required for reliable detection.
The safety concern addressed in this study is not the presence of methane alone, but the possibility that hazardous methane releases may remain undetected, i.e. a false-negative signal, despite the presence of gas monitoring systems. In safety terms, this represents a potential failure of situational awareness, whereby operational decisions may be based on an assumed absence of hazard when the underlying release remains physically undetected. The study therefore examines the conditions under which atmospheric transport processes can create false-negative detection outcomes.
The overall aim is to quantify when and why methane emissions may fail to be detected under realistic offshore conditions. Specifically, the study seeks to: 1. Characterise the role of plume geometry in limiting detection in the near field; 2. Identify the distance ranges over which detection is most likely to occur; 3. Evaluate the influence of atmospheric stability on plume–sensor interaction; 4. Assess the extent to which sensor sensitivity can mitigate detection limitations; and 5. Derive implications for operational safety and the interpretation of gas detection data.
By linking physical dispersion processes with probabilistic detection outcomes, the study provides a framework for understanding the limitations of detection-based safety strategies. The results demonstrate that detection is not solely a function of emission magnitude, but is strongly influenced by atmospheric conditions and plume alignment, with important implications for offshore operational decision-making.
2. Materials and Methods
2.1. Modelling Approach
A physics-based dispersion modelling framework was developed to evaluate the detectability of methane emissions from offshore sources under varying atmospheric and operational conditions. The model is based on a Gaussian plume formulation, with modifications to account for offshore boundary layer characteristics, vertical dispersion constraints, and atmospheric stratification effects [18,20,21]. Methane concentrations were calculated using a steady-state Gaussian plume model with ground reflection (Equation 1), using the methane concentration (C, g m-3), the emission rate (Q, g s-1), the wind speed (U, m s-1), the source height (H, m), and the lateral and vertical dispersion coefficients (σy and σz, respectively [18]). The second exponential term represents reflection at the sea surface and prevents loss of plume mass below ground level.
Platform structures, wake effects, and equipment congestion were not explicitly represented. These factors may significantly modify dispersion in the near field. Consequently, the modelling framework is intended to represent first-order detectability behaviour rather than detailed platform-scale flow fields. The objective was not high-fidelity prediction of methane concentrations, but exploration of the physical controls governing detectability under contrasting atmospheric conditions.
The model predicts steady-state methane concentration fields as a function of downwind distance, crosswind offset, and elevation. These concentration fields are then used to evaluate the probability of detection at specified receptor locations using a stochastic approach. Variability in meteorological conditions is incorporated through Monte Carlo simulation, allowing the model to capture uncertainty in wind speed and wind direction. Detection is defined probabilistically as the fraction of simulations in which the predicted methane concentration at a receptor exceeds a specified detection threshold. This approach enables the estimation of detection likelihood under realistic environmental variability rather than relying on deterministic plume predictions alone.
2.2. Source and Environmental Inputs
A continuous point-source emission of methane was assumed, representing a generic fugitive release from an offshore installation. The source was assumed to be located at a height of 50 m above sea level, representative of elevated process equipment on a fixed offshore production installation [2,7,24]. Methane was treated as a passive tracer and density effects associated with buoyancy were neglected. Emissions were assumed to be continuous and steady over the simulation period. The source height remained constant and therefore uncertainty associated with the physical location of the release was not considered. The selected value is representative of elevated process equipment on offshore installations.
Emission rates were varied parametrically over a wide range (0.01–1000 g/s), corresponding to approximately 0.04–3600 kg/h, in order to capture both minor and major leak scenarios [5,6,7,10,11,12]. Meteorological conditions were defined using a baseline wind speed of 5 m s⁻¹, with stochastic variation applied using a normal distribution (standard deviation ±2 m s⁻¹). This wind speed was selected to represent a relatively weak offshore ventilation state in which methane concentrations would be expected to be less strongly diluted. The objective was to examine detectability under conditions favourable for plume persistence and sensor interception. As higher wind speeds generally promote dispersion and dilution, the selected value may be considered a conservative lower-bound operational scenario from a detectability perspective.
Wind direction variability was similarly incorporated using a normal distribution (±10°) to represent realistic fluctuations in plume trajectory. Surface roughness length was used to represent different surface conditions, with values corresponding to onshore and offshore environments [17]. Boundary layer height was included to limit vertical dispersion, with reduced mixing applied in shallow or stratified conditions [21]. Methane concentrations were initially calculated in units of mass concentration (g m-3). These were subsequently converted to parts per million (ppm) using the ideal gas relationship under standard atmospheric conditions (288 K and 101325 Pa) and a methane molecular weight of 16.04 g mol-1.
A wind speed of 5 m s⁻¹ was selected as a representative moderate offshore condition to isolate the influence of atmospheric structure on detectability. A source elevation of 50 m was selected as a conservative representation of elevated hydrocarbon releases from offshore process areas, vent systems, flare booms, and elevated infrastructure. Receptor locations should be interpreted as hypothetical sampling locations rather than explicit trajectories of approaching helicopters or vessels. The objective was not to represent a specific leak source but rather to explore detectability limitations under conditions where plume–receptor misalignment is most likely. The study is intended to examine relative differences between atmospheric regimes rather than provide a climatological assessment of offshore detectability. The principal model parameters are summarised in Table 1.
2.3. Atmospheric Scenarios
2.3.1. Dispersion Parameterisation
Lateral and vertical plume spread were described using empirical dispersion coefficients (σy and σz) scaled according to surface roughness and atmospheric regime. For neutral cases, σy and σz were calculated from the aerodynamic roughness length (z0, m) and the distance downwind of the emission point (x, m) (Equations 2 and 3, respectively). Were Adapted from Gaussian plume theory [17,25] but modified to include explicit roughness-length dependence. The objective of the parameterisation was not to reproduce a regulatory dispersion model but to provide physically realistic scaling of plume growth with distance and surface roughness while supporting comparison between atmospheric regimes. For marine shallow and stratified regimes, vertical dispersion was reduced to 30% of the neutral value to represent constrained mixing within a shallow or stable marine boundary layer.
2.3.2. Offshore Atmospheric Scenarios
The offshore atmospheric conditions considered in this study span a spectrum of marine boundary layer structures ranging from well-mixed to strongly stratified environments [22,26]. These scenarios are intended to represent distinct transport regimes that influence plume dispersion and, consequently, methane detectability (Table 2). The regimes are treated as scenario-based representations of physically distinct transport conditions rather than frequency-weighted climatological states. The wind speed was selected to represent a relatively low wind-speed offshore scenario. Such conditions are expected to favour plume persistence and maximise the likelihood of methane detection relative to more strongly ventilated offshore environments. Consequently, the resulting detectability estimates may be viewed as conservative upper bounds on the performance of gas detection systems under offshore conditions. Stochastic variation of ±2 m s⁻¹ was introduced to capture short-term variability and uncertainty in plume transport.
Marine neutral deep conditions represent a well-mixed marine boundary layer characterised by near-neutral stability (|z/L| < 0.1), low bulk Richardson numbers (RiB < 0.1), and mixed-layer depths typically exceeding 500 m. Under these conditions, turbulence is distributed throughout the boundary layer, promoting efficient vertical mixing and strong coupling between the wind field and plume transport.
Marine neutral shallow conditions represent a vertically constrained but still largely coupled marine environment. These cases are characterised by shallower mixed layers (zi ≈ 10² m) and weakly stable conditions (0 < |z/L| < 1; RiB ≈ 0.1–0.25). Turbulent mixing remains active but is reduced compared with the deep neutral case, resulting in more limited vertical plume dispersion and increased confinement within the lower atmosphere.
Marine stratified conditions represent strongly layered boundary-layer structures in which vertical mixing is suppressed. These regimes are associated with stable stratification (|z/L| >> 1), elevated Richardson numbers (RiB > 0.25), and reduced vertical velocity fluctuations (σw < 0.2 m s⁻¹). In addition to reduced vertical dispersion, a capping inversion was represented using a soft decay function above 70 m. Rather than imposing a perfectly reflecting upper boundary, concentrations above the inversion height were progressively attenuated to represent the suppression of vertical transport within a stable marine boundary layer. Under such conditions, turbulence is substantially weakened, producing vertical decoupling, enhanced wind shear, and multi-layer flow structures that can inhibit plume mixing between atmospheric layers.
The atmospheric categories used here are not intended as rigid classifications of offshore weather conditions. Rather, they represent physically distinct end-member states that bracket the range of marine boundary layer structures commonly encountered offshore. In reality, atmospheric stability varies continuously and transitions between regimes may produce more complex dispersion behaviour than represented by the simplified scenarios considered here. The selected Richardson number and stability ranges are therefore used as convenient descriptors of broadly well-mixed, weakly stable, and vertically decoupled transport conditions. Consistent with established boundary-layer theory, values of RiB greater than approximately 0.25 are assumed to indicate conditions under which sustained turbulence and vertical mixing become increasingly difficult to maintain.
2.4. Receptor Configurations
- Helideck: located at 25 m elevation above sea level, representing detection during helicopter approach.
- Vessel (boat): located at approximately 2 m above sea level, representing detection during personnel transfer or vessel approach.
Detection was evaluated at multiple downwind distances ranging from 50 m to 2000 m, covering near-field, intermediate, and far-field conditions relevant to offshore operations.
2.5. Detection Thresholds
Detection thresholds were defined in terms of methane concentration in parts per million (ppm), representing typical instrument sensitivity levels [23]. Three thresholds were considered:
- 0.1 ppm: high-sensitivity detection (e.g. advanced or research-grade instrumentation)
- 1 ppm: moderate sensitivity (typical of many commercial detectors)
- 10 ppm: low sensitivity (representative of alarm-based or less sensitive instruments)
Thresholds were converted to mass concentration (g/m³) using standard atmospheric conditions, enabling direct comparison with model outputs.
2.6. Monte Carlo Simulation and Probability Estimation
A Monte Carlo approach was used to quantify detection probability under uncertain meteorological conditions. For each receptor location, emission rate, and atmospheric regime, 1000 independent simulations were performed using randomly sampled wind speed and wind direction values drawn from the distributions described in Section 2.2. Multiple simulations were performed with randomly sampled wind speed and wind direction. For each simulation, plume concentration at the receptor was calculated, and a detection event was recorded if the concentration exceeded the specified threshold. The probability of detection was then computed as the ratio of detection events to the number of valid simulations. Upwind cases, resulting from wind direction variability, were excluded from the analysis, and probabilities were normalised by the number of valid (downwind) scenarios.
2.7. Critical Emission Threshold
To quantify detectability, a critical emission rate was defined as the emission rate required to achieve a specified probability of detection. A threshold of 50% detection probability was adopted (POD50), representing the point at which detection becomes more likely than non-detection. This value was selected as a consistent and readily interpretable basis for comparing atmospheric regimes, receptor heights, and sensor sensitivities rather than as an operational safety criterion. Operational applications would likely require higher confidence levels (e.g., 90% detection probability), but the 50% threshold provides a useful measure of relative detectability across scenarios.
POD50 values were determined by evaluating detection probability across a range of emission values and identifying the minimum emission rate at which the probability threshold was exceeded. Linear interpolation was applied between discrete emission values to improve resolution and reduce numerical artefacts.
2.8. Rationale for Experimental Design
The experimental design was chosen to isolate and explore the dominant physical mechanisms governing methane detection in offshore environments. Specifically:
- Distance variation (50–2000 m) was used to capture the transition from near-field plume geometry effects to far-field dilution.
- Multiple atmospheric regimes were included to assess the influence of vertical mixing and stability.
- Two receptor heights were selected to represent key operational scenarios (helicopter vs vessel).
- A wide range of emission rates was used to capture both realistic and extreme release scenarios.
- Multiple detection thresholds were incorporated to evaluate the role of sensor sensitivity.
This combination of parameters enables a systematic assessment of how plume behaviour, environmental conditions, and instrumentation jointly control methane detectability, with direct relevance to offshore safety operations. The modelling framework is intended to represent first-order dispersion behaviour and detectability rather than reproduce the detailed flow field around a specific offshore structure. Building wake effects, transient meteorological variability, and dense-gas behaviour were not explicitly represented. The resulting scenarios therefore provide a simplified but physically interpretable basis for comparing detectability across atmospheric conditions.
The analysis explicitly considers uncertainty in wind speed and wind direction through Monte Carlo simulation. Other sources of uncertainty, including source height, plume dispersion coefficients, atmospheric regime occurrence frequency, sensor calibration, and emission intermittency, were not varied and were treated deterministically. The results should therefore be interpreted as representative of the selected scenarios rather than a complete quantification of detectability uncertainty.
2.9. Model Verification and Validation
The objective of the present study is not to reproduce a specific offshore release event, but to investigate how atmospheric structure, sensor sensitivity, and receptor geometry influence methane detectability. Consequently, emphasis was placed on ensuring that model behaviour is physically consistent with established atmospheric dispersion theory rather than calibrating against a single experimental dataset.
The Gaussian plume formulation adopted here reproduces several well-established dispersion characteristics reported in the atmospheric dispersion literature, including:
- increasing lateral and vertical plume spread with downwind distance;
- reduced peak concentrations with increasing wind speed;
- enhanced dilution under neutral, well-mixed conditions;
- suppression of vertical mixing under stable atmospheric conditions; and
- concentration enhancement due to reflection at the underlying surface.
These behaviours are consistent with classical Gaussian dispersion theory [25] and subsequent atmospheric dispersion texts [17,27]. Additional confidence in the model structure is provided by the agreement between predicted regime behaviour and observations of offshore methane measurement campaigns, which have reported strong sensitivity of plume transport and detectability to marine boundary layer structure, atmospheric stratification, and vertical decoupling [5,6,12]. The model should therefore be interpreted as a physically representative tool for exploring relative detectability across contrasting offshore atmospheric conditions rather than a site-specific prediction system. The predicted reduction in detectability under stratified conditions is consistent with the potential for plume lofting, missed transects, and atmospheric decoupling discussed in offshore methane measurement studies [22,28].
2.10. Use of Generative Artificial Intelligence
Microsoft 365 Copilot (Microsoft Corporation) was used during manuscript preparation to assist with drafting, restructuring, and improving the clarity of the text. The tool was not used to generate research questions, design the study, develop the modelling framework, produce data, perform analyses, interpret results, or draw scientific conclusions. All scientific content, modelling assumptions, analyses, and conclusions were developed and verified by the authors.
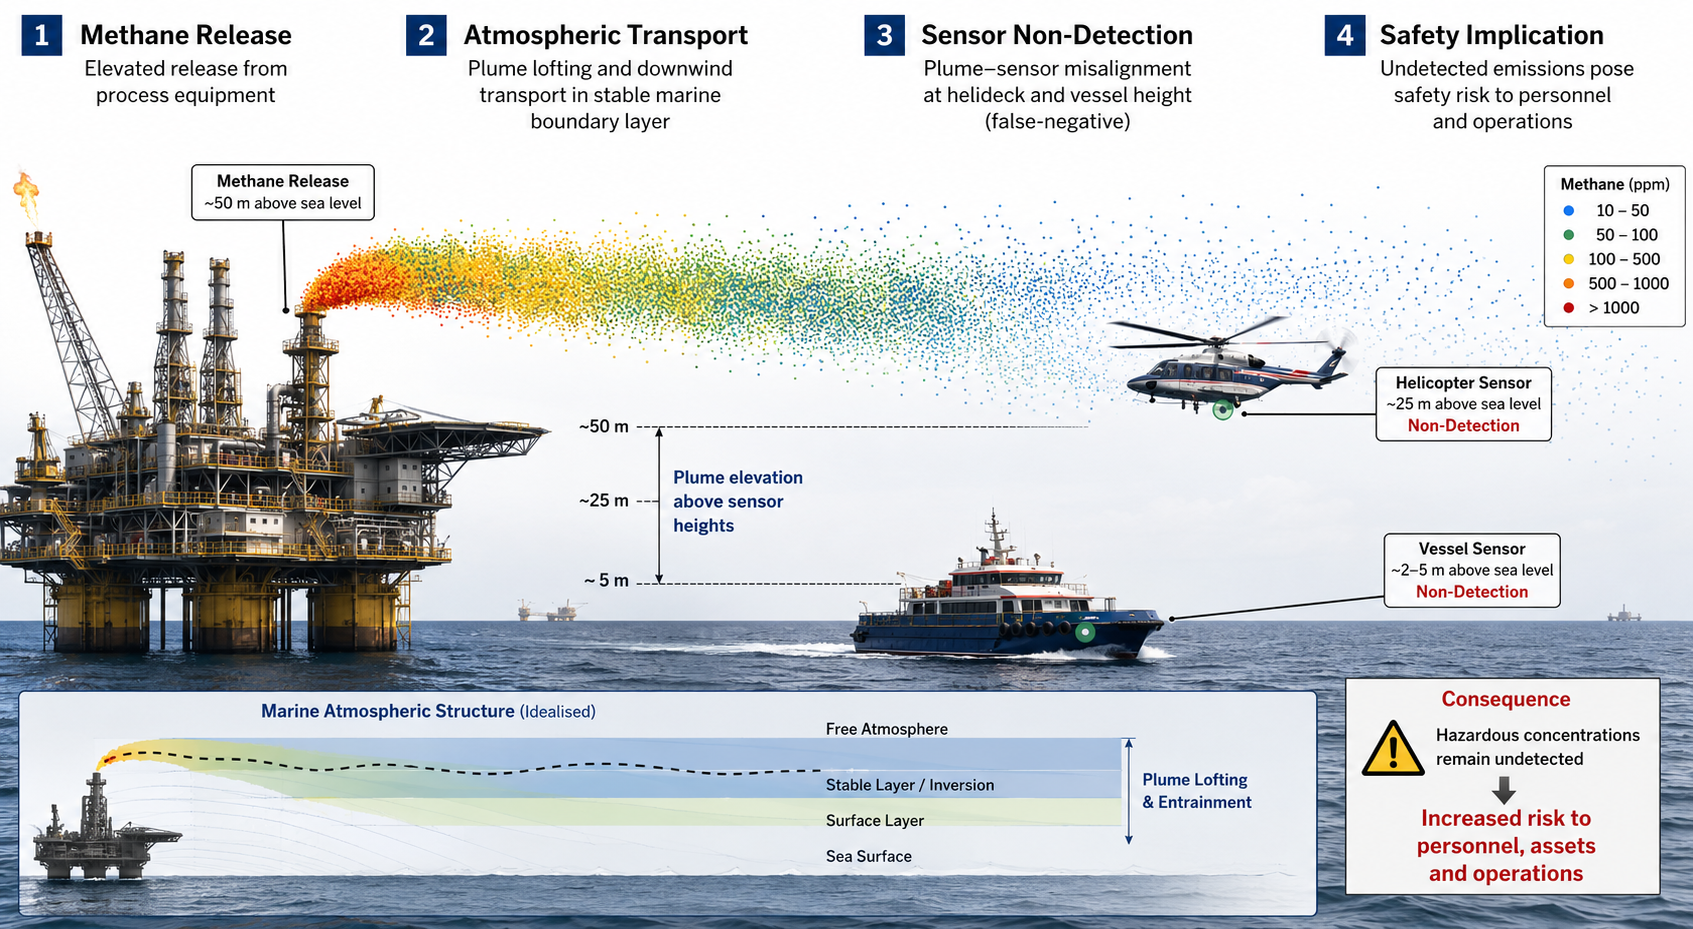
The graphical abstract was generated using OpenAI ChatGPT (GPT-5.6) with its DALL·E image-generation capability (OpenAI, 18 August 2026). The authors provided the scientific concept, visual specifications, spatial relationships, and terminology. The generated image was subsequently reviewed by the authors and modified as necessary to ensure scientific accuracy and appropriate representation of the methane transport and sensor non-detection concepts.
3. Results
3.1. Vertical Plume Structure and Near-Field Detectability
The vertical concentration profiles at a downwind distance of 50 m (Figure 1a and Figure 1d) show that methane concentrations are strongly centred around the source height (approximately 50 m), with limited vertical dispersion in the near field. At this distance, concentrations at both helideck height (25 m) and near-surface level (≈2 m) are negligible relative to the plume core. This indicates that, despite proximity to the source, both receptor locations lie outside the primary plume envelope. Peak methane concentrations occur close to the 50 m source elevation, while concentrations at both receptor heights remain well below the 0.1 ppm detection threshold. As a result, neither the helideck (25 m) nor vessel (2 m) receptors intersect the plume core within the first 50 m downwind.
This geometric misalignment has a direct impact on detection capability. As shown in Figure 1b and Figure 1e, detection probability at 50 m remains effectively zero across all emission rates (0.01–1000 g/s) for both helideck and vessel-mounted sensors when using a 0.1 ppm detection threshold. The absence of detection is therefore not attributable to insufficient emission strength, but rather to the lack of plume intersection with the sensor location. This highlights a fundamental limitation: near-field detection is constrained by plume geometry rather than emission magnitude or sensor sensitivity. This behaviour persists across the entire simulated emission range (0.01–1000 g s⁻¹; 0.04–3600 kg h⁻¹). Even the largest release considered fails to produce a detectable signal at either receptor location at 50 m downwind, demonstrating that plume–sensor alignment is a more important control on detectability than emission magnitude under these conditions.
3.2. Emergence of Detection at Intermediate Distances
At increased stand-off distances, plume spreading leads to a transition in detection behaviour. Figure 1c and Figure 1e shows detection probability as a function of emission rate at 200 m (helideck) and 2500 m (boat). In both cases, a characteristic sigmoidal relationship is observed, where detection probability increases rapidly beyond a threshold emission rate.
For helideck detection at 200 m (Figure 1c), detection becomes possible across most atmospheric regimes, although with strong variability. For example, under marine neutral deep conditions, the probability of detection exceeded 50% for emissions of approximately 5–10 g s⁻¹ (18–36 kg h⁻¹), whereas the same level of detectability was not achieved under stratified conditions even for emissions approaching 1000 g s⁻¹ (3600 kg h⁻¹). In contrast, stratified conditions remain largely undetectable across the entire emission range, indicating persistent plume–sensor separation.
At larger distances (e.g., 2500 m; Figure 1f), detection probability increases across all regimes due to enhanced plume dispersion, which increases the likelihood of vertical overlap with the sensor. However, this improvement is offset by dilution effects, requiring higher emission rates to achieve equivalent detection probabilities. This demonstrates a transition from geometry-limited detection in the near field to dilution-limited detection in the far field. The results therefore identify three distinct detection regimes: (i) a geometry-limited near field (<~200 m), where plume–sensor interception is unlikely; (ii) an intermediate zone (~400–800 m) where detectability is maximised; and (iii) a dilution-limited far field (>~1000 m), where increasing plume spread reduces concentration despite improved plume interception.
3.3. Critical Emission Thresholds and Sensitivity Dependence
Figure 2 provides the primary quantitative summary of methane detectability in the model framework. The combined sensitivity analysis (Figure 2) quantifies the minimum emission rate required to achieve a 50% detection probability as a function of distance, atmospheric regime, and sensor detection threshold (0.1–10 ppm).
At high sensitivity (0.1 ppm), detection is achievable across a wide range of distances and emission rates for both helideck and boat configurations (Figure 2a and Figure 2d). POD50 values typically fall within the range 10–100 g s⁻¹ (36–360 kg h⁻¹), with the lowest values occurring at intermediate distances. In several scenarios, emissions of less than 20 g s⁻¹ (72 kg h⁻¹) were sufficient to achieve a 50% probability of detection, demonstrating that highly sensitive instrumentation can identify relatively modest releases provided favourable plume interception occurs.
At moderate sensitivity (1 ppm), detection becomes significantly more constrained (Figure 2b and Figure 2e). POD50 values increase by approximately an order of magnitude, and substantial regions of the parameter space become undetectable, particularly under stratified and marine shallow conditions. In these regimes, near-field detection (<500 m) requires emissions exceeding several hundred g/s. Relative to the 0.1 ppm case, critical emission thresholds increase by approximately a factor of ten. For some marine shallow and stratified scenarios, detectability at distances below 500 m requires emissions exceeding 100–300 g s⁻¹ (360–1080 kg h⁻¹), reflecting the combined effects of reduced vertical mixing and elevated detection thresholds.
At low sensitivity (10 ppm), detection capability is severely degraded (Figure 2c and Figure 2f). At a 10 ppm threshold, emissions below approximately 100 g s⁻¹ (360 kg h⁻¹) are frequently undetectable. In several stratified and helideck scenarios, emissions approaching 1000 g s⁻¹ (~3600 kg h⁻¹) were required before the probability of detection exceeded 50%, indicating that very substantial leaks may remain undetected when relying on low-sensitivity instrumentation, resulting in personnel receiving an inaccurate indication of hazard status. In the near field, detection is effectively absent across all regimes, while in the far field, detection is only achieved for the highest emission rates considered.
3.4. Influence of Atmospheric Regime and Receptor Height
Detection behaviour is strongly dependent on both atmospheric regime and receptor elevation. Across all sensitivity levels, vessel-mounted sensors (2 m) generally exhibit lower critical emission thresholds than helideck-mounted sensors (25 m), particularly at intermediate and far-field distances. The difference becomes most pronounced at higher detection thresholds. At 10 ppm, vessel-mounted sensors frequently achieve the same level of detectability at emission rates several times lower than equivalent helideck-mounted sensors. This advantage arises because vertical plume growth increases the probability of plume interception closer to sea level than at elevated receptor heights. This reflects the increased likelihood of plume intersection at lower elevations once vertical dispersion develops.
However, both configurations exhibit similar limitations in the near field, where vertical mixing is insufficient to bring the plume into contact with either receptor height. Stratified conditions consistently produce the highest critical emission thresholds and the largest undetectable regions, reflecting reduced vertical diffusion and plume trapping. In the most extreme cases, stratified conditions increased critical emission thresholds from tens of g s⁻¹ to several hundred g s⁻¹ relative to neutral conditions. These increases correspond to approximately one order of magnitude degradation in detectability and confirm the dominant influence of atmospheric stability on offshore methane monitoring performance.
3.5. Quantitative Summary of Detectability
Several broad trends emerge across all simulations:
Detection at 50 m downwind was negligible for both helideck and vessel receptors, even for emissions approaching 1000 g s⁻¹ (~3600 kg h⁻¹). From a safety perspective, this represents a scenario in which personnel may be operating in close proximity to a significant methane release without receiving an indication of hazard from local sensing system
The lowest POD50 value generally occurred between approximately 400 and 800 m downwind, where plume spreading maximised plume–sensor overlap.
Increasing the detection threshold from 0.1 ppm to 10 ppm increased POD50 by approximately one order of magnitude.
Stratified atmospheric conditions consistently produced the highest critical emission thresholds and the largest regions of non-detection.
Emissions exceeding 1000 g s⁻¹ (~3600 kg h⁻¹) could remain undetectable under some combinations of receptor height, atmospheric regime, and detector sensitivity.
At a 10 ppm detection threshold, emissions approaching 1000 g s⁻¹ (~3600 kg h⁻¹) may remain undetectable under some atmospheric regimes and receptor configurations.
3.6. Implications for Detection-Based Safety Strategies
Across all simulations, a consistent pattern emerges: detection capability is governed by the combined effects of plume geometry, atmospheric stability, and dilution, rather than emission magnitude alone. In particular, the results demonstrate that:
Large emissions (up to ~3600 kg/h) may remain undetected at short range due to plume–sensor misalignment. Resulting in a false-negative situational awareness outcome.
Improved sensor sensitivity reduces but does not eliminate undetectable conditions.
Detection performance is non-monotonic with distance, with optimal detection occurring at intermediate ranges.
These findings indicate that absence of detection cannot be interpreted as absence of emission, even under conditions of significant release. This has direct implications for operational decision-making during offshore approach and boarding procedures. These findings are relevant not only to operational safety but also to offshore methane monitoring campaigns, where non-detection may contribute to underestimation of emissions.
4. Discussion
4.1. Role of Plume Geometry in Detection Failure
The results highlight that methane detectability is not governed solely by emission magnitude or sensor sensitivity, but is critically dependent on plume geometry relative to the detection location. The plume remains tightly centred around the source height in the near field (~50 m downwind), with limited vertical dispersion (Figure 1a and Figure 1d). Consequently, both helideck (25 m) and near-surface (~2 m) receptors lie outside the principal plume envelope at short distances.
The receptor locations considered here represent the concentrations that would be observed at characteristic operating heights and distances rather than the full trajectory of an approaching vessel or helicopter. Lower release heights would be expected to increase interaction with vessel-based receptors and reduce some of the non-detection effects reported here. The present study therefore focuses on a release geometry representative of elevated offshore emissions where detectability limitations are expected to be greatest.
This geometric mismatch explains the complete absence of detection (Figure 2b and Figure 2e), where detection probability remains effectively zero across all emission rates, including large releases exceeding 1000 g/s (~3600 kg/h). This finding is particularly important, as it demonstrates that even extreme emissions may remain undetectable in the near field if plume–sensor intersection does not occur. The implication is that detection failure can arise from atmospheric structure rather than insufficient emission strength, challenging the assumption that proximity ensures detectability.
The behaviour predicted by the model is broadly consistent with established atmospheric dispersion theory and with observations from offshore methane measurement campaigns [5,17,25,29]. Previous studies have shown that offshore methane plume behaviour is strongly influenced by marine boundary layer structure, atmospheric stability, and vertical decoupling of airflow [22,29]. Aircraft-based surveys of offshore facilities have highlighted difficulties associated with plume interception and have demonstrated that atmospheric structure can substantially influence measured emissions and apparent detectability [5,6,12]. Similar effects have been discussed in offshore methane quantification studies, where stratified boundary layers and plume lofting can result in missed observations despite the presence of significant emissions [22,28].
The emergence of a detectability optimum at intermediate distances is therefore physically plausible. Near the source, plume dispersion is insufficient to bring methane into contact with the receptor, while at larger distances dilution reduces concentrations below the detection threshold. This balance between plume interception and dilution is a natural consequence of Gaussian plume growth and is consistent with established dispersion behaviour.
4.2. Transition from Geometry-Limited to Dilution-Limited Detection
At increasing distances, plume spreading increases the likelihood of intersection between the plume and the detector, leading to the emergence of measurable concentrations and increasing detection probability. Detection probability evolves from zero to a sigmoidal response with emission rate as distance increases (Figure 1c and Figure 1f). The results suggest that detectability operates within two distinct regimes. In the near field, detection is geometry-limited, governed by plume alignment and vertical dispersion. At intermediate distances, detection becomes optimised, as plume spreading enhances overlap with the sensor while concentrations remain sufficiently high. At larger distances, however, dilution dominates, leading to a reduction in concentrations and an increase in the emission rate required for detection. This behaviour is reflected clearly in the non-monotonic trends, where POD50 values exhibit a minimum at intermediate distances (~400–800 m). Such behaviour is consistent across detection thresholds and receptor heights, indicating that optimal detectability occurs within a limited spatial window rather than at either extreme of proximity. The use of POD50 values should therefore be viewed as a comparative detectability metric rather than a criterion for operational decision making.
Although the absence of detection at very short ranges may initially appear counterintuitive, it is a direct consequence of elevated release geometry. In many operational settings there is an implicit expectation that proximity to a source improves detectability. The present results demonstrate that this assumption is not necessarily valid. For elevated releases, concentrations may remain concentrated around the source height over the first few hundred metres downwind, resulting in limited exposure at both helideck and sea-level receptors [29,30,31]. In this respect, the predicted behaviour should be viewed as an expected outcome of atmospheric transport physics rather than a modelling anomaly.
4.3. Influence of Detection Threshold and Sensor Sensitivity
Detection threshold exerts a strong influence on detectability, with increases in threshold from 0.1 ppm to 10 ppm producing approximately an order-of-magnitude increase in the required emission rate for detection (Figure 2). At high sensitivity (0.1 ppm), detection is achievable across most distances and regimes for emissions in the range 10–100 g/s (36–360 kg/h). However, as the detection threshold increases, significant portions of the parameter space become undetectable. At a threshold of 10 ppm, detection is only possible for the largest emissions considered (~500–1000 g/s), and even then only within a restricted range of distances. In particular, near-field detection (<~300–500 m) is effectively absent across all regimes, while far-field detection is constrained by dilution. These findings indicate that sensor sensitivity alone cannot guarantee reliable detection, particularly when plume–sensor alignment is unfavourable.
4.4. Atmospheric Regime Dependence
Atmospheric stability plays a central role in determining plume dispersion and, consequently, detection performance. Across both figures, stratified conditions consistently produce the highest critical emission thresholds and the lowest detection probabilities. This reflects the suppression of vertical mixing under stable stratification, which limits plume spread and reduces the probability of interaction with the detector. In contrast, marine neutral deep conditions tend to produce more uniform dispersion, resulting in earlier onset of detection in terms of emission rate (Figure 2c and Figure 2f). However, these same conditions also promote stronger dilution at greater distances, leading to increased critical thresholds in the far field. This highlights a trade-off between dispersion-driven plume interception and dilution-driven signal attenuation, which varies by atmospheric regime.
4.5. Influence of Receptor Height and Operational Context
Comparison of helideck (25 m) and vessel (2 m) detection indicates that receptor height has a significant but distance-dependent impact on detectability. Near-field results show minimal difference between the two, as neither location intersects the plume. At intermediate and far-field distances, however, vessel-mounted sensors generally exhibit lower critical emission thresholds, reflecting greater likelihood of intersecting the lower portion of the plume following vertical spread. Despite this advantage, both receptor configurations exhibit substantial regions of non-detection, particularly under low-sensitivity thresholds and stratified conditions. These findings suggest that neither aerial nor surface-based detection alone provides comprehensive coverage across operating conditions, reinforcing the need for a combined or redundant detection strategy.
Despite the limitations demonstrated here, operational reliance on gas detection remains widespread throughout the offshore sector. This is understandable because gas detection systems provide immediate, objective, and easily interpretable information. Furthermore, many safety procedures have historically evolved around the assumption that hazardous releases will generate detectable concentrations before creating unacceptable risk. However, relatively little consideration has been given to situations in which atmospheric structure prevents plume–sensor interaction. In such cases, the absence of detection may be interpreted as evidence of safety when it merely reflects a lack of sampling opportunity. The present results suggest that this distinction is particularly important for offshore environments, where elevated releases, marine boundary layer structure, and atmospheric stratification can combine to produce significant regions of non-detection. Consequently, reliance on detector response alone may overstate situational awareness under some operating conditions.
4.6. Implications for Offshore Safety and Detection-Based Decision-Making
The results have important implications for offshore operational safety, particularly in relation to approach procedures and the use of gas detection as a safety indicator. Across all scenarios, the model demonstrates that large emissions, including those on the order of several thousand kg h-1, may remain undetected under realistic atmospheric and geometric conditions. The near-field non-detection scenarios identified here may be interpreted as false-negative detection outcomes, in which the monitoring system indicates no methane presence despite the existence of a potentially hazardous release.
This leads to a critical conclusion that the absence of detectable methane concentrations does not imply the absence of a hazardous emission.
This is especially relevant during helicopter approach or vessel transfer operations, where decisions may be influenced by real-time sensor readings. The findings indicate that reliance on detection alone may result in false negatives, particularly in the near field or under stratified conditions. More broadly, the results suggest that detection systems should be interpreted as partial indicators of risk, rather than definitive measures of safety. Incorporating atmospheric conditions, plume behaviour, and detection limitations into operational decision frameworks could significantly improve situational awareness and risk management.
From an operational perspective, the results suggest several practical implications. First, the absence of methane detection should not be interpreted as confirmation that emissions are absent. Second, atmospheric conditions should be considered when interpreting detector readings, particularly during stable or stratified periods. Third, reliance on a single detector location may be insufficient where elevated releases are possible. Finally, detectability assessments may provide a useful complement to traditional hazard analyses by identifying conditions under which emissions are likely to remain unobserved despite exceeding environmentally significant release rates. Potential mitigations include the use of multiple receptor locations, incorporation of meteorological information into operational decisions, and deployment of higher-sensitivity instrumentation where practicable.
The findings have particular relevance for normally unattended installations, where personnel approaches may occur after extended periods without direct observation of operating conditions. In such cases, operators may rely heavily on gas detection systems and remote monitoring to inform go/no-go decisions. The results suggest that atmospheric conditions can significantly influence the effectiveness of these safeguards, potentially creating circumstances in which personnel may receive an inaccurate indication of hazard status despite the presence of monitoring systems.
Although the principal focus of this study is offshore operational safety, the findings are also relevant to environmental monitoring. Recent measurement studies have demonstrated that offshore methane emissions may contribute more substantially to greenhouse gas inventories than previously estimated. The results presented here suggest that atmospheric transport processes may influence not only hazard detection but also the probability of observing and quantifying offshore methane emissions. Consequently, conditions that reduce operational detectability may also contribute to underestimation of emissions during monitoring campaigns.
The primary contribution of this study is not the underlying Gaussian plume formulation, which is well established, but the application of probabilistic detectability concepts to offshore methane safety scenarios. Previous research has focused largely on emission quantification and atmospheric transport, whereas the present work considers the probability that a release will be observed by operational detection systems. This shift in perspective provides a framework for examining detection failure as a function of atmospheric conditions, sensor sensitivity, and receptor geometry.
In practical terms, the results suggest that gas detection should be viewed as one element within a wider safety barrier system rather than a standalone indicator of safe operating conditions. Atmospheric structure can undermine the effectiveness of a monitoring barrier without any failure of the detector itself. Consequently, safety assessments that rely solely on detector response may overestimate the effectiveness of hazard identification under offshore conditions. The results suggest that methane detection should be considered a conditional safety barrier whose effectiveness depends not only on instrument performance but also on atmospheric transport conditions.
4.7. Model Validity and Limitations
Although the model has not been calibrated against a specific controlled release experiment, the principal trends predicted are consistent with established atmospheric dispersion theory. The emergence of a detection optimum at intermediate distances, the reduction in detectability under stratified conditions, and the strong influence of receptor height all arise directly from physically realistic representations of plume growth, turbulence suppression, and atmospheric layering. Similar challenges associated with marine boundary layer structure and plume interception have been reported in offshore methane quantification studies, where stratification and atmospheric decoupling can lead to substantial measurement uncertainty and plume non-detection [12,22,28,29,32].
The predicted reduction in detectability under stratified conditions is consistent with observations [28], where it was noted that vertical decoupling within the marine boundary layer can lead to plume lofting, missed transects, and substantial under-detection of offshore methane emissions. While the model was not calibrated against a specific field release experiment, its predicted behaviour is consistent with established Gaussian dispersion theory and with observations from offshore methane measurement campaigns that highlight the importance of atmospheric stratification, marine boundary layer structure, and plume–receptor alignment.
The use of a baseline wind speed of 5 m s⁻¹ should be considered when interpreting the results. The selected value represents a relatively weak offshore ventilation state and was chosen to explore detectability under conditions favourable to plume persistence. Detection performance under stronger winds would be expected to degrade further as increased turbulence and dilution reduce methane concentrations at the receptor. Consequently, the detectability reported here is likely to represent an upper estimate relative to more strongly ventilated offshore environments. Future work should examine the sensitivity of the results to wind speed, as increased dilution at higher offshore wind speeds would be expected to further reduce detectability.
5. Conclusions
This study has examined the detectability of methane emissions from offshore sources as a function of emission rate, atmospheric regime, receptor height, and sensor sensitivity. The results demonstrate that detection behaviour is governed by a combination of plume geometry, atmospheric dispersion, and dilution processes, rather than emission magnitude alone.
Firstly, detection failure in the near field (<~200 m) is primarily controlled by plume–sensor misalignment. Vertical plume profiles show that, at short distances, methane concentrations remain centred around the source height, resulting in negligible concentrations at both helideck (25 m) and near-surface (~2 m) receptor locations. Consequently, even very large emissions (up to ~1000 g/s, equivalent to ~3600 kg/h) may remain undetected at close range, regardless of sensor sensitivity. This scenario represents a false-negative detection outcomes in which a hazardous release is present but sensor observations suggest otherwise.
Secondly, detectability exhibits a non-monotonic dependence on distance. Detection improves at intermediate distances (~400–800 m), where plume spreading increases the likelihood of intersection with the sensor. Beyond this region, dilution dominates, leading to a reduction in concentration and a corresponding increase in the emission rate required for detection. This behaviour indicates that optimal detection occurs within a limited spatial window rather than at minimum distance from the source.
Thirdly, sensor sensitivity strongly influences detection thresholds but does not eliminate undetectable conditions. Increasing the detection threshold from 0.1 ppm to 10 ppm results in approximately an order-of-magnitude increase in the minimum detectable emission rate. At 10 ppm, detection is limited to large emissions and narrow distance ranges, with significant portions of the parameter space remaining undetectable across all atmospheric regimes.
Fourthly, atmospheric stability and receptor height play a critical role. Stratified conditions consistently produce the highest detection thresholds due to suppressed vertical mixing, while neutral conditions facilitate earlier plume interception but also increase dilution at larger distances. Vessel-mounted detection (2 m) generally performs better than helideck detection (25 m) at intermediate and long distances; however, both configurations exhibit substantial regions of detection failure.
Overall, the findings demonstrate that the absence of detectable methane concentrations does not imply the absence of a hazardous emission. This has important implications for offshore operations, particularly in the context of helicopter approach and vessel transfer procedures where reliance on gas detection may inform safety decisions. Detection systems should therefore be regarded as imperfect safety barriers whose effectiveness may be reduced by atmospheric conditions, plume geometry, and receptor location. The POD50 values presented in this study are based on a 50% probability of detection and should therefore be interpreted as comparative indicators of detectability rather than operational decision thresholds. In practice, safety-critical applications would likely require substantially higher confidence levels before approach or transfer operations could be considered acceptable.
Author Contributions
Conceptualization, S.N.R.; methodology, S.N.R.; software, S.N.R.; formal analysis, S.N.R.; investigation, S.N.R.; writing—original draft preparation, S.N.R.; writing—review and editing, M.M. All authors have read and agreed to the published version of the manuscript.
Funding
This research received no external funding.
Institutional Review Board Statement
Not applicable.
Informed Consent Statement
Not applicable.
Data Availability Statement
The data presented in this study are available in the article.
Conflicts of Interest
The author declares no conflicts of interest.
References
- BSEE Bureau of Safety and Environmental Enforcement (BSEE) Safety and Environmental Management Systems—SEMS. Available online: hDps://www.bsee.gov/sems (accessed on 10 August 2026).
- Riddick, S.N.; Mbua, M.; Laughery, C.; Zimmerle, D.J. Assessing the Potential Impact of Fugitive Methane Emissions on Offshore Platform Safety. Safety 2025, 11, 115. [Google Scholar] [CrossRef]
- Riddick, S.N.; Mauzerall, D.L. Likely Substantial Underestimation of Reported Methane Emissions from United Kingdom Upstream Oil and Gas Activities. Energy Environ. Sci. 2023, 16, 295–304. [Google Scholar] [CrossRef]
- Lelieveld, J.; Crutzen, P.J.; Dentener, F.J. Changing Concentration, Lifetime and Climate Forcing of Atmospheric Methane. Tellus B 1998, 50, 128–150. [Google Scholar] [CrossRef]
- Gorchov Negron, A.M.; Kort, E.A.; Chen, Y.; Brandt, A.R.; Smith, M.L.; Plant, G.; Ayasse, A.K.; Schwietzke, S.; Zavala-Araiza, D.; Hausman, C.; et al. Excess Methane Emissions from Shallow Water Platforms Elevate the Carbon Intensity of US Gulf of Mexico Oil and Gas Production. Proc. Natl. Acad. Sci. U.S.A. 2023, 120, e2215275120. [Google Scholar] [CrossRef] [PubMed]
- Foulds, A.; Allen, G.; Shaw, J.T.; Bateson, P.; Barker, P.A.; Huang, L.; Pitt, J.R.; Lee, J.D.; Wilde, S.E.; Dominutti, P.; et al. Quantification and Assessment of Methane Emissions from Offshore Oil and Gas Facilities on the Norwegian Continental Shelf. Atmos. Chem. Phys. 2022, 22, 4303–4322. [Google Scholar] [CrossRef]
- Riddick, S.N.; Mbua, M.; Laughery, C.; Zimmerle, D.J. Calculating Methane Emissions from Offshore Facilities Using Bottom-Up Methods. Eng 2025, 6, 199. [Google Scholar] [CrossRef]
- EMEP/EEA EMEP/EEA Air Pollutant Emission Inventory Guidebook 2019: Technical Guidance to Prepare National Emission Inventories. 978-92-9480-098-5. Open WorldCat. Available online: https://op.europa.eu/publication/manifestation_identifier/PUB_THAL19015ENN (accessed on 25 October 2022).
- SRI Scientific Research Institute of Atmospheric Air Protection. Emissions of Hydrocarbons in Gas Industry, Oil Production Industry, Gas-and Oil Refining Industries of Russia; Clearstone Engineering Ltd.
- GRI and EPA; Harrison, M.R.; Shires, T.M.; Wessels, J.K.; Cowgill, R. M. Methane Emissions from the Natural Gas Industry, Volumes 1 – 15, Final Report, GRI-94/0257 and EPA-600/R-96- 080. Gas Research Institute and US Environmental Protection Agency, June 1996. 1996.
- Harrison, M.R.; Campbell, L.M.; Shires, T.M.; Cowgill, R.M. Methane Emissions from the Natural Gas Industry. In Technical Report, Final Report, GRI-94/0257.1 and EPA-600/R-96-080b; Gas Research Institute and U.S. Environmental Protection Agency, June 1996. 1996; Volume 2. [Google Scholar]
- Ayasse, A.K.; Thorpe, A.K.; Cusworth, D.H.; Kort, E.A.; Negron, A.G.; Heckler, J.; Asner, G.; Duren, R.M. Methane Remote Sensing and Emission Quantification of Offshore Shallow Water Oil and Gas Platforms in the Gulf of Mexico. Environ. Res. Lett. 2022, 17, 084039. [Google Scholar] [CrossRef]
- Brkić, D. Fire Hazards Caused by Equipment Used in Offshore Oil and Gas Operations: Prescriptive vs. Goal-Oriented Legislation. Fire 2025, 8, 29. [Google Scholar] [CrossRef]
- Brkić, D.; Praks, P. Probability Analysis and Prevention of Offshore Oil and Gas Accidents: Fire as a Cause and a Consequence. Fire 2021, 4, 71. [Google Scholar] [CrossRef]
- Benny, A.; V R, R. A Review of Risk Analysis and Accident Prevention of Blowout Events in Offshore Drilling Operations. Saf. Extrem. Environ. 2025, 7, 1. [Google Scholar] [CrossRef]
- API American Petroleum Institute. Recommended Practice 14c Seventh Edition, March 2001. Recommended Practice for Analysis, Design, Installation, and Testing of Basic Surface Safety Systems for Offshore Production Platforms. Upstream Segment. Available online: https://law.resource.org/pub/us/cfr/ibr/002/api.14c.2001.pdf (accessed on 10 August 2026).
- Seinfeld, J.H.; Pandis, S.N. Atmospheric Chemistry and Physics: From Air Pollution to Climate Change, Third edition.; John Wiley & Sons, Inc: Hoboken, New Jersey, 2016; ISBN 978-1-118-94740-1. [Google Scholar]
- EPA 454/B 95 003a (Vol. I) and EPA 454/B 95 003b (Vol. II); US EPA Industrial Source Complex (ISC3) Dispersion Model, Research Triangle Park, NC: U.S. Environmental Protection Agency. User’s Guide. 1995.
- Stull, R.B. (Ed.) An Introduction to Boundary Layer Meteorology; Springer Netherlands: Dordrecht, 1988; ISBN 978-90-277-2769-5. [Google Scholar]
- Galewsky, J.; Jensen, M.P.; Delp, J. Marine Boundary Layer Decoupling and the Stable Isotopic Composition of Water Vapor. JGR Atmos. 2022, 127, e2021JD035470. [Google Scholar] [CrossRef]
- Albrecht, B.A.; Jensen, M.P.; Syrett, W.J. Marine Boundary Layer Structure and Fractional Cloudiness. J. Geophys. Res. 1995, 100, 14209–14222. [Google Scholar] [CrossRef]
- Riddick, S.N. Atmospheric Regimes Create Structural Uncertainty in Offshore Methane Emission Estimates. Atmosphere 2026, 17, 720. [Google Scholar] [CrossRef]
- Riddick, S. Fugitive Methane Emissions. In Cleaner Petroleum Production and Refining Technologies; Riazi, M.R., Yarranton, H.W., Eds.; Wiley, 2026; pp. 77–116. ISBN 978-1-394-20923-1. [Google Scholar]
- Tait, J.; Hetherington, C.; Tait, A. Enhancing Student Employability with Simulation: The Virtual Oil Rig and DART. In Proceedings of the 3rd International Enhancement in Higher Education Conference: Inspiring Excellence, Glasgow, UK, 2017. [Google Scholar]
- Turner, D.B. Workbook of Atmospheric Dispersion Estimates . In US; EPA, ASRL: Research Triangle Park, North Carolina., 1970. [Google Scholar]
- Garratt, J. Review: The Atmospheric Boundary Layer. Earth-Sci. Rev. 1994, 37, 89–134. [Google Scholar] [CrossRef]
- Hanna, S.R.; Schulman, L.L.; Paine, R.J.; Pleim, J.E.; Baer, M. Development and Evaluation of the Offshore and Coastal Dispersion Model. J. Air Pollut. Control Assoc. 1985, 35, 1039–1047. [Google Scholar] [CrossRef]
- Riddick, S.N.; Mbua, M.; Laughery, C.; Zimmerle, D.J. A Review of Offshore Methane Quantification Methodologies. Atmosphere 2025, 16, 626. [Google Scholar] [CrossRef]
- Yacovitch, T.I.; Daube, C.; Herndon, S.C. Methane Emissions from Offshore Oil and Gas Platforms in the Gulf of Mexico. Environ. Sci. Technol. 2020, 54, 3530–3538. [Google Scholar] [CrossRef] [PubMed]
- Riddick, S.N.; Mauzerall, D.L.; Celia, M.; Harris, N.R.P.; Allen, G.; Pitt, J.; Staunton-Sykes, J.; Forster, G.L.; Kang, M.; Lowry, D.; et al. Methane Emissions from Oil and Gas Platforms in the North Sea. Atmos. Chem. Phys. 2019, 19, 9787–9796. [Google Scholar] [CrossRef]
- Nara, H.; Tanimoto, H.; Tohjima, Y.; Mukai, H.; Nojiri, Y.; Machida, T. Emissions of Methane from Offshore Oil and Gas Platforms in Southeast Asia. Sci. Rep. 2015, 4. [Google Scholar] [PubMed]
- Gorchov Negron, A.M.; McDonald, B.C.; McKeen, S.A.; Peischl, J.; Ahmadov, R.; de Gouw, J.A.; Frost, G.J.; Hastings, M.G.; Pollack, I.B.; Ryerson, T.B.; et al. Development of a Fuel-Based Oil and Gas Inventory of Nitrogen Oxides Emissions. Environ. Sci. Technol. 2018, 52, 10175–10185. [Google Scholar] [CrossRef] [PubMed]
Figure 1.
Relationship between plume structure and methane detectability at different operational distances. (a,d) Vertical concentration profiles at 50 m downwind distance for a representative emission case, showing plume centring around the source height (~50 m). The dashed lines indicate typical helideck height (25 m) and vessel height (~2 m), respectively. (b,e) Detection probability as a function of emission rate at 50 m for helideck (b) and vessel (e) receptors using a 0.1 ppm detection threshold. Detection probability remains effectively zero across all emission rates, indicating that both receptors lie outside the plume envelope in the near field. (c,f) Detection probability at increased distances (200 m for the helideck and 2500 m for the vessel). At these distances, plume spreading leads to increasing overlap between the plume and the detection height, resulting in the emergence of a sigmoidal relationship between emission rate and detection probability. Atmospheric regime strongly influences detectability, with marine neutral deep conditions exhibiting earlier detection onset, while stratified conditions show delayed or suppressed detection due to limited vertical dispersion.
Figure 1.
Relationship between plume structure and methane detectability at different operational distances. (a,d) Vertical concentration profiles at 50 m downwind distance for a representative emission case, showing plume centring around the source height (~50 m). The dashed lines indicate typical helideck height (25 m) and vessel height (~2 m), respectively. (b,e) Detection probability as a function of emission rate at 50 m for helideck (b) and vessel (e) receptors using a 0.1 ppm detection threshold. Detection probability remains effectively zero across all emission rates, indicating that both receptors lie outside the plume envelope in the near field. (c,f) Detection probability at increased distances (200 m for the helideck and 2500 m for the vessel). At these distances, plume spreading leads to increasing overlap between the plume and the detection height, resulting in the emergence of a sigmoidal relationship between emission rate and detection probability. Atmospheric regime strongly influences detectability, with marine neutral deep conditions exhibiting earlier detection onset, while stratified conditions show delayed or suppressed detection due to limited vertical dispersion.
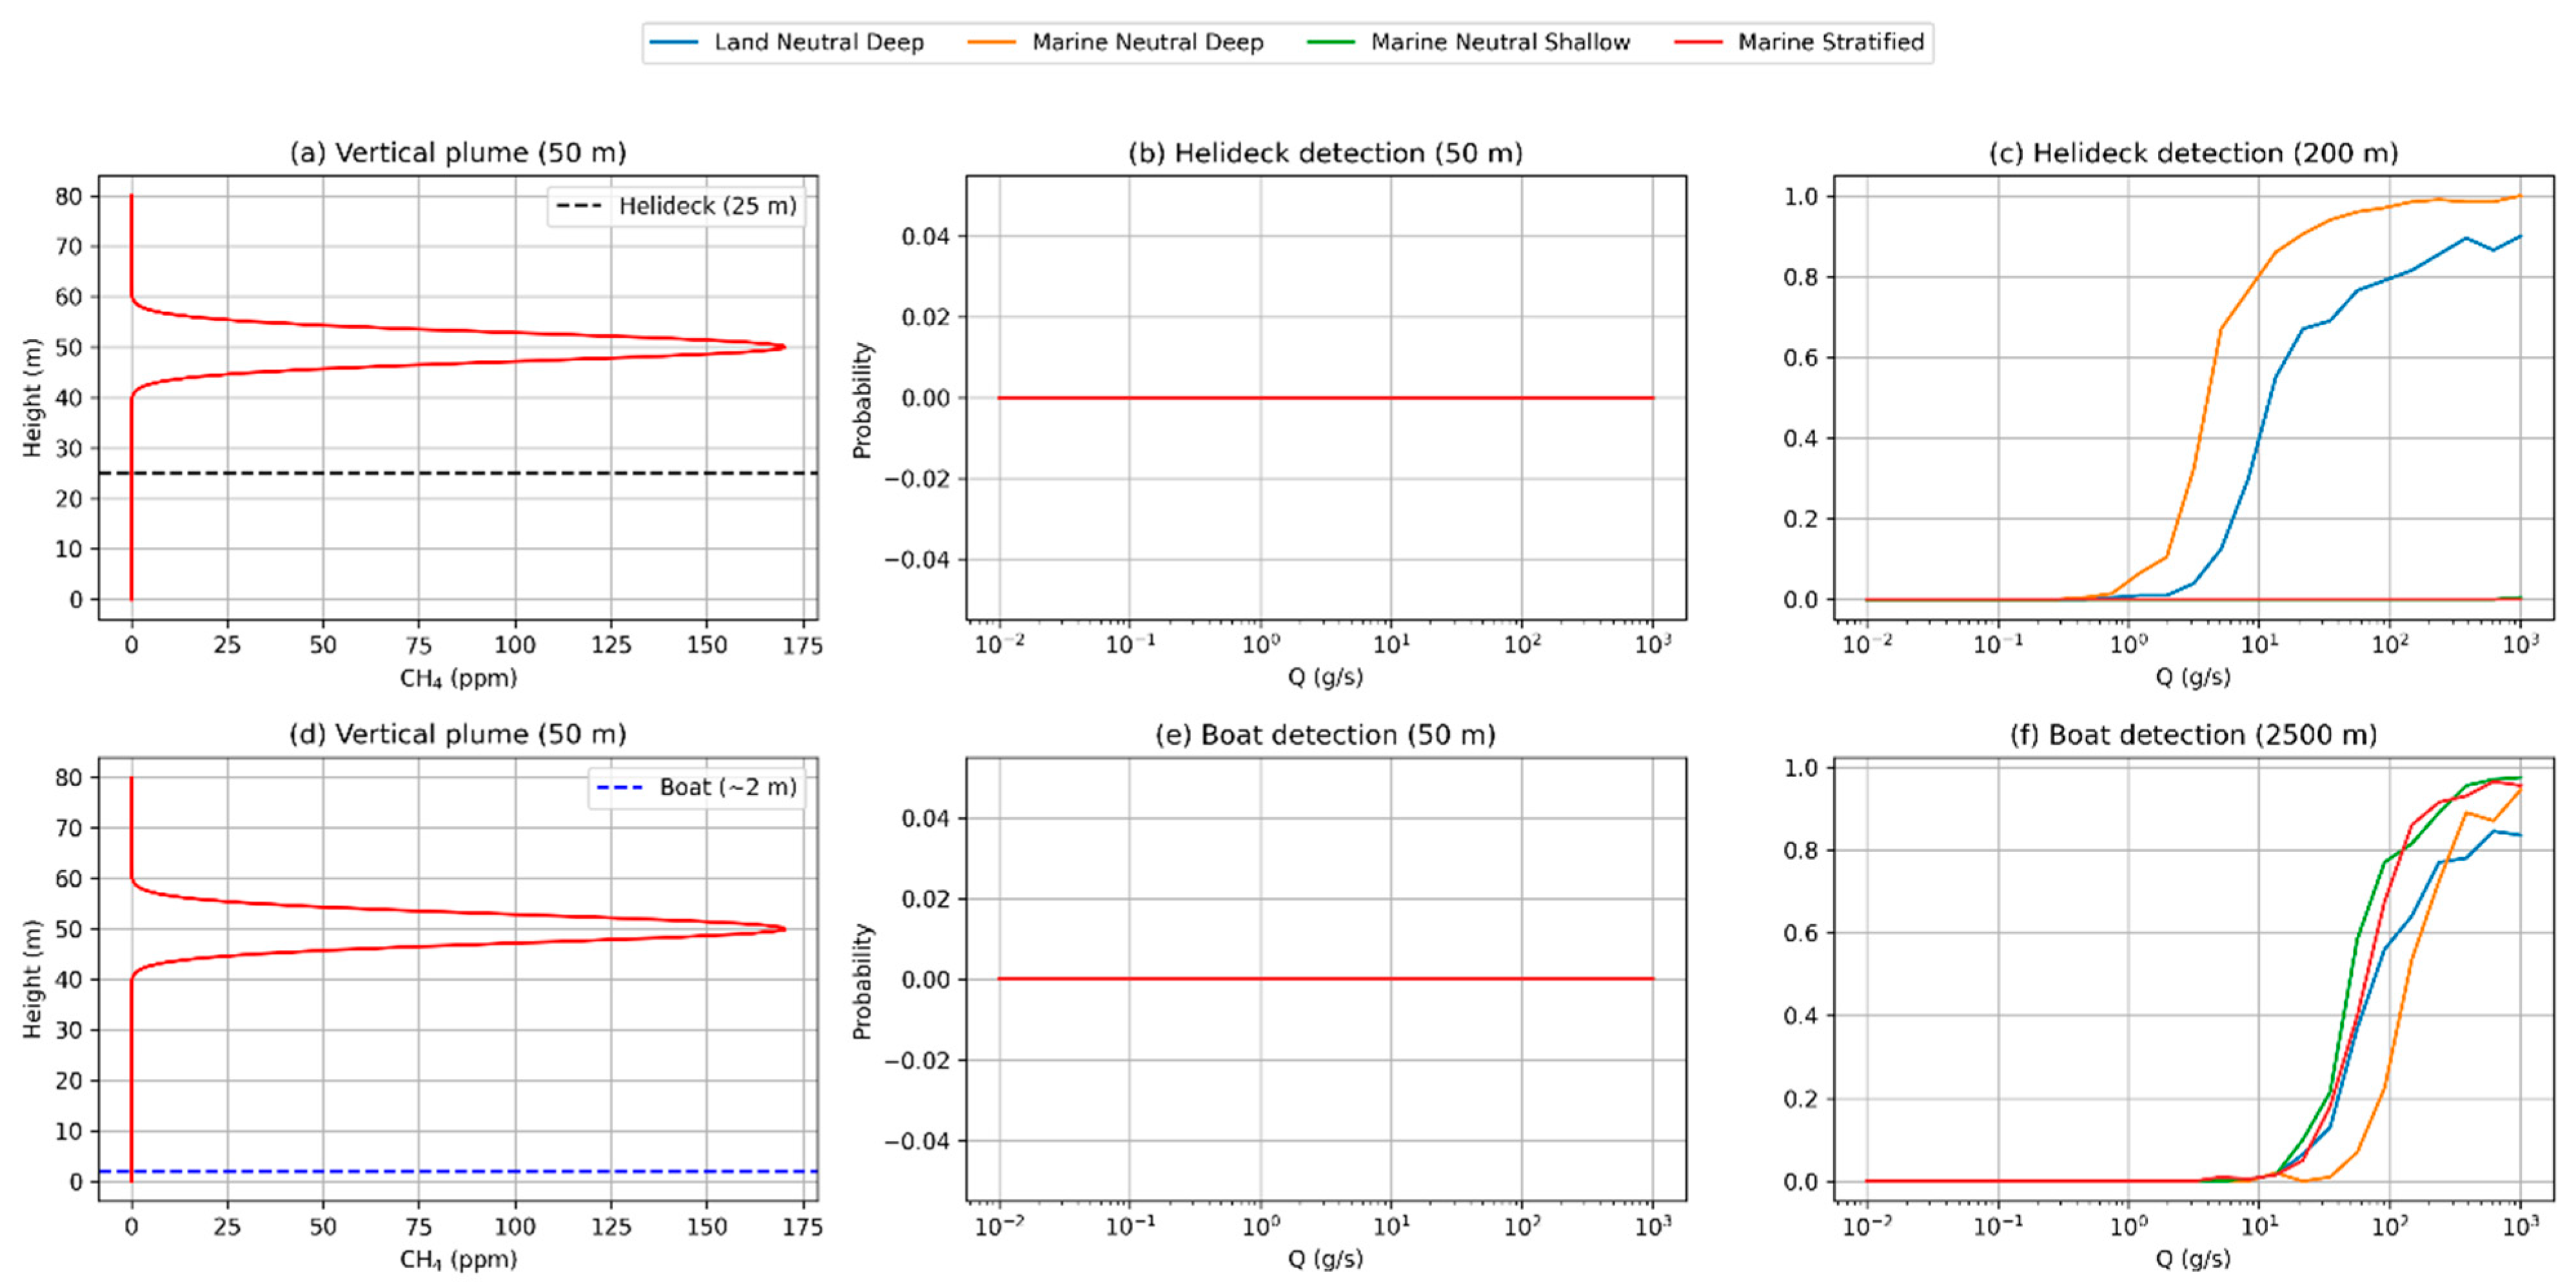
Figure 2.
Critical emission rate (POD50) required to achieve a 50% probability of methane detection as a function of distance, atmospheric regime, sensor sensitivity, and receptor height. The upper row shows results at helideck elevation (25 m), while the lower row shows near-surface conditions representative of vessel-based detection (≈2 m). Columns correspond to detection thresholds of 0.1 ppm, 1 ppm, and 10 ppm. Each curve represents a different atmospheric regime: land neutral deep (blue), marine neutral deep (orange), marine neutral shallow (green), and marine stratified (red).
Figure 2.
Critical emission rate (POD50) required to achieve a 50% probability of methane detection as a function of distance, atmospheric regime, sensor sensitivity, and receptor height. The upper row shows results at helideck elevation (25 m), while the lower row shows near-surface conditions representative of vessel-based detection (≈2 m). Columns correspond to detection thresholds of 0.1 ppm, 1 ppm, and 10 ppm. Each curve represents a different atmospheric regime: land neutral deep (blue), marine neutral deep (orange), marine neutral shallow (green), and marine stratified (red).
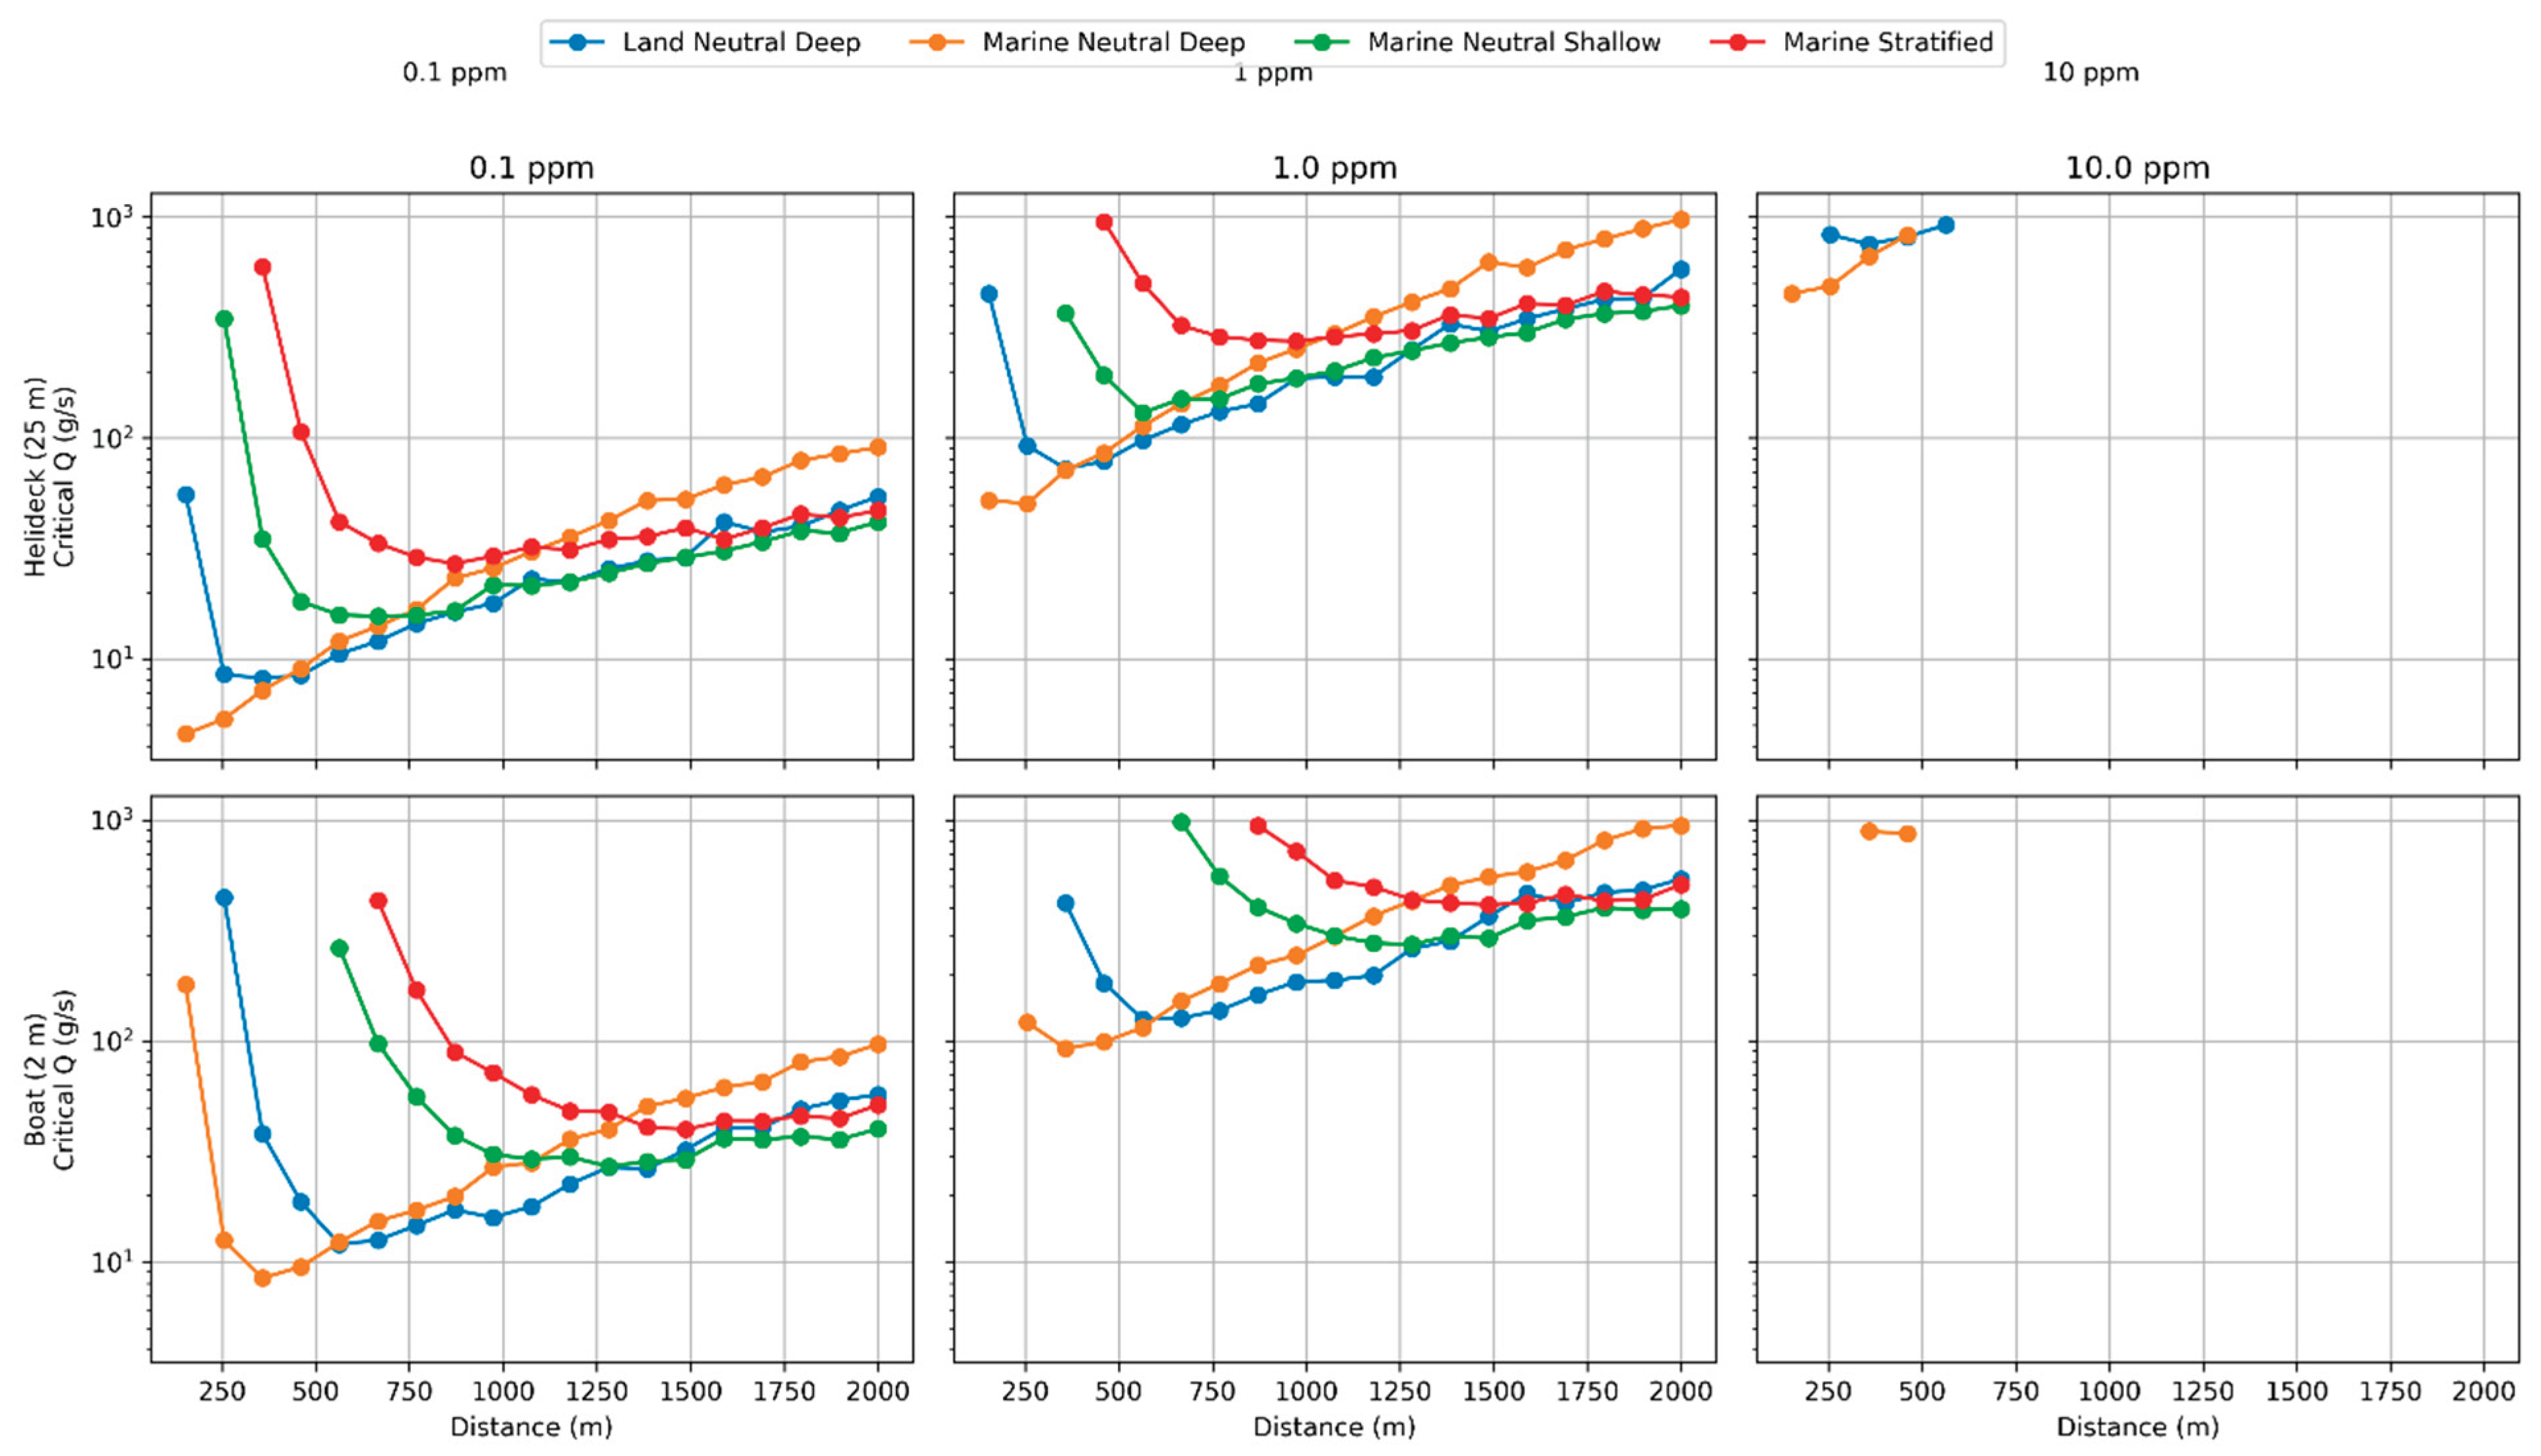

Table 1.
Input parameters and assumptions used in the methane detectability simulations.
| Parameter | Symbol | Value(s) | Units | Notes |
| Emission rate | 0.01–1000 | g s-1 | Varied parametrically; equivalent to approximately 0.04–3600 kg h-1 | |
| Wind speed | 5 | m s-1 | Baseline offshore condition | |
| Wind speed uncertainty | – | ±2 | m s-1 | Applied using Monte Carlo sampling |
| Wind direction uncertainty | – | ±10° | degrees | Applied using Monte Carlo sampling |
| Source height | 50 | m | Representative offshore process release elevation | |
| Methane molecular weight | MW | 16.04 | g mol-1 | Used for ppm conversion |
| Atmospheric pressure | 101325 | Pa | Standard conditions | |
| Atmospheric temperature | 288 | K | Standard conditions | |
| Helideck receptor height | – | 25 | m | Representative helicopter approach height |
| Vessel receptor height | – | 2 | m | Representative boat transfer height |
| Evaluation distance | 50–2000 | m | Near-, intermediate-, and far-field analysis | |
| Detection threshold | – | 0.1, 1, 10 | ppm | High-, moderate-, and low-sensitivity sensors |
| Marine neutral deep boundary layer height | >500 | m | Well-mixed marine boundary layer | |
| Marine neutral shallow boundary layer height | ~100 | m | Vertically constrained marine boundary layer | |
| Marine stratified inversion height | 70 | m | Soft capping inversion applied | |
| Vertical velocity fluctuation (stratified) | < 0.2 | m s-1 | Suppressed turbulence | |
| Monte Carlo simulations | 1000 | – | Number of independent simulations per scenario | |
| Critical detection probability | POD50 | 0.5 | – | Used to define critical emission threshold |
Table 2.
Atmospheric regimes considered.
| Regime | Stability Characteristics | Typical | Mixing Behaviour |
| Land Neutral Deep | Neutral, deep mixed layer | Strong vertical mixing | |
| Marine Neutral Deep | Neutral offshore boundary layer | Well mixed, coupled flow | |
| Marine Neutral Shallow | Weakly stable, shallow mixed layer | 0.1–0.25 | Reduced vertical dispersion |
| Marine Stratified | Stable, layered flow | Suppressed turbulence and vertical decoupling |
Disclaimer/Publisher’s Note: The statements, opinions and data contained in all publications are solely those of the individual author(s) and contributor(s) and not of MDPI and/or the editor(s). MDPI and/or the editor(s) disclaim responsibility for any injury to people or property resulting from any ideas, methods, instructions or products referred to in the content. |
© 2026 by the authors. Licensee MDPI, Basel, Switzerland. This article is an open access article distributed under the terms and conditions of the Creative Commons Attribution (CC BY) license (http://creativecommons.org/licenses/by/4.0/).
Copyright: This open access article is published under a Creative Commons CC BY 4.0 license, which permit the free download, distribution, and reuse, provided that the author and preprint are cited in any reuse.