

Submitted:
19 August 2026
Posted:
20 August 2026
You are already at the latest version
Abstract
To investigate the potential contribution of leukocyte morphology to animal welfare assessment, this study evaluated leukocyte profiles in beef cattle raised under intensive and extensive production systems. A total of 664 blood samples were collected at the end of the production cycle from commercial farms in Mato Grosso do Sul, Brazil. Welfare assessments included qualitative behavioral assessment, health indicators, hematocrit, total and differential leukocyte counts, neutrophil-to-lymphocyte (N/L) ratio, and leukocyte morphology using an image-supported scoring system. Neutrophils from intensively raised cattle exhibited a significantly higher frequency of morphological alterations (27.0% vs. 11,4%; p< 0.001), including toxic changes and immature forms, as well as a higher prevalence of atypical lymphocytes (22.0% vs. 9.6%; p < 0.001). Hematocrit values, total leukocyte counts, neutrophil counts, and N:L ratios were significantly higher in intensively managed cattle, whereas lymphocyte counts were higher in cattle raised under extensive conditions (p < 0.05). Qualitative behavioral assessment indicated greater variability in behavioral expression among cattle from intensive farms, while cattle from extensive systems indicated a predominance of descriptors associated with positive affective expression. Health alterations, including nasal discharge, coughing, and swelling, were recorded exclusively in intensive systems. These findings demonstrate that leukocyte morphology differs between cattle raised under contrasting production conditions and suggest that leukocyte morphological assessment may provide a useful complementary animal-based indicator within multidimensional welfare assessment frameworks.
Keywords:
animal welfare
; beef cattle
; hematological biomarkers
; leukocyte morphology
; neutrophil morphology
; lymphocyte morphology
; welfare assessment
1. Introduction
Brazil has one of the largest cattle populations worldwide, with approximately 195.5 million animals, corresponding to 12% of the global cattle population. The country produces approximately 12.35 million tonnes of beef annually, representing 16.1% of global production, and accounts for approximately 36.7% of internationally traded beef according to the Beef Report 2026 [1]. Beyond their economic significance, these figures represent a vast number of individual animal lives and reinforce the importance of understanding the welfare implications of the diverse production systems used in the country [2,3]. Understanding how animal production systems affect animals is also relevant to the development of more ethical and sustainable agricultural practices [4].
Farm animal welfare has received increasing scientific, ethical, and societal attention over recent decades [5]. This concern is supported by the recognition of animals as sentient beings capable of experiencing positive and negative affective states and by the growing understanding of animal welfare as an essential component of responsible and sustainable animal production systems [6,7,8,9]. Within this perspective, animal welfare is increasingly understood as part of social sustainability, requiring food systems to consider animals not only as production units but as sentient individuals with their own interests and welfare needs [7,10,11]. This development is also reflected in the progressive incorporation of animal protection and welfare principles into international policies, guidelines, and action plans [12,13].
Animal welfare science has been described as a science with a societal mandate because it is guided both by scientific questions and by ethical concerns regarding how animals experience the conditions in which they live [14]. It seeks to understand animals’ physical, behavioral, psychological, and social needs and to provide evidence that supports the prevention of suffering and the promotion of appropriate living conditions [15,16]. Within this framework, accurate welfare assessment is a central priority and has stimulated the search for reliable and quantitative indicators that can complement existing welfare assessment approaches [17]. Because animal welfare is multidimensional, it cannot be adequately characterized by a single measure. Its assessment therefore requires the integration of animal-based, resource-based, and management-based indicators [18,19]. Animal-based indicators are particularly relevant because they reflect how individual animals respond to the conditions to which they are exposed.
Physiological stress responses are closely related to animal welfare, although their interpretation depends on the nature, intensity, duration, predictability, and controllability of the challenge. Changes in affective state and exposure to demanding conditions may activate the hypothalamic–pituitary–adrenal axis and other neuroendocrine pathways, producing physiological adjustments that support short-term coping [20,21]. However, when such activation is repeated or prolonged, it may disrupt homeostasis, alter immune function, increase disease susceptibility, and compromise welfare [22,23].
Physiological indicators, particularly those related to immune function, have therefore been investigated as complementary tools for assessing animals’ biological responses to environmental and management challenges [23,24,25]. Leukocyte numbers and relative proportions may change in response to inflammation, infection, neuroendocrine activation, and other physiological challenges, providing potentially relevant information for welfare assessment when interpreted alongside behavioral, health, and environmental measures [22,26,27]. Previous studies in cattle support the potential relevance of leukocyte-based indicators. In one study, a lower prevalence of WC1+ γδ T lymphocytes was reported in feedlot cattle than in pasture-raised cattle [28]. In dairy cows, housing conditions and access to pasture have also been associated with total lymphocyte counts and other hematological variables [29,30].
Total leukocyte count and the neutrophil-to-lymphocyte (N/L) ratio have received increasing attention as potential indicators of stress, health status, and animal welfare in cattle [30,31]. However, quantitative measurements alone may not capture all biologically relevant changes in circulating leukocytes. Unlike cell counts and ratios, morphological alterations may provide additional information regarding leukocyte maturation, activation and the presence of inflammatory or antigenic stimulation at the individual level. Neutrophil alterations such as cytoplasmic basophilia, vacuolization, abnormal granulation, nuclear hyposegmentation, and the presence of immature forms may occur in association with accelerated granulopoiesis and systemic inflammatory responses, whereas reactive lymphocyte morphology may indicate antigenic stimulation [32,33].
Despite the established diagnostic relevance of leukocyte morphology in veterinary clinical pathology, these characteristics have received little attention in animal welfare research. Most cattle welfare studies using immune or hematological measures have focused on dairy cattle or on quantitative cell counts and ratios [28,29,34,35]. To our knowledge, no previous study has systematically compared neutrophil and lymphocyte morphology in beef cattle raised under intensive and extensive systems or implemented an image-supported cell scoring system for this purpose.
In Brazil, beef cattle are raised under both extensive pasture-based and intensive feedlot systems. The systems differ in space allowance, feeding, human contact, environmental exposure, social conditions, and opportunities for behavioral expression, potentially imposing distinct physical and affective challenges on animals [7,9,36]. Extensive pasture-based systems generally provide greater space and opportunities for locomotion and species-specific behavior but may expose cattle to climatic extremes, variable food availability, parasites, and less frequent human supervision [37]. Intensive systems may provide closer control of nutrition, water provision, and health management, while potentially exposing animals to restricted movement, higher stocking densities, altered social environments, and more frequent handling [36,38]. Transitions from pasture to confinement have been associated with behavioral and physiological responses indicative of challenge, whereas access to pasture has been associated with favorable welfare and hematological outcomes in some cattle populations [34,39]. However, evidence regarding the welfare consequences of different production systems is not uniform, because outcomes depend on management practices, resource availability, environmental conditions, health status, and the experiences of individual animals. Thus, production-system labels alone do not determine welfare outcomes, although the contrasting conditions associated with intensive and extensive systems may generate different physiological and immunological responses.
Given the distinct environmental and management challenges associated with intensive and extensive production systems, the combined evaluation of leukocyte counts and morphology may provide additional information on the physiological responses of cattle relevant to welfare assessment [23]. Therefore, this study aimed to investigate leukocyte counts and morphological characteristics in beef cattle raised under intensive and extensive production systems and to explore their potential contribution to animal welfare assessment. Specifically, we aimed to: (1) compare total and differential leukocyte counts, the N/L ratio, and the morphological characteristics of neutrophils and lymphocytes between cattle from the two production systems; and (2) implement an image-supported cell scoring system for the recognition and classification of leukocyte morphological alterations. This study provides novel information on leukocyte morphology in beef cattle raised under intensive and extensive production systems and explores its potential contribution as a complementary animal-based indicator in welfare assessment.
2. Materials and Methods
2.1. Description of Studied Farms, Data Collection and Sample Sizes
Field data collection was conducted on four commercial beef cattle farms situated in the municipalities of Jaraguari, Ribas do Rio Pardo, Campo Grande and Camapuã, in the state of Mato Grosso do Sul, Brazil (Figure 1). Two farms operated under intensive feedlot systems and two under extensive pasture-based systems. Animal procedures were approved by the Animal Use Ethics Committee of the Federal University of Paraná (protocol 023/2022).
Data collection was conducted during two seasonal periods. In autumn, one intensive and one extensive farm were assessed, whereas the other intensive and extensive farms were assessed in spring. Thus, both production systems were represented in each sampling season.
Ambient temperature and relative humidity were evaluated on all farms using an Akso AZ77535 thermo-hygrometer (Akso, Rio Grande do Sul, Brazil). During autumn, values ranged from 20.0 to 24.0 °C and 55% to 76%, while spring temperatures and humidity ranged from 28.0 to 35.0 °C and 55% to 76%, respectively.
A questionnaire and herd records were used to obtain general farm information, including initial cattle numbers, herd size at the time of the visit, breed, age and mortality, and culling rates (Table 1). Additionally, specific parameters regarding herd health management, such as vaccination and parasite control protocols, were recorded (Table 2). The participating farms raised male crossbred Nellore cattle during the finishing phase. Cattle were evaluated at 20 to 24 months of age weighing an average of 440 kg, and assessments were conducted 5±3 days prior to slaughter.
The assessments on each farm were carried out on three different occasions. The first visit was dedicated to farm characterization and familiarization with management practices. The second visit involved the application of welfare assessments based on selected measures from the Welfare Quality® [40] protocol for cattle. During the third visit, blood samples were collected for hematological and leukocyte morphology analyses following standard procedures [32,41].
During the visit, a partial on-farm welfare assessment was conducted by two assessors using the Welfare Quality® protocol for cattle [40], with the selected measures of body condition score, cleanliness, integument alterations, lameness, human-animal relationship, and Qualitative Behavior Assessment (QBA). The assessors were trained and had prior experience applying the protocol; both assessors participated in all visits. The blood samples were collected after the assessment of all other indicators, during routine handling procedures (weighing, vaccination, deworming or loading), always in the morning, at the same time of day (6am to 11am), to minimize any impact of circadian variation in blood parameters when comparing farms. For the sample collection procedure, each animal was restrained following standard recommendations of [32] and [41].
A total of 664 blood samples were collected for this study. The sample size was determined using the same statistical approach previously applied to broiler chickens based on the mean and standard deviation (SD) of the heterophil-lymphocyte (H-L) ratio [42]. The formula used was n = 2 x SD² x (Zα/2 + Zβ)² / d², where SD is the standard deviation from previous or pilot studies, Zα/2 is the critical value for the desired confidence level, Zβ corresponds to the power of the statistical test, and d represents the expected effect size. For this study, we adopted a 95% confidence level (Zα/2 = 1.96) and a statistical power of 90% (Zβ = 1.282).
2.2. Blood Sample Collection
Approximately 5 mL of blood was drawn from the coccygeal vein put into sterilized vacuum tubes (Vacutainer®) containing ethylene diamine tetra-acetic acid (K₂EDTA) to prevent blood clotting. Samples were then transported in an insulated container to the hematology laboratories at the Federal University of Mato Grosso do Sul and the Dom Bosco Catholic University in Campo Grande, MS, for processing and analysis.
2.3. Cattle Affective States
The Qualitative Behavior Assessment (QBA) was performed in all farms. This qualitative analysis is a methodology that considers the body language of the beef cattle, i.e., the expressive quality of how cattle behave and interact with each other and the environment. The herds were assessed as described in the Welfare Quality® protocol for cattle [40], and 20 behavioral expressions were scored on visual analogue scale (VAS). The absence of behavioral expression was coded in blue and the maximum expression was coded in red.
2.4. Enviroment, Nutrition and Health Assessment
Enviroment, nutrition and health assessments were performed on all farms using standardized observational methods. Animals were individually classified into defined score categories, ranging from normal conditions to varying degrees of welfare impairment (light, moderate, or severe changes). This structured approach enabled a comprehensive evaluation of environmental hygiene, physical condition and clinical health status across both production systems.
Nutritional status was evaluated individually using the Body Condition Score (BCS), classified as normal or severe change. As a resource-based indicator, the cleanliness of water points was categorized as normal (clean drinker and water), moderate change (dirty drinker but clean water), or severe change (both drinker and water dirty). Animal cleanliness was visually inspected on individual animals and classified as normal (less than 25% of the body surface covered with dirt plaques or less than 50% with liquid dirt) or severe change (greater than 25% of the body surface covered with plaques or greater than 50% with liquid dirt).
Health indicators were clinically evaluated to assess ocular discharge, nasal discharge, coughing, and swelling in the prepuce region, with each indicator scored as Score 0 (normal/absence) or Score 2 (severe change).
2.5. Blood Analysis
2.5.1. Blood Smears
Blood smears were prepared immediately after collection using the spreader-slide technique. Once air-dried, the smears were fixed and stained using Wright-Giemsa solution (PA202, Newprov, Brazil), following the manufacturer’s instructions.
2.5.2. Hematocrit (HCT) Determination
In the laboratory, blood samples in K2EDTA tubes were homogenized by gentle inversion. Capillary tubes were filled with blood, sealed and centrifuged in a microhematocrit centrifuge (Cm-12000-220V, Daiki, Brazil) at 15.300 X g for 5 min. The hematocrit (HCT) was determined using a microhematocrit reader card. For clinical classification, HCT values within the reference range for beef cattle were scored as 0 (normal), whereas values falling either below or above the reference thresholds were scored as 1 (abnormal).
2.5.3. Total Leukocyte Count (TLC)
Total leukocyte count (TLC) was performed manually using a Neubauer hemocytometer. Blood samples were diluted 1:20 in Turk’s solution (Newprov, Brazil) to lyse erythrocytes and stain leukocyte nuclei. The diluted samples were loaded into the chamber, and leukocytes were counted under light microscopy (100X magnification) across the four large corner squares. The final TLC (cells/uL) was calculated based on the total count, dilution factor and the chamber volume.
2.5.4. Differential Counts and Cell Scoring System
Differential leukocyte counts were performed on stained blood smears under an optical microscope (MOC), Carl Zeiss Microscopy GmbH, Axio Scope A1 model, with the assistance of ZEN Lite (Blue Edition) imaging software, at magnifications of 1,000×. One hundred leukocytes, including neutrophil, young neutrophil, lymphocyte, eosinophil, and monocyte cells, were counted in at least 10 fields per slide. The images of the smears were photographed using an Axiocam 503 color camera connected to the MOC. We adopted the morphological criteria for neutrophil sorting as described by [32,33,50]. Abnormal neutrophil and lymphocytes were included in the differential counts. A cell score was created for recognition, classification, and interpretation of morphologic diversity of cattle neutrophils and lymphocytes. The neutrophil scores were from zero (absence of change in cell morphology) to four (severe change in cell morphology), and the lymphocyte scores were from zero (absence of alterations in cell morphology) to one (presence of alterations in cell morphology). We further classified the scores as 0 (normal), 1 (light change), 2 (moderate change), and 3 to 4 (severe change) (Table 3). The counts and the analyses of morphological characteristics of WBCs were conducted, and qualitative interobserver reliability verification was applied based on simple comparison of 100 independent blood sample analyses by two assessors, i.e., 20-25 readings per farm or 15% of all blood samples analyzed.
2.5.5. Determination of Neutrophil to Lymphocyte (N/L) Ratio
2.5.6. Statistical Analysis
The individual animal was considered the observational unit. Production system (intensive or extensive) was considered the primary factor of interest, whereas farm-specific comparisons were not an objective of the study. Data collection was conducted during two seasonal periods, with both production systems represented in autumn and spring.
Descriptive statistics were used to characterize the main variables observed per farm, including environmental indicators, behavioral indicators, body condition score, cleanliness of water points and animals, health indicators, hematological parameters, differential leukocyte counts, neutrophil-to-lymphocyte ratio, and leukocyte morphology classifications.
The association between production system type and the variables ocular discharge, nasal discharge, cough, swelling, and cell morphology was assessed using the Chi-square test of association. Due to the presence of low frequencies, p-values were calculated using simulation methods. A significance level of 5% (p < 0.05) was adopted for statistical conclusions.
For the QBA, a heat map with hierarchical clustering was generated to facilitate visualization of the most prevalent behavioral descriptors and similarity patterns among farms. Hierarchical clustering grouped farms and behavioral descriptors according to similarities in their QBA profiles.
Hematocrit, total and differential leukocyte counts, and neutrophil-to-lymphocyte (N/L) ratio were compared between production systems using the unpaired Student's t-test. Continuous variables are presented as mean ± standard deviation (SD). A significance level of 5% (p < 0.05) was adopted for all statistical analyses.
The results are presented as bar graphs and violin plots accompanied by box plots. All analyses were carried out using R software for statistical computation (version 4.3.1) [46].
3. Results
3.1. Behavioral Assessment
3.1.1. Avoidance Distance Test
Concerning the avoidance distance test, animals classified as normal represented 37.94% and 37.04% of observations in intensive and extensive systems, respectively. Light abnormalities were the most frequent classification in the extensive system (41.67%), whereas a similar proportion was observed in the intensive system (36.76%). Moderate abnormalities were more frequent in the intensive system (25.29%) than in the extensive system (15.74%). Severe abnormalities were observed only in the extensive system, accounting for 5.56% of the evaluated animals (Figure 2).
3.1.2. Cattle Affective States
The analysis of the heatmap (Figure 3) demonstrated that, in three of the four farms assessed, cattle predominantly exhibited positive affective states, as indicated by the concentration of records in the upper (red) area, and a lower frequency of negative affective states, represented in the lower (blue) area. Conversely, Farm 1, managed under an intensive production system, displayed a distinct behavioral pattern, characterized by a greater dispersion of responses and the absence of a clear predominance of positive states, suggesting increased variability in the animals' emotional expressions.
3.2. Environment, Nutrition and Health Assessment
All animals observed exhibited a normal body condition score (100%), with no cases of severe change detected. Regarding the cleanliness of water points, 100% of drinkers on Farms 2 and 4 were classified as moderate change, with dirty drinkers but fresh and clean water, whereas 100% of drinkers on Farms 1 and 3 were classified as severe change, with both drinkers and water dirty. None of the water points were classified as normal.
As for animal cleanliness, most animals on Farms 2 (91.6%), 3 (100%), and 4 (99.3%) were classified as normal, meaning that less than 25% of the body surface was covered with plaques or less than 50% was covered with liquid dirt. On Farm 1, however, only 25% of the animals were classified as normal, while 75% were classified as severe (> 25% of the body surface was covered with plaques, or > 50% was covered with liquid dirt (Table 4).
Results for the association between production system type and the variables ocular discharge, nasal discharge, coughing and swelling are illustrated in Figure 4ad. For the nasal discharge (Figure 4b) indicator (p = 0.016), 100% (n = 324) of animals from extensive system farms were classified with score 0 (normal), indicating no nasal discharge, whereas 1.8% (n = 6) of cattle from intensive system farms exhibited nasal discharge and were classified with score 2 (severe change). Regarding coughing (Figure 4c) assessment, all animals from the extensive system showed absence of coughing (p = 0.004), while 2.4% (n = 8) of animals from the intensive system presented coughing and were classified with score 2 (severe change). For the swelling indicator (Figure 4d), 100% of animals from extensive farms were classified with score 0 (normal or absence of swelling), whereas 1.8% of animals from intensive farms exhibited swelling, particularly in the prepuce region, and were classified as having severe alteration.
Moreover, no statistically significant difference was found between production systems for the eye discharge indicator (Figure 4a). A high frequency of absence of eye discharge was observed in both systems, with 99.7% of animals from extensive farms and 97.9% from intensive farms classified with score 0 (normal) (p = 0.071). Even then, there were 2.1% of animals from the intensive system with eye discharge.
3.3. Differential Counts, Cell Morphology and N-L Ratio
The results presented in Table 5 show the comparison of hematological parameters, hematocrit, total and differential leukocyte counts, and neutrophil-to-lymphocyte ratio between animals raised under intensive (n = 340) and extensive (n = 324) production systems. Reference values established by [47,48] were considered for result interpretation.
The animals showed mean hematocrit concentrations within the reference range (24–39%). However, animals from the intensive system exhibited significantly higher hematocrit values (35.70 ± 6.11) compared to those from the extensive system (34.44 ± 6.14) (p = 0.008) (Figure 5a). Regarding the total leukocyte count, animals from the intensive system had a higher mean leukocyte concentration (8.48 ± 2.39) compared to those from the extensive system (8.07 ± 2.10) (p = 0.019) (Figure 5b).
The differential leukocyte count revealed significant differences between production systems in neutrophil and lymphocyte counts. Neutrophil counts were significantly higher in cattle from the intensive system (3.46 ± 1.55) than in those from the extensive system (1.84 ± 0.79) (p < 0.001) (Figure 5c). Regarding the presence of immature neutrophils, band cells were identified in cattle from the intensive system (0.13 ± 0.28), whereas no band cells were observed in those from the extensive system. Metamyelocytes and myelocytes were not detected in cattle from either system.
Lymphocyte counts were significantly lower in cattle from the intensive system (4.16 ± 1.25) than in those from the extensive system (5.00 ± 1.42) (p < 0.001) (Figure 5e). There was no statistically significant difference in mean monocyte counts between systems, although cattle from the intensive system presented a numerically lower mean (0.32 ± 0.32) than those from the extensive system (0.47 ± 0.27). Similarly, the mean eosinophil count was slightly lower in cattle from the intensive system (0.63 ± 0.31) than in those from the extensive system (0.79 ± 0.40), although the difference was not statistically significant. The neutrophil-to-lymphocyte ratio (N/L ratio) was significantly higher in cattle from the intensive system (0.88 ± 0.48) than in those from the extensive system (0.38 ± 0.15) (p < 0.001) (Figure 5d)..
Figure 6 presents the frequency distribution (%) of morphological changes in neutrophils (left) and lymphocytes (right) in beef cattle raised under intensive and extensive production systems. Animals from the intensive system showed more critical results regarding neutrophil morphology, with a higher proportion of severe changes. Approximately 27% (n = 92) of neutrophils were classified with scores of 3 or 4, indicating toxic changes and the presence of immature neutrophils associated with severe abnormalities. In contrast, animals from extensive farms exhibited severe morphological changes in approximately 11.4% (n = 37) of neutrophils (p < 0.001). No animals were classified as score 2 (moderate change) in either production system. Regarding lymphocyte morphology, animals from the extensive system predominantly exhibited normal characteristics (score 0), with atypical forms observed in 9.6% (n = 31) of lymphocytes, while in the intensive system approximately 22% (n = 74) of lymphocytes showed atypical morphology (score 1), indicating a higher frequency of atypical forms under intensive management conditions (p < 0.001). Figure 7 shows the neutrophil and lymphocyte morphology illustrating the leukocyte cell scoring system developed in this study.
4. Discussion
This study provides novel and robust evidence supporting the potential use of leukocyte morphology as a sensitive, objective, and accessible biomarker for assessing welfare in beef cattle. The innovative application of a leukocyte morphology scoring system, designed to evaluate alterations in neutrophils and lymphocytes, enabled the detection of immunological shifts in beef cattle related to distinct farm production system, which in turn represent different animal welfare status. When integrated with robust behavioral and health indicators collected on-farm, this approach offered a multidimensional and highly sensitive framework for evaluating cattle welfare in two different production systems. The strong association between leukocyte alterations and field-based welfare metrics underscores the potential of this method as a practical and scientifically grounded diagnostic tool. Our results suggest further research on leukocyte morphology as a proxy to on-field animal welfare assessment is warranted.
Leukocyte morphological assessments revealed significant and biologically relevant differences between animals raised in intensive versus extensive systems, reflecting the physiological impact of environmental and management factors. Neutrophils from intensively housed cattle exhibited a higher proportion of severe alterations (27%; n = 92), including toxic vacuolization, granulation, and nuclear abnormalities, which are well-documented hallmarks of inflammation and stress. In contrast, a lower percentage of 11.4% (n = 37) of neutrophils from extensively raised cattle showed comparable alterations (p < 0.001). Band cells were detected exclusively in the intensive group (0.13 ± 0.28), indicating a left shift and supporting the interpretation of ongoing inflammatory stimulation [33,49,50]. The toxic neutrophil changes detected are recognized as sensitive biomarkers of systemic inflammation and disrupted hematopoietic function in farm animals subjected to poor environmental conditions [32,33,50]. Their presence in cattle under confinement reinforces the understanding that animals in such systems are coping with elevated physiological stress and immunological burden, likely due to high stocking density, limited mobility, and reduced environmental enrichment, suggesting negative affective states [39,42].
Lymphocyte morphology also varied significantly between systems. Atypical lymphocytes were found in 22% of animals on intensive farms compared to 9.6% in extensive systems (p < 0.001). The atypical lymphocyte forms, characterized by nuclear irregularities, increased cell size (generally larger than typical lymphocytes), and abundant basophilic cytoplasm, are often associated with chronic antigenic stimulation and stress-induced immunomodulation [42, 47 and 48]. We propose that the stress-related immunomodulation, as reflected by changes in white blood cell morphology across production systems with different welfare levels, should be recognized as a relevant biomarker for animal welfare assessment.
The hematological findings in our data supported the morphological evidence. Cattle from the intensive system had significantly higher hematocrit values (35.70 ± 6.11) than those from extensive farms (34.44 ± 6.14) (p = 0.008), indicating hemoconcentration potentially due to dehydration, heat stress [30,51] or other stress-related factors. In addition, the different conditions in which water was offered between systems, with dirty drinkers and water observed in the intensive farms may have contributed to reduced water intake and, consequently, to the hematocrit results, reinforcing the link between environmental management and animal welfare.
Total leukocyte counts were higher in intensively raised cattle (8.48 ± 2.39 vs. 8.07 ± 2.10; p = 0.019), further supporting the presence of low-grade systemic inflammation. Notably, neutrophil counts were significantly elevated in intensive systems (3.46 ± 1.55 vs. 1.84 ± 0.79; p < 0.001), whereas lymphocytes were higher in the extensive group (5.00 ± 1.42 vs. 4.16 ± 1.25; p < 0.001), consistent with better immunological homeostasis (Anastasia & Saif 2021), which is in turn compatible with the better welfare results in the extensive group as per on-field animal welfare assessment.
The neutrophil-to-lymphocyte (N/L) ratio was an informative indicator of systemic stress. Cattle from intensive farms exhibited significantly higher N-L ratios (0.88 ± 0.48) compared with those from extensive systems (0.38 ± 0.15; p < 0.001), reinforcing previous studies that identify this ratio as a robust index of stress and welfare impairment [22, 30 and 45]. An analogous indicator for birds, the heterophil-to-lymphocyte (H/L) ratio, has long been recognized as an important physiological indicator of stress and is widely used in avian welfare assessment, although recent evidence suggests that its interpretation should consider biological context, including age and physiological state [52,53,54]. Our work contributes to the recognition of the relevance of such an indicator for cattle, and highlights the need for expanding N-L ration research as a tool for the assessment of the welfare of other mammal species, as well as across vertebrate taxa in general.
The significantly lower neutrophil-to-lymphocyte (N/L) ratio observed in beef cattle from extensive systems, compared to both the intensive group and commonly reported reference values, raises important considerations regarding the validity and context of hematological reference ranges used in welfare assessments. It is possible that standard reference intervals for the N/L ratio, frequently established based on data from intensively managed or clinically monitored herds, may reflect baseline physiological states influenced by suboptimal welfare conditions, such as chronic stress, restricted movement, or limited environmental enrichment. Studies have shown that stress, particularly when prolonged or chronic, induces neutrophilia and lymphopenia, resulting in an increased neutrophil-to-lymphocyte (N/L) ratio [22,23,55,56]. Therefore, the clearly lower N:L values recorded in cattle under extensive systems can represent a more accurate physiological baseline for animals experiencing lower stress and a better degree of welfare. These findings highlight the need to reconsider the interpretation of conventional hematological reference intervals and to account for production system, physiological status, and welfare context when evaluating immune-based indicators in cattle [26,57,58]. Such an approach would improve the accuracy, biological relevance, and context sensitivity of animal welfare assessments based on hematological parameters.
Although monocyte and eosinophil counts did not differ significantly, their slightly higher levels in extensively raised cattle may reflect a more stable immune regulatory environment. Chronic stress is known to disrupt hematopoiesis and suppress the functional capacity of these immune cell populations [59,60].
Our experimental design produced results enabling the recognition of the relevance of white blood cells as welfare indicators, since immunological results were investigated in light of the traditional on-field animal welfare assessment. Behavioral and health indicators were consistent with the immunological findings. We assessed the human–animal relationship using the avoidance distance test, which reflects animals' emotional states and their habituation to human presence [61,62]. Higher percentages of animals classified as normal, indicating a positive or neutral perception of human proximity, were observed at Farm 2 (39.69%) and Farm 4 (39.66%). In contrast, Farms 3 (14.71%) and 1 (10%) showed lower normal classifications, suggesting less favorable interactions. The interpretation of such results is dependent on the consideration of an expected higher avoidance distance in extensive systems, since human contact tends to be less frequent than in intensive systems. At Farms 1 and 3, the predominance of light behavioral change (40.0% and 52.9%, respectively) indicated moderate avoidance, with mild reluctance to human approach. Farm 1 also showed the highest percentage of moderate change (50.0%), pointing to a more pronounced avoidance. Severe avoidance, reflecting significant fear or negative experiences, was recorded only at Farm 3 (14.7%) and Farm 4 (4.5%).The results align with previous studies showing that intensive handling, inconsistent interactions, or negative experiences impair the human-animal relationship, increasing avoidance distances [61,63]. Conversely, systems promoting gentle and consistent human contact foster shorter distances and more stable emotional states [64,65].Thus, the variation in avoidance distance observed among farms reflects differences in human-animal interaction quality and broader welfare conditions, highlighting the importance of behavioral measures alongside physiological and health indicators in comprehensive welfare assessments.
Qualitative Behavior Assessment (Figure 3) revealed a perception that cattle in the extensive system exhibited predominantly positive affective states, indicated by a concentration of observations in the upper red area and a lower frequency of negative states represented in the lower blue region. This pattern suggests a predominance of relaxed, sociable, and environmentally engaged behaviors, particularly among animals raised under extensive pasture-based systems. Conversely, cattle from intensive system in Farm 1 displayed a distinct behavioral profile, characterized by greater dispersion of emotional responses and the absence of a clear predominance of positive states, suggesting increased variability and a higher occurrence of behaviors associated with discomfort and stress, such as tension, frustration, and resistance. These findings are consistent with existing literature indicating that intensive systems, characterized by movement restrictions, high stocking densities, and limited opportunities for natural behaviors, are associated with negative emotional states in cattle [34,36]. A surprising aspect of our results indicates the need for further investigation, as Farm 2 presented closer QBA results to Farm 4 than to Farm 1, suggesting high variability of QBA results between intensive cattle farming conditions; however, such results need confirmation as our experimental design does not allow for conclusions regarding QBA analyses within the same farming system.
Statistical analysis revealed significant differences between production systems for the health indicators nasal discharge, coughing, and swelling, but not for ocular discharge (Figure 4ad). Regarding nasal discharge, none of the cattle from extensive farms exhibited signs of discharge, while 1.8% of cattle from intensive systems were classified with severe nasal discharge (p = 0.016). Similar patterns were observed for coughing, with 100% absence among cattle in extensive systems and 2.4% of individuals from intensive systems presenting coughing (p = 0.004). For swelling, extensive system cattle again exhibited in no cases, while 1.8% of cattle in intensive systems showed swelling, particularly involving the prepuce region. These findings reinforce the evidence that intensive production systems pose higher health challenges for cattle, primarily due to higher animal density, environmental contamination, and stress-induced immunosuppression [35,38]. Although the percentages of affected animals in intensive systems were relatively low, their exclusive presence in confined environments suggests a systemic vulnerability associated with the management system.
Overall, the results emphasize that while good body condition can be maintained across diverse systems, hygiene and health-related welfare indicators, particularly those associated with respiratory and integumentary health, are more susceptible to deterioration under intensive production conditions. These findings align with the long recognized need for a multifactorial assessment of cattle welfare, integrating behavioral observations with objective health and hygiene indicators [66,67]. Furthermore, the higher incidence of nasal discharge, coughing, and swelling observed in cattle from intensive production systems indicates greater immunological challenges under these conditions.
Our results regarding immune cell numbers and competence between intensive and extensive systems further confirm that animals in intensive production systems experience greater immune dysregulation, consistent with current knowledge on the close interaction between environmental stressors and bovine immune function [69]. Early identification of these immune alterations through hematological biomarkers and leukocyte morphology may support timely management interventions, helping to reduce disease susceptibility and, consequently, the need for antimicrobial treatments. Such an approach may contribute to mitigating the emergence and dissemination of antimicrobial-resistant bacteria (ARB), one of the most relevant challenges for One Health [68].
Altogether, the combination of behavioral observations, health evaluations, hematological parameters, and leukocyte morphology provides a comprehensive and multidimensional framework for assessing cattle welfare, consistent with current recommendations advocating the integration of multiple stress biomarkers to improve the accuracy and biological relevance of welfare assessments [70]. The leukocyte morphology scoring system developed and applied in this study enabled the detection of cellular alterations potentially associated with stress-related immune responses, representing a novel and practical approach to welfare assessment. By integrating cellular morphology into routine hematological evaluation, this method expands the diagnostic value of blood smears beyond conventional leukocyte counts and offers new opportunities for the objective assessment of animal welfare.
5. Conclusions
Leukocyte morphology can differentiate cattle welfare levels between intensive and extensive farming systems. Stress responses induce immunomodulatory and adaptive effects that alter the counts and the morphology of leukocytes. The comprehension of such phenomena in cattle is limited and generally centered on counting leukocytes and neutrophil-to-lymphocyte ratio to measure stress. Our results further show that morphological evaluation complements conventional hematological assessment by providing biologically meaningful information associated with animal welfare. When interpreted together with behavioral observations and health indicators, leukocyte morphology offers a practical, objective, and low-cost approach for multidimensional welfare assessment in beef cattle. In addition, this study shows that routine blood smears can contribute to the understanding of animal welfare. Leukocyte morphology reflects the cumulative physiological responses of animals to the environmental and management conditions to which they are exposed, and expands the biological interpretation of routine leukocyte morphology by demonstrating its value for animal welfare assessment. Incorporating this information into welfare assessment provides an additional evidence-based tool to support management decisions and promote more ethical, resilient, and sustainable food production systems.
Supplementary Materials
The following supporting information can be downloaded at the website of this paper posted on Preprints.org. The Supplementary material for this article can be found online at: https: https://drive.google.com/file/d/1nQmi5xRIIIbcjt9JimrNYrE44AleuUQb/view?usp=sharing.
Author Contributions
conceptualization, Laura R. R. Ribeiro and Carla F. M. Molento; methodology, Laura R. R. Ribeiro, Ricardo M. Santos, and Carla F. M. Molento; software, Cesar A. Taconeli; validation, Laura R. R. Ribeiro, Ricardo M. Santos, Alexandre de Oliveira Bezerra and Carla F. M. Molento; formal analysis, Laura R. R. Ribeiro and Cesar A. Taconeli; investigation, Laura R. R. Ribeiro, Ricardo M. Santos and Alexandre de Oliveira Bezerra; resources, Alexandre de Oliveira Bezerra and Carla F. M. Molento; data curation, Laura R. R. Ribeiro, Ricardo M. Santos and Cesar A. Taconeli; writing—original draft preparation, Laura R. R. Ribeiro; writing—review and editing, Laura R. R. Ribeiro, Juliana do Canto Olegário and Carla F. M. Molento; visualization, Laura R. R. Ribeiro and Cesar A. Taconeli; supervision, Carla F. M. Molento; project administration, Laura R. R. Ribeiro, Alexandre de Oliveira Bezerra; funding acquisition, Carla F. M. Molento and Laura R. R. Ribeiro. All authors have read and agreed to the published version of the manuscript.
Funding
This research was funded by Araucaria Foundation, grant number PI 12/2022, and in part by the Coordination for the Improvement of Higher Education Personnel - Brazil (CAPES) [Financial Code 001]. The APC was funded by Araucaria Foundation.
Institutional Review Board Statement
The animal study protocol was approved by the Ethics Committee on the Use of Animals (CEUA) of the Agricultural Sciences Sector, Federal University of Paraná (UFPR), Brazil (protocol code 023/2022 and date of approval 3 August 2022).
Informed Consent Statement
Informed consent was obtained from all subjects involved in the study.
Data Availability Statement
The data presented in this study are available from the corresponding author upon reasonable request. The data are not publicly available because they contain information related to privately owned farms.
Acknowledgments
The authors thank the farmers for welcoming us onto their farms and for allowing access to their animals. We are also grateful to the farm managers, stockpersons, and all farm workers who shared their time, experience, and support during the fieldwork. Above all, we acknowledge the cattle whose participation made this study possible. We thank Mariane Malaquias, Franciele Itati Kreutz, Lilian Cruz, Bruno Fernandes, Thiago Espíndola, Camilo Lima, Rafael Pedroso Lima, Isabela Valim and Sarah Makimoto for their assistance with field activities and data collection. We also acknowledge the Laboratory of Animal Welfare (LABEA), Federal University of Paraná (UFPR), for its scientific, institutional, and logistical support throughout this research. Finally, we thank Alda Izabel de Souza and the Clinical Pathology Laboratory, Faculty of Veterinary Medicine and Animal Science, Federal University of Mato Grosso do Sul (UFMS), and the Hematology and Biochemistry Laboratory, Universidade Católica Dom Bosco (UCDB), for providing the facilities and technical support for the hematological and blood smear analyses.
Conflicts of Interest
The authors declare no conflicts of interest. The funding agencies had no role in the design of the study; in the collection, analysis, or interpretation of data; in the writing of the manuscript; or in the decision to publish the results.
References
- ABIEC (Associação Brasileira das Indústrias Exportadoras de Carne). Beef Report 2026; ABIEC: São Paulo, Brazil, 2026; Available online: https://abiec.com.br/publicacoes/beef-report-2026/ (accessed on 18 July 2026).
- Rowe, E.; Mullan, S. Advancing a “Good Life” for Farm Animals: Development of Resource Tier Frameworks for On-Farm Assessment of Positive Welfare for Beef Cattle, Broiler Chicken and Pigs. Animals 2022, 12, 565. [Google Scholar] [CrossRef] [PubMed]
- Broom, D. M. Animal welfare concepts. In Routledge Handbook of Animal Welfare; KNIGHT, A., PHILLIPS, C., SPARKS, P., Eds.; Routledge: London and New York, 2022; pp. 12–21. [Google Scholar]
- Dick, M.; da Silva, M. A.; da Silva, R. R. F.; Ferreira, O. G.; Maia, M. de S.; de Lima, S. F.; Neto, V. B. de P.; Dewes, H. Environmental impacts of Brazilian beef cattle production in the Amazon, Cerrado, Pampa, and Pantanal biomes. J. Clean. Prod. 2021, 311, 127750. [Google Scholar] [CrossRef]
- Logstein, B.; Bjørkhaug, H. Good Animal Welfare in Norwegian Farmers' context. Can both industrial and natural conventions be achieved in the social license to farm? J. Rural Stud. 2023, 107–120. [Google Scholar] [CrossRef]
- Duncan, I. J. H. Animal welfare: a brief history. In Animal Welfare: from Science to Law. La Fondation Droit Animal: Éthique et Sciences; Hild, S., Schweitzer, L., Eds.; Paris, 2019; pp. 13–19. [Google Scholar]
- Perry, B. D.; Robinson, T. P.; Grace, D. C. Review: Animal health and sustainable global livestock systems. Animal 2018, 12, 1699–1708. [Google Scholar] [CrossRef]
- Broom, D. M. Farm animal welfare: a key component of the sustainability of farming systems. Vet. Glas. 2021, 75, 145–151. [Google Scholar] [CrossRef]
- Ducrot, C.; Barrio, M. B.; Boissy, A.; Charrier, F.; Even, S.; Mormede, P.; Petit, S.; Pinard-Van der laan, M. H.; Schelcher, F.; Casabianca, F.; Ducos, A.; Foucras, G.; Guatteo, R.; Peyraud, J. L.; Vayssier-Taussat, M.; Veysset, P.; Friggens, N. C.; Fernandez, X. Animal board invited review: Improving animal health and welfare in the transition of livestock farming systems: Towards social acceptability and sustainability. Animal 2024, 18(n 3), 101100. [Google Scholar] [CrossRef] [PubMed]
- Broom, D. M. The sustainability of cattle production systems. In Cattle Welfare in Dairy and Beef Systems; HASKELL, M., Ed.; Springer Nature: Switzerland, 2023; pp. 351–379. [Google Scholar] [CrossRef]
- Herdoiza, N.; Worrell, E.; van den Berg, F. Three perspectives to integrate animal interests into the global Sustainable Development Agenda. Sustain Sci. 2025. [Google Scholar] [CrossRef]
- FAO. The State of Food and Agriculture 2022: Leveraging Automation in Agriculture for Transforming Agrifood Systems; Food and Agriculture Organization of the United Nations: Rome, Italy, 2022. [Google Scholar] [CrossRef]
- FAO; UNEP; WHO; WOAH. One Health Joint Plan of Action (2022–2026): Working Together for the Health of Humans, Animals, Plants and the Environment; Food and Agriculture Organization of the United Nations: Rome, Italy, 2022. [Google Scholar] [CrossRef]
- Fraser, D. Understanding Animal Welfare: The Science in its Cultural Context, 2nd Edition ed; Wiley-Blackwell, 2023; p. 384p. [Google Scholar]
- Harrison, R. Animal Machines: The New Factory Farming Industry; Carson, R. L., Dawkins, M. S., Webster, J., Rollin, B. E., Fraser, D., Broom, D. M., Eds.; CABI Publishing, 2013; p. 224p. [Google Scholar]
- Browning, H.; Birch, J. Animal sentience. Philos. Compass 2022, 17, e12822. [Google Scholar] [CrossRef] [PubMed]
- Babington, S.; Tilbrook, A. J.; Maloney, S. K.; Fernandes, J. N.; Crowley, T. M.; Ding, L.; Fox, A. H.; Zhang, S.; Kho, E. A.; Cozzolino, D.; Mahony, T. J.; Blache, D. Finding biomarkers of experience in animals. J. Anim. Sci. Biotechnol. 2024, 15, 28. [Google Scholar] [CrossRef] [PubMed]
- Bøtner, A.; Broom, D. M.; Doherr, M. G.; Domingo, M.; Hartung, J.; Keeling, L.; Koenen, F.; More, S.; Morton, D.; Oltenacu, P.; Salati, F.; Salman, M.; Sanaa, M.; Sharp, J. M.; Stegeman, J. A.; Szücs, E.; Thulke, H.-H.; Vannier, P.; Webster, J.; Wierup, M. Scientific opinion on the use of animal-based measures to assess welfare of dairy cows. EFSA J. 2012, 10, 81. [Google Scholar] [CrossRef]
- Harris, S.; Shallcrass, M.; Cohen, S. A Review of Animal-Based Welfare Indicators for Calves and Cattle. Ruminants 2024, 4, 565–601. [Google Scholar] [CrossRef]
- Broom, D. M.; Johnson, K. G. Stress and Animal Welfare: Key Issues in the Biology of Humans and Other Animals, 2nd ed.; Springer International Publishing, 2019; p. 252 p. [Google Scholar]
- Jamilah, I. M.; Darsono, A.; Fathurrahman, I.; Sonia, M. Animal Welfare As Stress Management to Improve Beef Cattle Reproduction. The UGM Annual Scientific Conference Life Sciences; 2016; KnE Life Sciences, pp. 200–215. [Google Scholar] [CrossRef]
- Carroll, J. A.; Burdick Sanchez, N. C. Overlapping physiological responses and endocrine biomarkers that are indicative of stress responsiveness and immune function in beef cattle. J. Anim. Sci. 2014, 92, 5311–5318. [Google Scholar] [CrossRef] [PubMed]
- Earley, B.; Buckham-Sporer, K.; O’Loughlin, A.; Johnston, D. Physiological and Immunological Tools and Techniques for the Assessment of Cattle Welfare. In Cattle Welfare in Dairy and Beef Systems; Haskell, M., Ed.; Springer: Cham, 2023; vol 23, pp. 55–88. [Google Scholar] [CrossRef]
- Berghman, L. R. Immune responses to improving welfare. Poult. Sci. 2016, 95, 2216–2218. [Google Scholar] [CrossRef] [PubMed]
- Birhan, M. Systematic review on avian immune systems. J. Life Sci. Biomed. 2019, 9, 145–152. [Google Scholar] [CrossRef]
- Roland, L.; Drillich, M.; Iwersen, M. Hematology as a diagnostic tool in bovine medicine. J. Vet. Diagn. Investig. 2014, 26, 592–598. [Google Scholar] [CrossRef] [PubMed]
- Anderson, D. E.; Lehmkuhl, H. D.; Stokka, G. L. Immunologic mechanisms of stress-induced disease in cattle. Vet. Clin. Food Anim. Pract. 2021, v. 37, 317–328. [Google Scholar]
- Wilson, S. C.; Fell, L. R.; Colditz, I. G.; Collins, D. P. An Examination of Some Physiological Variables for Assessing the Welfare of Beef Cattle in Feedlots. Anim. Welf. 2002, 11, 305–316. [Google Scholar] [CrossRef]
- Radkowska, I.; Herbut, E. Hematological and biochemical blood parameters in dairy cows depending on the management system. Anim. Sci. Pap. Rep. 2014, 32, 317–325. [Google Scholar]
- Loi, F.; Pilo, G.; Franzoni, G.; Re, R.; Fusi, F.; Bertocchi, L.; Santucci, U.; Lorenzi, V.; Rolesu, S.; Nicolussi, P. Welfare Assessment: Correspondence Analysis of Welfare Score and Hematological and Biochemical Profiles of Dairy Cows in Sardinia, Italy. Animals 2021, 11, 854. [Google Scholar] [CrossRef] [PubMed]
- Ogi, A.; Campera, M.; Ienco, S.; Bonelli, F.; Mariti, C.; Gazzano, A. The Correlation between Play Behavior, Serum Cortisol and Neutrophil-to-Lymphocyte Ratio in Welfare Assessment of Dairy Calves within the First Month of Life. Dairy 2022, 3, 1–11. [Google Scholar] [CrossRef]
- Thrall, M. A.; Weiser, G.; Allison, R. W.; Campbell, T. W. Hematologia e Bioquímica Clinica Veterinária 2014, 2nd ed.; Rocca: São Paulo; p. 688p.
- Stacy, N. I.; Hollinger, C.; Arnold, J. E.; Pendl, H.; Nelson, P. J.; Harvey, J. W. Left shift and toxic change in heterophils and neutrophils of non-mammalian vertebrates: a comparative review, image atlas, and practical considerations. Vet. Clin. Pathol. 2022b, 51, 18–44. [Google Scholar] [CrossRef] [PubMed]
- Nakajima, N.; Doi, K.; Tamiya, S.; Yayota, M. Physiological, immunological, and behavioral responses in cows housed under confinement conditions after grazing. Livest. Sci. 2018, 218, 44–49. [Google Scholar] [CrossRef]
- Cooke, A. S.; MULLAN, S.; MORTEN, C.; HOCKENHULL, J.; LE-GRICE, P.; LE COCQ, K.; LEE, M. R. F.; CARDENAS, L. M.; RIVERO, M. J. Comparison of the welfare of beef cattle in housed and grazing systems: hormones, health and behaviour. J. Agric. Sci. 2023, 1–14. [Google Scholar] [CrossRef] [PubMed]
- Salvin, H.; Schwartzkopf-Genswein, K.; Lee, C.; Colditz, I. Welfare of Beef Cattle in Intensive Systems. In Cattle Welfare in Dairy and Beef Systems. Animal Welfare; Haskell, M., Ed.; Springer: Cham, 2023; vol 23. [Google Scholar] [CrossRef]
- Temple, D.; Manteca, X. Animal Welfare in Extensive Production Systems Is Still an Area of Concern. Front. Sustain. Food Syst. 2020, 4, 545902. [Google Scholar] [CrossRef]
- Moran, D.; Blair, K.J. Review: Sustainable livestock systems: anticipating demand-side challenges. Animal 2021, 15, 100288. [Google Scholar] [CrossRef] [PubMed]
- Krueger, A.; Cruickshank, J.; Ates, S.; Trevisi, E.; Bionaz, M. Welfare Status in Dairy Cows during Confined and Grazing Periods in the North American Pacific Northwest using Blood Parameters and Visual Assessments. J. Appl. Anim. Welf. Sci. 2025, Epub ahead of print. [Google Scholar] [CrossRef] [PubMed]
- Welfare Quality®. Welfare Quality Assessment Protocol for Cattle; Welfare Quality® Consortium: Lelystad, Netherlands, 2009. [Google Scholar]
- Feitosa, F. L. F. Semiologia Veterinária - a Arte do Diagnóstico, 5ª ed.; Rocca: São Paulo, 2025; p. 776p. [Google Scholar]
- Ribeiro, L. R. R.; Sans, E. C. O.; Santos, R. M.; Taconelli, C. A.; de Farias, R.; Molento, C. F. M. Will the white blood cells tell? A potential novel tool to assess broiler chicken welfare. Front. Vet. Sci. 2024, 11, 1384802. [Google Scholar] [CrossRef] [PubMed]
- Fleming, P. A.; Clarke, T.; Wickham, S. L.; Stockman, C.A.; Barnes, A. L.; Collins, T.; Miller, D.W. The contribution of Qualitative Behavioural Assessment to appraisal of livestock welfare assessment. Anim. Prod. Sci. 2016, 56, 1569–1578. [Google Scholar] [CrossRef]
- Paape, M. J.; Bannerman, D. D.; Zhao, X.; Lee, J. W. The bovine neutrophil: Structure and function in blood and milk. Vet. Res. 2003, 34, 597–627. [Google Scholar] [CrossRef] [PubMed]
- Buonacera, A.; Stancanelli, B.; Colaci, M.; Malatino, L. Neutrophil to lymphocyte ratio: an emerging marker of the relationships between the immune system and diseases. Int. J. Mol. Sci. 2022, 23, 3636. [Google Scholar] [CrossRef] [PubMed]
- R Core Team. R: A language and environment for statistical Computing; R Foundation for Statistical Computing: Vienna, Austria, 2023. [Google Scholar]
- Wood, R. D. Hematology of Bovids. In Schalm's Veterinary Hematology, 7th ed.; Brooks, M.B., Harr, K.E., Seelig, D.M., Wardrop, K.J., Weiss, D.J., Eds.; Wiley-Blackwell, 2022; pp. 1004–1018. [Google Scholar] [CrossRef]
- Herman, N.; Trumel, C.; Geffré, A.; Braun, J. P.; Thibault, M.; Schelcher, F.; Bourgès-Abella, N. Hematology reference intervals for adult cows in France using the Sysmex XT-2000iV analyzer. J. Vet. Diagn. Invest. 2018, 30, 678–687. [Google Scholar] [CrossRef] [PubMed]
- Ni, Y. Neutrophil function and signaling in animal inflammation. Front. Vet. Sci. 2020, 7, 568–580. [Google Scholar]
- Stacy, N. I.; Thrall, M. A.; Arnold, J. E. Hematology of birds and ruminants. In Schalm’s Veterinary Hematology, 7th ed.; Blackwell, 2022a; pp. 1004–1018. [Google Scholar] [CrossRef]
- Grelet, C.; Vanden Dries, V.; Leblois, J.; Wavreille, J.; Mirabito, L.; Soyeurt, H.; Franceschini, S.; Gengler, N.; Brostaux, Y.; HappyMoo Consortium; Dehareng, F. Identification of chronic stress biomarkers in dairy cows. Animal 2022, 16, 100502. [Google Scholar] [CrossRef] [PubMed]
- Gross, W. B.; Siegel, H. S. Evaluation of the heterophil/lymphocyte ratio as a measure of stress in chickens. Avian Dis. 1983, 27, 972. [Google Scholar] [CrossRef] [PubMed]
- Bonamigo, A.; Silva, C. B. S.; Molento, C. F. M. Broiler welfare in relation to stocking density. Arq. Bras. Med. Vet. Zootec. 2011, 63, 1421–1428. [Google Scholar]
- Bråthen, V.S.; Skomsø, D.B.; Bech, C. The Heterophil-to-Lymphocyte (H/L) Ratio Indicates Varying Physiological Characteristics in Nestlings Compared to Adults in a Long-Lived Seabird. Birds 2025, 6, 4. [Google Scholar] [CrossRef]
- Davis, A.K.; Maney, D.L.; Maerz, J.C. The use of leukocyte profiles to measure stress in vertebrates: a review for ecologists. Funct. Ecol. 2008, 22, 760–772. [Google Scholar] [CrossRef]
- O'Loughlin, A.; McGee, M.; Waters, S.M.; Doyle, S.; Earley, B. Examination of the bovine leukocyte environment using immunogenetic biomarkers to assess immunocompetence following exposure to weaning stress. BMC Vet. Res. 2011, 7, 45. [Google Scholar] [CrossRef] [PubMed] [PubMed Central]
- Friedrichs, K. R.; Harr, K. E.; Freeman, K. P.; Szladovits, B.; Walton, R. M.; Barnhart, K. F.; Blanco-Chavez, J. ASVCP reference interval guidelines: determination of de novo reference intervals in veterinary species and other related topics. Vet. Clin. Pathol. 2012, 41, 441–453. [Google Scholar] [CrossRef] [PubMed]
- Fraser, D.; Duncan, I.J.; Edwards, S.A.; Grandin, T.; Gregory, N.G.; Guyonnet, V.; Hemsworth, P.H.; Huertas, S.M.; Huzzey, J.M.; Mellor, D.J.; Mench, J.A.; Spinka, M.; Whay, H.R. General Principles for the welfare of animals in production systems: the underlying science and its application. Vet. J. 2013, 198, 19–27. [Google Scholar] [CrossRef] [PubMed]
- Niu, X.; Ding, Y.; Chen, S.; Gooneratne, R.; Ju, X. Effect of ImmuneStress on Growth Performance and Immune Functions of Livestock: Mechanisms and Prevention. Animals 2022, 12, 909. [Google Scholar] [CrossRef] [PubMed]
- Dahl, G. E.; Tao, S.; Laporta, J. Heat Stress Impacts Immune Status in Cows Across the Life Cycle. Front. Vet. Sci. 2020, 7, 116. [Google Scholar] [CrossRef] [PubMed]
- Waiblinger, S.; Boivin, X.; Pedersen, V.; Tosi, M.V.; Janczak, A. M.; Visser, E. K.; Jones, R. B. Assessing the human–animal relationship in farmed species: A critical review. Appl. Anim. Behav. Sci. 2006, 101, 185–242. [Google Scholar] [CrossRef]
- Lensink, B. J.; Raussi, S.; Boivin, X.; Pyykkönen; Veissier, I. Reactions of calves to handling depend on housing condition and previous experience with humans. Appl. Anim. Behav. Sci. 2000, 70, 187–199. [Google Scholar] [CrossRef] [PubMed]
- Aubé, L.; Mollaret, E.; Mialon, M. M.; Mounier, L.; Veissier, I.; Boyer des Roches, A. Measuring the human–animal relationship in cows by avoidance distance at pasture. Appl. Anim. Behav. Sci. 2023, 265, 105999. [Google Scholar] [CrossRef]
- Hemsworth, P. H.; Coleman, G. J. Human-Livestock Interactions: The Stockperson and the Productivity and Welfare of Farmed Animals, 2nd ed.; CABI Publishing, 2011. [Google Scholar]
- Honorato, L. A.; HötzelI, M. J.; Gomes; de Miranda, C. C.; Silveira, I. D. B.; Machado Filho, L. C. P. Particularidades relevantes da interação humano-animal para o bem-estar e produtividade de vacas leiteiras. Ciência Rural 2012, 42, 332–339. [Google Scholar] [CrossRef]
- Rault, J.-L. Effects of positive and negative human contacts and intranasal oxytocin on cerebrospinal fluid oxytocin. Psychoneuroendocrinology 2016, 69, 60–66. [Google Scholar] [CrossRef] [PubMed]
- Rutherford, K. M. D.; Donald, R. D.; Arnott, G.; Rooke, J. A.; Dixon, L.; Mehers, J. J. M.; Turnbull, J.; Lawrence, A. B. Farm animal welfare: assessing risks attributable to the prenatal environment. Anim. Welf. 2012, 21, 419–429. [Google Scholar] [CrossRef]
- Xu, C.; Kong, L.; Gao, H.; Cheng, X.; Wang, X. A Review of Current Bacterial Resistance to Antibiotics in Food Animals. Front. Microbiol. 2021, 12, 626394. [Google Scholar] [CrossRef]
- Vlasova, A. N.; Saif, L. J. Bovine Immunology: Implications for Dairy Cattle. Front. Immunol. 2021. [Google Scholar] [CrossRef] [PubMed]
- Kumar, P.; Ahmed, M. A.; Abubakar, A. A.; Hayat, M. N.; Kaka, U.; Ajat, M.; Goh, Y. M.; Sazili, A. Q. Improving animal welfare status and meat quality through assessment of stress biomarkers. A Crit. Rev. Meat Sci. 2023, 197, 109048. [Google Scholar] [CrossRef] [PubMed]
Figure 1.
Location of the study farms in Mato Grosso do Sul, Brazil. Red markers indicate the sampling sites, and the magnified section illustrates the intensive and extensive production systems included in the study.
Figure 1.
Location of the study farms in Mato Grosso do Sul, Brazil. Red markers indicate the sampling sites, and the magnified section illustrates the intensive and extensive production systems included in the study.
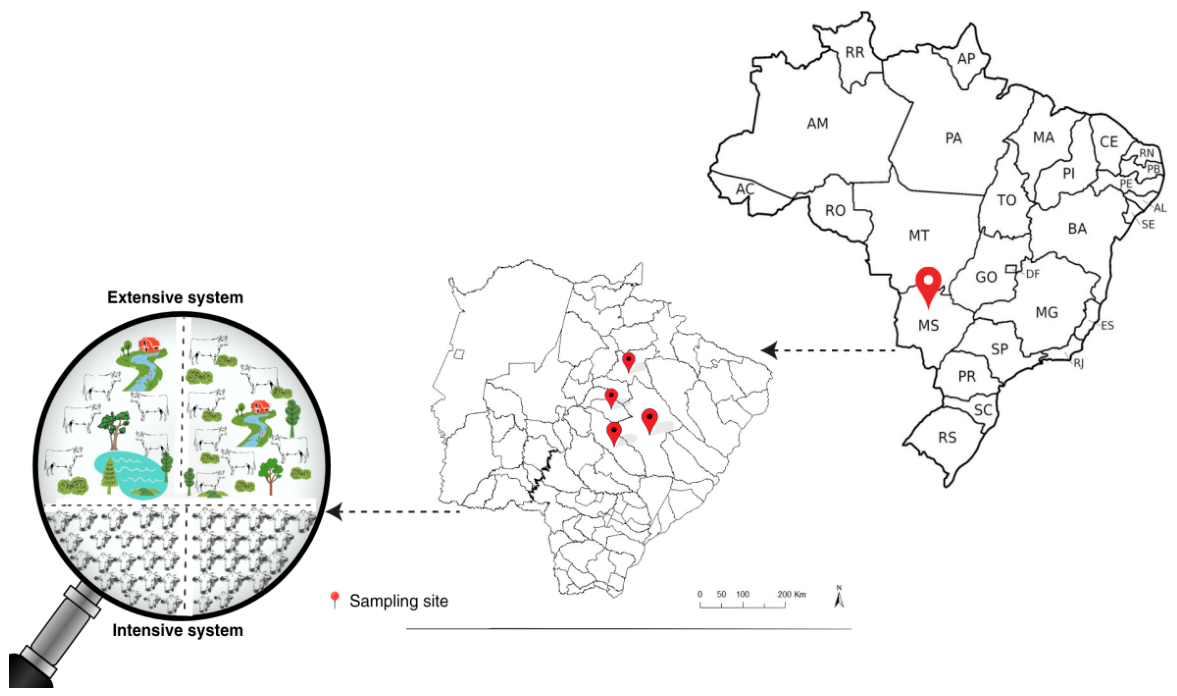
Figure 2.
Distribution of avoidance distance test categories in beef cattle from intensive (Bov INT) and extensive (Bov EXT) production systems, considering the animal as the experimental unit.
Figure 2.
Distribution of avoidance distance test categories in beef cattle from intensive (Bov INT) and extensive (Bov EXT) production systems, considering the animal as the experimental unit.
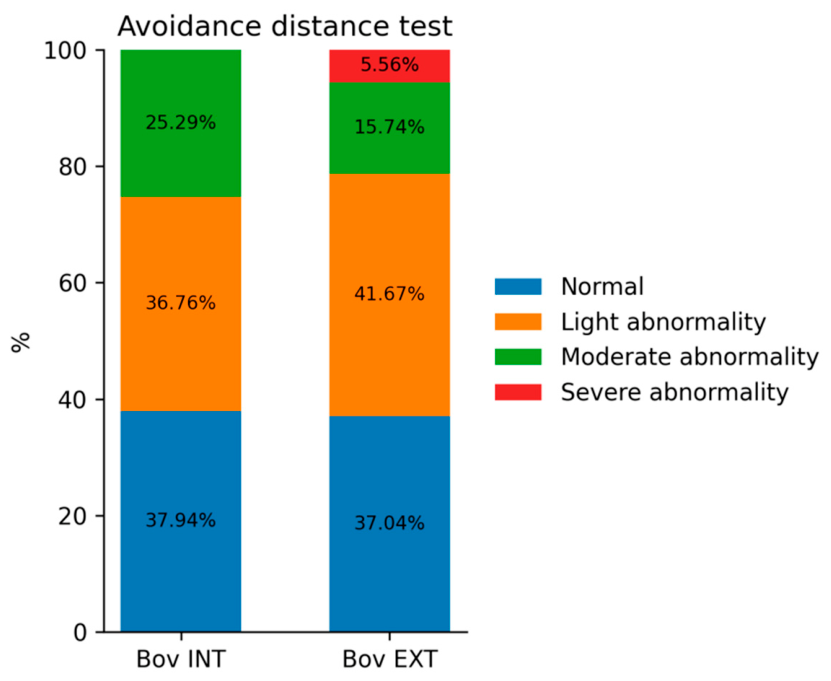
Figure 3.
A heatmap of beef cattle affective states in intensive and extensive farm production, located in the north-central, eastern, and central regions of Mato Grosso do Sul, Brazil; The assessments of the animals were conducted following the WQ protocol [40]. The color bar on the right represents the visual analogue scales (VAS) for the 20 behavioral expressions that were scored. with the absence of behavioral expression is indicated in blue, and the maximum expression in red. The dendrogram illustrates the hierarchical clustering of affective states (Y-axis) and farm systems (X-axis), allowing the visualization of similarity patterns in emotional expression among the farms and across behavioral indicators. The order of farms on the X-axis was determined by hierarchical clustering based on similarities in behavioral expression patterns.
Figure 3.
A heatmap of beef cattle affective states in intensive and extensive farm production, located in the north-central, eastern, and central regions of Mato Grosso do Sul, Brazil; The assessments of the animals were conducted following the WQ protocol [40]. The color bar on the right represents the visual analogue scales (VAS) for the 20 behavioral expressions that were scored. with the absence of behavioral expression is indicated in blue, and the maximum expression in red. The dendrogram illustrates the hierarchical clustering of affective states (Y-axis) and farm systems (X-axis), allowing the visualization of similarity patterns in emotional expression among the farms and across behavioral indicators. The order of farms on the X-axis was determined by hierarchical clustering based on similarities in behavioral expression patterns.
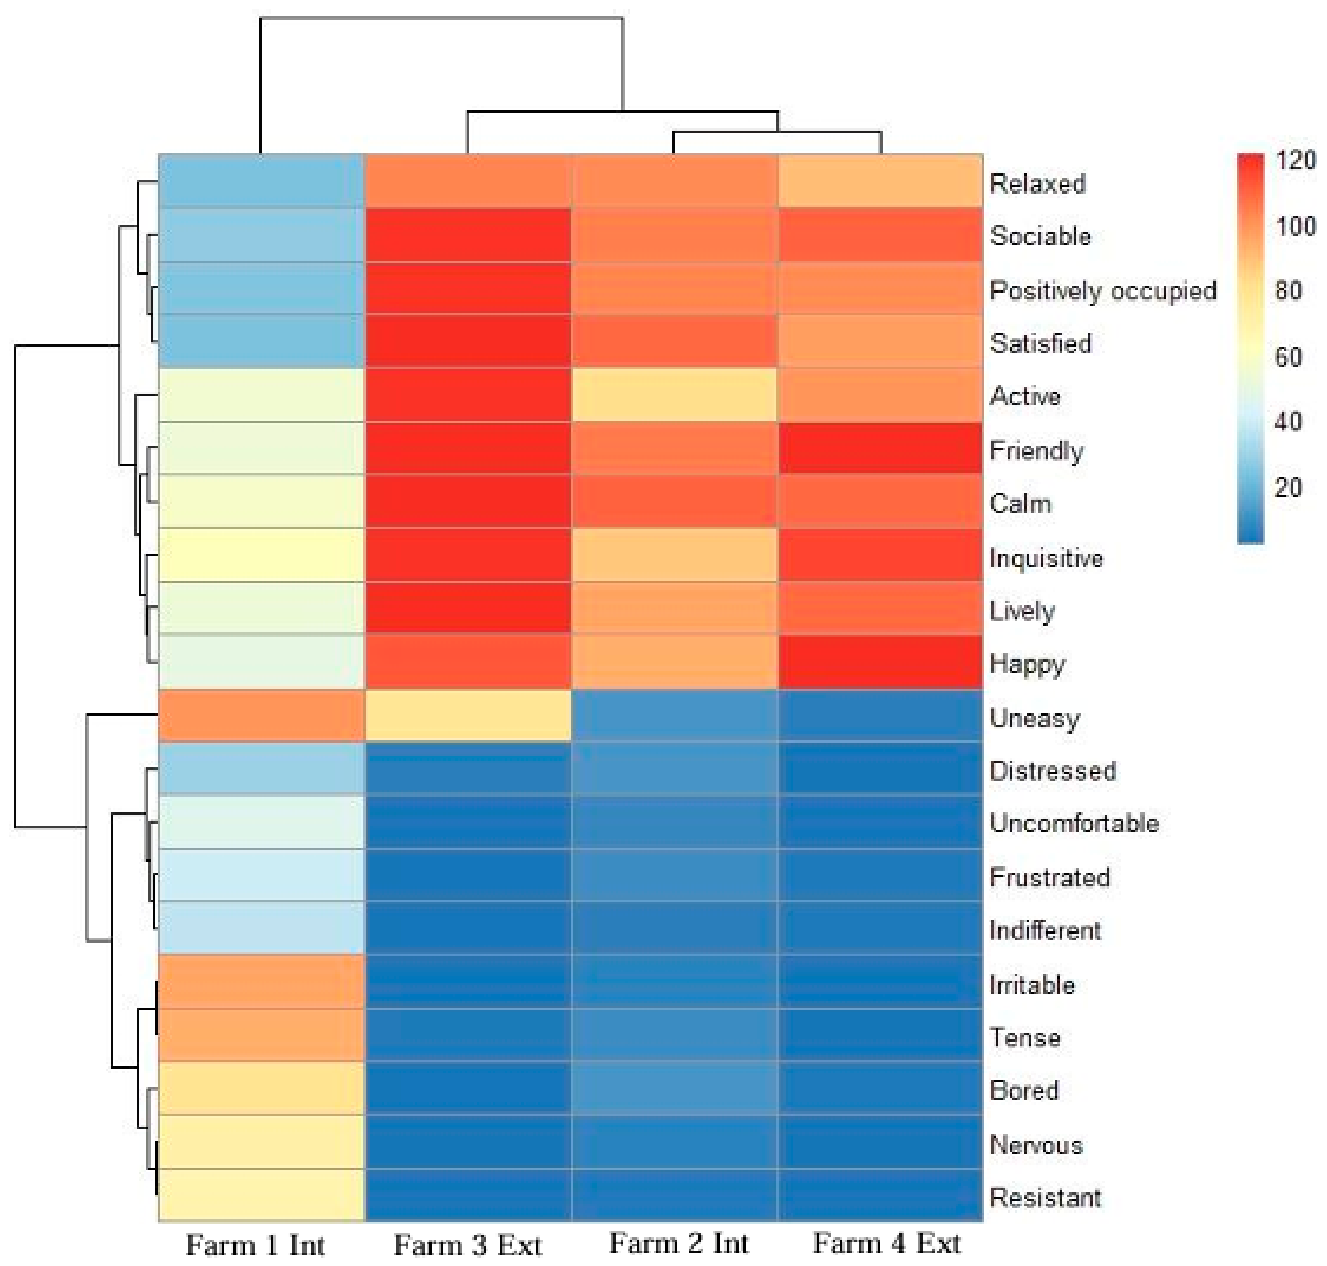
Figure 4.
Frequency score probabilities of eye discharge (a), nasal discharge (b), coughing (c), and swelling (d) assessed by the Chi-square test of association in beef cattle from intensive and extensive systems in farms located in the north-central, eastern, and central regions of Mato Grosso do Sul, Brazil. * following the health indicators indicate significant differences among farm systems (p < 0.05).
Figure 4.
Frequency score probabilities of eye discharge (a), nasal discharge (b), coughing (c), and swelling (d) assessed by the Chi-square test of association in beef cattle from intensive and extensive systems in farms located in the north-central, eastern, and central regions of Mato Grosso do Sul, Brazil. * following the health indicators indicate significant differences among farm systems (p < 0.05).
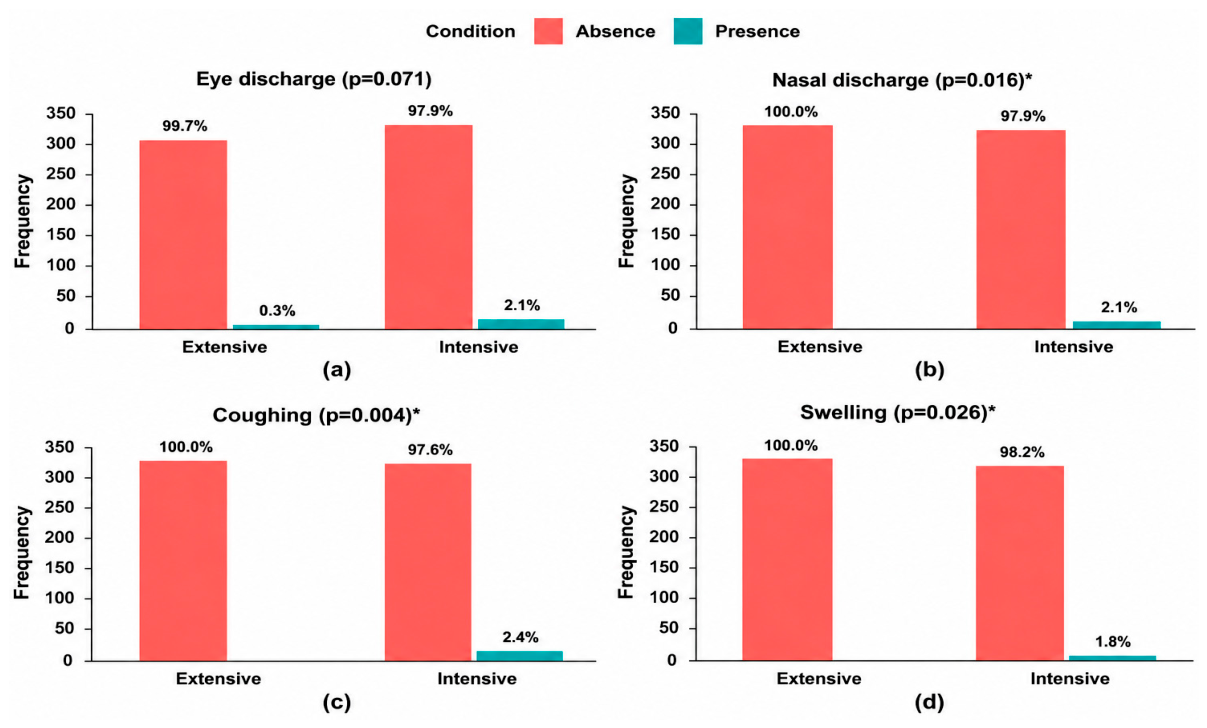
Figure 5.
Hematological parameters and differential leukocyte counts of beef cattle from intensive and extensive production systems in Mato Grosso do Sul, Brazil: hematocrit (a), total leukocyte count (TLC) (b), neutrophil count (c), neutrophil-to-lymphocyte ratio (N/L ratio) (d) and lymphocyte count (e). Statistical comparisons between production systems were performed using the unpaired Student’s t-test. Exact p-values are shown in each panel..
Figure 5.
Hematological parameters and differential leukocyte counts of beef cattle from intensive and extensive production systems in Mato Grosso do Sul, Brazil: hematocrit (a), total leukocyte count (TLC) (b), neutrophil count (c), neutrophil-to-lymphocyte ratio (N/L ratio) (d) and lymphocyte count (e). Statistical comparisons between production systems were performed using the unpaired Student’s t-test. Exact p-values are shown in each panel..
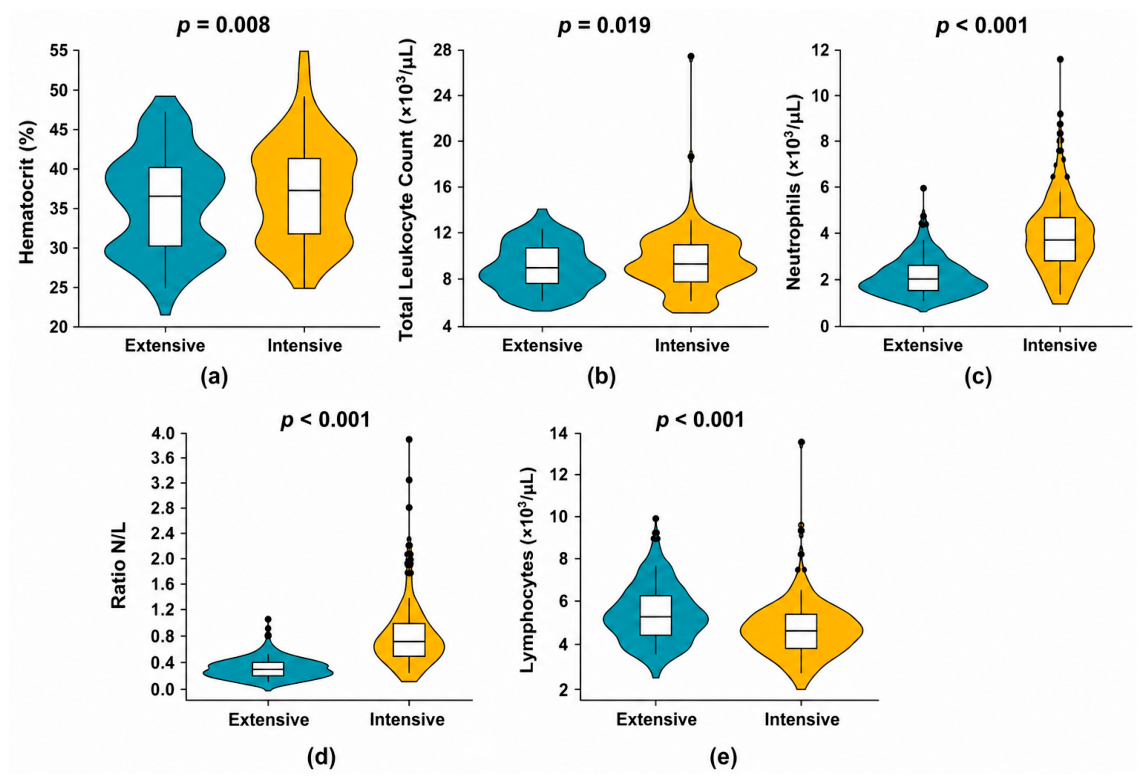
Figure 6.
Frequency of morphological alterations in neutrophils and lymphocytes of beef cattle from intensive and extensive production systems in farms located in the north-central, eastern, and central regions of Mato Grosso do Sul, Brazil: (a) neutrophil morphology, grouped as normal/light (scores 0–1) and severe (scores 3–4); and (b) lymphocyte morphology, classified as normal (score 0) or atypical (score 1). No animals presented moderate neutrophil morphological changes (score 2). Statistical comparisons between production systems were performed using the Chi-square test of association with simulated p-values. Both associations were significant (p < 0.001).
Figure 6.
Frequency of morphological alterations in neutrophils and lymphocytes of beef cattle from intensive and extensive production systems in farms located in the north-central, eastern, and central regions of Mato Grosso do Sul, Brazil: (a) neutrophil morphology, grouped as normal/light (scores 0–1) and severe (scores 3–4); and (b) lymphocyte morphology, classified as normal (score 0) or atypical (score 1). No animals presented moderate neutrophil morphological changes (score 2). Statistical comparisons between production systems were performed using the Chi-square test of association with simulated p-values. Both associations were significant (p < 0.001).
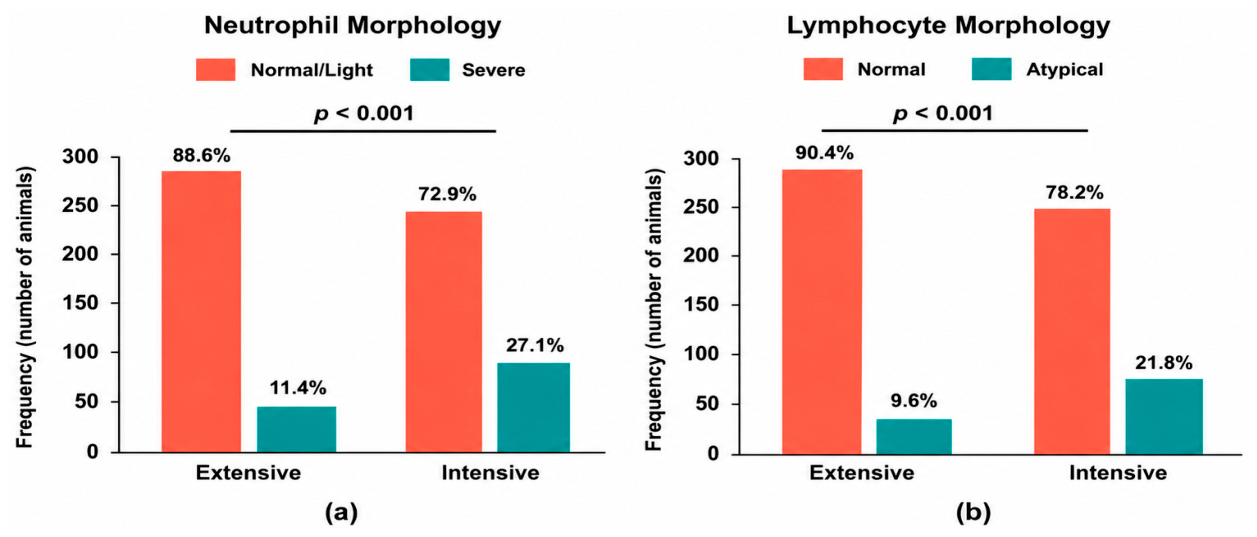
Figure 7.
Representative neutrophil and lymphocyte morphology illustrating the leukocyte cell scoring system developed in this study. Peripheral blood smears were obtained from crossbred cattle (Bos taurus indicus × Bos taurus taurus) raised on farms in the North-central, Eastern, and Central regions of Mato Grosso do Sul, Brazil. (A) Normal segmented neutrophil (score 0); (B–D) neutrophils showing severe toxic changes (score 4); (E) normal medium lymphocyte (score 0); (F) reactive lymphocyte (score 1). Blood smears were stained with methanolic Wright–Giemsa stain and examined using an Axio Scope A1 optical microscope (Carl Zeiss Microscopy GmbH, Germany) equipped with an Axiocam 503 color camera and ZEN Lite (Blue Edition) imaging software at 1000× magnification.
Figure 7.
Representative neutrophil and lymphocyte morphology illustrating the leukocyte cell scoring system developed in this study. Peripheral blood smears were obtained from crossbred cattle (Bos taurus indicus × Bos taurus taurus) raised on farms in the North-central, Eastern, and Central regions of Mato Grosso do Sul, Brazil. (A) Normal segmented neutrophil (score 0); (B–D) neutrophils showing severe toxic changes (score 4); (E) normal medium lymphocyte (score 0); (F) reactive lymphocyte (score 1). Blood smears were stained with methanolic Wright–Giemsa stain and examined using an Axio Scope A1 optical microscope (Carl Zeiss Microscopy GmbH, Germany) equipped with an Axiocam 503 color camera and ZEN Lite (Blue Edition) imaging software at 1000× magnification.
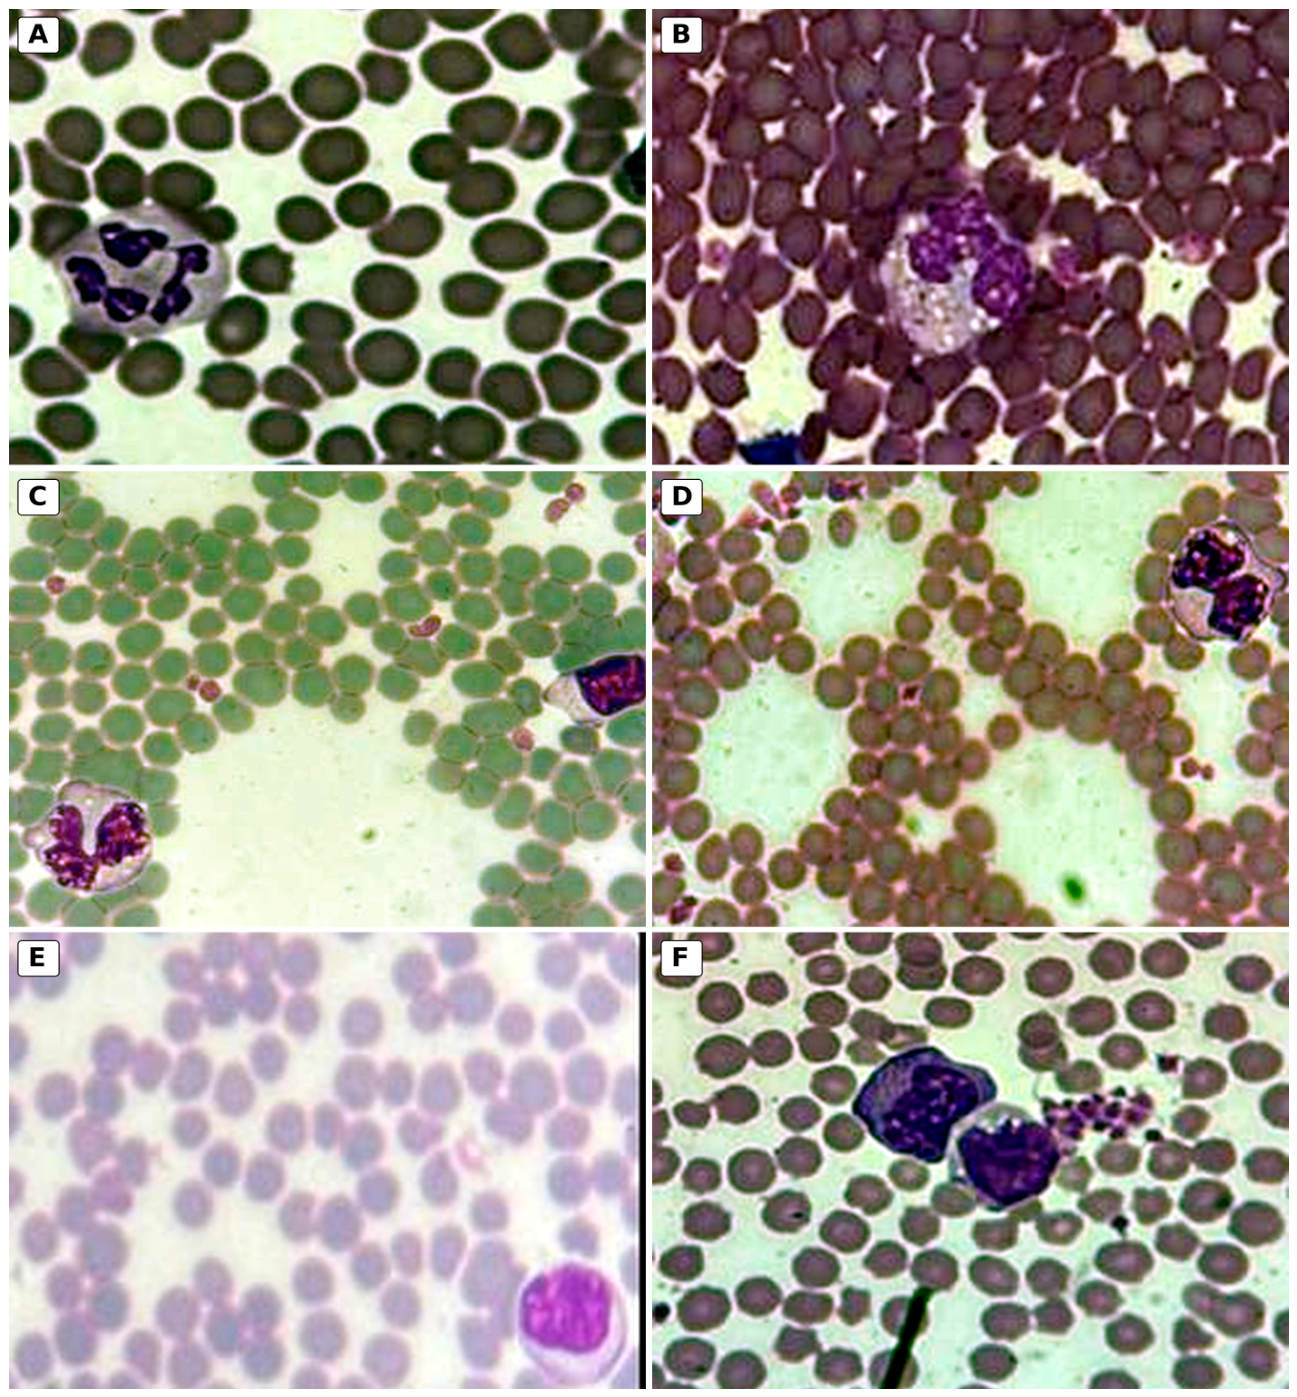

Table 1.
Main characteristics of the assessed beef cattle farms located in the North-central, Eastern, and Central regions of Mato Grosso do Sul, Brazil.
Table 1.
Main characteristics of the assessed beef cattle farms located in the North-central, Eastern, and Central regions of Mato Grosso do Sul, Brazil.
| Variable | Farm 1 | Farm 2 | Farm 3 | Farm 4 |
|---|---|---|---|---|
| Production system | Intensive (Confinement) | Intensive (Confinement) | Extensive (Open pastures) | Extensive (Open pastures) |
| Municipality | Jaraguari | Campo Grande | Ribas do Rio Pardo | Camapuã |
| Season | Spring | Autumn | Spring | Autumn |
| Farm size (ha) | 274 | 387 | 577 | 1750 |
| Herd size | 700 | 2500 | 540 | 1750 |
| Breed | Nellore Cross | Nellore Cross | Nellore Cross | Nellore Cross |
| Identification | Ear tags | Ear tags | Ear tags | Ear tags |
| Age (months) | 20±4s | 24±4 | 20±4 | 24±4 |
| Stocking density, cattle/m2 | 20 | 10-15 | 10 | 1 |
| Average weight (Kg) | 450±40 | 480±50 | 400±50 | 420±40 |
| Feeding strategy | Concentrate 4X/day |
Concentrate 4X/day |
Pasture and Concentrate 1X/day |
Only Pasture |
| Bunk feeder and size/head (cm) | Plastic barrel 45X50 |
J type Concrete 45X50 |
Plastic barrel 45X50 |
Plastic barrel 45X50 |
| Water Trough and size | Plastic barrel 200 L |
Tilting water 600-1200 L | Large metal 2600 L | Concrete waterer 690 L |
Table 2.
Herd health management practices evaluated across intensive and extensive beef cattle production systems in Mato Grosso do Sul, Brazil.
Table 2.
Herd health management practices evaluated across intensive and extensive beef cattle production systems in Mato Grosso do Sul, Brazil.
| Variable | Farm 1 | Farm 2 | Farm 3 | Farm 4 |
|---|---|---|---|---|
| Vaccination | Clostridiosis | Clostridiosis BVD, IBR, BRSV, PI3, Pasteurellosis Leptospirosis |
Clostridiosis | Clostridiosis |
| Deworming | Doramectin 3,5% | Albendazole sulfoxide 15%e | Albendazole sulfoxide 15% | Ivermectin® 3,5%c |
| Dehorning and castration procedure | N/A | N/A | N/A | N/A |
| Mortality (%/year) | < 1 | 0 | <1 | 1,5 |
N/A: not applicable. Pain management was not applicable because dehorning and castration were not performed.
Table 3.
Description of the morphologic diversity observed on the blood films of cattle neutrophil and lymphocyte cells for their classification, as per morphological criteria described by [32,33,44,50].
| Cell | Description of the morphologic | Score | Classification | Images |
|---|---|---|---|---|
| Neutrophil normal | Normal morphology; cytoplasm filled with fine, small granules and with slight acidophilic (pink). Tri or S-shaped segmented nucleus (3 to 5 lobes), connected by thin filaments of dense chromatin (dark blue). | 0 | Normal | 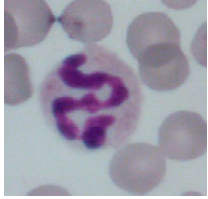 |
| Immature Neutrophil (band) | Moderate change (reversible lesion); cytoplasm containing light pink granules; with typical horseshoe shaped nucleus and non-segmented. band > reference value. | 1 | Light change | 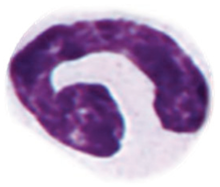 |
| Immature Neutrophil (metamyelocyte) (±left shift) | Moderate change; presence of metamyelocyte faint blue cytoplasm and with typical kidney-bean shaped nucleus and less clumped chromatin | 2 | Moderate change | 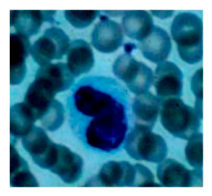 |
| Immature Neutrophil (myelocyte) (±left shift) | Severe change; presence of myelocyte faint blue cytoplasm with typical large spherical and nonsegmented nucleus and less clumped chromatin. | 3 | Severe change | 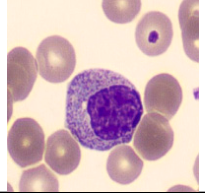 |
| Toxic Change Neutrophil (±left shift) | Severe toxic change (irreversible damage); endotoxin induced abnormal PMN (evidence of delayed maturation). Basophilic and azurophilic granules and vacuoles in the cytoplasm. Pale blue inclusions of ribosomes and RNA and left shift (band, metamyelocyte and myelocyte) may be present. | 4 | Severe change | 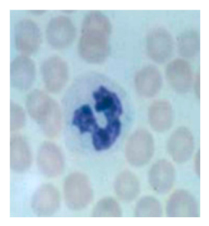 |
| Lymphocyte normal | Normal morphology; small (A) and medium (B) lymphocytes, the cytoplasm forms an extremely narrow, weakly basophilic rim around the nucleus and in some cells, azure granules may be present; circular nucleus with darkly staining with chromatin arranged in dense blocks (dark blue), occupying 70 to 90% of the cytoplasm; large (C) lymphocytes, the cytoplasm is pale blue, faintly basophilic, and frequently contains small vacuoles; nucleus may be round, oval, kidney-shaped, or have a few deep indentations. | 0 | Normal | 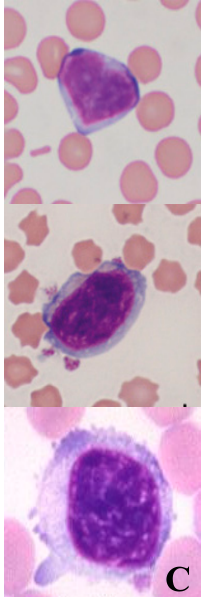 |
| Lymphocyte abnormal | Abnormal morphology; reactive lymphocyte, increased cytoplasm with intense basophilia; irregular, scalloped, or cleaved nuclei with clumped chromatin. | 1 | Anormal | 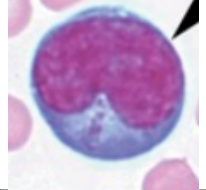 |
Table 4.
Classification of nutrition, environment, and behavior indicator scores in beef cattle from intensive and extensive systems in farms located in the north-central, eastern, and central regions of Mato Grosso do Sul, Brazil.
Table 4.
Classification of nutrition, environment, and behavior indicator scores in beef cattle from intensive and extensive systems in farms located in the north-central, eastern, and central regions of Mato Grosso do Sul, Brazil.
| Principle | Measures | Classification | Farm 1 Intensive | Farm 2 Intensive | Farm 3 Extensive | Farm 4 Extensive |
|---|---|---|---|---|---|---|
| Good feeding | Body condition score % | Normal | 100 | 100 | 100 | 100 |
| Severe change | 0 | 0 | 0 | 0 | ||
| Cleanliness of water points % | Normal | 0 | 0 | 0 | 0 | |
| Moderate change | 0 | 100 | 0 | 100 | ||
| Severe change | 100 | 0 | 100 | 0 | ||
| Good housing | Cleanliness of the animals % | Normal | 25 | 91.6 | 100 | 99.3 |
| Severe change | 75 | 8.4 | 0 | 0.7 |
Table 5.
Hematological parameters and differential cell count from 664 beef cattle in studied farms from intensive and extensive systems in farms located in the north-central, eastern, and central regions of Mato Grosso do Sul, Brazil.
Table 5.
Hematological parameters and differential cell count from 664 beef cattle in studied farms from intensive and extensive systems in farms located in the north-central, eastern, and central regions of Mato Grosso do Sul, Brazil.
| Variable | Farm Intensive | Farm Extensive | Reference Values ab |
p |
|---|---|---|---|---|
| N=340 | N=324 | |||
| Hematocrit (%) | 35.70 ± 6.11 | 34.44 ± 6.14 | 24-39 | 0.008 |
| TLC (x109/L) | 8.48 ± 2.39 | 8.07 ± 2.10 | 4.4 - 10.8 | 0.019 |
| Neutrophil (x109/L) | 3.46 ± 1.55 | 1.84 ± 0.79 | 0.8-5.0 | <0.001 |
| Band (x109/L) | 0.13 ± 0.28 | 0.00 | 0-0.01 | - |
| Meta+Mielo (%) | 0.00 | 0.00 | 0 | - |
| Lymphocyte (x109/L) | 4.16 ± 1.25 | 5.00 ± 1.42 | 1.8-4.9 | <0.001 |
| Eosinophil (x109/L) | 0.63 ± 0.31 | 0.79 ± 0.4 | 0.1-2.1a | - |
| Basophil (x109/L) | 0.00 | 0.00 | 0.00 | - |
| Monocyte (x109/L) | 0.32 ± 0.32 | 0.47 ± 0.27 | 0.3-1.2a | - |
| N-L ratio | 0.88 ± 0.48 | 0.38 ± 0.15 | <1ab | <0.001 |
Disclaimer/Publisher’s Note: The statements, opinions and data contained in all publications are solely those of the individual author(s) and contributor(s) and not of MDPI and/or the editor(s). MDPI and/or the editor(s) disclaim responsibility for any injury to people or property resulting from any ideas, methods, instructions or products referred to in the content. |
© 2026 by the authors. Licensee MDPI, Basel, Switzerland. This article is an open access article distributed under the terms and conditions of the Creative Commons Attribution (CC BY) license (http://creativecommons.org/licenses/by/4.0/).
Copyright: This open access article is published under a Creative Commons CC BY 4.0 license, which permit the free download, distribution, and reuse, provided that the author and preprint are cited in any reuse.