

Submitted:
19 August 2026
Posted:
20 August 2026
You are already at the latest version
Abstract
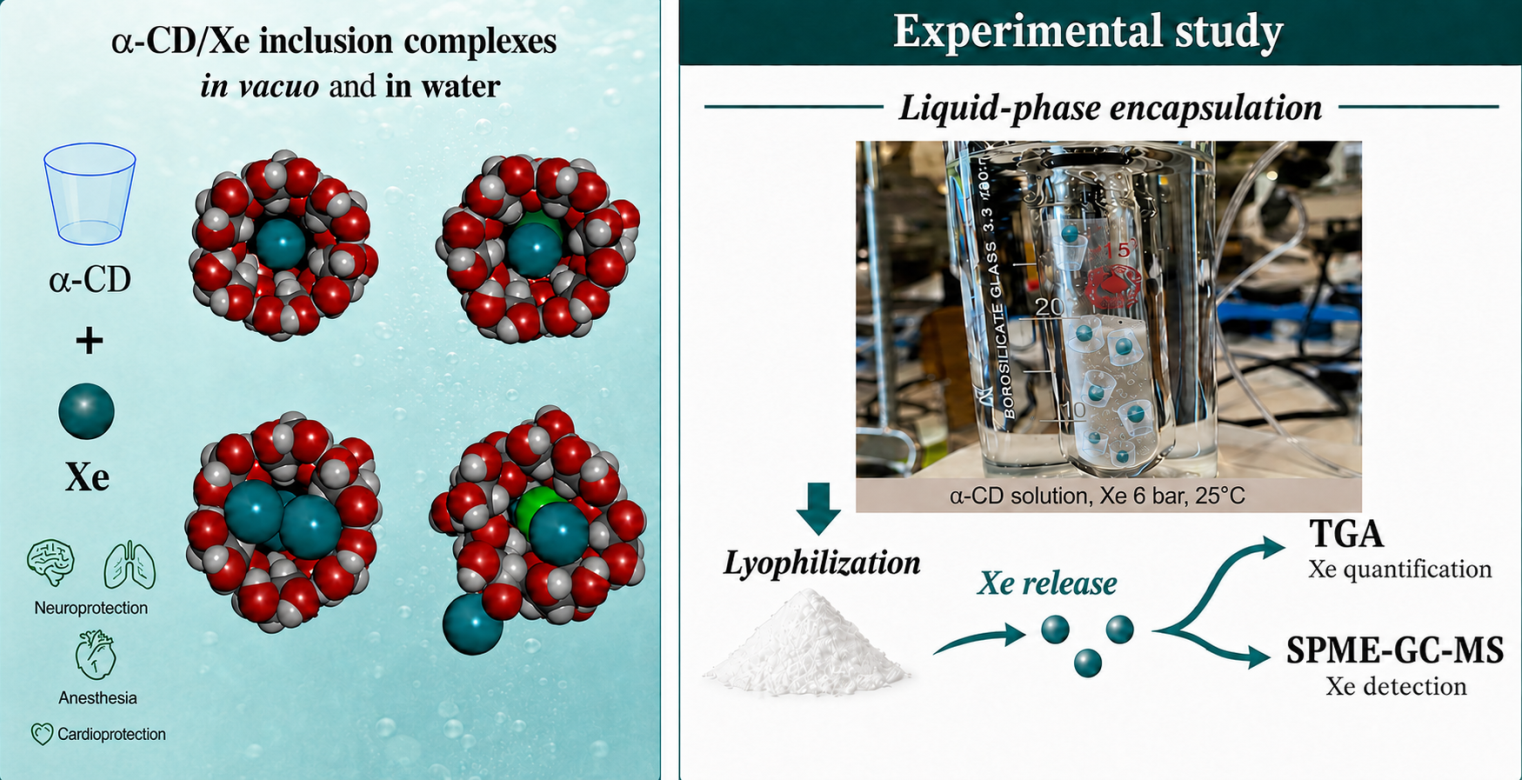
Xenon (Xe) is an inert noble gas receiving increasing attention in medical research due to its anesthetic properties, ability to regulate metabolic processes, and broad organoprotective effects. Due to its low molecular weight and small size, Xe can be encapsulated within α-cyclodextrin (α-CD). In this study, we combine a theoretical study based on molecular mechanics (MM) and molecular dynamics (MD) simulations with the synthesis and characterization of the α-CD/Xe inclusion complex. During the MD simulations, surface interactions and the formation of inclusion complexes, with Xe atoms encapsulated within the α-CD cavity, were observed in aqueous solution. As the Xe concentration in water increased, α-CD/Xe inclusion complexes with 1:1, 1:2, and 1:3 stoichiometries were formed and remained stable over time, suggesting increasingly effective encapsulation at higher pressures. Following this computational investigation, experimental work was conducted to synthesize and characterize the α-CD/Xe inclusion complex using a liquid-phase encapsulation method. The complexes were prepared at pressures of 2 and 4 bar. Thermogravimetric analysis (TGA) revealed weight loss. The effective encapsulation of Xe was also confirmed by solid-phase microextraction coupled with gas chromatography - mass spectrometry (SPME-GC-MS), which detected the characteristic m/z signals of Xe and allowed monitoring of its release over time upon contact with aqueous solution.
Keywords:
xenon
; α-cyclodextrin
; inclusion complexes
; pharmaceutical applications
1. Introduction
Xenon (Xe), a noble inert gas present in trace amounts in the atmosphere [1], is distinguished by its rapid pharmacokinetics, low blood/gas partition coefficient and non-toxicity [2]. This medical gas combines anesthetic, neuroprotective, and cardioprotective properties, acting through competitive inhibition of glutamatergic N-methyl-D-aspartate (NMDA) receptor at glycine binding sites [3,4]. Recent studies prove the therapeutic potential of Xe in Alzheimer’s disease and tauopathy [5,6]. Xe has also shown promising results for treating Parkinson's disease due to its neuroprotective and anti-dyskinetic properties [7]. Despite its promising therapeutic profile, xenon delivery faces two challenges: first, its high cost and poor aqueous solubility; second, its inertness due to a filled valence shell, which excludes covalent bonding. This inertness is counterbalanced by high polarizability (4.04 ų), enabling strong London dispersion forces and van der Waals interactions [8]. These non-covalent interactions constitute the primary driving forces for Xe's inclusion within suitable host molecules, enabling stable clathrate formation. Xe binding studies include multiple host molecules: hemicarcerands [9], cryptophanes for biosensing applications [10,11,12,13], porous organic cages for rare gases separation [14], metallic organic frameworks for gas storage and Xe/Kr separation [15,16], and chiral capsules for enantioselective recognition [8]. Although diverse Xe host candidates exist, these synthetic materials suffer from poor aqueous solubility, multi-step synthesis procedure, and toxicity concerns that limits their biomedical application. Cyclodextrins (CDs) overcome these limitations as FDA and EMA approved materials with high aqueous solubility and a relatively hydrophobic cavity that selectively accommodates diverse guest molecules [17]. α-cyclodextrin (α-CD) consists of six α-1,4-linked glucopyranose units arranged in toroidal geometry [18]. This shape confers a conical form with a hydrophilic outer and a slightly hydrophobic inner cavity [19]. The combination of approved safety profile, high aqueous solubility and well-defined cavity size makes α-CD particularly suitable for hosting different gaseous molecules, such as ethylene [20,21], CO2 [22], 1-methylcyclopropene [23], nitrogen, nitrous oxide [24] and krypton [25]. In this context, Xe stands out as an attractive guest because of its high polarizability with a Van der Waals diameter that fits perfectly inside the α-CD cavity, favoring its encapsulation.
This work presents computational modeling followed by experimental validation of α-CD/Xe inclusion complexes. The theoretical investigation is based on molecular mechanics (MM) and molecular dynamics (MD) methods at the atomistic level using a protocol proposed in previous studies on host–guest complexes involving cyclodextrins [26,27,28,29,30,31]. Intermolecular interactions between α-cyclodextrin and xenon were theoretically investigated at different initial α-CD/Xe ratios to elucidate the possible formation of α-CD/Xe inclusion complexes (ICs) at different stoichiometries during the MD simulations. The intermolecular interactions induce the encapsulation in the small cavity of the α-CD in aqueous solution, which is consistent with experimental findings from NMR experiments reported in the literature [32,33]. Favorable intermolecular interactions occur between the Xe atoms and the outer surface of the α-CD and between the xenon atoms themselves at higher concentrations. The experiment was performed using liquid-phase encapsulation. The effects of pressure and loading time were studied, and the obtained inclusion complex was characterized through thermogravimetric and FTIR analysis. The release of Xe from the complex upon contact with water was monitored using SPME-GC-MS. Theoretical results followed by experimental data are presented in the following section.
2. Results and Discussion
2.1. Theoretical Study of α-CD/Xe Interactions
Initially, MM/MD simulations considering α-CD interactions with Xe atoms in a random arrangement at different ratios were performed in vacuo to understand possible encapsulation in stable α-CD inclusion complexes. Following analysis of the theoretical results, MM/MD simulations in water were performed to better understand the role of water molecules in the encapsulation of xenon atoms in α-CD, particularly at higher Xe concentrations. Water molecules stabilize the inclusion process. The theoretical results are presented and discussed in the next paragraphs.
2.1.1. Theoretical Study of α-CD/Xe Interactions in Vacuo
Using a simulation protocol adopted in previous works [26,30,31] and discussed in the Materials and Methods Section, the initial non-optimized geometries considering an α-CD and Xe atom(s) at 1:1, 1:2, 1:3, 1:10 and 1:30 ratios were considered, as shown in Figures S1 and S2. After energy minimization, Xe atom(s) become encapsulated, leading to the formation of inclusion complexes involving α-CD and Xe atom(s) with 1:1, 1:2, and 1:3 stoichiometries, as shown in panels (a), (b), and (c) in Figure 1, respectively.
In the α-CD/Xe IC with a 1:1 stoichiometry (panel (a) in Figure 1), the distance between the Xe atom and the center of mass (c.o.m.) of the α-CD is equal to 0.10 Å. Considering the α-CD/Xe IC with a 1:2 stoichiometry (panel (b) in Figure 1), the distance between the Xe atom closest to α-CD secondary rim is equal to 1.25 Å, while the distance between the Xe atoms closest to the primary rim is 2.68 Å. The distance between the two Xe atoms is 3.93 Å. Considering the α-CD/Xe IC with a 1:3 stoichiometry (panel (c) in Figure 1), the distance between the Xe atoms well encapsulated within the hydrophobic cavity is 0.17 Å, while the distance from the CD c.o.m. and the other two Xe atoms closest to the secondary edge are 4.26 and 4.58 Å, respectively. Of particular interest is the mutual arrangement of the three Xe atoms, which form an equilateral triangle with sides measuring (4.228 ± 0.252) Å.
At larger Xe atoms concentrations, after the initial energy minimization, α-CD/Xe IC with a 1:2 stoichiometry is formed, as shown in the encapsulated Xe atoms in green in Figure 2. For the initial α-CD/Xe atoms with 1:10 and in 1:30 ratios (see panel (a) in Figure 2), the optimized geometries show that the distances between the encapsulated Xe atoms near the secondary and primary rims are equal to 1.13 and 2.72 Å (panel (a) in Figure 2) and 1.85 and 1.94 Å (panel (b) in Figure 2), respectively. In both cases studied, the mutual arrangement of the four unencapsulated Xe atoms near the α-CD secondary rim is particularly noteworthy. As shown in dark green in Figure 2, these atoms form an approximate square with side lengths of (4.079 ± 0.085) Å (optimized geometry in panel (a) of Figure 2), and (4.053 ± 0.020) Å (optimized geometry in panel (b) of Figure 2). In the final complex, corresponding to the highest concentration of Xe studied, the formation of an approximately equilateral triangle formed by three Xe atoms adsorbed on the external surface of the cyclodextrin was noteworthy. The triangle had sides equal to (4.182 ± 0.118) Å, similar to that formed by three Xe atoms in the α-CD/Xe IC with a 1:3 stoichiometry, shown in panel (c) of Figure 1. From this analysis of the obtained data, we can therefore highlight the interesting tendency of Xe atoms to aggregate with each other, forming ordered geometric structures in the cavity of the α-CD and on its external surface.
The interaction energy between the α-CD and Xe atoms is defined as E int = (E α-CD free + E Xe atoms free) – E tot, where E free is the energy of the free, isolated α-CD and Xe atom(s), and E tot is the potential energy of the initial optimized geometries in vacuo, as shown in Figure 1 and Figure 2, respectively. According to this definition, E int < 0 indicates favorable intermolecular interactions within the CD internal cavity or on its surface exposed to the environment. E int > 0 represents the energy required to detach the Xe atom(s) from the α-CD and return it to the free state. In Figure 3, the interaction energy (filled symbols) of the optimized initial geometries is plotted as a function of the number of Xe atoms in the simulation cell. The Eint increases linearly with Xe atoms due to favorable non-covalent intermolecular interactions between the internal cavity of the α-CD and the external surface and between the Xe atoms themselves.
Starting from all the initial optimized geometries reported in Figure 1 and Figure 2, the MD runs were performed at a constant temperature (T=300 K) in vacuo. In all cases, the Xe atoms initially encapsulated or adsorbed onto the external surface of the α-CD moved rapidly away from the CD because their kinetic energy exceeded the weak intermolecular interactions. Therefore, these formed inclusion complexes were not stable in vacuo. Subsequent calculations in water highlight the role of this polar solvent in promoting the solubilization of cyclodextrin and Xe, particularly at higher concentrations. This suggests that, experimentally, increasing the pressure is advantageous because it increases the amount of Xe in water in contact with α-CD, thereby forming inclusion complexes that are more stable over time than those in vacuo. This behavior is in accordance with Henry's law, which states that at constant temperature, the solubility of a gas in a liquid is directly proportional to the pressure of the gas above the solution.
In the final geometries optimized after the MD runs, the Xe atoms generally adopted a random arrangement in the simulation cell, except for the α-CD and Xe system at a 1:10 ratio. In fact, as shown in panels (a) and (b) in Figure 4, in this system, three Xe atoms arranged themselves in a nearly equilateral triangle with sides measuring (15.17 ± 0.594) Å around the outer surface of the cyclodextrin.
2.1.2. Theoretical Study of α-CD/Xe Interactions in Aqueous Solution
Using a simulation protocol proposed in previous works [34,35], the initial geometries considering an α-CD and one or more Xe atoms in ratios at 1:1, 1:2, 1:3, 1:10 and 1:30 were investigated, with the Xe atoms randomly distributed in a cubic cell in the presence of water molecules, as shown in Figures S3 and S4, respectively.
After energy minimizations (shown in Figure S5 and Figure S6), performing molecular dynamics and optimizing different conformations assumed by the system during MD runs, encapsulation of Xe atoms occurred. Inclusion complexes involving α-CD and Xe atoms with stoichiometries of 1:1, 1:2, and 1:3 formed relatively quickly, as previously found in vacuo. In addition, xenon atoms were adsorbed onto the external surface of α-CD and underwent self-aggregation due to favorable intermolecular interactions between the α-CD and the Xe atoms, as well as between the xenon atoms themselves, particularly at higher gas concentrations.
For the optimized α-CD/Xe system with a 1:1 stoichiometry (panel (a) in Figure S5), the Xe atom initially included in the hydrophobic cavity of α-CD remained encapsulated throughout most of the molecular dynamics simulation, except in a few conformations sampled during the MD run. Panel (a) of Figure 5 shows the distance between the c.o.m. of the α-CD and the initially encapsulated Xe atom calculated as a function of simulation time in ns, starting from the optimized geometry shown in panel (a) of Figure S5. The Xe atom remained included throughout almost all molecular dynamics simulations, except for some geometries where the calculated distances were between 4 and 5 Å.
Regardless of whether the initial system contains α-CD and two or three Xe atoms (panels (b) and (c) in Figure S5), the inclusion complex forms first with a 1:1 α-CD/Xe stoichiometry, and then with a 1:2 α-CD/Xe stoichiometry. Indeed, as reported in panel (c) of Figure 5 and in panel (a) of Figure S7, a first Xe atom was encapsulated and remained close to the c.o.m. of α-CD. The second Xe atom was included around 1.2 ns, thus forming the α-CD/Xe complex with a 1:2 stoichiometry. The α-CD/Xe inclusion complexes with a 1:2 stoichiometry formed in water during two different MD runs, starting from α-CD:Xe ratios of 1:2 and 1:3, are reported in panels (b) and (c) of Figure S7, respectively. After the inclusion of the second Xe atom, the mobility of the first initially included gas atom increased, maintaining a nearly constant distance between the Xe atoms.
These results could be compared with our previous theoretical study on the inclusion of 5-fluorouracil (5-FU), an anticancer drug, into β-CD, initially with a 1:1 stoichiometry, and subsequently with a 1:2 stoichiometry in water [34,35]. Interestingly, when a second Xe atom was included in the α-CD cavity, the mobility of the first encapsulated Xe atom increased, even moving away from the α-CD (see panel (c) in Figure 5 and panel (a) in Figure 7). Consequently, over time, the 1:2 inclusion complex and the simple 1:1 α-CD/Xe IC were formed. It is worth noting that in this case study and in the studies of the inclusion of a hydrophobic drug molecule, such as 5-FU, a distinct mobility was observed depending on the non-covalent intermolecular interactions with the cavity of the cyclodextrin or with the cyclodextrin surface exposed to the solvent. Similar behavior was also observed when a second 5-FU molecule was encapsulated over time within the β-CD cavity in water [35].
Panels (b) and (d) of Figure 5 show the Radial Distribution Function (RDF) [26,27,28] calculated during the MD runs with the formation of α-CD/Xe ICs with 1:1 and 1:2 stoichiometries. The distance of the Xe atoms calculated from the c.o.m. of the α-CD are within the values of 2 Å. Therefore, over time, conformations with Xe atoms encapsulated within the CD cavity became predominant, as also indicated by the previously discussed graphs showing the variation in the distances between Xe and α-CD previously discussed.
The plots in panels (e) and (f) of Figure 5 show the RDFs of Xe atoms as a function of their distance, r (in Å), calculated during several molecular dynamics simulations of α-CDs and Xe atoms with ratios of 1:2, 1:3, and 1:10, 1:30, respectively. Interestingly, at low and high Xe concentrations, the mutual distances between Xe atoms are comparable if they are encapsulated within the internal cavity of the CD or interact more with the secondary or primary edge of the α-CD, or more generally, with its external surface. Figure S8 shows the side and top views of the optimized geometries sampled the during molecular dynamics simulations in water, starting from α-CD and Xe atom ratios of 1:10 and 1:30. These images illustrate the importance of non-covalent interactions within the hydrophobic cavity of the α-CD and on the external surface, including at the secondary rim and the primary rim. Of particular interest are the ordered structures that formed during the MD runs, including the formation of a row of Xe atoms starting from the α- CD cavity and the arrangement of three Xe atoms that formed an equilateral triangle with side lengths of 4.0 Å (see panels (c1) and (c3) in Figure S8). This triangular arrangement is oriented towards the wider, secondary rim of the α-CD, as previously observed in the geometries optimized in vacuo (see all panels in Figure 8).
At low xenon concentrations, the oxygen atoms of water molecules can be observed to approach the internal cavity of the CD (see the peak at 1.75 Å and the second peak at 2.73 Å in panel (a) of Figure 6). At higher Xe concentrations, however, access to the internal cavity from the primary and secondary rims of the α-CD becomes sterically hindered by the adsorption and self-aggregation between the xenon atoms themselves due to favorable non-covalent intermolecular interactions (see panels (a2), (b2), (c2), (e2), and (e3) in Figure S8).
2.2. Experimental Validation of α-CD/Xe Inclusion Complex
Panels (a) and (b) in Figure 7 present the TGA and DTG curves of α-CD and the inclusion complex α-CD /Xe obtained at 30 and 60 min, respectively. A first weight loss below 100 °C is observed for all three materials, attributed to water molecules dehydration [36]. The weight loss related to this step was almost the same (Table 1), indicating that Xe inclusion has only a minor impact on the amount of weakly bound water to α-CD. However, a second distinct weight loss appears only in the inclusion complexes α-CD/Xe curves, between 100 °C and 180 °C. This region is quite high in temperature for additional physiosorbed water molecules dehydration and is also well below the temperature of CD degradation. Therefore, this weight loss is likely related to the Xe release from the cyclodextrins cavities. Jessen et al. (2023) have mentioned that less strongly bound water was released at lower temperature and the encapsulated methane in cyclodextrin is more firmly bound than water [37]. The percentage of weight loss in this temperature range is almost identical for the complexes prepared with 30 and 60 min of xenon exposure (Table 1). The encapsulation time did not change the Xe encapsulated within the α-CD cavities, but a longer loading time (60 min) led to a larger quantity of crystal complex being produced. Similar behavior was mentioned by Ho et al. (2011) for ethylene encapsulation in α-CD, where increasing pressure and exposure time did not enhance the ethylene content of the complexes, but mainly increased the overall amount of crystalline inclusion phase obtained [20]. Finally, a decomposition step of the cyclodextrin framework was observed around 280 – 400 °C, with almost identical onset temperatures and DTG peak shapes for all the samples [38]. This confirms that xenon inclusion in α-CD does not affect the intrinsic thermal stability or degradation pathway of the cyclodextrin.
To evaluate the effect of Xe loading pressure on the thermal stability of the host, TGA/DTG analyses were carried out on α-CD and α-CD/Xe complexes prepared at 2, 4, 6 and 8 bar (panel (a) and (b) in Figure 8). The TGA/DTG analysis reveals a distinct three-step decomposition profile for all Xe inclusion complexes. While α-CD exhibits only two significant weight-loss, dehydration below 100 °C and skeletal decomposition between 250 and 450 °C. All α-CD/Xe complexes display an additional intermediate weight-loss step between 100 and 200 °C, absent in the unloaded host. This additional thermal degradation is attributed to the release of water molecules reorganized within the cyclodextrin cavity because of Xe encapsulation, providing indirect thermogravimetric evidence for successful Xe inclusion. The relative weight loss associated with this intermediate step varies with the Xe loading pressure, increasing up to 6 bar before slightly declining at 8 bar, suggesting a progressive saturation of the host cavity with increasing gas pressure. Ho et al. (2015) confirmed that higher pressure facilitated the inclusion of ethylene gas into CD molecules, due to increased gas density and penetration of gas to the CD cavities that were not easily accessible under lower pressure [39].
ATR spectra of the α-CD and of the α-CD with the inclusion complex prepared at 4 bar, are reported in Figure 9. The two spectra display essentially the same bands. Since Xe is IR inactive, has a small molecular size and is present at relatively low loading, its inclusion may be only able to cause slight vibrational change in the cyclodextrin bands rather than new absorptions bands [20]. In the fingerprint region, characteristic bands of α-CD were observed in both spectra, including C-H/O-H bending modes (1410 cm⁻¹), C-O-C stretching of glycosidic bond (1151cm-1), C-O stretching (1020 cm-1) and skeletal vibration involving α-1,4 linkage (949 cm–1) [40,41,42,43]. The broad O-H stretching between 3000 and 3600 cm-1 in the inclusion complex shows minor changes in shape and shifting to lower wavenumbers compared to the uncomplexed cyclodextrin. This behavior can be contributed to the reorganization of hydrogen bond network due to the rearrangement of cavity and lattice water molecules during Xe encapsulation [44].

Table 2.
TGA Weight loss of the different samples.
| Samples | Weight Loss (%) | ||
|---|---|---|---|
| First T≤100°C | Second 100°C ≤T≤200°C |
Third 250 °C ≤T≤450°C |
|
| α-CD | 5.93 | - | 85.28 |
| α-CD/Xe_2 bar | 14.48 | 4.46 | 72.66 |
| α-CD/Xe_4 bar | 8.72 | 6.75 | 74.21 |
| α-CD/Xe_6 bar | 8.08 | 7.02 | 72.90 |
| α-CD/Xe_8 bar | 5.64 | 6.23 | 80.39 |
Panel (a) in Figure 10 shows the time-dependent increase in Xe peak area during the release of α-CD at four different Xe pressures (2, 4, 6, and 8 bar). The area of Xe peak was used to quantify Xe release. The narrow and symmetric peak shape, with short retention time (1.15 min), confirms good chromatographic separation and selectivity of the SIM method for Xe detection (panel b) in Figure 10). At all pressures, the release curves display the same trend: a rapid initial increase during the first 30 min, followed by a progressive slowing and a plateau at longer times, consistent with a controlled release of Xe. The progressive liberation of encapsulated Xe in aqueous medium indicates that the encapsulation is controlled by weak and non-covalent interactions [45]. This behavior is consistent with recent work on α-CD/Xe solid carriers, where the complex remains stable in the dry state for months but rapidly releases Xe upon contact with water [46]. The α-CD/Xe complex prepared at 2 bar exhibits the lowest peak area, consistent with its comparatively lower weight loss in the intermediate step (4.46%) among all Xe-loaded complexes, both indicating a reduced amount of encapsulated Xe at this pressure. Higher Xe pressure accelerates both the initial uptake rate and the final loading capacity, since a greater partial pressure of gas increases the thermodynamic driving force for guest inclusion into the host cavity, thereby explaining the higher release for pressures 4, 6 and 8 bar. Above 4 bar, however, Xe loading reaches a plateau, likely due to the finite inclusion capacity of the α-CD cavity and steric hindrance caused by Xe adsorption and self-aggregation around the cyclodextrin rims.
3. Materials and Methods
3.1. Molecular Mechanics and Molecular Dynamics Simulations
The theoretical study, based on MM and MD simulations at the atomistic level, adopted the same simulation protocol proposed in previous works [31,34,35] for investigating the formation of possible inclusion complexes including CDs and small molecules. First, we considered α-CD and Xe atoms at an initial 1:1 ratio in a cubic simulation cell (side length of 40 Å). Then, systems with stoichiometries of 1:2, 1:3, 1:10, and 1:30 in a random arrangement around the cyclodextrin were studied to assess the role of Xe atom concentration in the non-covalent interactions. The encapsulation process in the inner hydrophobic cavity and surface interactions with the external part of α-CD occur with one and more Xe atoms.
The simulation protocol consisted of three steps: (I) energy minimization of the initial geometries, with α-CD and Xe in a random arrangement in a simulation box; (II) MD runs at constant temperature (T=300 K) until an equilibrium state was achieved, and (III) geometry optimization of the conformation assumed by the system at the end of the MD run when an equilibrium state was achieved and selected conformations sampled during the MD runs [26,27,28]. All calculations were performed using the Materials Studio package [47] and the COMPASS force field [48], first in vacuo [34] and subsequently in water [35]. All energy minimizations were carried out using the Conjugate Gradient algorithm up to an energy gradient lower than 4·10-3 kJ mol-1 Å-1. Possible stable α-CD/Xe host–guest complexes in different stoichiometries formed during the MD runs were investigated. After the initial energy minimization, MD runs of 2 ns were performed, followed by final geometry optimizations, allowing all stable and metastable inclusion complexes to be characterized. MD runs lasting 5 ns in vacuo were performed for systems containing ten or thirty Xenon atoms in the simulation cell. The MD simulations were performed in an NVT ensemble (canonical ensemble, see Abbreviations) at a constant temperature (300 K), maintained using a Berendsen thermostat under periodic boundary conditions (PBCs). The integration of the dynamical equations was carried out with the Verlet algorithm using a time step of 1 fs. The conformations assumed by the system were periodically saved and analyzed. The conformations at the end of the MD run when an equilibrium state was achieved, along with other significant conformations assumed by the system, were analyzed and discussed in the main text.
3.2. Materials
α-CD was purchased from CycloLab (Budapest, Hungary). Xe cylinder was supplied by Sigma Aldrich (Purity > 99.99 %). Distilled water was used to prepare all the solutions.
3.3. Preparation of α-CD/Xe Inclusion Complex
The α CD was lyophilized overnight to remove residual moisture. An amount of 1.4 g of α CD was dissolved in 8 mL of distilled water at 60 °C in the pressure cell. After dissolution, the solution was cooled to 25 ± 1 °C. The Xe cylinder was opened, and the chosen gas pressure was maintained throughout the loading period, under stirring. A white precipitate was formed and collected, frozen in liquid nitrogen then lyophilized overnight. Photographs of the α-CD solution exposed to Xe (6 bar, 25 °C) at t = 0, 2, and 10 min, together with the resulting powder after lyophilization, are shown in Figure S8.
3.4. Characterization
A Perkin Elmer Spectrum 100 FTIR Spectrometer (Waltham, MA. USA) equipped with a universal ATR (Attenuated Total Reflection) sampling accessory was used for the recording of FTIR spectra. They were collected in the wavenumber range from 650 to 4000 cm-1, with a resolution of 4 cm-1. Thermogravimetric analysis was performed using the TA Q500 instrument (New Castle, USA). The initial weight was around 9 mg. Measurements were performed under nitrogen, at a temperature range from 30 to 700 °C, with a heating rate of 10 °C min-1. The release of Xe was performed using 10 mg of the inclusion complex dissolved in 1 mL of distilled water inside a sealed glass vial. The released gas was monitored using SPME-GC-MS. The solid phase microextraction holder was Supleco 57330-U and the SPME fiber was composed of DVB/CAR/PDMS. The Gas chromatograph system was GC6890N (Agilent Technologies, USA), equipped with 5%-phenyl-methyl polysiloxane column. The carrier gas was helium (1.0 mL min-1), the split ratio was 1/20 of the total flow and the oven program was 50 °C for 4 min. The mass spectrometer coupled to the GC apparatus was a 5973 Network Mass Selective Detector (Agilent Technologies, USA). Mass spectra were recorded under electron impact at 70 eV. The interface was kept at 280 °C, ion source at 230 °C, and quadrupole mass analyzer at 150 °C. Mass spectra were collected in single ion monitoring (SIM), selecting the characteristic ions of the Xe. The instrument was controlled with Enhanced Chem Station (ver. 9.00.00.38) software.
4. Conclusions
MM/MD simulations showed that the inclusion of Xe in α-CD at ratios of 1:1, 1:2, and 1:3 is favored in aqueous solution. Non-covalent intermolecular interactions also occurred between Xe atoms and the α-CD external surface and between the Xe atoms, particularly if encapsulated and more exposed to the larger CD secondary rim. Another notable finding is the tendency of the Xe atoms to aggregate together, forming ordered geometric structures within the cavity of the α-CD and on its external surface. The release of Xe is likely slower for encapsulated Xe atoms than for those interacting on the external surface of the CD. The Xe release is likely slower for encapsulated Xe atoms than for those interacting on the external surface of the CD. The experimental study confirmed the successful encapsulation of Xe within (α-CD) cavities using TGA/DTG, ATR-FTIR, and GC-MS analyses. TGA/DTG revealed an additional weight-loss step (100–200 °C) unique to the α-CD/Xe complexes, attributed to Xe release, with loading pressure affecting the amount of encapsulated xenon. ATR spectra showed only minor changes, mainly in the O–H stretching region, confirming that Xe inclusion involves weak, non-covalent interactions rather than chemical modification of the host. GC-MS analysis demonstrated rapid Xe release upon contact with water.
These results establish α-CD as an effective host for Xe encapsulation, capable of stable solid-state storage and rapid, controlled release upon hydration for promising applications such as gas storage or Xe delivery. This property may be important in the field of biomarkers and is potentially useful for the study of Alzheimer’s disease (AD) [49,50,51,52]. In recent years, notable studies have investigated the potential utility of novel AD biomarkers. Hane et al. underlined how following inhalation of 129Xe atoms, at 60 s after holding their breath, AD patients retained significantly higher amounts of 129Xe compared with healthy controls [51]. Theoretical studies and experimental data aimed at improving methodologies and technologies for the encapsulation of Xe atoms in cyclodextrins could represent an important path for the initial study of xenon as a biomarker for Alzheimer’s disease. The rationale behind this work is to explore the possibility of facilitating non-hospital administration of xenon through the oral, pulmonary, and even intravenous routes.
Supplementary Materials
The following supporting information can be downloaded at the website of this paper posted on Preprints.org. Figure S1: Initial non-optimized geometries studied for the interactions between one, two, and three Xe atoms and α-CD; Figure S2: Initial non-optimized geometries studied for the interactions between one, two, and three Xe atoms and α-CD; Figure S3: Initial, non-optimized geometries studied in water for the interactions between one, two, and three Xe atoms and α-CD; Figure S4: Initial, non-optimized geometries studied in water for the interactions between ten and thirty Xe atoms and α-CD; Figure S5: Initial optimized geometries studied in water for the interactions between one, two, and three Xe atoms and α-CD; Figure S6: Initial optimized geometries studied in water for the interactions between ten and thirty Xe atoms and α-CD; Figure S7: Distance between two xenon atoms from the α-CD c.o.m., considering the initial α-CD/Xe ratio of 1:3, and the optimized α-CD/Xe inclusion complexes with a 1:2 stoichiometry formed in water during two different MD runs starting from α-CD:Xe ratios of 1:2 and 1:3; Figure S8: Optimized geometries sampled during the MD simulation in water starting from α-CD and Xe atom ratios of 1:10 and 1:30. Water molecules were omitted for clarity; Figure S9: pictures of the α-CD solution exposed to Xe at 6 bar and 25 °C at: (a) t = 0 min, (b) t = 2 min, and (c) t = 10 min; (d) resulting powder after lyophilization.
Author Contributions
All authors contributed equally to the research activities and manuscript preparation. All authors have read and agreed to the published version of the manuscript.
Funding
This research received no external funding.
Acknowledgments
G.R. gratefully acknowledges Paolo Carta of IT of the Department of Chemistry, Materials, and Chemical Engineering “Giulio Natta” of the Politecnico di Milano for useful technical support. The authors acknowledge support from Project CH4.0 under the MUR (Italian Ministry for Universities and Research) program “Dipartimenti di Eccellenza 2023–2027” (CUP: D13C22003520001).
Conflicts of Interest
The authors declare no conflicts of interest.
Abbreviations
The following abbreviations are used in this manuscript:
| Xe MM |
Xenon Molecular Mechanics |
| MD | Molecular Dynamics |
| NVT | Number of particles, Volume and Temperature are constant |
| PBC | Periodic Boundary Conditions |
| c.o.m. | center of mass |
| RDF | Radial Distribution Function |
| CD | cyclodextrin |
| IC | Inclusion complex |
| AD | Alzheimer's disease |
References
- Alam, A.; Suen, K.C.; Hana, Z.; Sanders, R.D.; Maze, M.; Ma, D. Neuroprotection and Neurotoxicity in the Developing Brain: An Update on the Effects of Dexmedetomidine and Xenon. Neurotoxicol. Teratol. 2017, 60, 102–116. [Google Scholar] [CrossRef] [PubMed]
- Hecker, K.; Baumert, J.H.; Horn, N.; Rossaint, R. Xenon, a Modern Anaesthesia Gas. Minerva Anestesiol. 2004, 70, 255–260. [Google Scholar] [PubMed]
- Shi, Q.; Rammes, G.; Wang, P.; Xia, C.; Mou, F.; Zhu, J.; Guo, H.; Shao, S.; Wang, X. Effects of Xenon on the Developing Brain: Current Insights from Pre-Clinical and Clinical Studies. J. Integr. Neurosci. 2025, 24, 26388. [Google Scholar] [CrossRef] [PubMed]
- Zhang, M.; Cui, Y.; Cheng, Y.; Wang, Q.; Sun, H. The Neuroprotective Effect and Possible Therapeutic Application of Xenon in Neurological Diseases. J. Neurosci. Res. 2021, 99, 3274–3283. [Google Scholar] [CrossRef] [PubMed]
- Brandao, W.N.; Yin, Z.; Kleemann, K.; Zhang, X.; Rosenzweig, N.; Jain, N.; Jones, M.B.; Holtzman, D.M.; Ilin, I.; Weiner, H.L.; et al. Xenon Gas (Xe) Treatment to Restore Microglial Functions in Alzheimer’s Disease (AD). Alzheimers Dement. 2023, 19, e076467. [Google Scholar] [CrossRef]
- Brandao, W.; Jain, N.; Yin, Z.; Kleemann, K.L.; Carpenter, M.; Bao, X.; Serrano, J.R.; Tycksen, E.; Durao, A.; Barry, J.-L.; et al. Inhaled Xenon Modulates Microglia and Ameliorates Disease in Mouse Models of Amyloidosis and Tauopathy. Sci. Transl. Med. 2025, 17, eadk3690. [Google Scholar] [CrossRef] [PubMed]
- Baufreton, J.; Milekovic, T.; Li, Q.; McGuire, S.; Moraud, E.M.; Porras, G.; Sun, S.; Ko, W.K.D.; Chazalon, M.; Morin, S.; et al. Inhaling Xenon Ameliorates L-dopa-induced Dyskinesia in Experimental Parkinsonism. Mov. Disord. 2018, 33, 1632–1642. [Google Scholar] [CrossRef] [PubMed]
- Nie, S.-X.; Guo, H.; Huang, T.-Y.; Ao, Y.-F.; Wang, D.-X.; Wang, Q.-Q. Xenon Binding by a Tight yet Adaptive Chiral Soft Capsule. Nat. Commun. 2020, 11, 6257. [Google Scholar] [CrossRef] [PubMed]
- Cram, D.J.; Tanner, M.E.; Knobler, C.B. Host-Guest Complexation. 58. Guest Release and Capture by Hemicarcerands Introduces the Phenomenon of Constrictive Binding. J. Am. Chem. Soc. 1991, 113, 7717–7727. [Google Scholar] [CrossRef]
- Luhmer, M.; Goodson, B.M.; Song, Y.-Q.; Laws, D.D.; Kaiser, L.; Cyrier, M.C.; Pines, A. Study of Xenon Binding in Cryptophane-A Using Laser-Induced NMR Polarization Enhancement. J. Am. Chem. Soc. 1999, 121, 3502–3512. [Google Scholar] [CrossRef]
- Brotin, T.; Lesage, A.; Emsley, L.; Collet, A. 129Xe NMR Spectroscopy of Deuterium-Labeled Cryptophane-A Xenon Complexes: Investigation of Host−Guest Complexation Dynamics. J. Am. Chem. Soc. 2000, 122, 1171–1174. [Google Scholar] [CrossRef]
- Fogarty, H.A.; Berthault, P.; Brotin, T.; Huber, G.; Desvaux, H.; Dutasta, J.-P. A Cryptophane Core Optimized for Xenon Encapsulation. J. Am. Chem. Soc. 2007, 129, 10332–10333. [Google Scholar] [CrossRef] [PubMed]
- Huber, G.; Brotin, T.; Dubois, L.; Desvaux, H.; Dutasta, J.-P.; Berthault, P. Water Soluble Cryptophanes Showing Unprecedented Affinity for Xenon: Candidates as NMR-Based Biosensors. J. Am. Chem. Soc. 2006, 128, 6239–6246. [Google Scholar] [CrossRef] [PubMed]
- Chen, L.; Reiss, P.S.; Chong, S.Y.; Holden, D.; Jelfs, K.E.; Hasell, T.; Little, M.A.; Kewley, A.; Briggs, M.E.; Stephenson, A.; et al. Separation of Rare Gases and Chiral Molecules by Selective Binding in Porous Organic Cages. Nat. Mater. 2014, 13, 954–960. [Google Scholar] [CrossRef] [PubMed]
- Banerjee, D.; Simon, C.M.; Elsaidi, S.K.; Haranczyk, M.; Thallapally, P.K. Xenon Gas Separation and Storage Using Metal-Organic Frameworks. Chem 2018, 4, 466–494. [Google Scholar] [CrossRef]
- Ryan, P.; Farha, O.K.; Broadbelt, L.J.; Snurr, R.Q. Computational Screening of Metal-Organic Frameworks for Xenon/Krypton Separation. AIChE J. 2011, 57, 1759–1766. [Google Scholar] [CrossRef]
- Spiridon, I.; Anghel, N. Cyclodextrins as Multifunctional Platforms in Drug Delivery and Beyond: Structural Features, Functional Applications, and Future Trends. Molecules 2025, 30, 3044. [Google Scholar] [CrossRef] [PubMed]
- Crini, G.; Lacalamita, D.; Liu, C.; Fourmentin, M.; Kfoury, M.; Mongioví, C.; Fourmentin, S.; Morin-Crini, N. Cyclodextrin-Based Polymer Materials and Their Applications - A Review Covering a 20-Year Period. Prog. Polym. Sci. 2026, 179, 102149. [Google Scholar] [CrossRef]
- Sevim, S.; Sanlier, N. Cyclodextrin as a Singular Oligosaccharide: Recent Advances of Health Benefit and in Food Applications. J. Food Sci. 2024, 89, 8215–8230. [Google Scholar] [CrossRef] [PubMed]
- Ho, B.T.; Joyce, D.C.; Bhandari, B.R. Encapsulation of Ethylene Gas into α-Cyclodextrin and Characterisation of the Inclusion Complexes. Food Chem. 2011, 127, 572–580. [Google Scholar] [CrossRef] [PubMed]
- Ho, B.T.; Joyce, D.C.; Bhandari, B.R. Release Kinetics of Ethylene Gas from Ethylene–α-Cyclodextrin Inclusion Complexes. Food Chem. 2011, 129, 259–266. [Google Scholar] [CrossRef] [PubMed]
- Ho, T.M.; Bhandari, B.R. Encapsulation of Gases. In Functionality of Cyclodextrins in Encapsulation for Food Applications; Ho, T.M., Yoshii, H., Terao, K., Bhandari, B.R., Eds.; Springer International Publishing: Cham, 2021; pp. 29–51. ISBN 978-3-030-80055-0. [Google Scholar]
- Neoh, T.L.; Yamauchi, K.; Yoshii, H.; Furuta, T. Kinetics of Molecular Encapsulation of 1-Methylcyclopropene into α-Cyclodextrin. J. Agric. Food Chem. 2007, 55, 11020–11026. [Google Scholar] [CrossRef] [PubMed]
- Pereva, S.; Himitliiska, T.; Spassov, T.; Stoyanov, S.D.; Arnaudov, L.N.; Dudev, T. Cyclodextrin-Based Solid–Gas Clathrates. J. Agric. Food Chem. 2015, 63, 6603–6613. [Google Scholar] [CrossRef] [PubMed]
- Saenger, W.; Noltemeyer, M. X-Ray Structure Analysis of the α-Cyclodextrin-Krypton Inclusion Complex: A Noble Gas in an Organic Matrix. Angew. Chem. Int. Ed. Engl. 1974, 13, 552–553. [Google Scholar] [CrossRef]
- Raffaini, G.; Ganazzoli, F.; Malpezzi, L.; Fuganti, C.; Fronza, G.; Panzeri, W.; Mele, A. Validating a Strategy for Molecular Dynamics Simulations of Cyclodextrin Inclusion Complexes through Single-Crystal X-ray and NMR Experimental Data: A Case Study. J. Phys. Chem. B 2009, 113, 9110–9122. [Google Scholar] [CrossRef] [PubMed]
- Mele, A.; Ganazzoli, F.; Raffaini, G.; Juza, M.; Schurig, V. Macrocycle conformation and self-inclusion phenomena in octakis(3-O-butanoyl-2,6-di-O-n-pentyl)-γ-cyclodextrin (Lipodex E) by NMR spectroscopy and molecular dynamics. Carbohydr. Res. 2003, 338, 625–635. [Google Scholar] [CrossRef] [PubMed]
- Raffaini, G.; Ganazzoli, F. Molecular dynamics study of host–guest interactions in cyclodextrins: methodology and data analysis for a comparison with solution data and the solid-state structure. J. Incl. Phenom. Macrocycl. Chem. 2007, 57, 683–688. [Google Scholar] [CrossRef]
- Di Donato, C.; Lavorgna, C.M.; Fattorusso, R.; Isernia, C.; Isidori, M.; Malgieri, G.; Piscitelli, C.; Russo, C.; Russo, L.; Iacovino, R. Molecules 2016, 21, 1644. [PubMed]
- Raffaini, G.; Ganazzoli, F. A Molecular Dynamics Study of a Photodynamic Sensitizer for Cancer Cells: Inclusion Complexes of γ-Cyclodextrins with C70. Int. J. Mol. Sci. 2019, 20, 4831. [Google Scholar] [CrossRef] [PubMed]
- Raffaini, G.; Ganazzoli, F. Understanding Surface Interaction and Inclusion Complexes between Piroxicam and Native or Crosslinked β-Cyclodextrins: The Role of Drug Concentration. Molecules 2020, 25, 2848. [Google Scholar] [CrossRef] [PubMed]
- Bartik, K.; Luhmer, M.; Heyes, S.J.; Ottinger, R.; Reisse, J. ROBING MOLECULAR CAVITIES IN ALPHA-CYCLODEXTRIN SOLUTIONS BY XENON NMR. J. Magn. Reson. Ser. B 1995, 109, 164–168. [Google Scholar] [CrossRef]
- Song, Y.Q.; Goodson, B.M.; Taylor, R.E.; Laws, D.D.; Navon, G.; Pines, A. Selective enhancement of NMR signals for alpha-cyclodextrin with laser-polarized xenon. Angew. Chem. Int. Ed. Engl. 1997, 36, 2368–2370. [Google Scholar] [CrossRef]
- Raffaini, G.; Elli, S.; Ganazzoli, F.; Catauro, M. Inclusion Complexes Between β-cyclodextrin and the Anticancer Drug 5-Fluorouracil for its Solubilization: a Molecular Dynamics Study at Different Stoichiometries. Macromol. Symp. 2022, 404, 2100305. [Google Scholar] [CrossRef]
- Raffaini, G.; Elli, S.; Catauro, M.; D'Angelo, A. Different Drug Mobilities in Hydrophobic Cavities of Host–Guest Complexes between β-Cyclodextrin and 5-Fluorouracil at Different Stoichiometries: A Molecular Dynamics Study in Water. Int. J. Mol. Sci. 2024, 25, 5888. [Google Scholar] [CrossRef] [PubMed]
- Giordano, F.; Novak, C.; Moyano, J.R. Thermal Analysis of Cyclodextrins and Their Inclusion Compounds. Thermochim. Acta 2001, 380, 123–151. [Google Scholar] [CrossRef]
- Jessen, C.H.; Bendix, J.; Nannestad, T.B.; Bordallo, H.N.; Pedersen, M.J.; Pedersen, C.M.; Bols, M. Methane Capture with α-Cyclodextrins. New J. Chem. 2023, 47, 14624–14629. [Google Scholar] [CrossRef]
- Trotta, F.; Zanetti, M.; Camino, G. Thermal Degradation of Cyclodextrins. Polym. Degrad. Stab. 2000, 69, 373–379. [Google Scholar] [CrossRef]
- Ho, T.M.; Howes, T.; Bhandari, B.R. Encapsulation of CO2 into Amorphous and Crystalline α-Cyclodextrin Powders and the Characterization of the Complexes Formed. Food Chem. 2015, 187, 407–415. [Google Scholar] [CrossRef] [PubMed]
- Zhang, W.; Ma, Z.; Zhang, M.; Yu, Z.; Wu, L.; Tang, Y.; Zhao, L.; Ma, G.; Lei, Z. Design and Synthesis of α-Cyclodextrin/Carboxymethyl Chitosan-Based Hydrogel for Multipollutant Adsorption. Carbohydr. Polym. 2026, 373, 124611. [Google Scholar] [CrossRef] [PubMed]
- Roy, P.; Mondal, M.; Hossain, A.; Roy, D.; Mallick, K.; Debnath, S.; Haydar, M.S.; Dey, S.; Sarkar, S.; Choudhury, S.; et al. Investigation of the Host–Guest Inclusion Complex of 4-Aminopyridine with α-Cyclodextrin: A Physicochemical and Computational Study for Biochemical Applications. J. Mol. Struct. 2025, 1343, 142799. [Google Scholar] [CrossRef]
- Roy, N.; Ghosh, B.; Roy, D.; Bhaumik, B.; Roy, M.N. Exploring the Inclusion Complex of a Drug (Umbelliferone) with α-Cyclodextrin Optimized by Molecular Docking and Increasing Bioavailability with Minimizing the Doses in Human Body. ACS Omega 2020, 5, 30243–30251. [Google Scholar] [CrossRef] [PubMed]
- Balan, V.; Mihai, C.-T.; Cojocaru, F.-D.; Uritu, C.-M.; Dodi, G.; Botezat, D.; Gardikiotis, I. Vibrational Spectroscopy Fingerprinting in Medicine: From Molecular to Clinical Practice. Materials 2019, 12, 2884. [Google Scholar] [CrossRef] [PubMed]
- Pereva, S.; Nikolova, V.; Angelova, S.; Spassov, T.; Dudev, T. Water inside β-Cyclodextrin Cavity: Amount, Stability and Mechanism of Binding. Beilstein J. Org. Chem. 2019, 15, 1592–1600. [Google Scholar] [CrossRef] [PubMed]
- Lee, J.; Lee, S.-S.; Lee, S.; Oh, H.B. Noncovalent Complexes of Cyclodextrin with Small Organic Molecules: Applications and Insights into Host–Guest Interactions in the Gas Phase and Condensed Phase. Molecules 2020, 25, 4048. [Google Scholar] [CrossRef] [PubMed]
- Prokhorov, D.A.; Kutyshenko, V.P.; Tarahovsky, Y.S.; Kukushkin, N.I.; Khrenov, M.O.; Kovtun, A.L.; Zakharova, N.M. Solid Xenon Carrier Based on α-Cyclodextrin: Properties, Preparation, and Application. J. Pharm. Sci. 2023, 112, 344–349. [Google Scholar] [CrossRef] [PubMed]
- Materials Studio BIOVIA. Accelrys Inc. InsightII 2000. Accelrys Inc.: San Diego, CA, USA, 2000.
- Berman, H.M.; Westbrook, J.; Feng, Z.; Gilliland, G.; Bhat, T.N.; Weissig, H.; Shindyalov, I.N.; Bourne, P.E. The Protein Data Bank. Nucleic Acids Res. 2000, 28, 235–242. [Google Scholar] [CrossRef] [PubMed]
- Sase, S.; Yamamoto, H.; Kawashima, E.; Tan, X.; Sawa, Y. Discrimination Between Patients With Alzheimer Disease and Healthy Subjects Using Layer Analysis of Cerebral Blood Flow and Xenon Solubility Coefficient in Xenon-Enhanced Computed Tomography. J. Comput. Assist. Tomogr. 2017, 41, 477–483. [Google Scholar] [CrossRef] [PubMed]
- Hane, F.T.; Li, T.; Plata, J.-A.; Hassan, A.; Granberg, K.; Albert, M.S. Inhaled Xenon Washout as a Biomarker of Alzheimer's Disease. Diagnostics 2018, 8, 41. [Google Scholar] [CrossRef] [PubMed]
- Sase, S.; Yamamoto, H.; Kawashima, E.; Tan, X.; Sawa, Y. Discrimination between patients with mild Alzheimer's disease and healthy subjects based on cerebral blood flow images of the lateral views in xenon-enhanced computed tomography. J. Comput. Assist. Tomogr. 2018, 18, 3–12. [Google Scholar] [CrossRef] [PubMed]
- Exploratory Clinical Study to Assess Safety and Efficiency of Xenon Gas Inhalation to Control Neuroinflammation. Clinical Trials.gov ID NCT06945614. Sponsor General Biophysics LLC. Information provided by General Biophysics LLC (Responsible Party). Last Update Posted 2025-04-25.
Figure 1.
Side view and top view, in stick (left) and CPK (right) representations, respectively, of the initial optimized geometries studied for the interaction between one, two, and three Xe atoms and α-CD in panels (a), b), and (c), respectively. Color codes: C atoms are grey, O atoms are red, Xe atoms are petrol blue, and H atoms are white.
Figure 1.
Side view and top view, in stick (left) and CPK (right) representations, respectively, of the initial optimized geometries studied for the interaction between one, two, and three Xe atoms and α-CD in panels (a), b), and (c), respectively. Color codes: C atoms are grey, O atoms are red, Xe atoms are petrol blue, and H atoms are white.
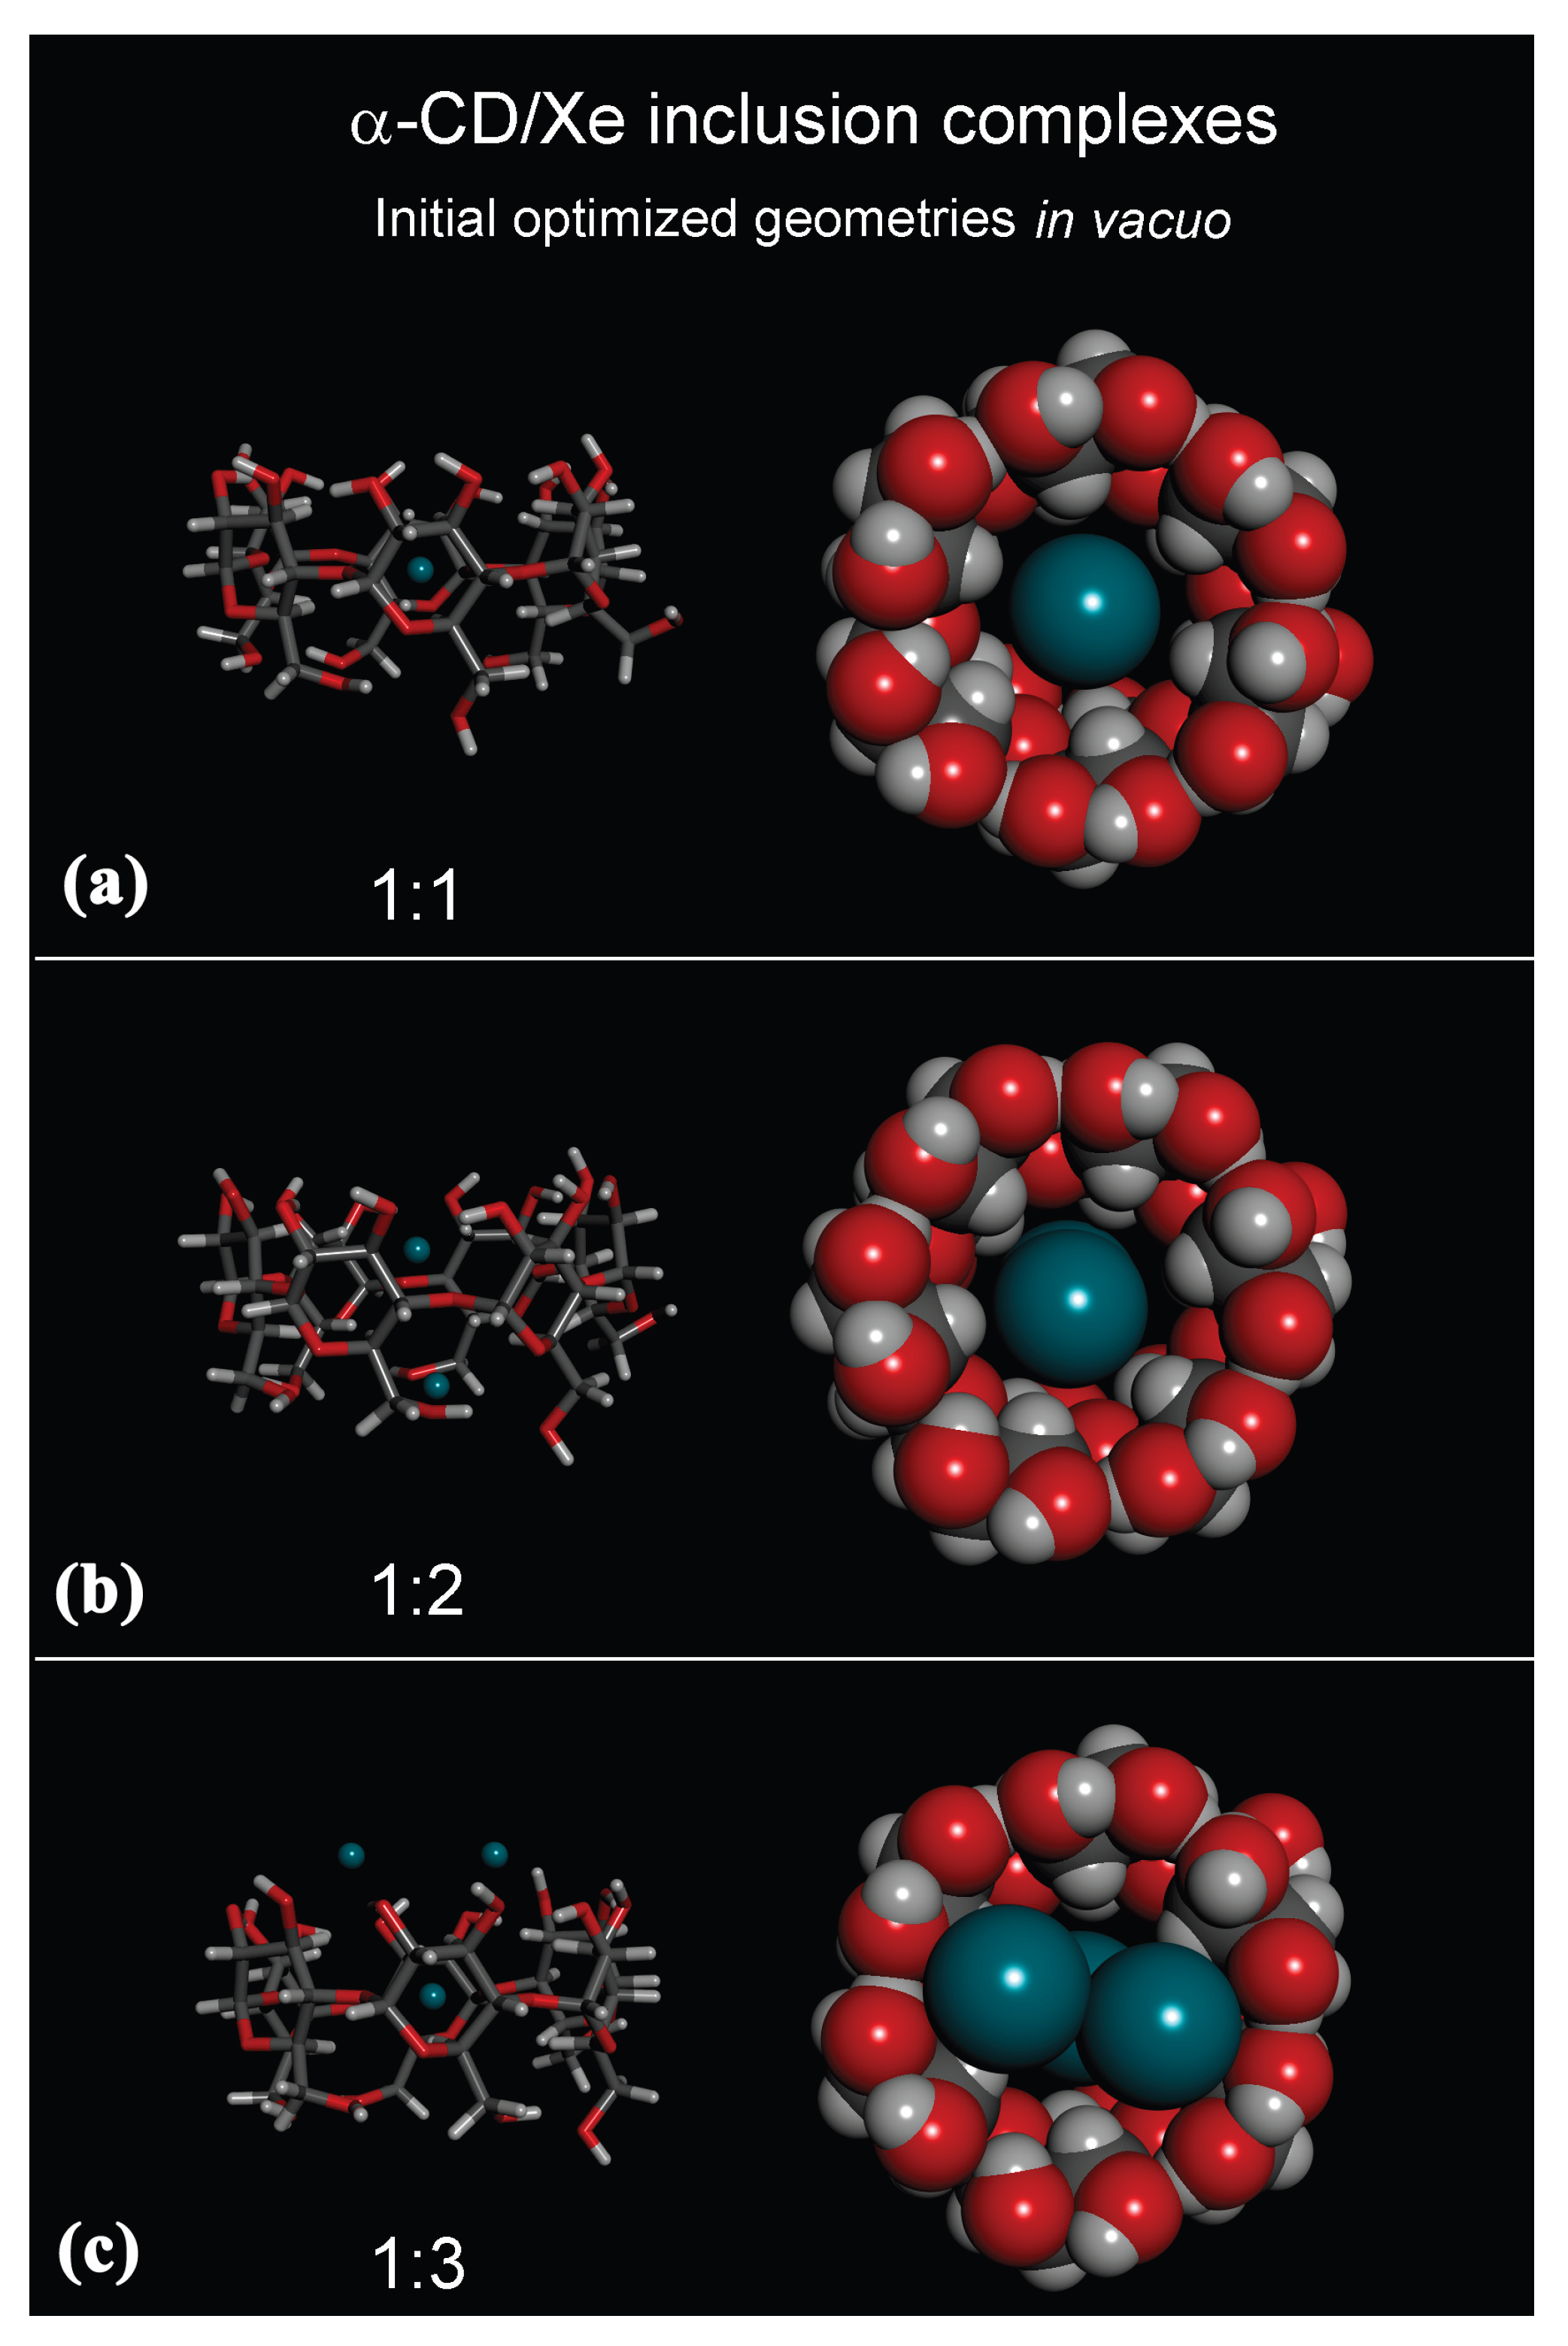
Figure 2.
Side and top views, in stick (left) and CPK (right) representations, respectively, of the initial optimized geometries studied for the interaction between ten and thirty Xe atoms and α-CD in panels (a) and (b), respectively. Color codes: C atoms are grey, O atoms are red, Xe atoms encapsulated within α-CD are green, Xe atoms near the α-CD secondary rim are dark green, Xe atoms near the α-CD primary rim and the external surface are petrol blue, and H atoms are white.
Figure 2.
Side and top views, in stick (left) and CPK (right) representations, respectively, of the initial optimized geometries studied for the interaction between ten and thirty Xe atoms and α-CD in panels (a) and (b), respectively. Color codes: C atoms are grey, O atoms are red, Xe atoms encapsulated within α-CD are green, Xe atoms near the α-CD secondary rim are dark green, Xe atoms near the α-CD primary rim and the external surface are petrol blue, and H atoms are white.
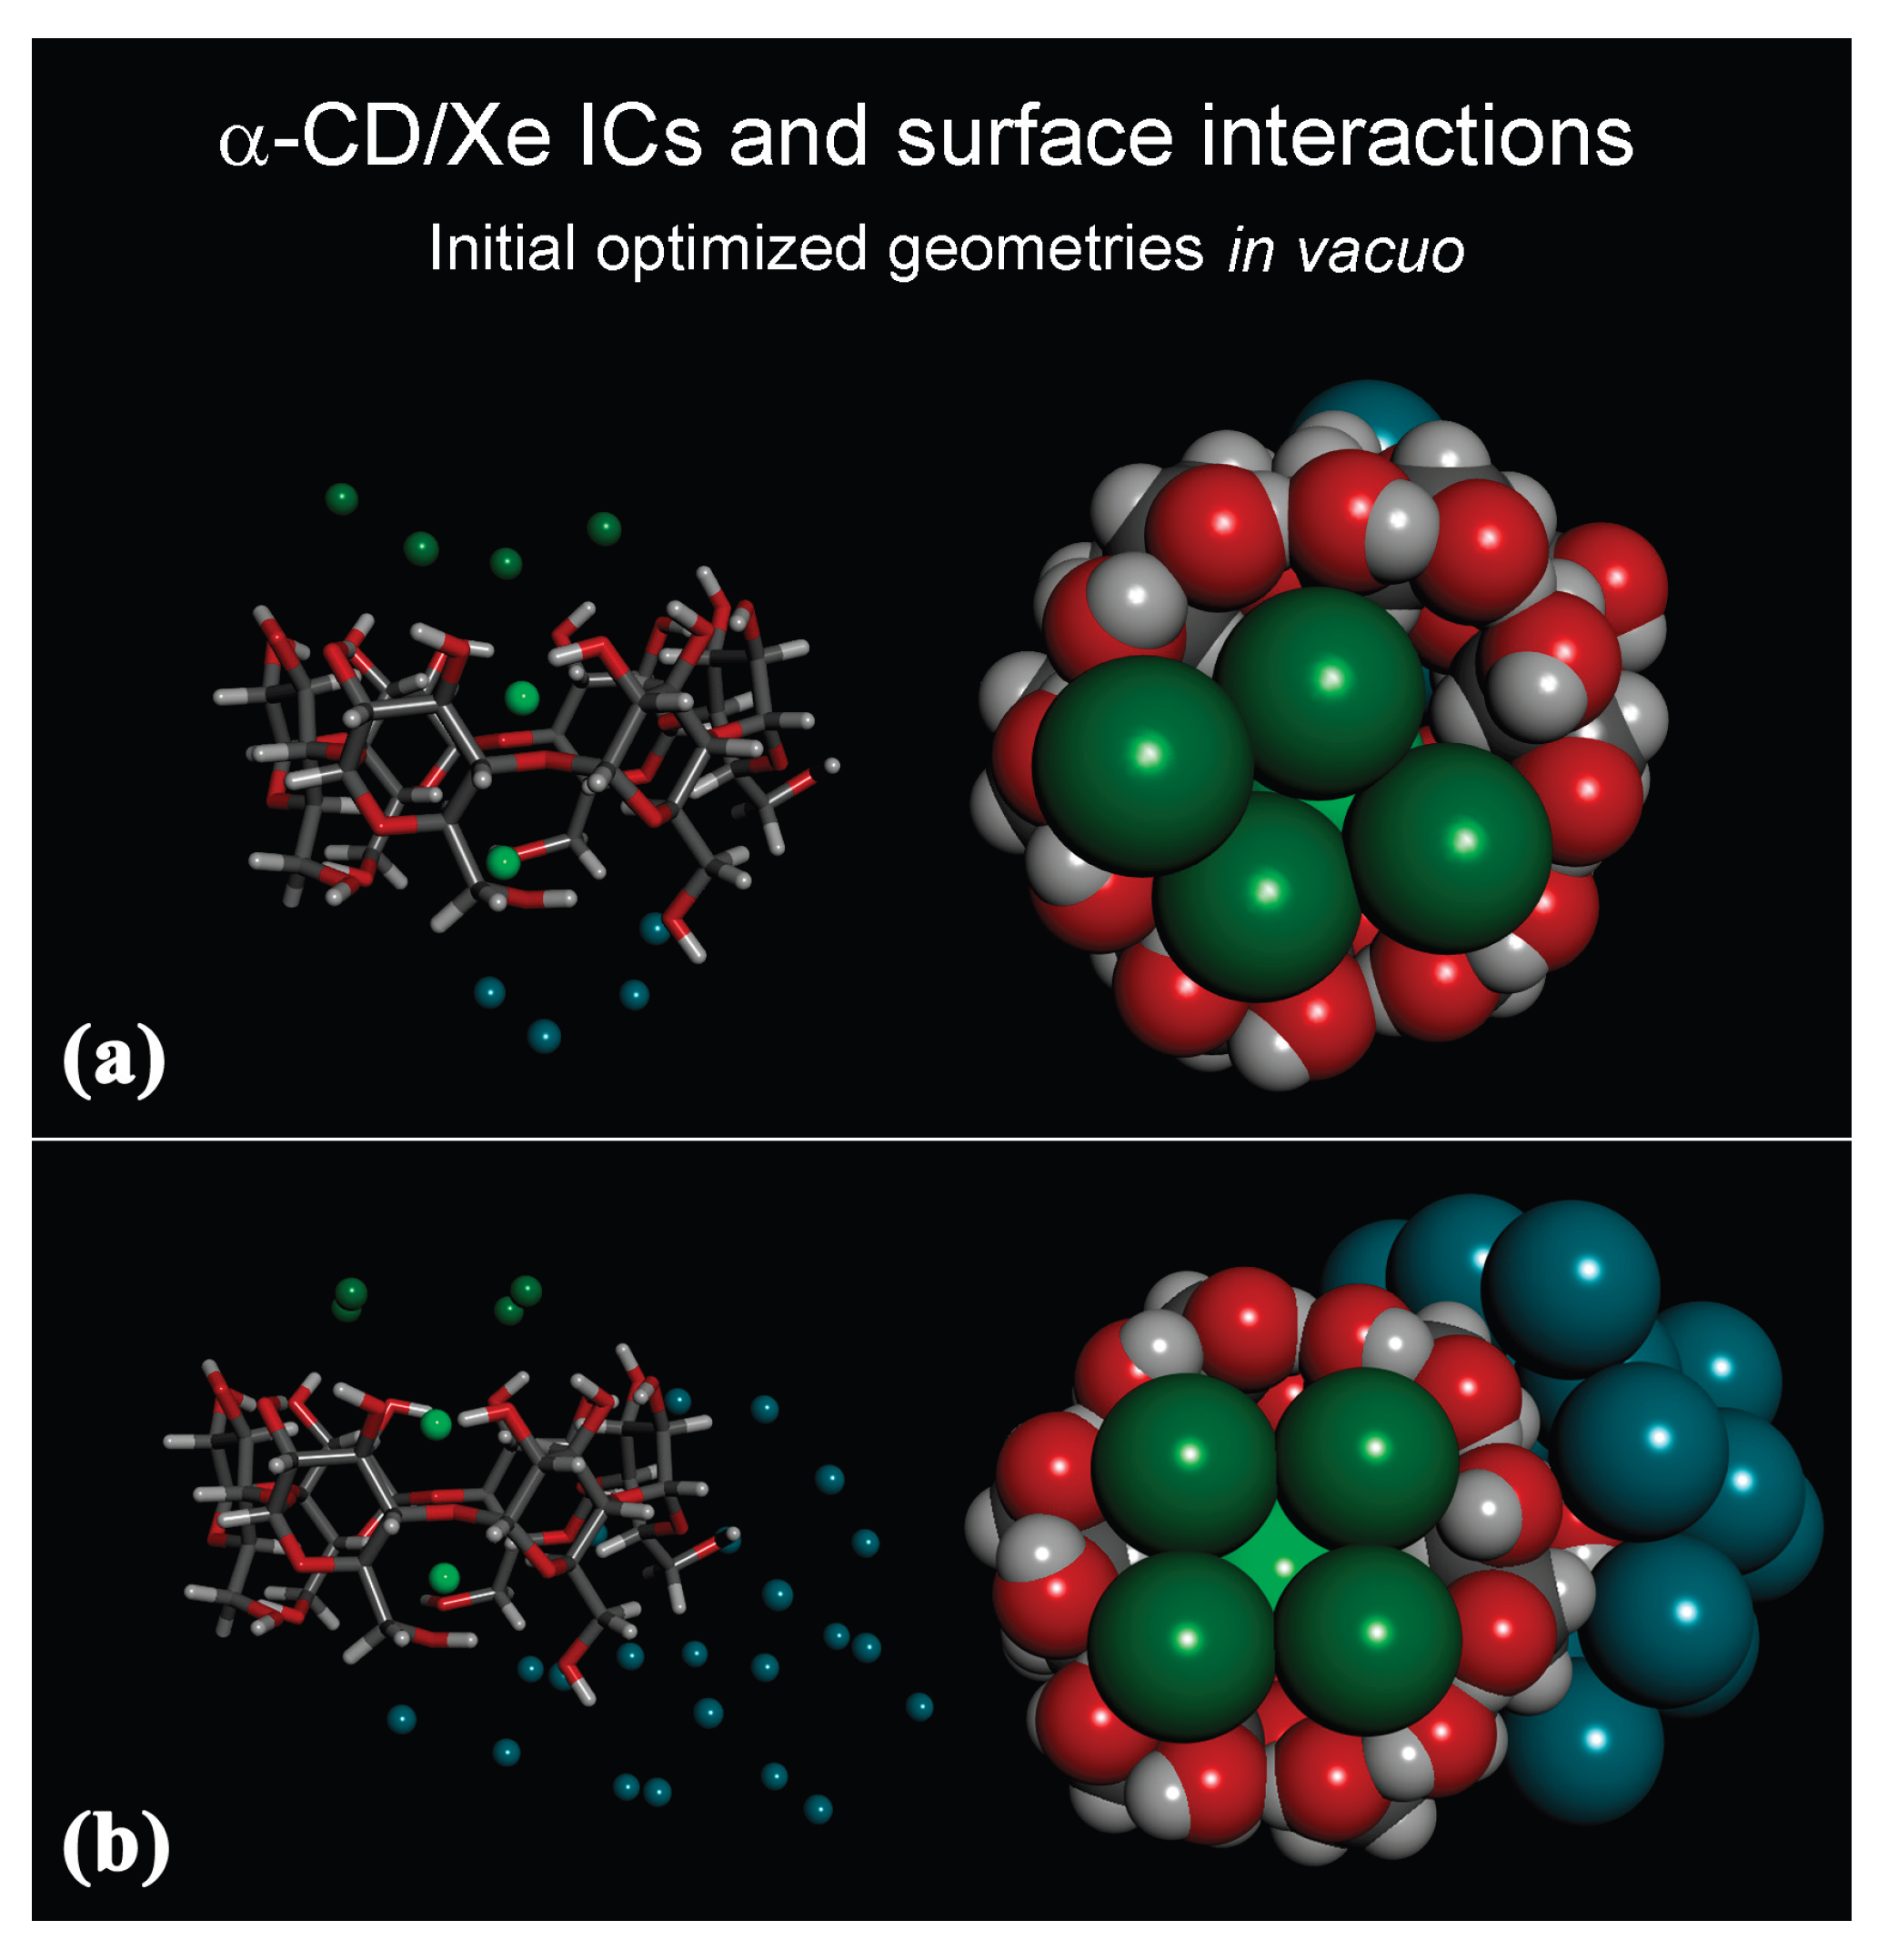
Figure 3.
Interaction energy (filled symbols) of the optimized initial geometries reported in Figure 1 and Figure 2, plotted as a function of the number of Xe atoms in the simulation cell. The solid line in blue is the best-fit line through the origin, with a slope equal to (-10.19934 ± 0.60315) and correlation coefficients equal to R = 0.9862 and 0.8319.
Figure 3.
Interaction energy (filled symbols) of the optimized initial geometries reported in Figure 1 and Figure 2, plotted as a function of the number of Xe atoms in the simulation cell. The solid line in blue is the best-fit line through the origin, with a slope equal to (-10.19934 ± 0.60315) and correlation coefficients equal to R = 0.9862 and 0.8319.
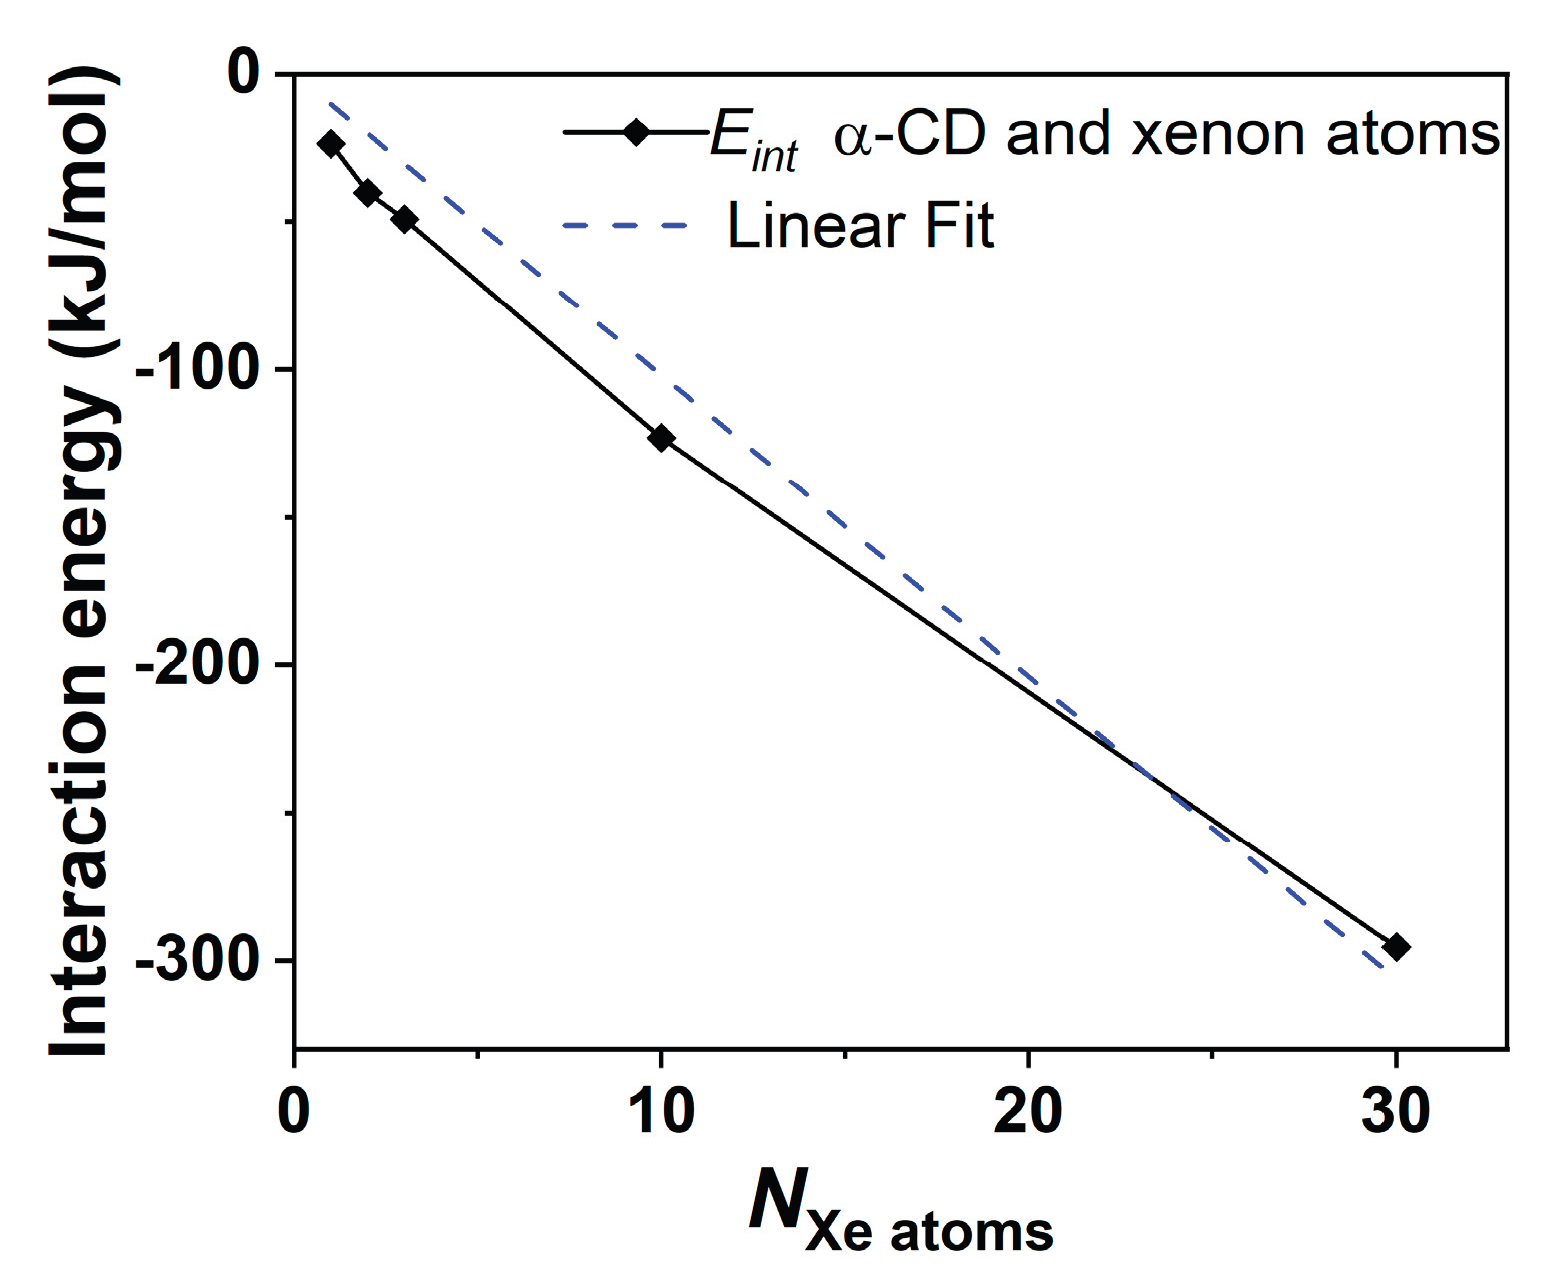
Figure 4.
Panels (a) and (b) show the side view and top view, in stick and CPK representations, respectively, of the final optimized geometries after an MD run lasting for 5 ns, considering the interaction between ten Xe atoms and α-CD. Color codes are the same as those in Figure 1.
Figure 4.
Panels (a) and (b) show the side view and top view, in stick and CPK representations, respectively, of the final optimized geometries after an MD run lasting for 5 ns, considering the interaction between ten Xe atoms and α-CD. Color codes are the same as those in Figure 1.
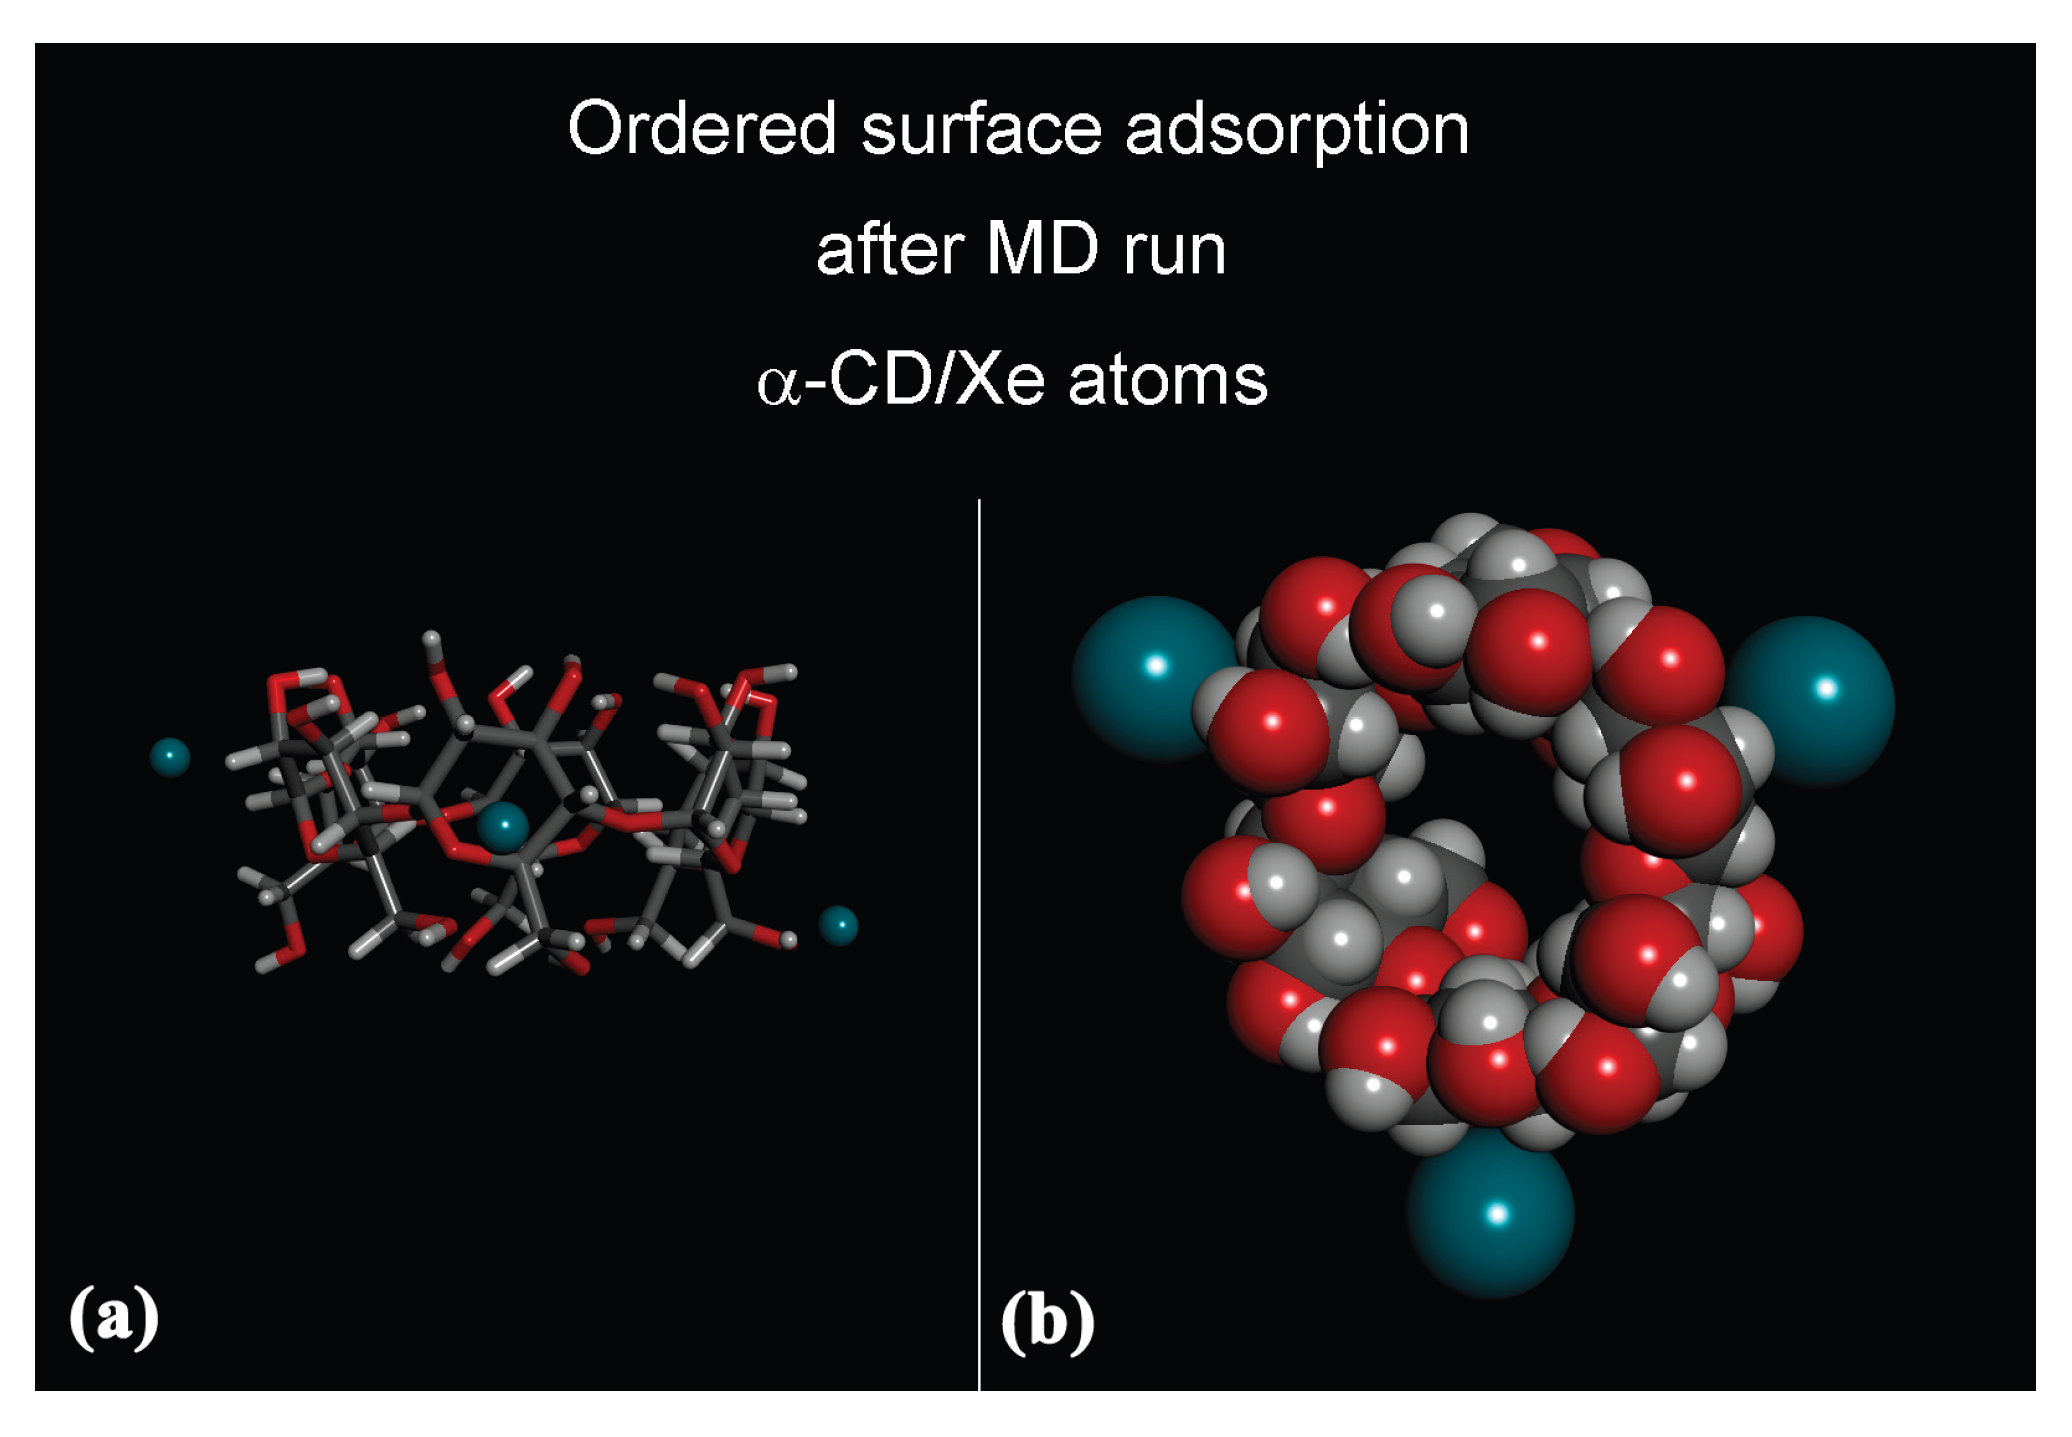
Figure 5.
Panels (a,c): Plots showing the distance of Xe atom(s) from theα-CD c.o.m. as a function of time, calculated during MD runs in water considering α-CD/Xe atoms at 1:1 and 1:2 ratios, respectively. Panels (b,d): Plots showing the RDFs of the oxygen atoms of water molecules as a function of their distance from the α-CD c.o.m., calculated from MD runs in which ICs with 1:1 and 1:2 stoichiometries were formed, respectively. Panels (e,f): Plots showing the RDFs of Xe atoms as a function of their distance calculated during MD runs considering the ratios 1:2, 1:3 and 1:10, 1:30, respectively.
Figure 5.
Panels (a,c): Plots showing the distance of Xe atom(s) from theα-CD c.o.m. as a function of time, calculated during MD runs in water considering α-CD/Xe atoms at 1:1 and 1:2 ratios, respectively. Panels (b,d): Plots showing the RDFs of the oxygen atoms of water molecules as a function of their distance from the α-CD c.o.m., calculated from MD runs in which ICs with 1:1 and 1:2 stoichiometries were formed, respectively. Panels (e,f): Plots showing the RDFs of Xe atoms as a function of their distance calculated during MD runs considering the ratios 1:2, 1:3 and 1:10, 1:30, respectively.
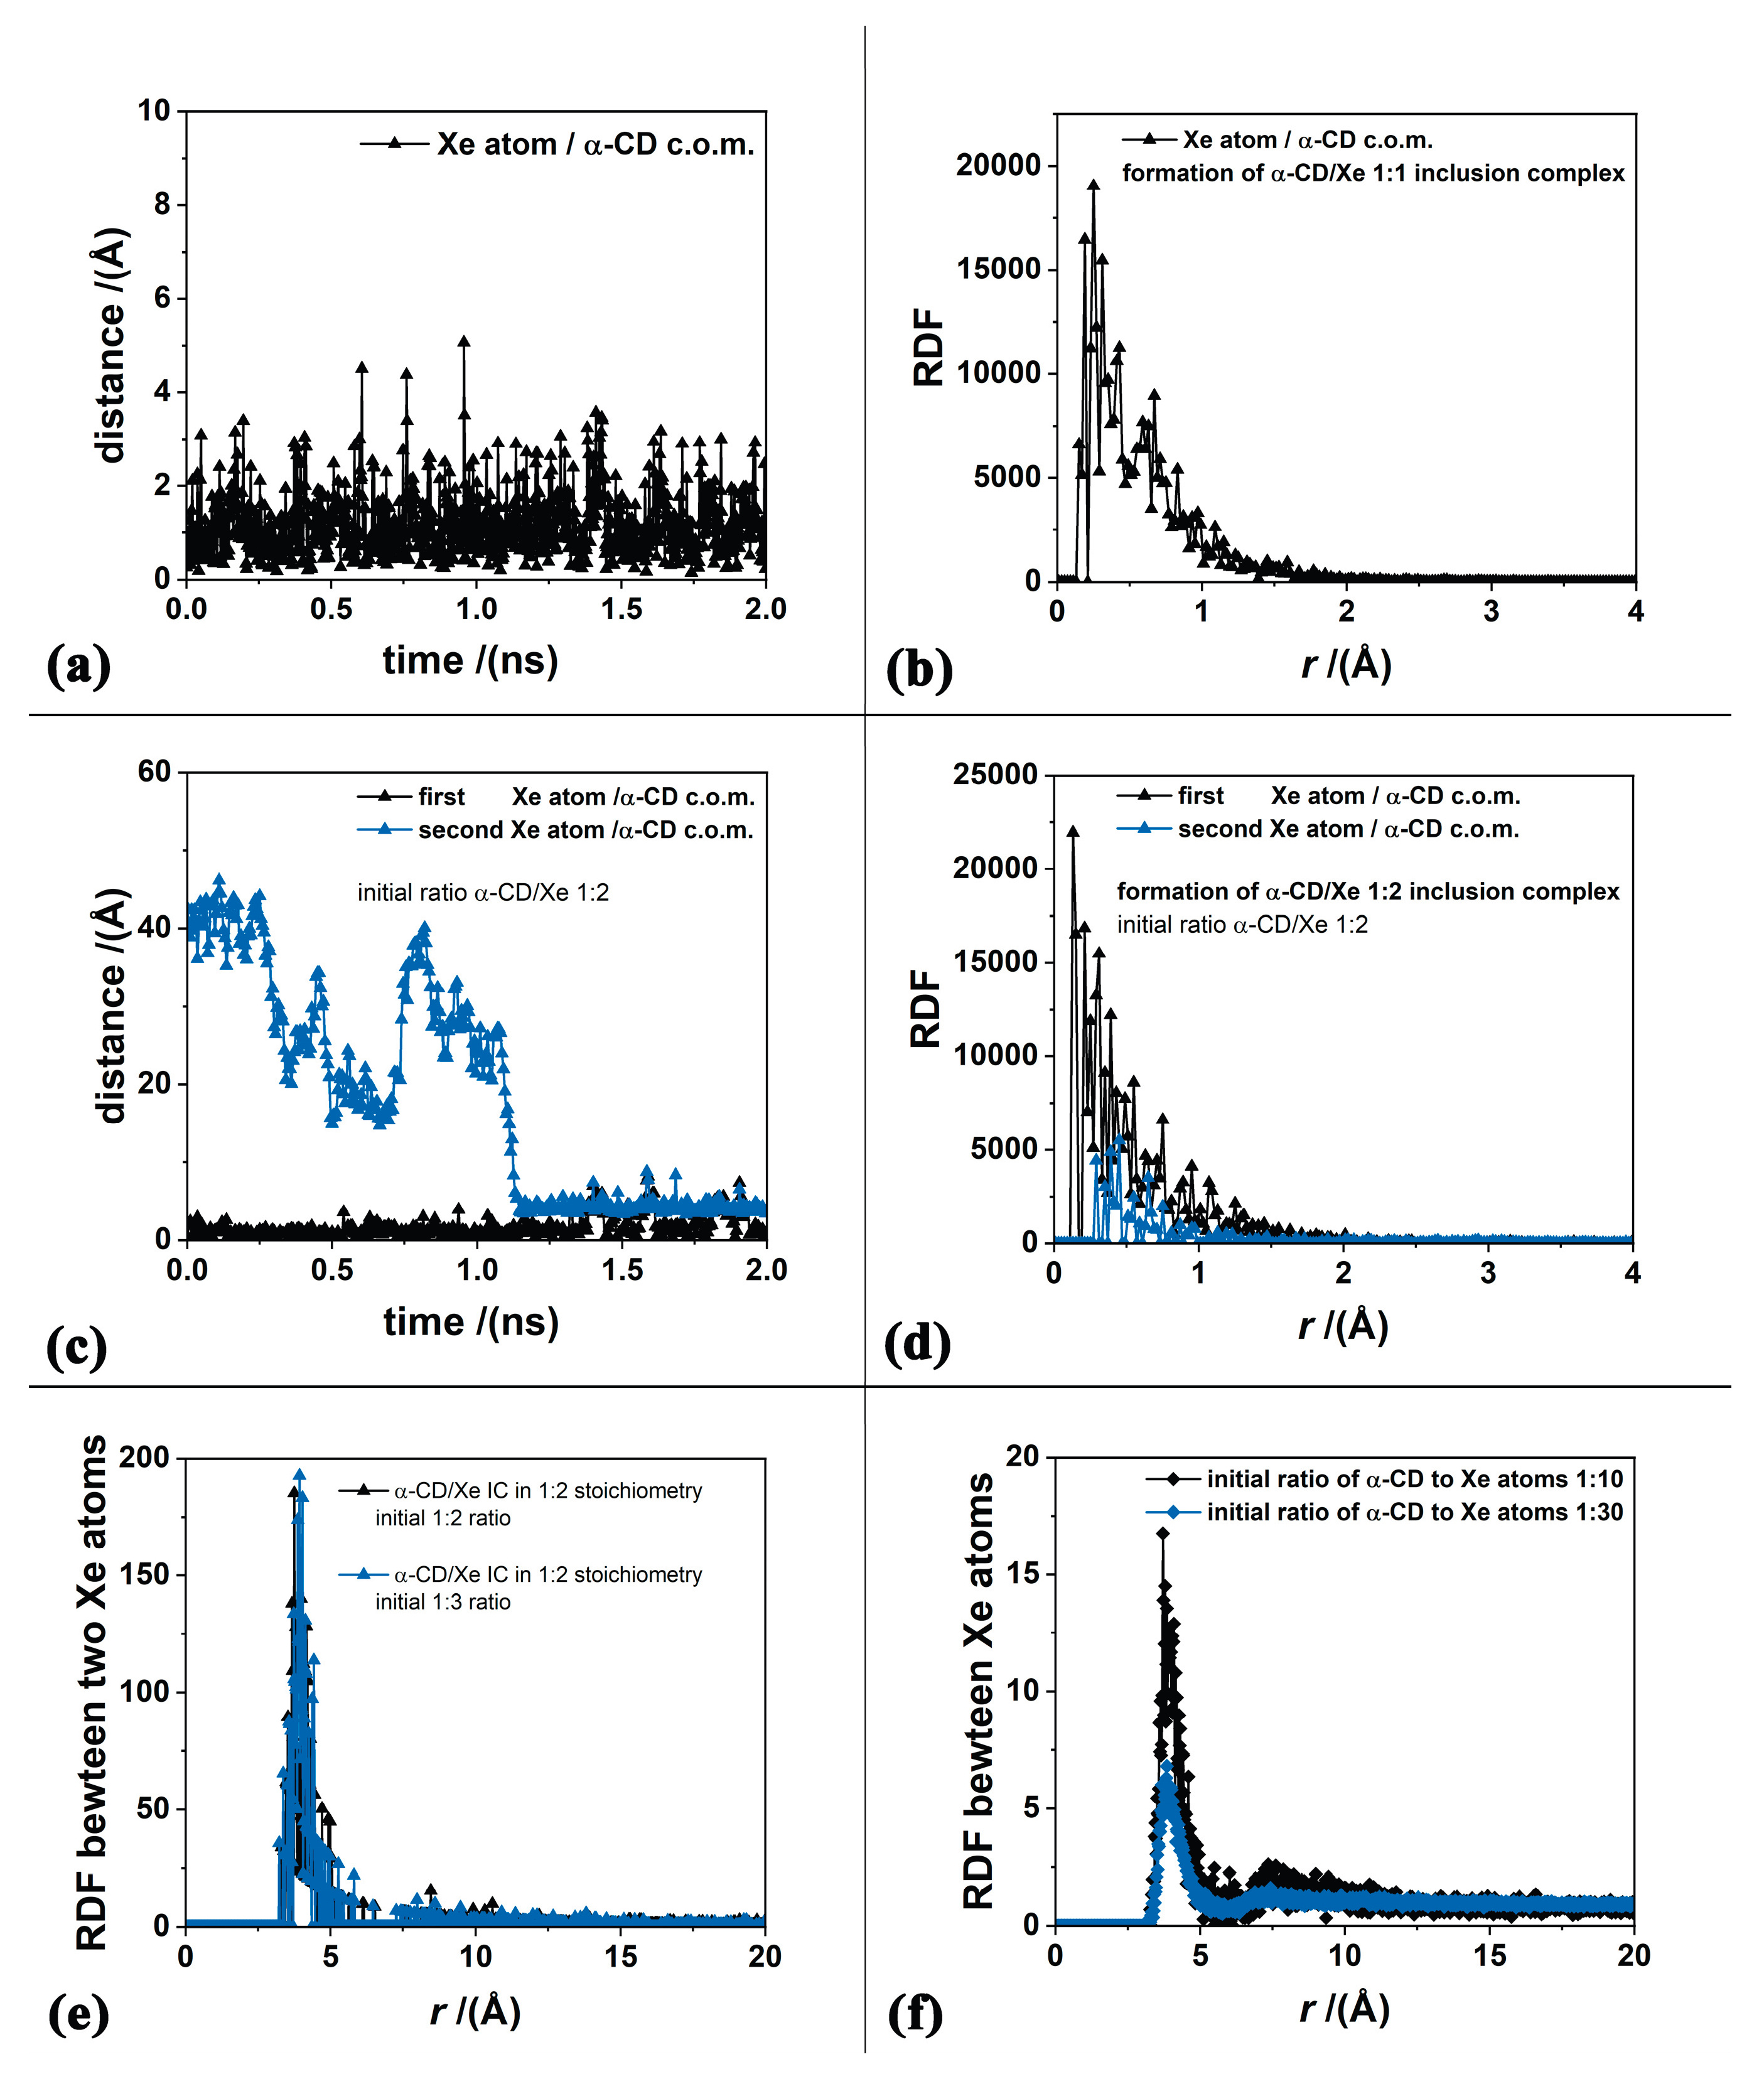
Figure 6.
Panels (a,b): Plots showing the RDFs of the oxygen atoms of water molecules as a function of distance, r (in Å), from the c.o.m. of the α-CD, calculated during the MD runs performed in water for α-CD: Xe atom ratios of 1:1, 1:2, 1:3 and 1:10, 1:30, respectively.
Figure 6.
Panels (a,b): Plots showing the RDFs of the oxygen atoms of water molecules as a function of distance, r (in Å), from the c.o.m. of the α-CD, calculated during the MD runs performed in water for α-CD: Xe atom ratios of 1:1, 1:2, 1:3 and 1:10, 1:30, respectively.
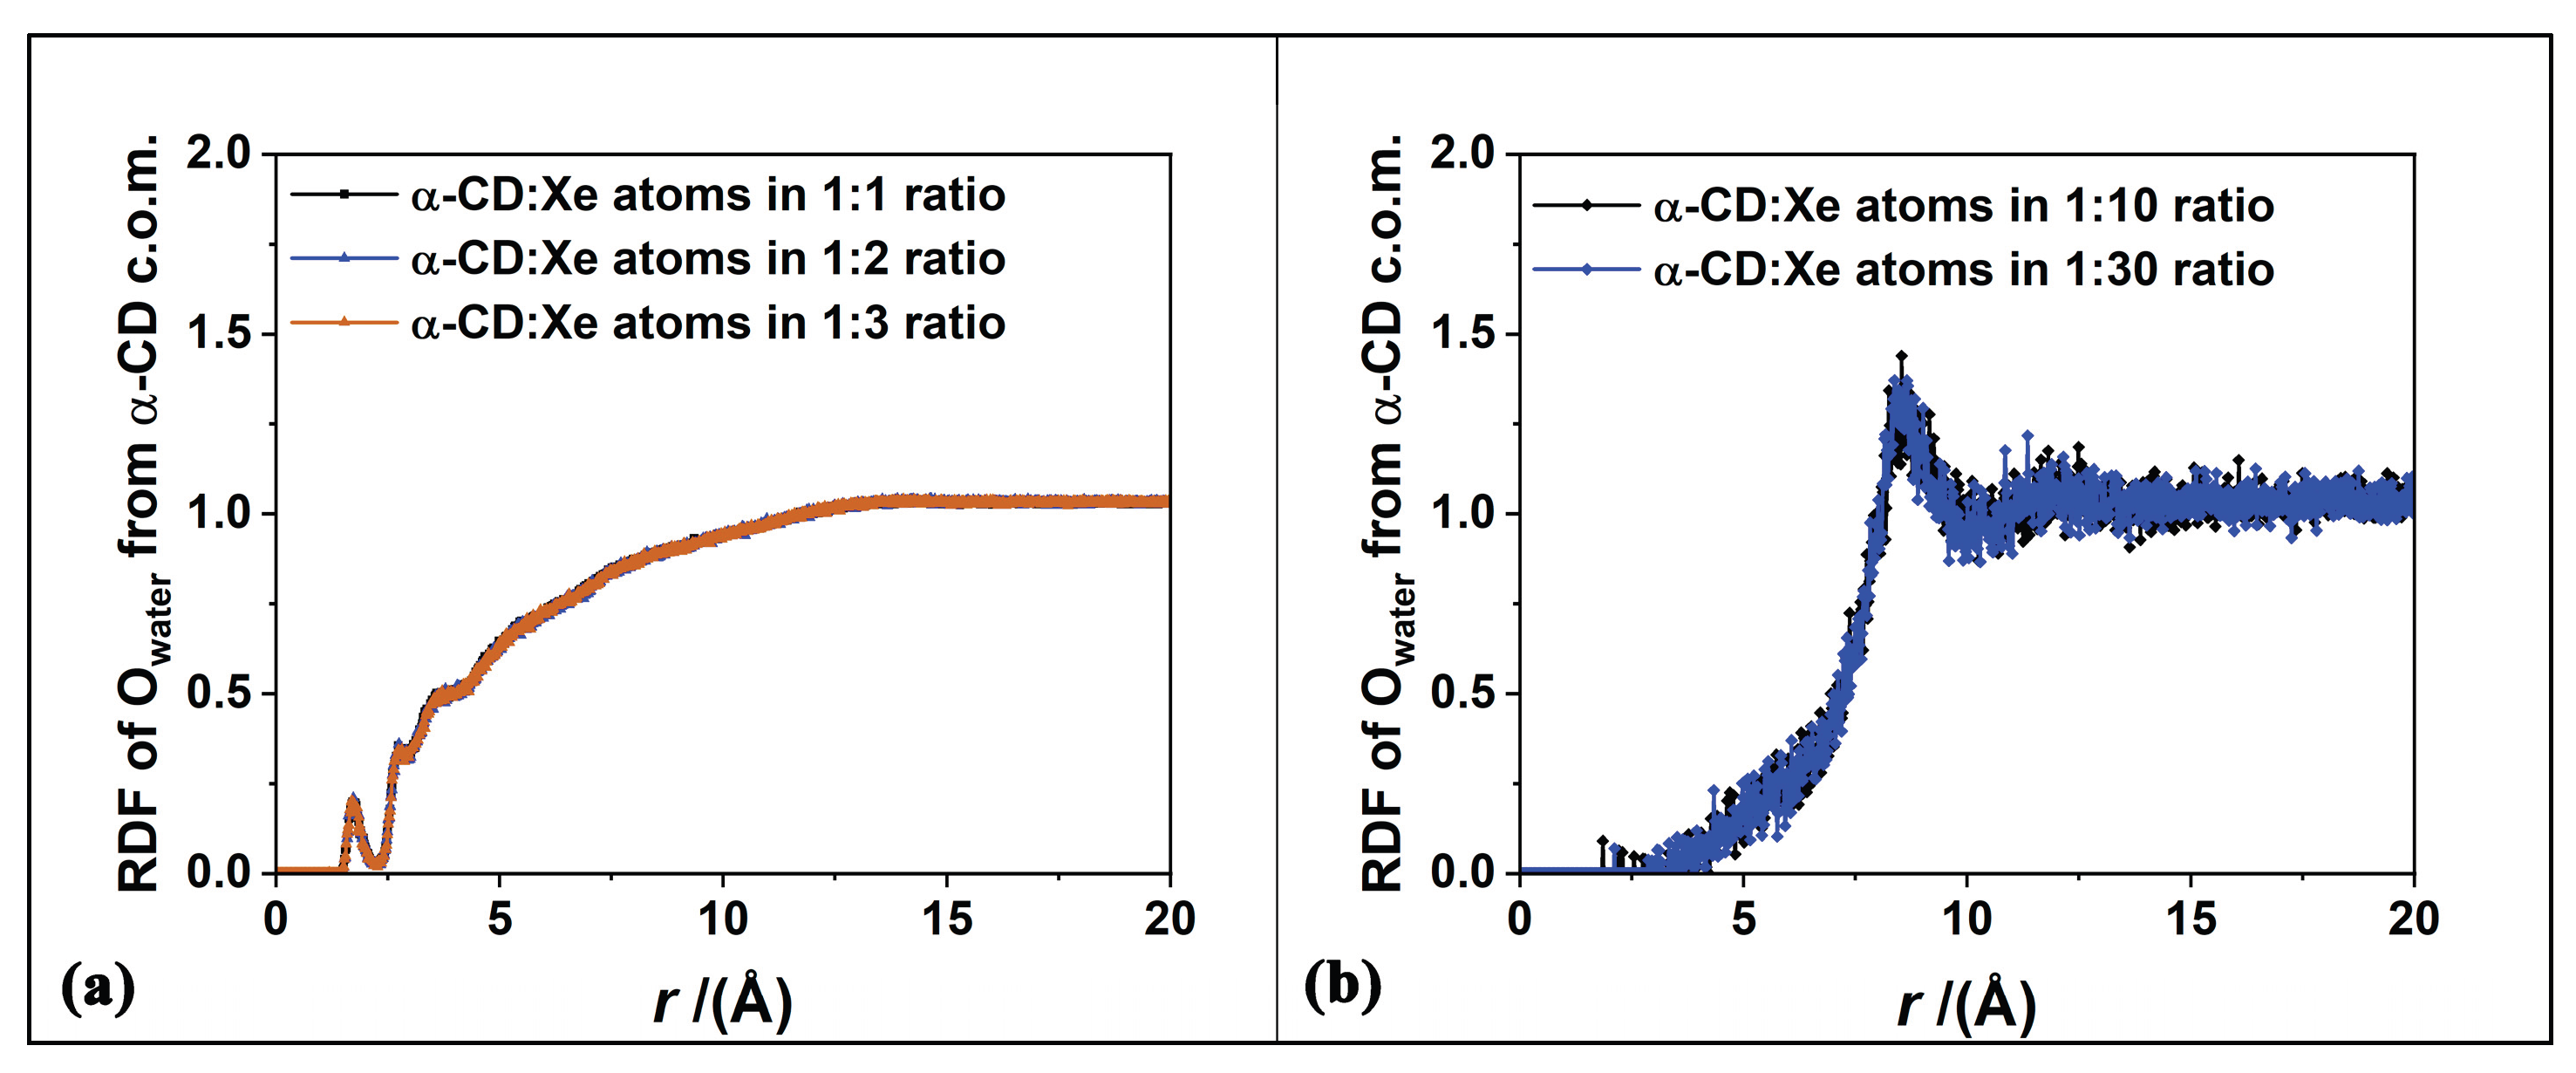
Figure 7.
Panel (a) shows TGA curves of α-CD and α-CD/Xe obtained at 30 and 60 min. Panel (b) shows DTG curves of α-CD and α-CD/Xe obtained at 30 and 60 min.
Figure 7.
Panel (a) shows TGA curves of α-CD and α-CD/Xe obtained at 30 and 60 min. Panel (b) shows DTG curves of α-CD and α-CD/Xe obtained at 30 and 60 min.
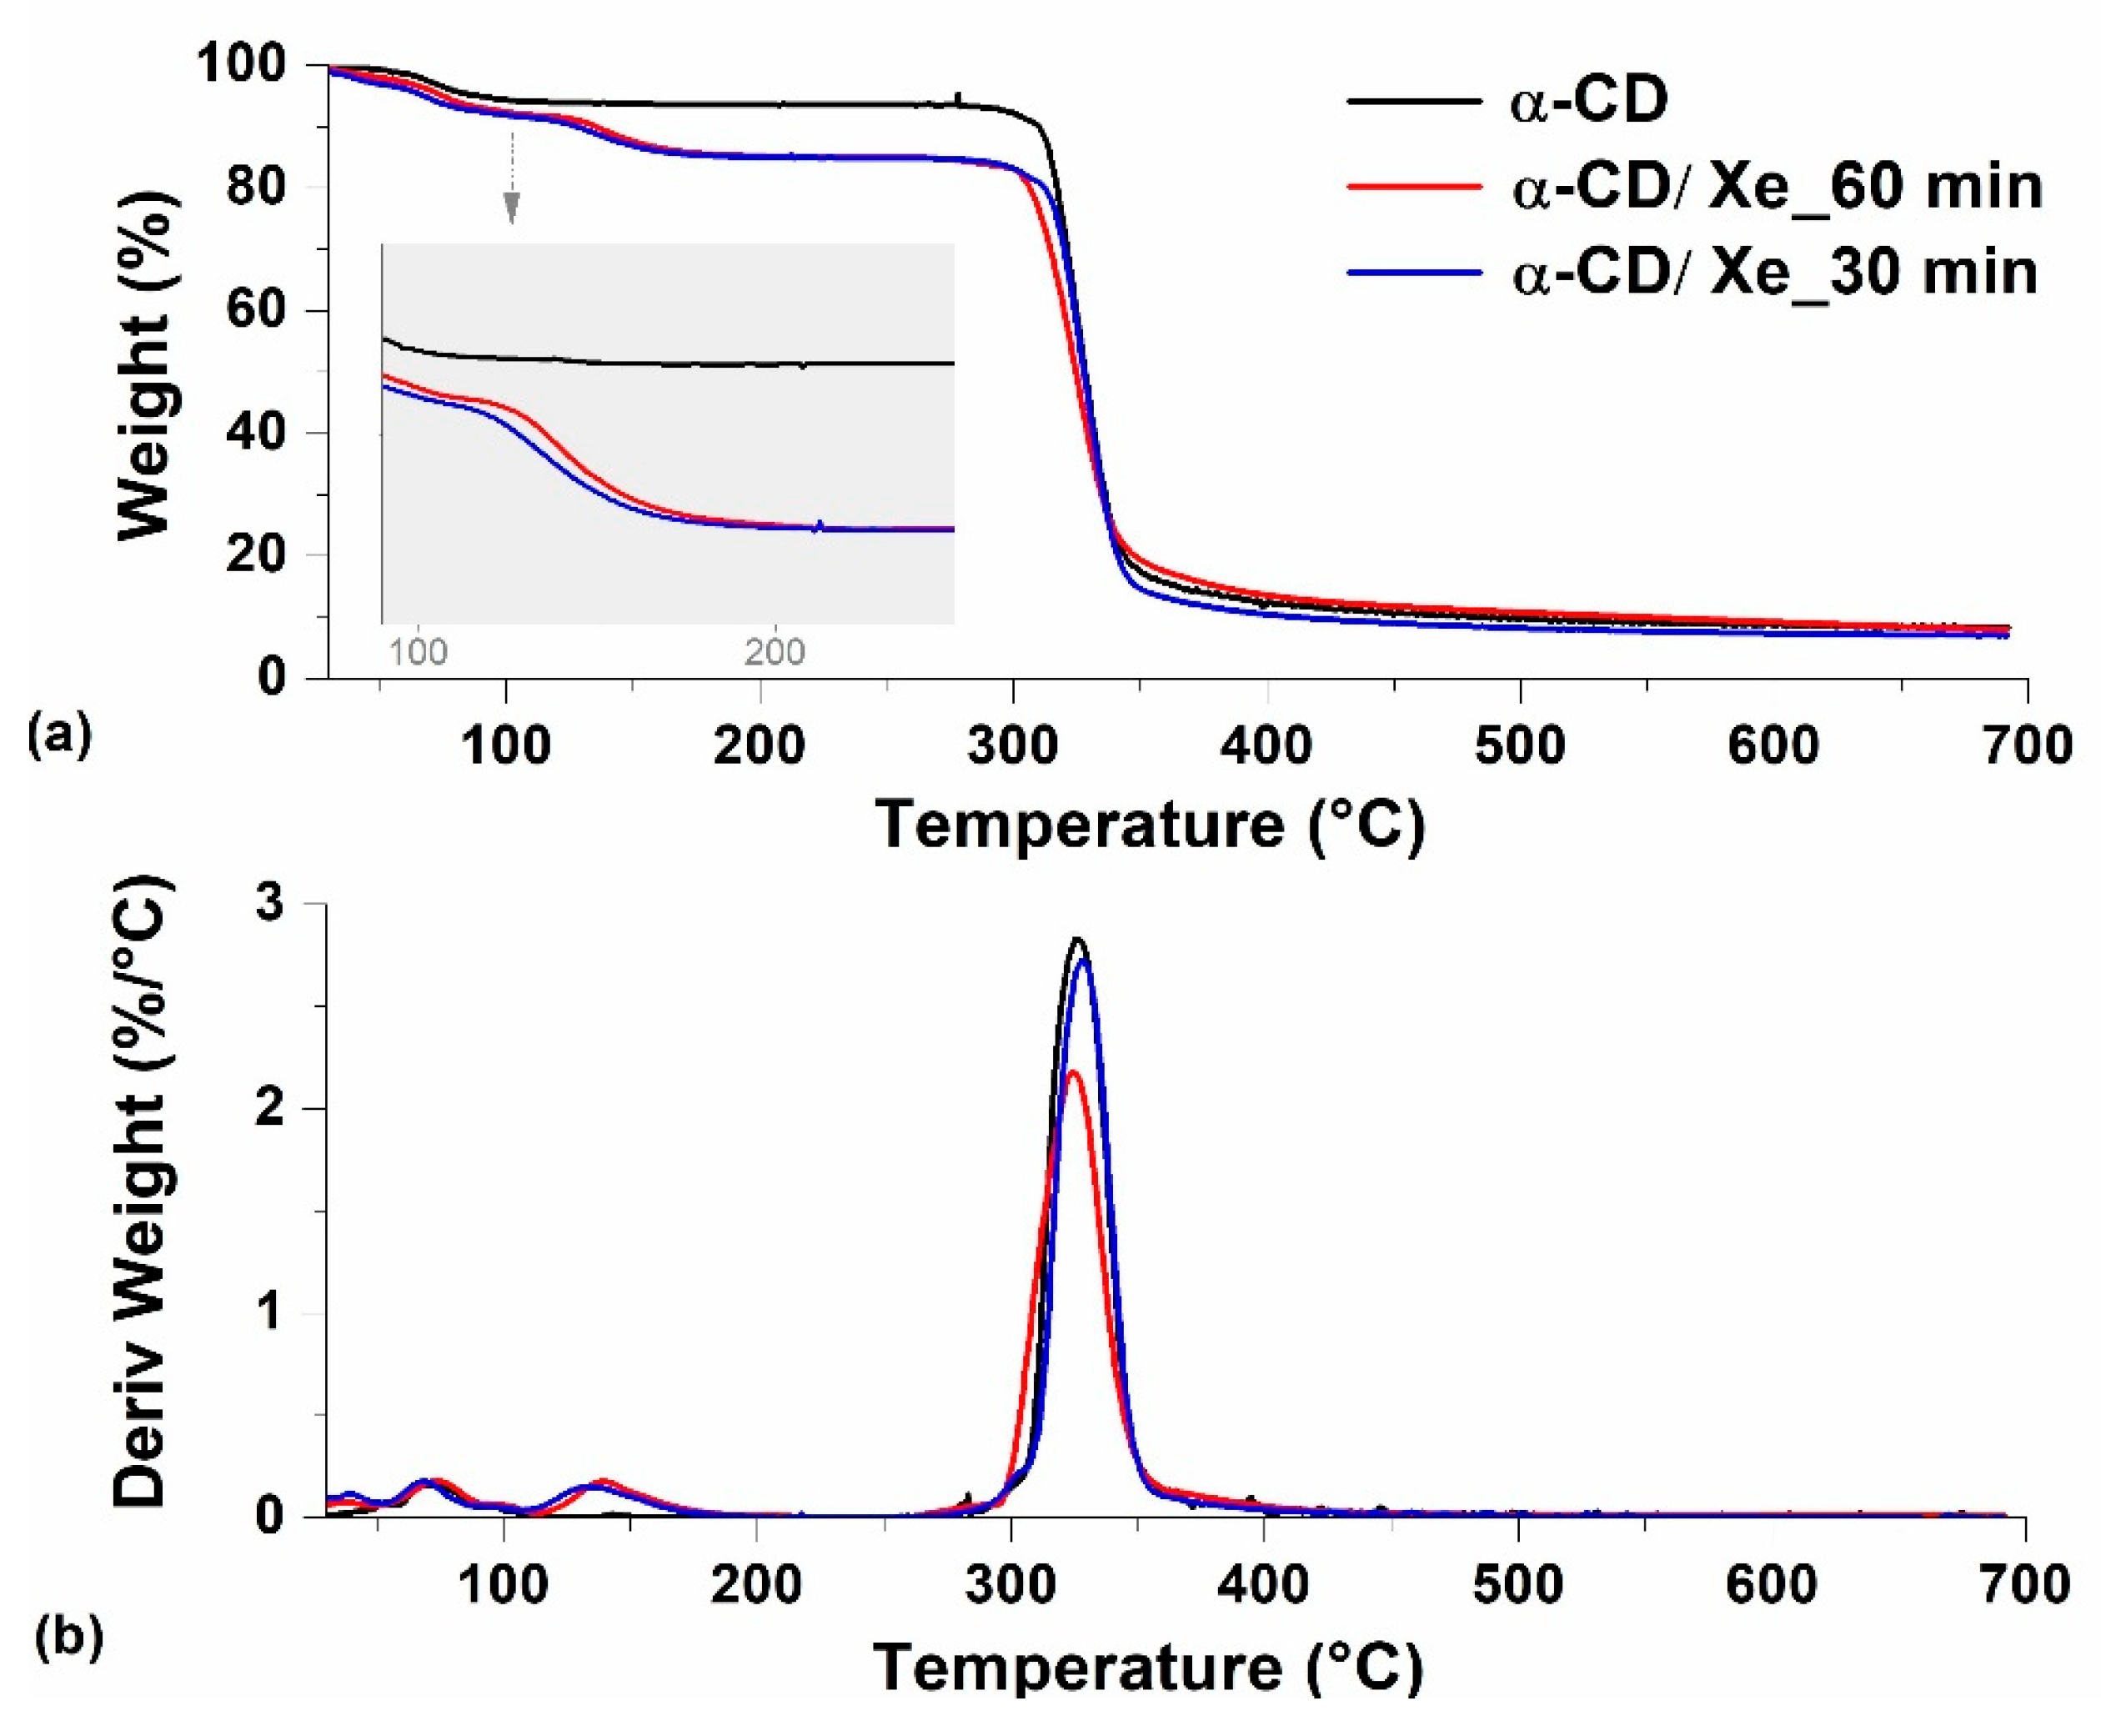
Figure 8.
Panel (a) shows TGA curves of α-CD and α-CD/Xe obtained at 2, 4, 6 and 8 bar. Panel (b) shows DTG curves of α-CD and α-CD/Xe obtained at 2, 4, 6 and 8 bar.
Figure 8.
Panel (a) shows TGA curves of α-CD and α-CD/Xe obtained at 2, 4, 6 and 8 bar. Panel (b) shows DTG curves of α-CD and α-CD/Xe obtained at 2, 4, 6 and 8 bar.
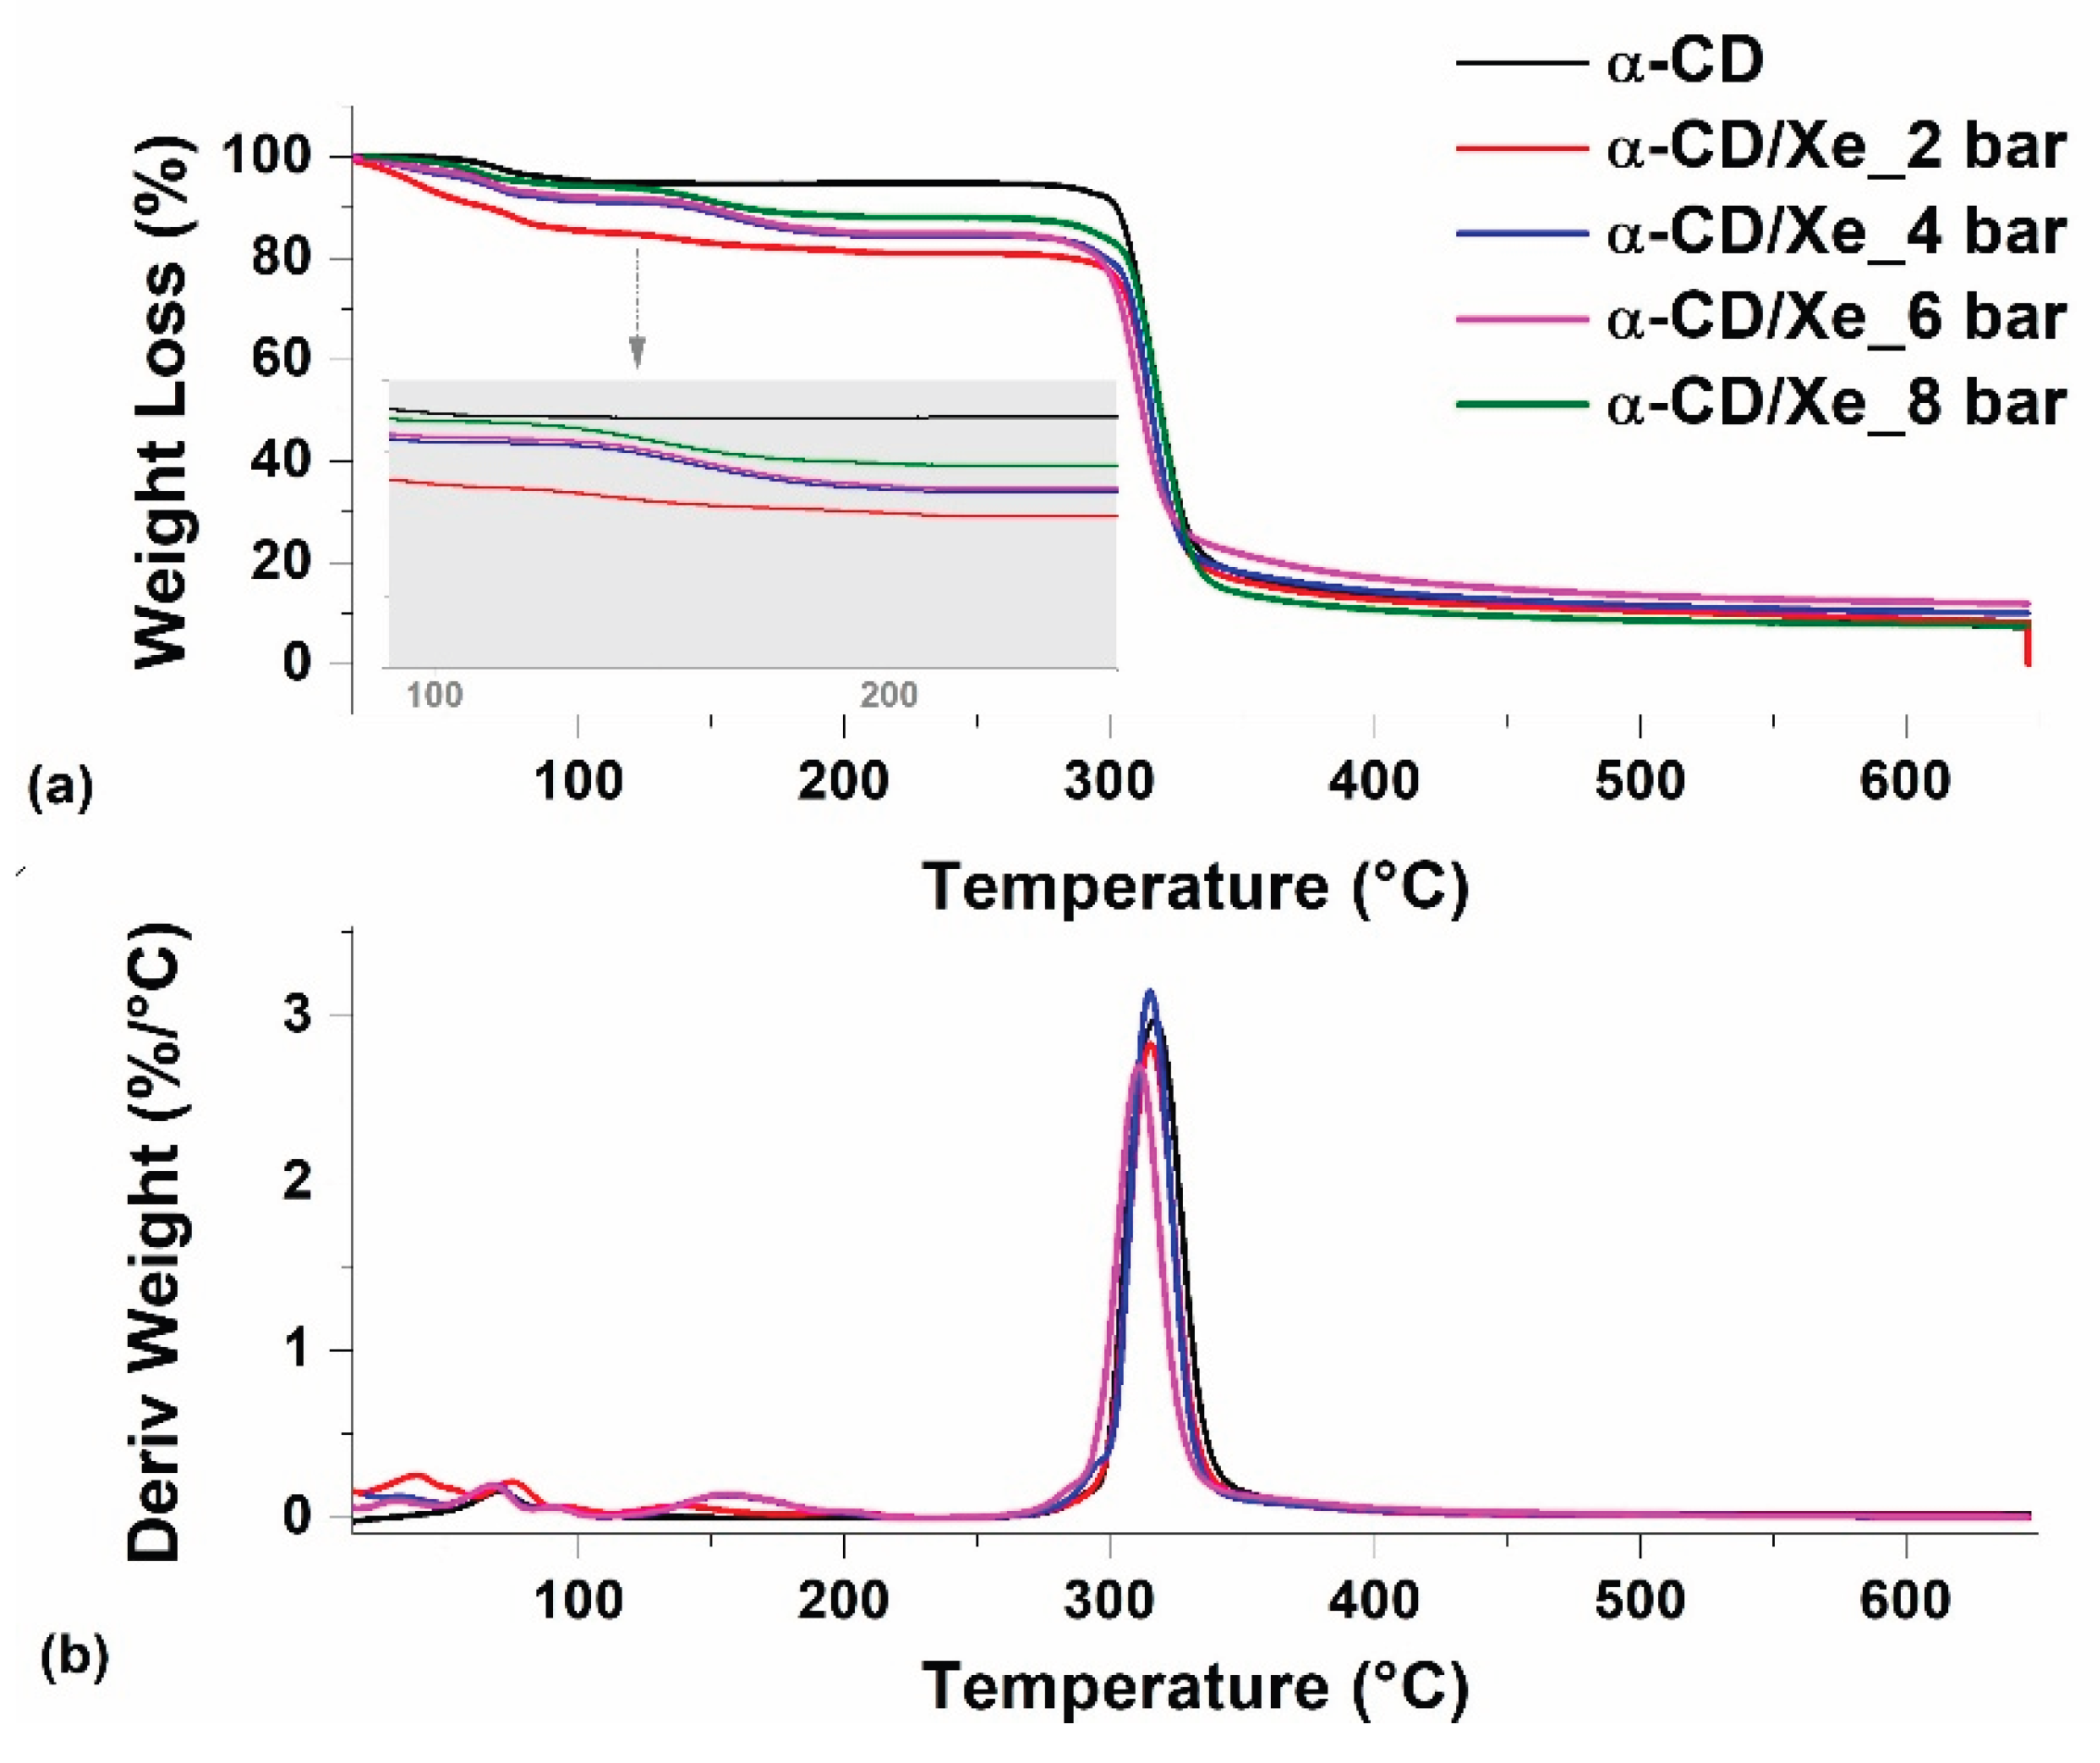
Figure 9.
ATR spectra of α-CD and of α-CD/Xe at 4 bar.
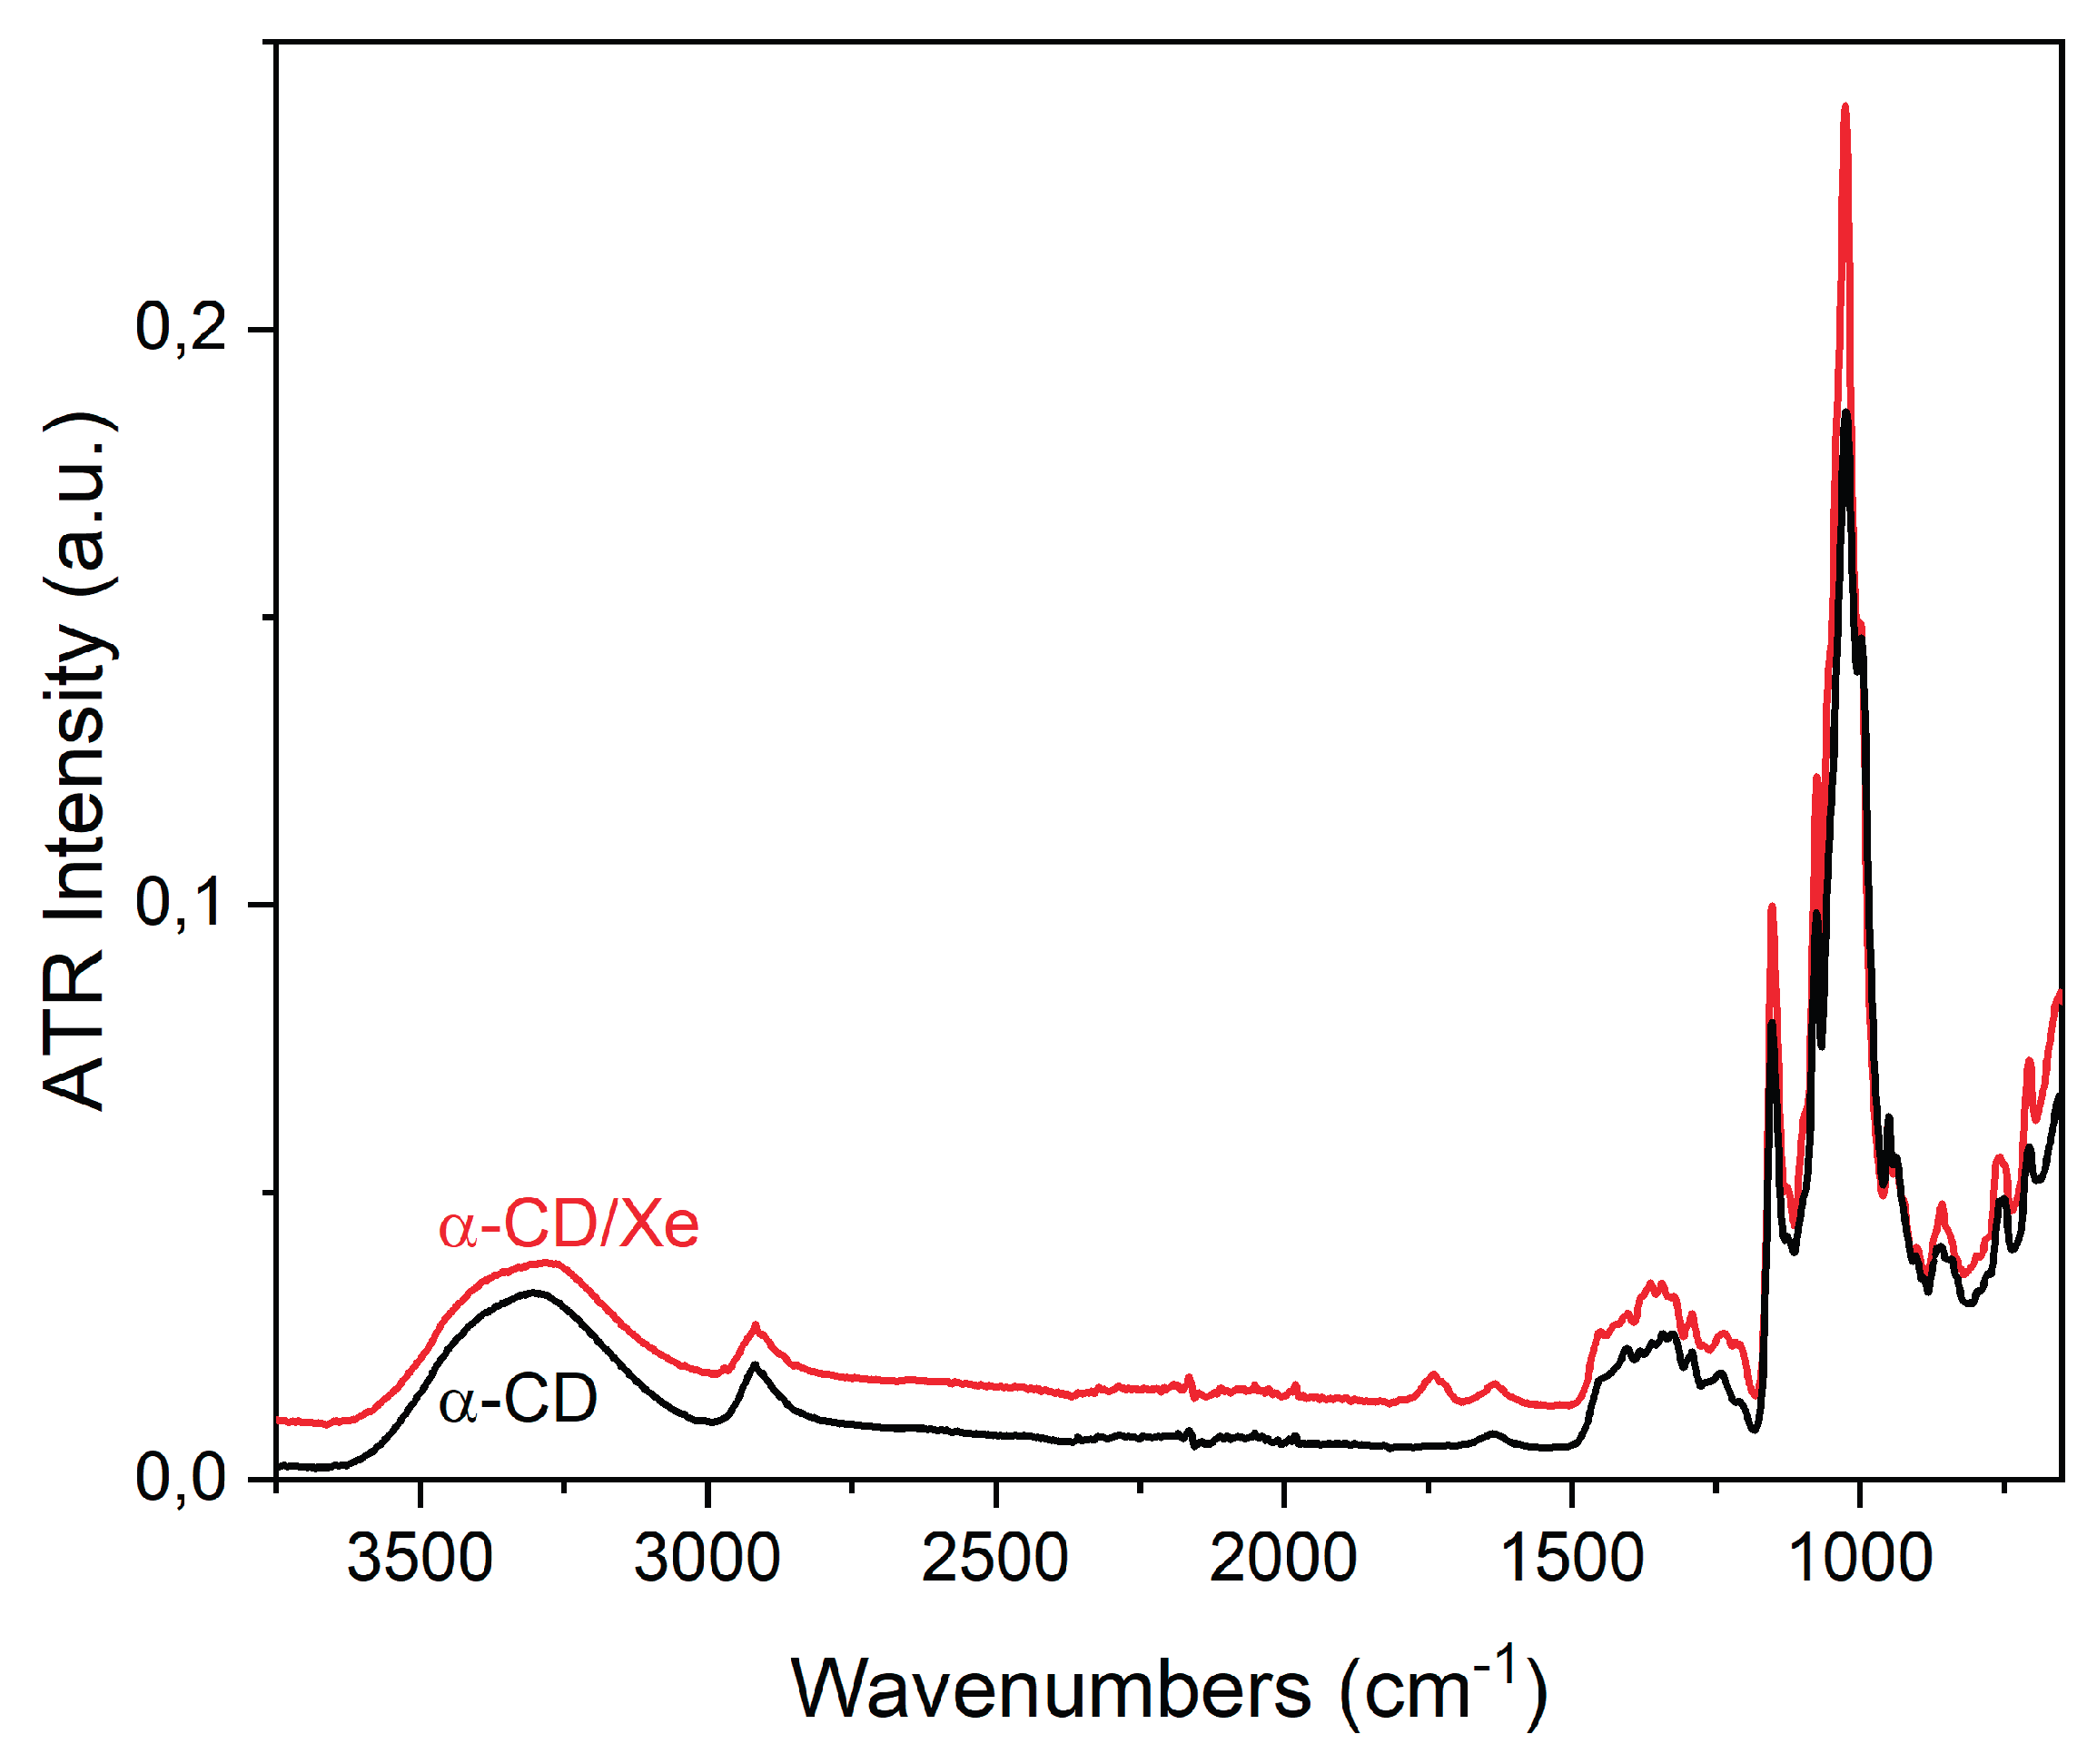
Figure 10.
Panel (a) Cumulative Xe release, monitored by SPME-GC-MS, from α-CD/Xe complexes prepared by exposing α-CD to Xe at 2, 4, 6, and 8 bar. Panel (b) Representative Xe chromatogram obtained for the α-CD/Xe complex prepared at 4 bar.
Figure 10.
Panel (a) Cumulative Xe release, monitored by SPME-GC-MS, from α-CD/Xe complexes prepared by exposing α-CD to Xe at 2, 4, 6, and 8 bar. Panel (b) Representative Xe chromatogram obtained for the α-CD/Xe complex prepared at 4 bar.
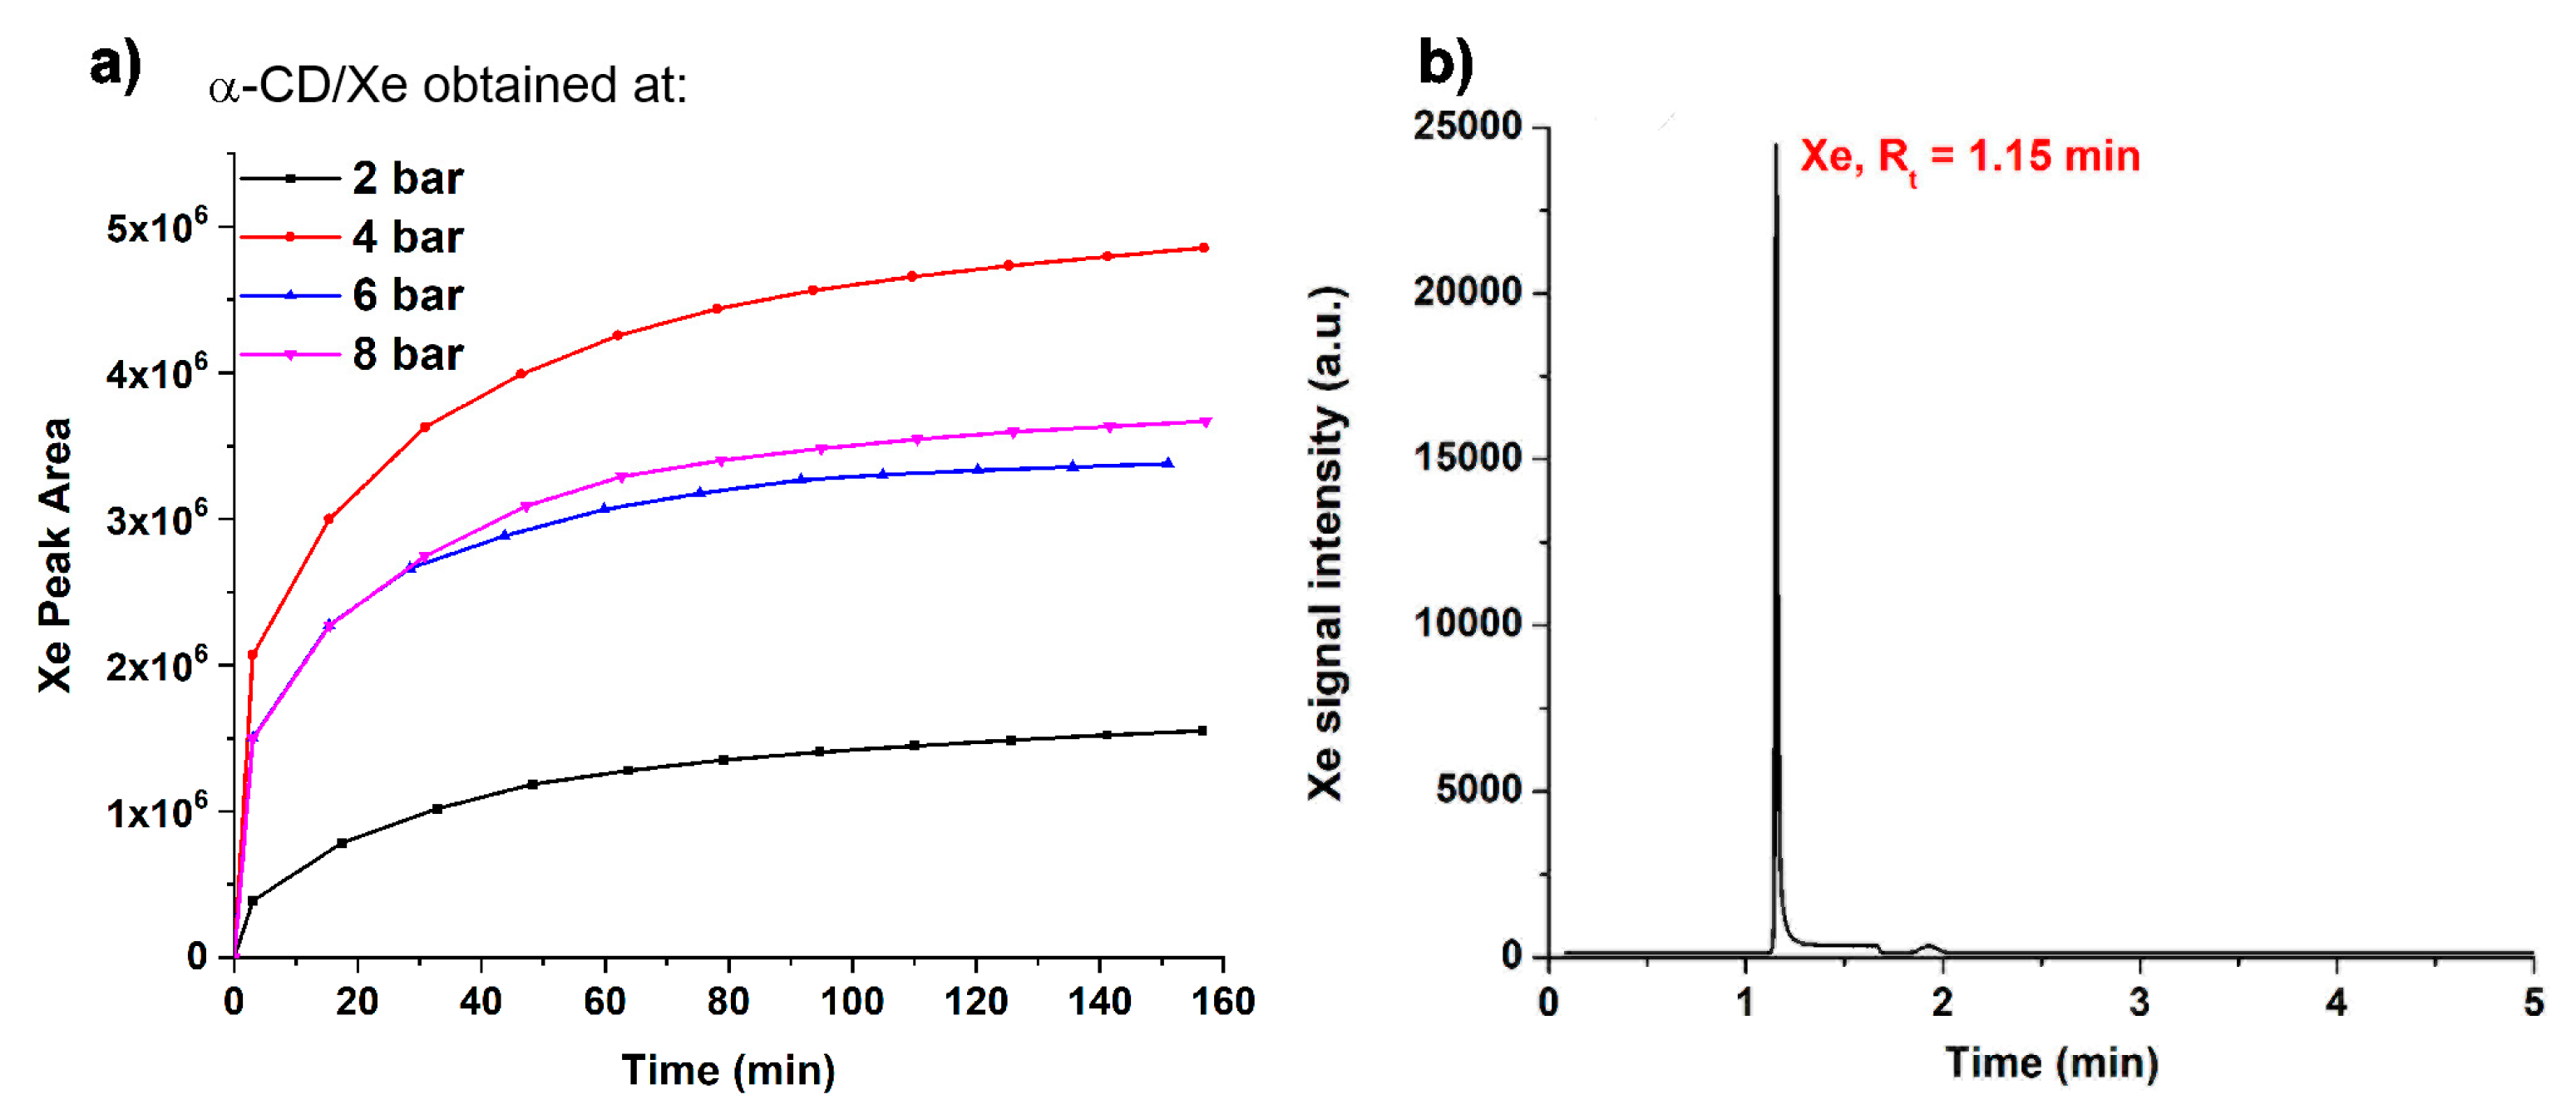
Table 1.
Weight loss of the different samples.
| Samples | Weight Loss (%) | |||
|---|---|---|---|---|
| First T≤100°C |
Second 100°C ≤T≤200°C |
Third 250°C ≤T≤450°C |
||
| α-CD | 5.93 | - | 85.28 | |
| α-CD/Xe _30min | 7.52 | 7.02 | 75.05 | |
| α-CD/Xe _60min | 7.35 | 7.46 | 76.99 | |
Disclaimer/Publisher’s Note: The statements, opinions and data contained in all publications are solely those of the individual author(s) and contributor(s) and not of MDPI and/or the editor(s). MDPI and/or the editor(s) disclaim responsibility for any injury to people or property resulting from any ideas, methods, instructions or products referred to in the content. |
© 2026 by the authors. Licensee MDPI, Basel, Switzerland. This article is an open access article distributed under the terms and conditions of the Creative Commons Attribution (CC BY) license (http://creativecommons.org/licenses/by/4.0/).
Copyright: This open access article is published under a Creative Commons CC BY 4.0 license, which permit the free download, distribution, and reuse, provided that the author and preprint are cited in any reuse.