
Submitted:
19 August 2026
Posted:
19 August 2026
You are already at the latest version
Abstract
Star fruit (Averrhoa carambola L.; A. carambola) is an important fruit crop cultivated mainly in tropical and subtropical regions. The high soluble oxalate content of star fruit has become a major obstacle to the further expansion of its consumer market. Elucidating the origin and accumulation mechanisms of oxalate from the perspective of star fruit physiology is particularly important, as it provides the theoretical foundation for modern molecular breeding and the development of advanced cultivation and management practices. In this study, we quantified three oxalate-related organic acids in star fruit at two developmental stages and performed an integrated analysis combining targeted metabolomic and transcriptomic data. Our results showed that during the fruit expansion stage, when oxalate accumulation is relatively high, genes encoding several key enzymes involved in the glycolate oxidative degradation pathway and the L-ascorbate oxidative degradation pathway were significantly up-regulated. Our findings suggest a potential physiological role in regulating cell expansion and conversion between glycolate and amino acids for oxalate in star fruit, thereby addressing the knowledge gap regarding the mechanism underlying the progressive increase in oxalate content during fruit growth.
Keywords:
star fruit
; oxalate metabolism
; fruit development
; transcriptomics
; L-ascorbate oxidation
1. Introduction
Oxalic acid is a common simple dicarboxylic acid that is widely distributed in plants, particularly in species of the Amaranthaceae, Portulacaceae, and Oxalidaceae families [1,2]. Because excessive dietary intake of oxalic acid can contribute to diseases such as kidney stones, it is generally regarded as an antinutritional factor in food science [3]. Star fruit (Averrhoa carambola L.; A. carambola) is an important fruit crop cultivated mainly in tropical and subtropical regions. Renowned for its distinctive sweet-sour flavor, it is rich in vitamins, minerals, and antioxidant compounds, making it highly popular among consumers [4,5,6]. However, as a member of the Oxalidaceae family, A. carambola contains relatively high levels of soluble oxalate. The soluble oxalate content of fresh fruits ranges from 81.4 to 300 mg per 100 g fresh weight [7,8]. Excessive consumption may induce acute nephritis [9,10] and poses potential health risks to individuals with impaired renal function [11,12,13]. Consequently, the high soluble oxalate content of star fruit has become a major obstacle to the further expansion of its consumer market. To address the problem of high soluble oxalate content in star fruit, current strategies mainly involve strict regulation of the marketing of mature fruits, breeding low-oxalate cultivars, and optimizing cultivation practices. Although these approaches have achieved some progress, a considerable gap remains between the current outcomes and the goal of producing high-quality, safe, low-oxalate star fruit. In this context, elucidating the origin and accumulation mechanisms of oxalate from the perspective of star fruit physiology is particularly important, as it provides the theoretical foundation for modern molecular breeding and the development of advanced cultivation and management practices.
The oxalate content of star fruit is not constant; instead, it undergoes dynamic changes throughout fruit development and ripening. Zhong et al. [14] reported that oxalate levels in star fruit initially increase and then gradually decrease during fruit maturation, indicating that oxalate accumulation mainly occurs during the fruit expansion stage. This pattern of continuous oxalate accumulation during fruit growth and expansion has rarely been reported in other fruit species, and its underlying molecular mechanisms and physiological significance remain largely unclear. Over the past few decades, considerable progress has been made in understanding oxalate metabolism and its regulatory network in plants. Oxalate is primarily synthesized through three pathways: the oxidative degradation of glycolate produced during photorespiration, the oxidative degradation of glyoxylate generated from isocitrate cleavage in the glyoxylate cycle, and the oxidative degradation of L-ascorbate. In contrast, oxalate is metabolized through only two known pathways: acetylation catalyzed by oxalyl-CoA synthetase and oxidative degradation mediated by oxalate oxidase [15]. Based on sequence homology, most homologous genes encoding the functional enzymes involved in these pathways have been identified in the A. carambola genome through bioinformatic analyses [16]. However, the key esterase-encoding genes responsible for catalyzing the conversion of L-ascorbate to 4-oxalyl-L-threonate and the subsequent degradation of 4-oxalyl-L-threonate to oxalate have not yet been identified. Given that star fruit is rich in L-ascorbate and possesses a relatively complete L-ascorbate-associated metabolic network, we propose that the oxalate metabolic pathways described above, including the L-ascorbate oxidative degradation pathway, are likely conserved in A. carambola.
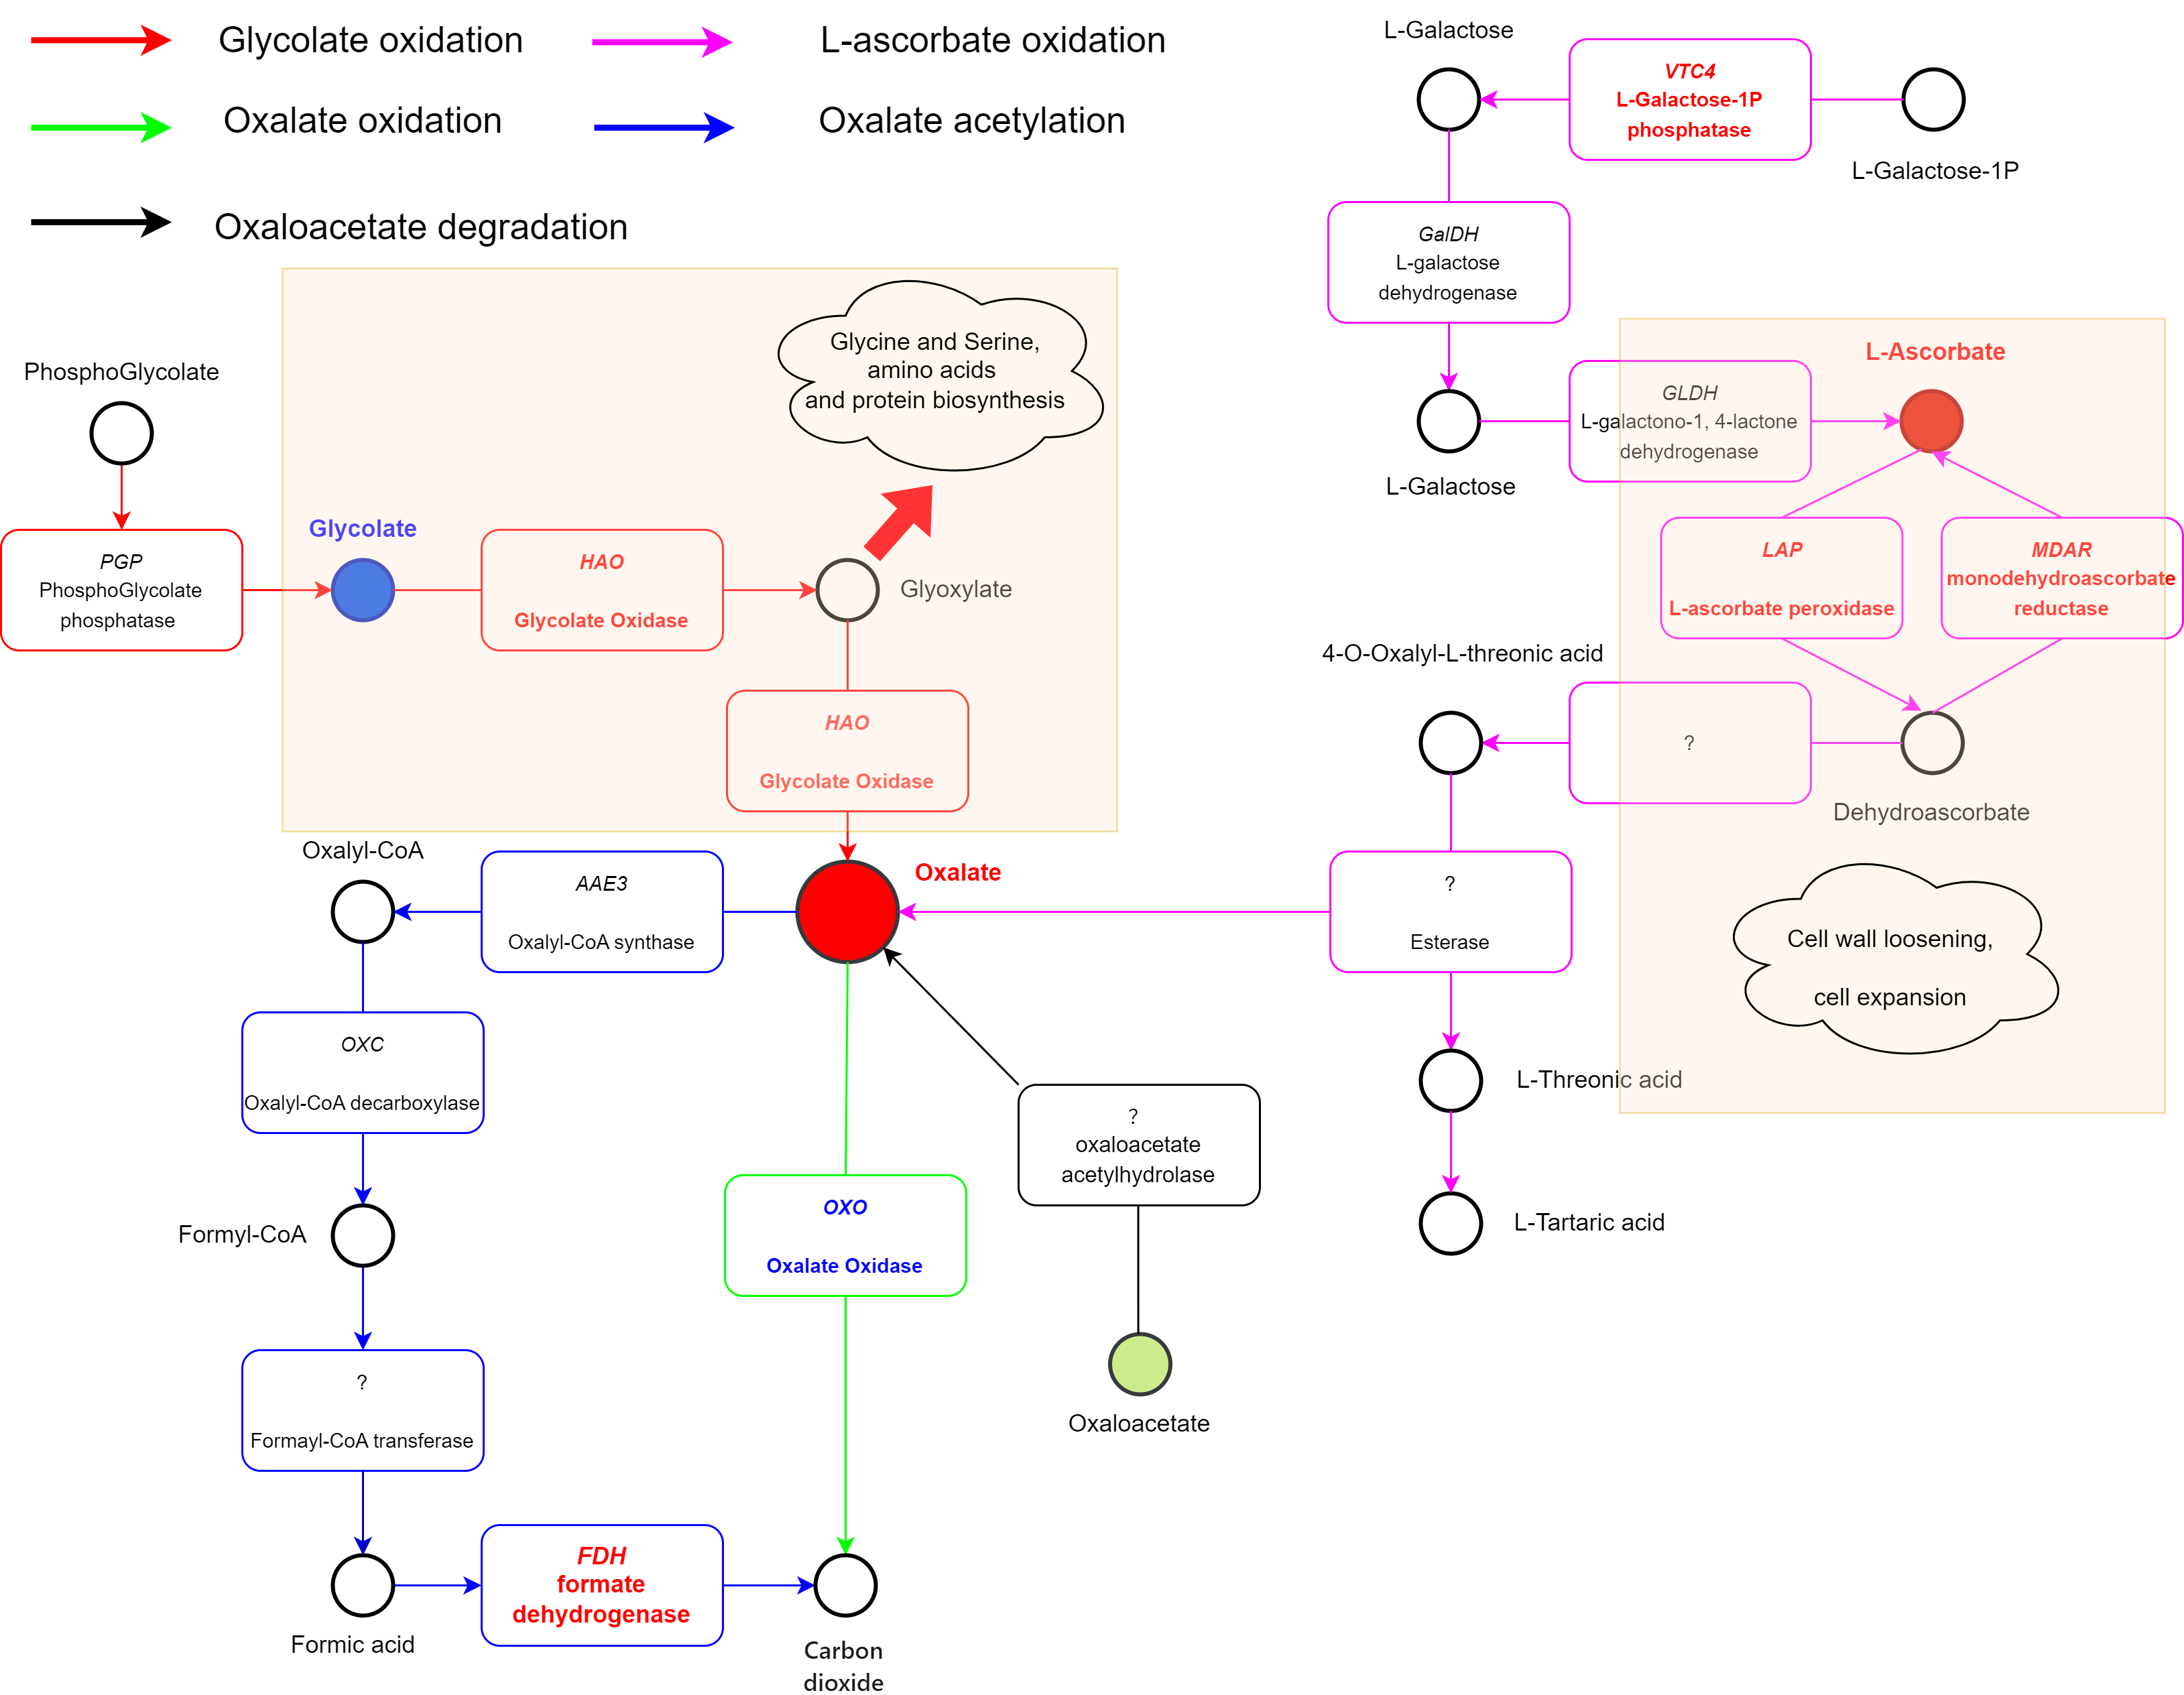
Integrative multi-omics analysis has been widely used to investigate the molecular mechanisms underlying key physiological processes and quality regulation in plants. For example, Xu et al. systematically characterized the metabolic regulatory networks of sugars and various organic acids during star fruit development by integrating transcriptomic and metabolomic analyses [17]. However, owing to the unique chemical properties of oxalate and its related organic acids, conventional metabolomic approaches have been unable to accurately quantify these compounds. This limitation is reflected in the absence of oxalate, glycolate, and glyoxylate from the star fruit metabolomic dataset reported by Xu et al. [17]. Therefore, integrating transcriptomic data with targeted metabolomic analysis is essential for elucidating the molecular basis of oxalate biosynthesis and accumulation during star fruit development. In this study, we quantified three oxalate-related organic acids in star fruit at two developmental stages and performed an integrated analysis combining targeted metabolomic and transcriptomic data. Previous transcriptome-based studies on plant oxalate metabolism have primarily focused on comparisons among different cultivars or tissue types. For example, Cai et al. [18] and Joshi et al. [19] investigated oxalate metabolism in spinach, whereas Mo et al. [16] conducted a comparative transcriptomic analysis of multiple A. carambola cultivars. To our knowledge, this is the first study to investigate oxalate metabolism in star fruit by comparing transcriptomes from different stages of fruit development. Our results showed that during the fruit expansion stage, when oxalate accumulation is relatively high, genes encoding several key enzymes involved in the glycolate oxidative degradation pathway and the L-ascorbate oxidative degradation pathway were significantly up-regulated. In contrast, three genes encoding oxalate oxidase, a key enzyme in the oxalate degradation pathway, were significantly down-regulated. These findings suggest that the increased oxalate accumulation during star fruit development is likely driven by enhanced conversion of glycolate to glyoxylate during rapid fruit growth and increased oxidative degradation of L-ascorbate during fruit expansion. Meanwhile, reduced activity of the oxalate degradation pathway may further promote oxalate accumulation in the fruit (Figure 1). Collectively, these findings fill an important knowledge gap regarding the physiological regulation of oxalate accumulation in star fruit and advance our understanding of plant oxalate metabolism and its potential physiological roles.
2. Method and Materials
2.1. Sample Collection
Star fruit samples used in this study were collected from the A. carambola Germplasm Resource Nursery of the Subtropical Crop Research Institute, Guangxi Zhuang Autonomous Region (Nanning, Guangxi Zhuang Autonomous Region, China; 108°22′55″E, 22°50′49″N) between July and August 2024. Based on their flavor characteristics, the fruits were classified as the sour-type cultivar and assigned the internal accession code Y23 [16]. Samples were divided into two developmental stages according to days after flowering (DAF): DAF20 (fruitlet stage, characterized by smaller fruits) and DAF50 (fruit expansion stage, characterized by larger fruits). Each stage included six biological replicates, with each replicate consisting of one individual fruit. After collection, all fruits were thoroughly rinsed, gently blotted dry, and dissected to remove the ribs, fruit core, and seeds. The remaining mesocarp (flesh) was cut into small pieces, and tissue from each individual fruit was transferred into a separate cryogenic tube. The samples were immediately snap-frozen in liquid nitrogen and stored at −80 °C until further analysis. The frozen mesocarp tissues were subsequently used for total RNA extraction and quantification of oxalate-related metabolites.
2.2. Quantification of Oxalate, Glycolate, L-Ascorbate, and Oxaloacetate Contents
Total oxalate was extracted from the samples using a hot extraction method adapted from Al-Wahsh et al. [20]. Oxalate content was subsequently quantified by high-performance liquid chromatography (HPLC) according to the method described by Wilson et al. [21]. The procedures for hot extraction and HPLC sample preparation are summarized below. Briefly, 0.1 g of frozen mesocarp tissue was further homogenized using a tissue grinder and mixed with 0.9 mL of 2 N hydrochloric acid (HCl). The mixture was incubated in a water bath at 80 °C for 30 min and then centrifuged at 12,000 × g for 5 min at room temperature. The resulting supernatant was diluted 10-fold with deionized distilled water, filtered through a 0.22 μm nylon 66 membrane, and transferred into HPLC vials. The prepared samples were stored at −20 °C until analysis. HPLC analysis was performed using a Waters e2695 system (Waters Corporation, Milford, MA, USA) equipped with a 7.8 mm × 300 mm Aminex HPX-87H column (Bio-Rad Laboratories, Hercules, CA, USA). The mobile phase consisted of 4 mM sulfuric acid (H2SO4) delivered at a constant flow rate of 0.6 mL/min. Oxalate was detected at 210 nm using a UV detector, and the characteristic retention time was approximately 6.5 min. Anhydrous oxalic acid (catalog no. 75688-50 g; Merck KGaA, Darmstadt, Germany) was used as the external standard to prepare calibration curves for quantitative analysis.
L-ascorbate content was determined using the 2,6-dichlorophenolindophenol titration method described by Tarrago-Trani et al. [22], with minor modifications. Briefly, 200 µL of homogenized fruit puree was mixed with 2% oxalic acid solution and adjusted to a final volume of 2 mL. The mixture was then agitated for 5 min to extract L-ascorbate. Subsequently, 1 mL of the extract was filtered and diluted with 9 mL of 2% oxalic acid solution before titration with a 0.1 g/L 2,6-dichlorophenolindophenol standard solution. Each sample was analyzed in triplicate. The titer of the 2,6-dichlorophenolindophenol solution was standardized using a 0.1 g/L L-ascorbate standard solution.
The protocol for glycolic acid quantification is summarized as follows. Briefly, 0.1 g of fruit mesocarp tissue was weighed, homogenized with 0.9 mL of ultrapure water, and incubated in a water bath at 80 °C for 30 min. After incubation, the homogenate was centrifuged at 12,000 × g for 5 min at room temperature. A 500 μL aliquot of the supernatant was collected and diluted to a final volume of 1.0 mL with ultrapure water. The resulting solution was filtered through a 0.22 μm nylon 66 membrane, transferred into HPLC vials, and stored at −20 °C until analysis. Glycolic acid was analyzed using an Agilent 1100 HPLC system (Agilent Technologies, Santa Clara, CA, USA) equipped with an Ultimate AQ-C18 reverse-phase column (250 mm × 4.6 mm, 5 μm particle size). The mobile phase consisted of 100 mM phosphate buffer (pH 3.0) delivered at a constant flow rate of 0.6 mL/min. Glycolic acid was detected at 210 nm using a UV detector, with a characteristic retention time of approximately 5.2 min. Glycolic acid (Source Leaf Biotechnology Co., Ltd., Shanghai, China) was used as the external standard to prepare calibration curves for quantitative analysis.
The protocol for oxaloacetate quantification is summarized as follows. Briefly, 0.3 g of fruit mesocarp tissue was weighed and mixed with 0.4 mL of 0.65 M HCl solution containing 0.1 mM EDTA·2Na and 0.6 mL of ultrapure water. The mixture was homogenized into a slurry using a tissue grinder and subjected to ultrasonic extraction for 1 h. After centrifugation, the supernatant was collected for subsequent derivatization. For derivatization, 250 μL of the supernatant was transferred to a reaction tube, followed by the sequential addition of 50 μL of 1 M sodium hydroxide (NaOH), 200 μL of 55 mM phenylhydrazine hydrochloride aqueous solution, and 100 μL of 100 mM phosphate buffer (pH 7.0). The reaction mixture was incubated at room temperature for 30 min and then filtered through a 0.22 μm nylon 66 membrane. The filtrate was transferred into HPLC vials and stored at −20 °C until analysis. Oxaloacetate analysis was performed using an Agilent 1100 HPLC system (Agilent Technologies, Santa Clara, CA, USA) equipped with an EcoPak C18 reverse-phase column (250 mm × 4.6 mm, 5 μm particle size). The mobile phase consisted of a phosphate buffer-methanol mixture (85:15, v/v) delivered at a constant flow rate of 1.0 mL/min. Oxaloacetate was detected at 324 nm using a UV detector, with a characteristic retention time of approximately 7.6 min. An oxaloacetate standard (Source Leaf Biotechnology Co., Ltd., Shanghai, China) was used as the external standard to prepare calibration curves for quantitative analysis.
2.3. RNA Extraction and Transcriptome Profiling
In this study, total RNA extraction and transcriptome sequencing were performed by Verygenome Technology Co., Ltd. (Guangzhou, China).
Total RNA was extracted from the samples designated for transcriptome analysis as follows. Approximately 200 mg of fresh plant tissue was weighed and thoroughly ground into a fine powder in liquid nitrogen using a homogenizer (60 Hz for 60 s). Immediately after homogenization, 760 μL of Buffer RPL, 40 μL of β-mercaptoethanol, and 20 μL of Proteinase K were added to the powdered tissue. The mixture was vortexed until complete lysis was achieved and then incubated at room temperature for 2 min. The lysate was centrifuged at 12,000 × g for 3 min at 4 °C, and the supernatant was transferred to a new 1.5 mL microcentrifuge tube. Next, 200 μL of Separation Solution SF was added to the supernatant. The mixture was vigorously inverted by hand for 15 s, incubated at room temperature for 3 min, and then centrifuged at 12,000 × g for 5 min at 4 °C. Subsequently, 500 μL of the resulting supernatant was transferred to the designated wells (Columns 1 and 7) of the automated nucleic acid extraction system reagent plate. Wells in Columns 3 and 9 were supplemented with 10 μL of DNase I and 70 μL of DNase Reaction Buffer. The automated extraction system was then operated using the preset Lysis and Binding program. After completion of this step, 240 μL of Binding Buffer RB was added to each well in Columns 3 and 9, and the preset Wash and Elution program was performed to obtain purified total RNA.
The purity, concentration, and integrity of the RNA samples were evaluated using a NanoPhotometer® spectrophotometer (IMPLEN, CA, USA), a Qubit® 3.0 Fluorometer (Life Technologies, CA, USA), and the Agilent 2100 Bioanalyzer with the RNA Nano 6000 Assay Kit (Agilent Technologies, CA, USA), respectively. After quality assessment, mRNA was enriched using Oligo(dT)-conjugated magnetic beads and fragmented into short fragments with Fragmentation Buffer. First-strand complementary DNA (cDNA) was synthesized from the fragmented mRNA using random hexamer primers, followed by second-strand cDNA synthesis using buffer, dNTPs, RNase H, and DNA Polymerase I. The resulting double-stranded cDNA was purified using a QIAquick PCR Purification Kit and eluted with EB buffer. The purified cDNA was then subjected to end repair, A-tailing, and ligation of sequencing adapters. Fragments of the desired size were recovered by agarose gel electrophoresis and amplified by polymerase chain reaction (PCR) to generate the sequencing libraries. The constructed libraries were initially quantified using a NanoDrop spectrophotometer (Thermo Fisher Scientific, USA) and diluted to a concentration of 1 ng/μL. Library insert size was verified using an Agilent 2100 Bioanalyzer, and the effective library concentration was accurately determined by quantitative real-time PCR (qRT-PCR) using a Bio-RAD CFX96 Real-Time PCR System and Bio-RAD iQ SYBR Green Supermix. Only libraries with an effective concentration greater than 10 nM were considered suitable for sequencing. Sequencing was performed on an Illumina platform using a paired-end 150-bp (PE150) strategy. Raw sequencing reads were processed to remove adapter sequences, low-quality reads, and other contaminants, generating high-quality clean reads for subsequent alignment to the reference genome and downstream gene expression analyses.
2.4. Comparative Transcriptomics Analysis
2.4.1. Unigene Annotation
For the reference-based transcriptome analysis, high-quality clean reads were aligned to the A. carambola reference genome available from the China National Genebank Science Data Center (BioProject ID: PRJCA002055; Accession No.: GWHABKE00000000). The resulting mapped reads were used for transcript assembly, gene expression quantification, and subsequent downstream analyses. Alignment quality was assessed by evaluating sequencing saturation, gene coverage, read distribution across genomic features, and chromosomal read distribution.
2.4.2. Transcriptome Data Quality Assessment and Standardized Data Normalization
First, genes with a median absolute deviation (MAD) < 1 were removed from the raw transcript count matrix (countdata), resulting in a high-variance gene subset (countdata_filtered). Next, the varianceStabilizingTransformation() function in the R package DESeq2 [23] was applied to countdata_filtered with the blind parameter set to TRUE, generating variance-stabilized normalized data (normdata_for_PCA) optimized for principal component analysis (PCA). PCA and data visualization were subsequently performed using the pca() function in the R package mixOmics [24]. To generate data for downstream bioinformatics analyses, countdata_filtered was processed again using the varianceStabilizingTransformation() function in DESeq2, with the blind parameter set to FALSE to preserve condition-specific variance. This produced the normalized expression matrix (normdata_for_analysis) used for subsequent analyses.
2.4.3. Transcriptome Differential Expression Analysis
The sample group with higher oxalate content (fruit expansion stage) was designated as the numerator, whereas the group with lower oxalate content (fruitlet stage) was designated as the denominator (contrast: expansion vs. fruitlet). Transcriptome differential expression analysis was performed using the DESeq() function from the R package DESeq2 [23], with normdata_for_analysis (preprocessed via variance-stabilizing transformation with blind = FALSE) as the input matrix. Differentially expressed genes (DEGs) were identified using an adjusted p-value (padj) < 0.05. Among the DEGs, genes with a log2 fold change (log2FC) > 0 were classified as up-regulated (higher expression during the fruit expansion stage), whereas those with log2FC < 0 were classified as down-regulated (higher expression during the fruitlet stage). The identified DEGs were visualized using:
Heatmaps: Generated using the R package tidyHeatmap [25] to visualize the expression patterns of DEGs across samples. Volcano plots: Constructed using the R package ggrepel to display DEGs based on both statistical significance (padj < 0.05) and the magnitude of expression change (|log2FC| > 0).
2.4.4. Transcriptome Partial Least Squares Discriminant Analysis (PLS-DA) and Partial Least Squares (PLS) Regression Analysis
PLS-DA was performed on normdata_for_analysis using the plsda() function in the R package mixOmics [24]. The performance and statistical robustness of the PLS-DA model were evaluated using the perf() function with the parameters validation = “Mfold”, fold = 6, and auc = TRUE, where classification performance was assessed by the area under the receiver operating characteristic (ROC) curve (AUC). For PLS regression analysis, normdata_for_analysis (transcriptome expression matrix) and normalized oxalate levels (response variable, Y) were used as inputs to the pls() function in mixOmics. Genes with a Variable Importance in Projection (VIP) score > 1 were considered key genes, indicating a substantial contribution to explaining variation in oxalate levels. To evaluate the relationships between gene expression and oxalate content, the cosine of the angle between the coordinate vector of each key gene and that of the response variable (Y) in the two-dimensional latent variable space was calculated. In the standardized latent space, this value is equivalent to the Pearson correlation coefficient and therefore reflects the strength of the linear association between gene expression and oxalate levels. Likewise, the cosine of the angle between the coordinate vectors of pairs of key genes was calculated to quantify their pairwise linear correlations. The predictive performance and generalizability of the PLS regression model were assessed using the perf() function in mixOmics with leave-one-out cross-validation (validation = “loo”). This validation strategy was used to evaluate the robustness of the model for predicting independent samples.
2.4.5. Gene Ontology (GO) and Kyoto Encyclopedia of Genes and Genomes (KEGG) Enrichment Analyses of DEGs
GO and KEGG pathway enrichment analyses were performed separately for the up-regulated and down-regulated DEG sets using the KeYiYun Bioinformatics Public Analysis Platform (https://researcheasy.cn/). The genes included in normdata_for_analysis were used as the background gene set to represent the transcriptome-wide gene population analyzed in this study. Significantly enriched GO terms and KEGG pathways were identified using a threshold of Q-value (adjusted p-value) < 0.05.
2.4.6. Transcription Factor Binding Site (TFBS) Prediction for DEGs Associated with the Oxalate Metabolism Pathways
Promoter sequences, defined as the 2-kb regions upstream of the transcription start site (TSS) of each target gene, were extracted from the A. carambola reference genome using the getPromoterSeq() function in the R package GenomicFeatures. The reference genome was obtained from the China National Genebank Science Data Center (BioProject ID: PRJCA002055; Accession No.: GWHABKE00000000). The extracted promoter sequences were subsequently submitted to the TFBS prediction module of the PlantRegMap database [26] (https://plantregmap.gao-lab.org/binding_site_prediction.php) for de novo prediction of TFBSs.
2.4.7. Validation Experiment of Gene Expression Levels via qRT-PCR
qRT-PCR was performed using ChamQ Universal SYBR qPCR Master Mix (Cat. No. Q711, Vazyme, China). Relative gene expression levels were calculated using the 2−ΔCt method, with the Glyceraldehyde-3-phosphate dehydrogenase (GAPDH) gene (geneYangtao2000609) and the Actin gene (geneYangtao2014319) used as internal reference genes. The primer sequences used for qRT-PCR are listed in Table S1.
2.5. Statistical Analysis and Figure Generation
Statistical analyses were performed using GraphPad Prism 9.5.0. Comparisons between two groups were conducted using Student’s t-test, whereas comparisons among multiple groups were performed using one-way analysis of variance (ANOVA). Figures were generated using GraphPad Prism 9.5.0 and draw.io.
3. Results
3.1. Comparison of Oxalate, Glycolate, Oxaloacetate, and L-Ascorbate Levels in STAR Fruit at Two Different Developmental Stages
Larger but still immature star fruits were classified as the fruit expansion stage, whereas smaller fruits were classified as the fruitlet stage (Figure 2a). The oxalate content of fruits at the expansion stage was 284.62 mg/100 g fresh weight, which was significantly higher than that of fruitlet-stage fruits (55.52 mg/100 g fresh weight). In contrast, the glycolate content was significantly lower in expansion-stage fruits (20.40 mg/100 g fresh weight) than in fruitlet-stage fruits (40.24 mg/100 g fresh weight). The L-ascorbate content showed the opposite trend, increasing significantly from 3.74 mg/100 g fresh weight in fruitlet-stage fruits to 6.17 mg/100 g fresh weight in expansion-stage fruits. No significant difference was detected in oxaloacetate content between the two developmental stages, with both maintaining a low concentration of approximately 0.17 mg/100 g fresh weight (Figure 2b). These results indicate that, in the sour-type star fruit variety Y23, oxalate and L-ascorbate contents increase significantly during fruit expansion, whereas glycolate content decreases significantly. In contrast, oxaloacetate content remains consistently low and does not change significantly between the two developmental stages.
3.2. Quality Assessment of Transcriptome Sequencing Data
Following quality control (QC), a total of 667,418,318 clean reads were retained for transcriptome analysis. For each sample, the Q30 value (the percentage of bases with a Phred quality score ≥ 30) was at least 98.8%, with an average GC content of 44.32%. Detailed sequencing quality metrics are provided in Table S2. Reference-based alignment identified 20,402 unigenes. After filtering for genes with a MAD > 1, 17,421 genes were retained for downstream analyses. Among these, 56 genes were annotated as encoding enzymes involved in oxalate biosynthesis and degradation pathways, including oxalate oxidation (n = 14), L-ascorbate oxidation (n = 20), glycolate oxidation (n = 12), oxalate acetylation (n = 4), and the glyoxylate cycle (n = 5). Detailed information on these genes is provided in Table S3.
Fruit samples from the fruitlet and fruit expansion stages were clearly separated into two distinct groups. PCA showed that the first PC1 and the second PC2 explained 29% and 26% of the total variance, respectively. Similarly, PLS discriminant analysis (PLS-DA) demonstrated clear separation between the two developmental stages, with the first and second latent variables explaining 28% and 16% of the total variance, respectively (Figure 3).
3.3. Differential Transcriptome Analysis of Unigenes and Validation of Oxalate Metabolism-Associated DEGs
Transcriptome-wide differential expression analysis was performed on 17,421 unigenes by comparing fruits at the fruit expansion stage (test group) with those at the fruitlet stage (control group). Using a threshold of padj < 0.05, a total of 2,484 DEGs were identified, including 1,159 up-regulated genes (log2FC > 0) and 1,325 down-regulated genes (log2FC < 0) (Figure 4a). The expression patterns of these DEGs across all samples are shown in Figure 4b. Among the up-regulated DEGs, seven genes were annotated as being involved in oxalate metabolism and were classified into the following three metabolic subpathways:
L-Ascorbate oxidation: L-galactose-1-phosphate phosphatase (VTC4; geneYangtao2007479; log2FC = 0.696, padj = 0.0003), L-ascorbate peroxidase (LAP; geneYangtao2014890; log2FC = 0.380, padj = 0.032), and monodehydroascorbate reductase (MDAR; geneYangtao2017122; log2FC = 0.350, padj = 0.0009).
Glycolate oxidation: geneYangtao2006544 (HAO-1) and geneYangtao2019950 (HAO-2), both encoding (S)-2-hydroxy acid oxidase (log2FC = 0.40, padj = 0.034 and log2FC = 2.01, padj = 0.002, respectively), plus Hydroxypyruvate reductase (HRP2, geneYangtao2010706, log2FC = 0.498, padj = 0.00026);
Oxalate acetylation: formate dehydrogenase (FDH, geneYangtao2007144, log2FC = 0.434, padj = 0.011).
In contrast, the down-regulated DEG set contained only three oxalate oxidase encoding genes including geneYangtao2002480 (OXO-1, log2FC = -1.96, padj = 0.003), geneYangtao2011117 (OXO-2, log2FC = -1.35, padj = 0.017), and geneYangtao2012853 (OXO-3, log2FC = -2.06, padj = 0.003).
To validate the transcriptome results, qRT-PCR was performed for the seven DEGs associated with oxalate metabolism. The expression patterns determined by qRT-PCR were consistent with those obtained from the transcriptome analysis (Figure 4c), confirming the reliability and accuracy of the RNA-seq results.
Using a significance threshold of Q_value (adjusted p-value) < 0.05, GO enrichment analysis of the up-regulated gene set identified 22, 29, and 13 significantly enriched terms in the biological process (BP), cellular component (CC), and molecular function (MF) categories, respectively. Among the enriched BP terms, those most closely associated with oxalate metabolism included “cellular response to oxidative stress” (Q_value = 0.0079, Rich_Ratio = 4.50), “organic acid catabolic process” (Q_value = 0.03, Rich_Ratio = 2.45), “carboxylic acid catabolic process” (Q_value = 0.03, Rich_Ratio = 2.45), and “cell redox homeostasis” (Q_value = 0.03, Rich_Ratio = 2.43) (Figure 5a). The enriched CC terms were predominantly associated with the subcellular sites of photorespiration and photosynthesis, including “plastid” (Q_value = 2.04 × 10⁻¹⁸, Rich_Ratio = 2.03), “chloroplast” (Q-value = 2.04 × 1−⁻18, Rich_Ratio = 2.06), “chloroplast stroma” (Q-value = 2.39 × −0⁻12, Rich Ratio = 2.82), “photosynthetic membrane” (Q_value = 1.63 ×−10⁻10, Rich_Ratio = 3.18), and “thylakoid” (Q_value = 2.09 − 10⁻10, Rich_Ratio = 3.65) (Figure 5b). In the MF category, “oxidoreductase activity” was the most significantly enriched term (Q-value = 3.28−× 10⁻9, Rich_Ratio = 1.79) (Figure 5c). KEGG pathway enrichment analysis of the up-regulated gene set identified only three significantly enriched pathways: “Ribosome” (Q_value = 3.6− × 10⁻6, Rich_Ratio = 2.80), “Oxidative phosphorylation” (Q_value = 0.000264, Rich Ratio = 3.85), and “Metabolic pathways” (Q_value = 0.02, Rich_Ratio = 1.295) (Figure 5d). The complete GO and KEGG enrichment results for the up-regulated gene set are provided in Table S4.
GO enrichment analysis of the down-regulated gene set identified 68, 12, and 52 significantly enriched terms in the BP, CC, and MF categories, respectively. Within the BP category, numerous terms associated with stress responses and plant immune defense were significantly enriched, including “response to stress” (Q_value = 6.82 × 10⁻⁹⁹, Rich_Ratio = 1.45), “response to stimulus” (Q_value = 2.49 × −60⁻⁶, Rich_Ratio = 1.74), and “innate immune response” (Q_value = 4.04 −6 10⁻⁶, Rich_Ratio = 2.51) (Figure 6a). Consistent with these findings, the significantly enriched CC terms were primarily associated with membrane and extracellular structures, including “plasma membrane” (Q_value = 2.9−23 × 10⁻²³, Rich_Ratio = 1.80), “plasmodesma” (Q_value = −7.33 × 10⁻⁷, Rich_Ratio = 1.92), and “extracellular region” (Q_value −11 3.40 × 10⁻¹¹, Rich_Ratio = 1.79) (Figure 6b). In the MF category, “anion binding” was among the most significantly enriched terms (Q_val−11e = 2.98 × 10⁻¹¹, Rich_Ratio = 1.46) (Figure 6c). KEGG pathway enrichment analysis of the down-regulated gene set identified seven significantly enriched pathways. Consistent with the GO enrichment results, “Plant-pathogen interaction” was the most significantly enriched pathway (Q_−6alue = 8.74 × 10⁻⁶, Rich_Ratio = 2.86), followed by “Biosynthesis of secondary metabolites” (−4_value = 3.72 × 10⁻⁴, Rich_Ratio = 1.58) (Figure 6d). The complete GO and KEGG enrichment analysis results for the down-regulated gene set are presented in Table S5.
These results indicate that, compared with the fruitlet stage, star fruit at the fruit expansion stage undergoes a metabolic shift characterized by enhanced organic acid catabolism and relatively increased amino acid and protein biosynthesis. In contrast, physiological processes associated with stress responses and disease resistance are relatively suppressed during this developmental stage.
3.4. Investigation of Expression Regulatory Mechanisms for Oxalate Metabolism-Associated DEGs
Prediction of TFBSs identified 2,692 potential TFBSs within the upstream promoter regions of the seven significantly up-regulated DEGs involved in oxalate metabolism. The ten most abundant transcription factor (TF) families are shown in Figure 7a. Among them, the Dof family was the most highly represented, accounting for 14.1% of all predicted TFBSs, followed by the ERF family (11.7%) and the MYB family (6.3%). In contrast, 1,156 potential TFBSs were predicted in the upstream promoter regions of the three significantly down-regulated DEGs encoding oxalate oxidase. As observed for the up-regulated DEGs, the Dof and ERF families were the two most abundant TF families, accounting for 16.0% and 12.2% of the predicted TFBSs, respectively. The WRKY family ranked third, representing 10.4% of the predicted binding sites (Figure 7b).
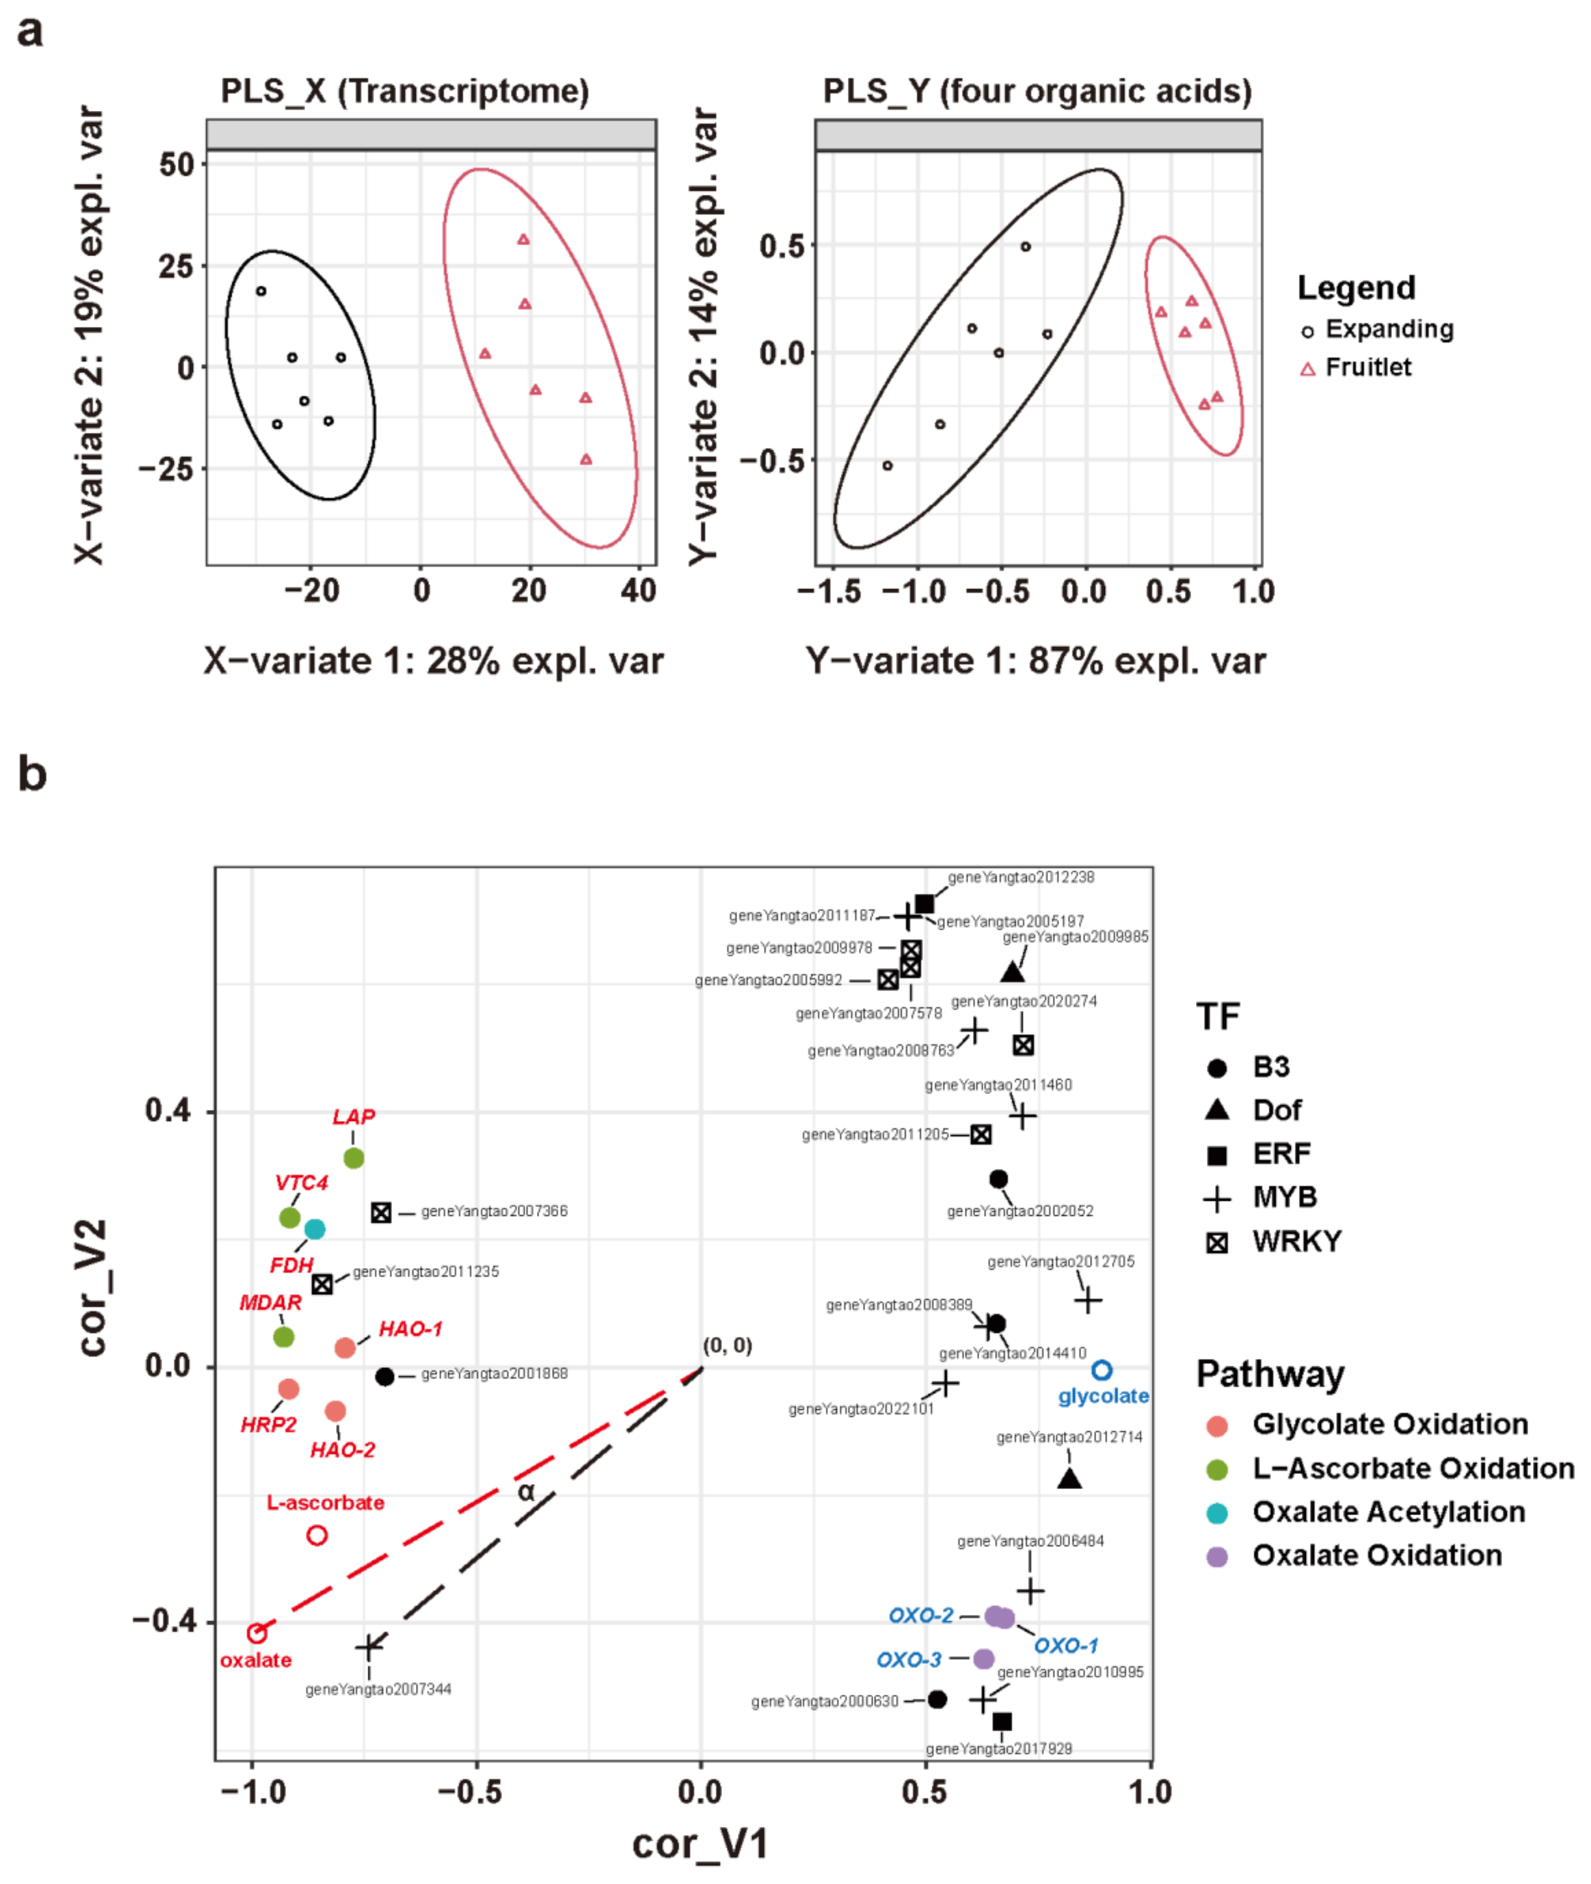
A PLS-based association analysis was performed using the transcriptome dataset to investigate the relationships between gene expression and the levels of oxalate and related organic acids. In the PLS model, latent components (variates) 1 and 2 of the X matrix explained 28% and 19% of the total variance, respectively, whereas latent components 1 and 2 of the Y matrix explained 87% and 14% of the variance, respectively (Figure 8a). To investigate the regulatory relationships between candidate TFs and the ten DEGs, TF genes with a VIP score > 1 and an adjusted p-value < 0.05, together with the ten DEGs known to be involved in oxalate metabolism, were projected onto the variable plot. In this plot, the x- and y-coordinates represent the correlations of each gene with latent components 1 and 2, respectively. As shown in Figure 8b, the seven up-regulated DEGs involved in the glycolate oxidation, L-ascorbate oxidation, and oxalate acetylation pathways clustered on the left side of the plot, indicating a strong negative correlation with latent component 1 and a positive correlation with oxalate content. Their correlation coefficients with oxalate ranged from 0.796 to 0.95. In contrast, the three down-regulated DEGs encoding oxalate oxidase were located in the lower-right region of the plot, indicating a strong positive correlation with latent component 1 and a negative correlation with oxalate levels, with correlation coefficients ranging from −0.51 to −0.60. Among the TF genes, two WRKY family members (geneYangtao2011235 and geneYangtao2007366) and one B3 family member (geneYangtao2001868) showed strong positive correlations with the up-regulated DEGs involved in the glycolate oxidation, L-ascorbate oxidation, and oxalate acetylation pathways. The correlation coefficients between these TF genes and the corresponding metabolic genes all exceeded 0.91. Conversely, one B3 family member (geneYangtao2000630), two MYB family members (geneYangtao2010995 and geneYangtao2006484), and one ERF family member (geneYangtao2017929) were highly correlated with the down-regulated DEGs encoding enzymes in the oxalate oxidation pathway, with correlation coefficients exceeding 0.96 for all three oxalate oxidase genes. Notably, the MYB family gene geneYangtao2007344 exhibited an exceptionally strong positive correlation with oxalate content, with a correlation coefficient of 0.99.
4. Discussion
To elucidate the physiological mechanisms underlying the progressive accumulation of oxalate during star fruit development, we selected the fruitlet and fruit expansion stages as experimental models because they differ significantly in both fruit size and oxalate content. Comparative transcriptome analysis was then performed to identify key genes associated with oxalate metabolism. Consistent with the findings of Zhong et al. [14], our results confirmed that oxalate content was significantly higher in fruits at the expansion stage than in those at the fruitlet stage. In addition, this study provides the first quantitative comparison of three oxalate metabolism-related organic acids, glycolate, L-ascorbate, and oxaloacetate, between the fruitlet and fruit expansion stages of sour-type star fruit. On a fresh weight basis, glycolate was present at concentrations comparable to those of oxalate, whereas oxaloacetate was detected at much lower levels. Comparative analysis further revealed a significant increase in L-ascorbate content and a marked decrease in glycolate content during the fruit expansion stage. These changes suggest that both glycolate and L-ascorbate are metabolically associated with the increased accumulation of oxalate during star fruit growth and development.
Transcriptome differential expression analysis showed that the up-regulated DEGs were significantly enriched in BPs related to protein biosynthesis and organic acid catabolism. These results suggest that star fruit at the fruit expansion stage is undergoing vigorous growth, with enhanced metabolic activity that promotes the conversion of organic acids into amino acids and proteins. The significant decrease in glycolate content observed during this stage, together with the marked upregulation of HAO, suggests that the oxidation of glycolate to glyoxylate is enhanced. Glyoxylate serves as an important precursor for the biosynthesis of serine and glycine, thereby supporting protein synthesis during rapid fruit growth. At the same time, glyoxylate can also act as a substrate for glycolate oxidase and be further oxidized to oxalate. Therefore, accelerated glycolate metabolism is likely to contribute directly to the substantial increase in oxalate accumulation observed in expanding star fruit. The glyoxylate cycle represents another potential source of oxalate that is closely associated with organic acid catabolism. However, no significant differential expression was detected for genes encoding enzymes involved in this pathway. Notably, the gene encoding isocitrate lyase (ICL, geneYangtao2005279), a key enzyme that catalyzes the conversion of isocitrate to glyoxylate, was excluded during transcriptome preprocessing because of its extremely low expression level. In addition to the glyoxylate cycle, oxaloacetate degradation mediated by oxaloacetate acetylhydrolase has been proposed as another potential pathway for oxalate biosynthesis and is the major route of oxalate production in fungi [36]. However, the enzymatic activity of oxaloacetate acetylhydrolase has been experimentally demonstrated only in extracts from sugar beet and spinach [37], and the corresponding genes encoding plant isoforms have not yet been cloned or molecularly characterized. Thus, even if such enzymes exist in A. carambola, in silico identification of oxaloacetate acetylhydrolase-encoding genes in the A. carambola genome could not be achieved via sequence homology-based bioinformatics approaches in this study. Therefore, the glyoxylate cycle does not appear to be the primary source of oxalate accumulation during fruit expansion. Although the potential contribution of the oxaloacetate degradation pathway warrants further investigation, the consistently low oxaloacetate content observed in this study suggests that oxaloacetate is unlikely to be a major precursor of oxalate accumulation in developing star fruit.
On the other hand, fruit development and expansion in star fruit require continuous remodeling of the cell wall in mesocarp cells through the coordinated disassembly and reconstruction of cell wall components. This process depends on cell wall loosening, one of the major mechanisms of which involves hydroxyl radicals generated during L-ascorbate oxidation. These hydroxyl radicals cleave structural polysaccharides within the cell wall, thereby promoting cell expansion [27,28]. Consistent with this mechanism, GO enrichment analysis identified the terms “cellular response to oxidative stress” and “cell redox homeostasis”, suggesting that hydroxyl radicals are actively involved in the expansion of star fruit mesocarp cells. Notably, L-ascorbate content increased significantly during the fruit expansion stage, accompanied by the upregulation of several genes involved in L-ascorbate metabolism, including VTC4, LAP, and MDAR. As a major substrate for hydroxyl radical production, the increased accumulation of L-ascorbate likely supports cell wall loosening during fruit expansion. Moreover, previous studies have demonstrated that L-ascorbate can be progressively oxidized to oxalate in plants [29,30,31]. Therefore, the high oxalate content observed in expanding star fruit is likely attributable, at least in part, to the oxidative degradation of L-ascorbate associated with cell expansion. Interestingly, if oxalate production increases as a consequence of L-ascorbate oxidation, one might expect a corresponding increase in the expression of genes encoding oxalate oxidase, the enzyme responsible for degrading extracellular oxalate. However, our transcriptome analysis showed that most members of the oxalate oxidase gene family exhibited no significant change in expression during fruit expansion, while three genes were significantly down-regulated. In addition to extracellular oxalate degradation, plants can metabolize intracellular oxalate through an acetylation pathway initiated by oxalyl-CoA synthetase (also referred to as oxalate-CoA ligase), ultimately converting oxalate into formate [32,33]. Nevertheless, the major genes encoding enzymes in the oxalate acetylation pathway did not exhibit significant differential expression. For example, the two genes encoding oxalate-CoA ligase, geneYangtao2017037 (log2FC = -0.34, padj = 0.53), and geneYangtao2012299 (log2FC = -0.96, padj = 0.42), as well as the gene encoding oxalyl-CoA decarboxylase, geneYangtao2006727 (log2FC = 0.326, padj = 0.53), were not significantly differentially expressed. Only FDH was identified as a DEG. Together with the GO enrichment result showing significant enrichment of the term “organic acid transmembrane transport”, these findings suggest that star fruit preferentially retains oxalate produced through multiple metabolic pathways rather than actively degrading it. This retention is likely achieved through the transport and sequestration of oxalate into crystal idioblasts, thereby preventing excessive oxalate accumulation in normal mesocarp cells [34]. In addition, as a strong organic acid, oxalate accumulation may contribute to acidification of the apoplastic environment. This hypothesis is supported by the enrichment of the MF term “proton channel activity”, indicating active proton transport across cellular membranes during the fruit expansion stage. We therefore propose that elevated oxalate levels contribute to the regulation of apoplastic pH. Because an acidic apoplastic environment is a key prerequisite for cell wall loosening [35], oxalate may play an important physiological role in promoting cell expansion during star fruit development.
The down-regulated DEGs were predominantly enriched in BPs associated with disease resistance and stress responses, suggesting that star fruit at the fruit expansion stage experiences relatively low levels of biotic and abiotic stress. This observation is consistent with field cultivation experience, in which fruits at this developmental stage are generally less susceptible to disease. One possible explanation is that their elevated oxalate content reduces their palatability to herbivores and other pests. Among the enriched MF terms, several were related to calcium signaling and transport, including “P-type calcium transporter activity”, “calcium ion transmembrane transporter activity”, “calmodulin binding”, “calcium-dependent protein kinase activity”, and “calmodulin-dependent protein kinase activity”. The enrichment of these terms suggests that the high-oxalate environment in expanding star fruit may reduce the availability of free calcium ions, thereby suppressing the activity of calcium-dependent proteins and signaling pathways. Calcium ions are known to play important physiological roles in cell expansion and development. For example, they are essential regulators of polarized cell growth in root hairs [38]. However, because the physiological processes governing fruit mesocarp expansion differ from those of specialized cell types, the functional relationships among calcium ions, oxalate, reactive oxygen species (ROS), and L-ascorbate during star fruit cell expansion remain poorly understood and warrant further investigation.
By predicting TFBS frequencies in the upstream regulatory regions of DEGs and analyzing gene expression correlations using PLS, this study preliminarily investigated the potential regulatory mechanisms controlling the expression of ten known oxalate metabolism-related DEGs during star fruit development. The results suggest that TFs belonging to the WRKY and B3 families may contribute to the upregulation of key enzyme-encoding genes involved in the glycolate oxidation and L-ascorbate oxidation pathways. Although no direct regulatory relationships between these TFs and plant oxalate accumulation have been reported to date, previous studies have shown that WRKY TFs participate in physiological processes associated with cell expansion in Torreya grandis [39]. In addition, VvFUS3, a member of the B3 TF family, has been reported to promote cell proliferation and expansion [40]. Therefore, the key enzyme-encoding genes involved in these two oxalate biosynthetic pathways may be co-regulated by WRKY and B3 family TFs, thereby collectively contributing to mesocarp cell expansion during star fruit development. In contrast, the reduced expression of the three oxalate oxidase-encoding genes may be associated with the decreased expression of two MYB family members (geneYangtao2010995 and geneYangtao2006484), one ERF family member (geneYangtao2017929), and one B3 family member (geneYangtao2000630). However, these predicted upstream-downstream regulatory relationships require further experimental validation. Notably, “jasmonic acid metabolic process” and “salicylic acid binding” were identified as significantly enriched terms in the GO analysis of down-regulated genes, corresponding to the BP and MF categories, respectively. Jasmonic acid and salicylic acid are key phytohormones involved in regulating plant stress responses and immunity [41], while MYB family TFs function as important downstream regulators within these signaling pathways [42]. This observation is consistent with the reduced activation of pathogen defense responses observed in star fruit during the fruit expansion stage. It also suggests that the downregulation of oxalate oxidase genes may be regulated by stress- and immunity-associated signaling pathways, resulting in their sustained repression during this developmental stage. Furthermore, previous studies have demonstrated that plants can activate multiple TFs, including MYB family members, under fungal pathogen infection to promote calcium oxalate formation [43]. However, whether this regulatory mechanism is directly associated with cellular expansion processes during star fruit enlargement remains to be elucidated.
5. Conclusions
In summary, this study demonstrates that oxalate accumulation during the fruit expansion stage of A. carambola is primarily attributed to enhanced glycolate oxidation and oxidative degradation of L-ascorbate. These processes contribute to cell wall loosening and facilitate cell expansion during fruit development. Our findings suggest a potential physiological role in regulating cell expansion and conversion between glycolate and amino acids for oxalate in star fruit, thereby addressing the knowledge gap regarding the mechanism underlying the progressive increase in oxalate content during fruit growth. This study provides a theoretical foundation for the future development of strategies to regulate oxalate accumulation in star fruit and offers new insights into the physiological functions of oxalate in plants, particularly in fruit crops.
Supplementary Materials
The following supporting information can be downloaded at the website of this paper posted on Preprints.org.
Author Contributions
Ying Liu is responsible for the conceiving, designing the experiments and drafting the manuscript. Junan Zhou and Yangfan Zhu are responsible for the sampling and homogenization of star fruits, qRT-PCR validation experiment as well as determination of L-ascorbate content. Ganhui Mo is responsible for the oxalate, glycolate and oxaloacetate content determination via HPLC, including the preparation of samples before detect. Ying Liu is responsible for bioinformatics analysis. Haojun Chen is responsible for the assistance in agronomics of star fruit. Ganlin Chen is responsible for supervision, conceptualization and methodology.
Funding
This work was supported by Guangxi Academy of Agricultural Sciences Technology Development Fund (GUINONGKE2024ZX02) and the earmarked fund for the China Agriculture Research System Guangxi Innovation Team—Specialty Fruits (nycytxgxcxtd-2024-17).
Conflicts of Interest
The authors declare that they have no known competing financial interests or personal relationships that could have appeared to influence the work reported in this paper.
Abbreviation
A. carambola: Averrhoa carambola L.; DAF: days after flowering; HPLC: High Performance Liquid Chromatography; HCl: hydrochloric acid; cDNA: complementary DNA; PCR: Polymerase Chain Reaction; qRT-PCR: quantitative Reverse Transcription-PCR; MAD: median absolute deviation; PCA: principal component analysis; DEGs: Differentially expressed genes; padj: adjusted p-value; log2FC: log2 fold change; PLS-DA: Partial Least Squares Discriminant Analysis; PLS: Partial Least Squares; VIP: Variable Importance in Projection; GO: Gene Ontology; KEGG: Kyoto Encyclopedia of Genes and Genomes; TFBS: Transcription Factor Binding Site; GAPDH: Glyceraldehyde-3-phosphate dehydrogenase; ANOVA: one-way analysis of variance; QC: Quality Check; PC: Principle Component; VTC4: L-galactose-1-phosphate phosphatase; LAP: L-ascorbate peroxidase; MDAR: monodehydroascorbate reductase; HAO: (S)-2-hydroxy acid oxidase; HRP2: Hydroxypyruvate reductase; FDH: formate dehydrogenase; OXO: oxalate oxidase; BP: biological processes; CC: cellular components; MF: molecular functions; Dof: DNA binding with one finger; ERF: ethylene response factor; MYB: v-myb avian myeloblastosis viral oncogene homolog; WRKY: WRKY transcription factor family; ICL: isocitrate lyase; ROS: reactive oxygen species
References
- Siener, R.; Hönow, R.; Seidler, A.; Voss, S.; Hesse, A. Oxalate contents of species of the Polygonaceae, Amaranthaceae and Chenopodiaceae families. Food Chem. 2006, 98, 220–224. [Google Scholar] [CrossRef]
- Libert, B.; Franceschi, V.R. Oxalate in crop plants. J. Agric. Food Chem. 1987, 35, 926–938. [Google Scholar] [CrossRef]
- Crivelli, J.J.; Mitchell, T.; Knight, J.; Wood, K.D.; Assimos, D.G.; Holmes, R.P.; Fargue, S. Contribution of Dietary Oxalate and Oxalate Precursors to Urinary Oxalate Excretion. Nutrients 2021, 13, 62. [Google Scholar] [CrossRef] [PubMed]
- Dhara, J.; Saha, S.K.; Saha, P.S.; Chakraborty, R. Star Fruit (Averrhoea Carambola): Exploring its Nutritional Value, Health Benefits, and Consideration for Potential Risk and Future Application in Biotechnology and Medicine. Curr. Pharmacol. Rep. 2024, 11, 7. [Google Scholar] [CrossRef]
- Sarkar, T.; Salauddin, M.; Roy, A.; Sharma, N.; Sharma, A.; Yadav, S.; Jha, V.; Rebezov, M.; Khayrullin, M.; Thiruvengadam, M.; et al. Minor tropical fruits as a potential source of bioactive and functional foods. Crit. Rev. Food Sci. Nutr. 2023, 63, 6491–6535. [Google Scholar] [CrossRef] [PubMed]
- Vargas-Madriz, Á.F.; Kuri-GarcÍA, A.; Vargas-Madriz, H.; ChÁVez-ServÍN, J.L.; Ayala-Tirado, R.A. Phenolic profile and antioxidant capacity of fruit Averrhoa carambola L.: a review. Food Sci. Technol. 2022, 42. [Google Scholar] [CrossRef]
- Hönow, R.; Hesse, A. Comparison of extraction methods for the determination of soluble and total oxalate in foods by HPLC-enzyme-reactor. Food Chem. 2002, 78, 511–521. [Google Scholar] [CrossRef]
- Nguyễn, H.V.H.; Savage, G.P. Oxalate content of New Zealand grown and imported fruits. J. Food Compos. Anal. 2013, 31, 180–184. [Google Scholar] [CrossRef]
- Herath, N.; Kodithuwakkuh, G.; Dissanayake, T.; Rathnathunga, N.; Weerakoon, K. Acute Kidney Injury Following Star Fruit Ingestion: A Case Series. Wildern. Environ. Med. 2021, 32, 98–101. [Google Scholar] [CrossRef] [PubMed]
- Wijayaratne, D.R.; Bavanthan, V.; de Silva, M.V.C.; Nazar, A.L.M.; Wijewickrama, E.S. Star fruit nephrotoxicity: a case series and literature review. BMC Nephrol. 2018, 19, 288. [Google Scholar] [CrossRef] [PubMed]
- Fang, H.-C.; Chen, C.-L.; Lee, P.-T.; Hsu, C.-Y.; Tseng, C.-J.; Lu, P.-J.; Lai, S.-L.; Chung, H.-M.; Chou, K.-J. The role of oxalate in star fruit neurotoxicity of five-sixths nephrectomized rats. Food Chem. Toxicol. 2007, 45, 1764–1769. [Google Scholar] [CrossRef] [PubMed]
- Yasawardene, P.; Jayarajah, U.; De Zoysa, I.; Seneviratne, S.L. Mechanisms of star fruit (Averrhoa carambola) toxicity: A mini-review. Toxicon 2020, 187, 198–202. [Google Scholar] [CrossRef] [PubMed]
- Yasawardene, P.; Jayarajah, U.; De Zoysa, I.; Seneviratne, S.L. Nephrotoxicity and neurotoxicity following star fruit (Averrhoa carambola) ingestion: a narrative review. Trans. R. Soc. Trop. Med. Hyg. 2021, 115, 947–955. [Google Scholar] [CrossRef] [PubMed]
- Zhong, Y.; Jiang, N.; Jiang, B.; Liu, Y.; Zheng, J.; Yi, G. Distribution and Change of the Oxalic Acid Content in Carambola Fruit. Chin. J. Trop. Crops 2011, 32, 83–85. Available online: https://www.rdzwxb.com/CN/Y2011/V32/I1/83.
- Li, P.; Liu, C.; Luo, Y.; Shi, H.; Li, Q.; PinChu, C.; Li, X.; Yang, J.; Fan, W. Oxalate in Plants: Metabolism, Function, Regulation, and Application. J. Agric. Food Chem. 2022, 70, 16037–16049. [Google Scholar] [CrossRef] [PubMed]
- Mo, G.; Zhu, Y.; Usman, R.; Lu, Q.; Meng, K.; Dai, X.; Chen, S.; Chen, H.; Ou, J.; Liu, Y. Multi-Variety Transcriptomic Analysis Identifies Oxalate Oxidation as Key Pathway Driving High Oxalate Levels in Sour-Type Star Fruit. Trop. Plant Biol. 2026, 19. [Google Scholar] [CrossRef]
- Xu, X.; Xu, L.; Yang, Z.; Chen, L.; Wang, Y.; Ren, H.; Zhang, Z.; El-Kassaby, Y.A.; Wu, S. Identification of key gene networks controlling organic acid and sugar metabolism during star fruit (Averrhoa carambola) development. BMC Plant Biol. 2024, 24, 943. [Google Scholar] [CrossRef] [PubMed]
- Cai, X.; Ge, C.; Xu, C.; Wang, X.; Wang, S.; Wang, Q. Expression Analysis of Oxalate Metabolic Pathway Genes Reveals Oxalate Regulation Patterns in Spinach. Molecules 2018, 23, 1286. [Google Scholar] [CrossRef] [PubMed]
- Joshi, V.; Penalosa, A.; Joshi, M.; Rodriguez, S. Regulation of Oxalate Metabolism in Spinach Revealed by RNA-Seq-Based Transcriptomic Analysis. Int. J. Mol. Sci. 2021, 22. [Google Scholar] [CrossRef] [PubMed]
- Al-Wahsh, I.A.; Wu, Y.; Liebman, M. A comparison of two extraction methods for food oxalate assessment. J. Food Res. 2012, 1, 233. [Google Scholar] [CrossRef]
- Wilson, C.W., III; Shaw, P.E.; Knight, R.J., Jr. Analysis of oxalic acid in carambola (Averrhoa carambola L.) and spinach by high-performance liquid chromatography. J. Agric. Food Chem. 1982, 30, 1106–1108. [Google Scholar] [CrossRef]
- Tarrago-Trani, M.T.; Phillips, K.M.; Cotty, M. Matrix-specific method validation for quantitative analysis of vitamin C in diverse foods. J. Food Compos. Anal. 2012, 26, 12–25. [Google Scholar] [CrossRef]
- Love, M.I.; Huber, W.; Anders, S. Moderated estimation of fold change and dispersion for RNA-seq data with DESeq2. Genome Biol. 2014, 15. [Google Scholar] [CrossRef] [PubMed]
- Rohart, F.; Gautier, B.; Singh, A.; Lê Cao, K.-A. mixOmics: An R package for ‘omics feature selection and multiple data integration. PLoS Comput. Biol. 2017, 13, e1005752. [Google Scholar] [CrossRef] [PubMed]
- Mangiola, S.; Papenfuss, A. tidyHeatmap: an R package for modular heatmap production based on tidy principles. J. Open Source Softw. 2020, 5. [Google Scholar] [CrossRef]
- Tian, F.; Yang, D.; Meng, Y.; Jin, J.; Gao, g. PlantRegMap: charting functional regulatory maps in plants. Nucleic Acids Res. 2020, 48, D1104–D1113. [Google Scholar] [CrossRef] [PubMed]
- FRY, S.C. Oxidative scission of plant cell wall polysaccharides by ascorbate-induced hydroxyl radicals. Biochem. J. 1998, 332, 507–515. [Google Scholar] [CrossRef] [PubMed]
- Schopfer, P. Hydroxyl radical-induced cell-wall loosening in vitro and in vivo: implications for the control of elongation growth. Plant J. 2001, 28, 679–688. [Google Scholar] [CrossRef] [PubMed]
- Parsons, H.T.; Fry, S.C. Oxidation of dehydroascorbic acid and 2,3-diketogulonate under plant apoplastic conditions. Phytochemistry 2012, 75, 41–49. [Google Scholar] [CrossRef] [PubMed]
- Horner, H.T.; Kausch, A.P.; Wagner, B.L. Ascorbic acid:: A precursor of oxalate in crystal idioblasts of Yucca torreyi in liquid root culture. Int. J. Plant Sci. 2000, 161, 861–868. [Google Scholar] [CrossRef]
- Green, M.A.; Fry, S.C. Vitamin C degradation in plant cells via enzymatic hydrolysis of 4-O-oxalyl-l-threonate. Nature 2005, 433, 83–87. [Google Scholar] [CrossRef] [PubMed]
- Foster, J.; Kim, H.U.; Nakata, P.A.; Browse, J. A Previously Unknown Oxalyl-CoA Synthetase Is Important for Oxalate Catabolism in Arabidopsis. Plant Cell 2012, 24, 1217–1229. [Google Scholar] [CrossRef] [PubMed]
- Foster, J.; Luo, B.; Nakata, P.A. An Oxalyl-CoA Dependent Pathway of Oxalate Catabolism Plays a Role in Regulating Calcium Oxalate Crystal Accumulation and Defending against Oxalate-Secreting Phytopathogens in Medicago truncatula. PLoS ONE 2016, 11, e0149850. [Google Scholar] [CrossRef] [PubMed]
- Ermer, T.; Nazzal, L.; Tio, M.C.; Waikar, S.; Aronson, P.S.; Knauf, F. Oxalate homeostasis. Nat. Rev. Nephrol. 2023, 19, 123–138. [Google Scholar] [CrossRef] [PubMed]
- Rayle, D.L.; Cleland, R.E. The Acid Growth Theory of auxin-induced cell elongation is alive and well. Plant Physiol. 1992, 99, 1271–1274. [Google Scholar] [CrossRef] [PubMed]
- Liang, X.F.; Liberti, D.; Li, M.Y.; Kim, Y.T.; Hutchens, A.; Wilson, R.; Rollins, J.A. Oxaloacetate acetylhydrolase gene mutants of Sclerotinia sclerotiorum do not accumulate oxalic acid, but do produce limited lesions on host plants. Mol. Plant Pathol. 2015, 16, 559–571. [Google Scholar] [CrossRef] [PubMed]
- Chang, C.-C.; Beevers, H. Biogenesis of Oxalate in Plant Tissues. Plant Physiol. 1968, 43, 1821–1828. [Google Scholar] [CrossRef] [PubMed]
- Zhang, X.; Bian, A.; Li, T.; Ren, L.; Li, L.; Su, Y.; Zhang, Q. ROS and calcium oscillations are required for polarized root hair growth. Plant Signal. Behav. 2022, 17, 2106410. [Google Scholar] [CrossRef] [PubMed]
- Li, X.; Liu, Z.; Liu, Y.; Yan, J.; Suo, J.; Yu, W.; Wu, J.; Yan, J. TgWRKY25-TgSBP1 module promotes cell expansion in Torreya grandis cones. Ind. Crops Prod. 2026, 241, 122834. [Google Scholar] [CrossRef]
- Ahmad, B.; Zhang, S.; Yao, J.; Chai, S.; Yadav, V.; Athar, H.-u.-R.; Rahman, M.U.; Wang, L.; Wang, X. Ectopic expression of VvFUS3, B3-domain transcription factor, in tomato influences seed development via affecting endoreduplication and hormones. Hortic. Plant J. 2022, 8, 351–360. [Google Scholar] [CrossRef]
- Liu, Y.; Li, M.; Li, T.; Chen, Y.; Zhang, L.; Zhao, G.; Zhuang, J.; Zhao, W.; Gao, L.; Xia, T. Airborne fungus-induced biosynthesis of anthocyanins in Arabidopsis thaliana via jasmonic acid and salicylic acid signaling. Plant Sci. 2020, 300, 110635. [Google Scholar] [CrossRef] [PubMed]
- Htun, A.A.; Wang, Y.; Liu, J.; Guo, Z.; Zheng, Y.; Wang, W.; Ma, S.; Jia, A.; Ren, Y.; Chen, F. MYB Factors: Hubs of Plant Stress and Hormone Crosstalk. Plant Biotechnol. J. 2026, n/a. [Google Scholar] [CrossRef] [PubMed]
- Bishi, S.K.; Ranjan, A.; Pradhan, B.; Manik, S.; Vakharia, D. Defense to Sclerotium rolfsii in groundnut (Arachis hypogaea L.) is associated with vascular tissue compactness and expression of genes coding for pathogenesis-related (PR) proteins. 3 Biotech. 2025, 15, 44. [Google Scholar] [CrossRef] [PubMed]
Figure 1.
Overview of oxalate accumulation mechanism during fruit growth in star fruit.
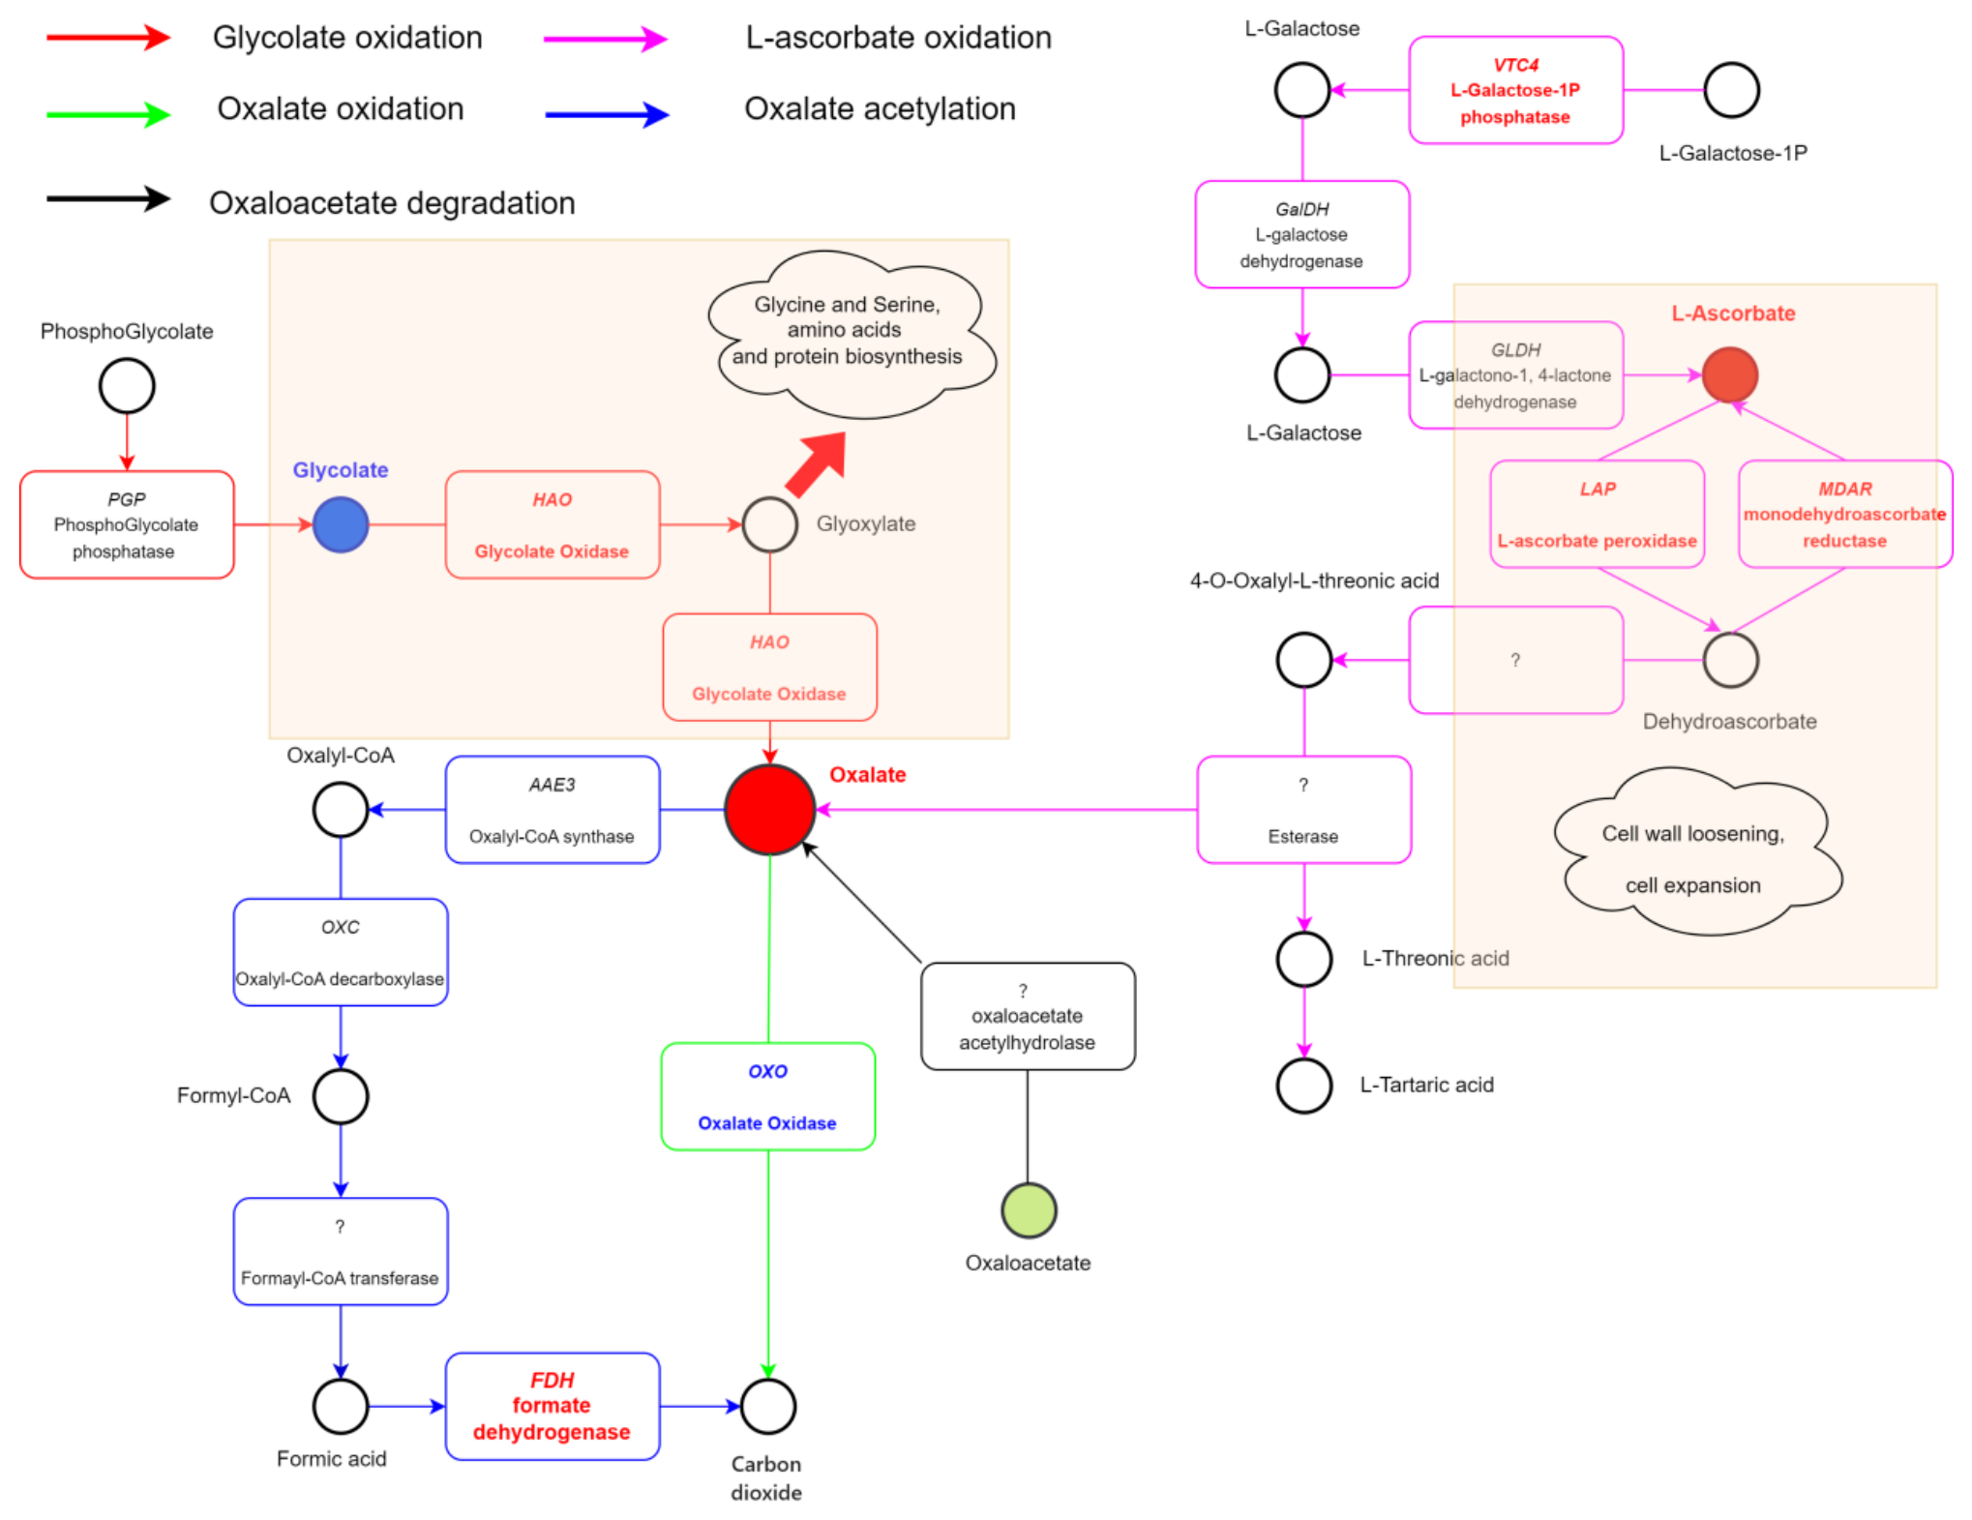
Figure 2.
Star fruit sampling and content of oxalate, glycolate, oxaloacetate and L-ascorbate. a. Star fruit at fruitlet and expanding stages; b. FW of oxalate, glycolate, oxaloacetate and L-ascorbate at fruitlet and expanding stages. ***: p-value < 0.001; ****: p-value < 0.0001.
Figure 2.
Star fruit sampling and content of oxalate, glycolate, oxaloacetate and L-ascorbate. a. Star fruit at fruitlet and expanding stages; b. FW of oxalate, glycolate, oxaloacetate and L-ascorbate at fruitlet and expanding stages. ***: p-value < 0.001; ****: p-value < 0.0001.
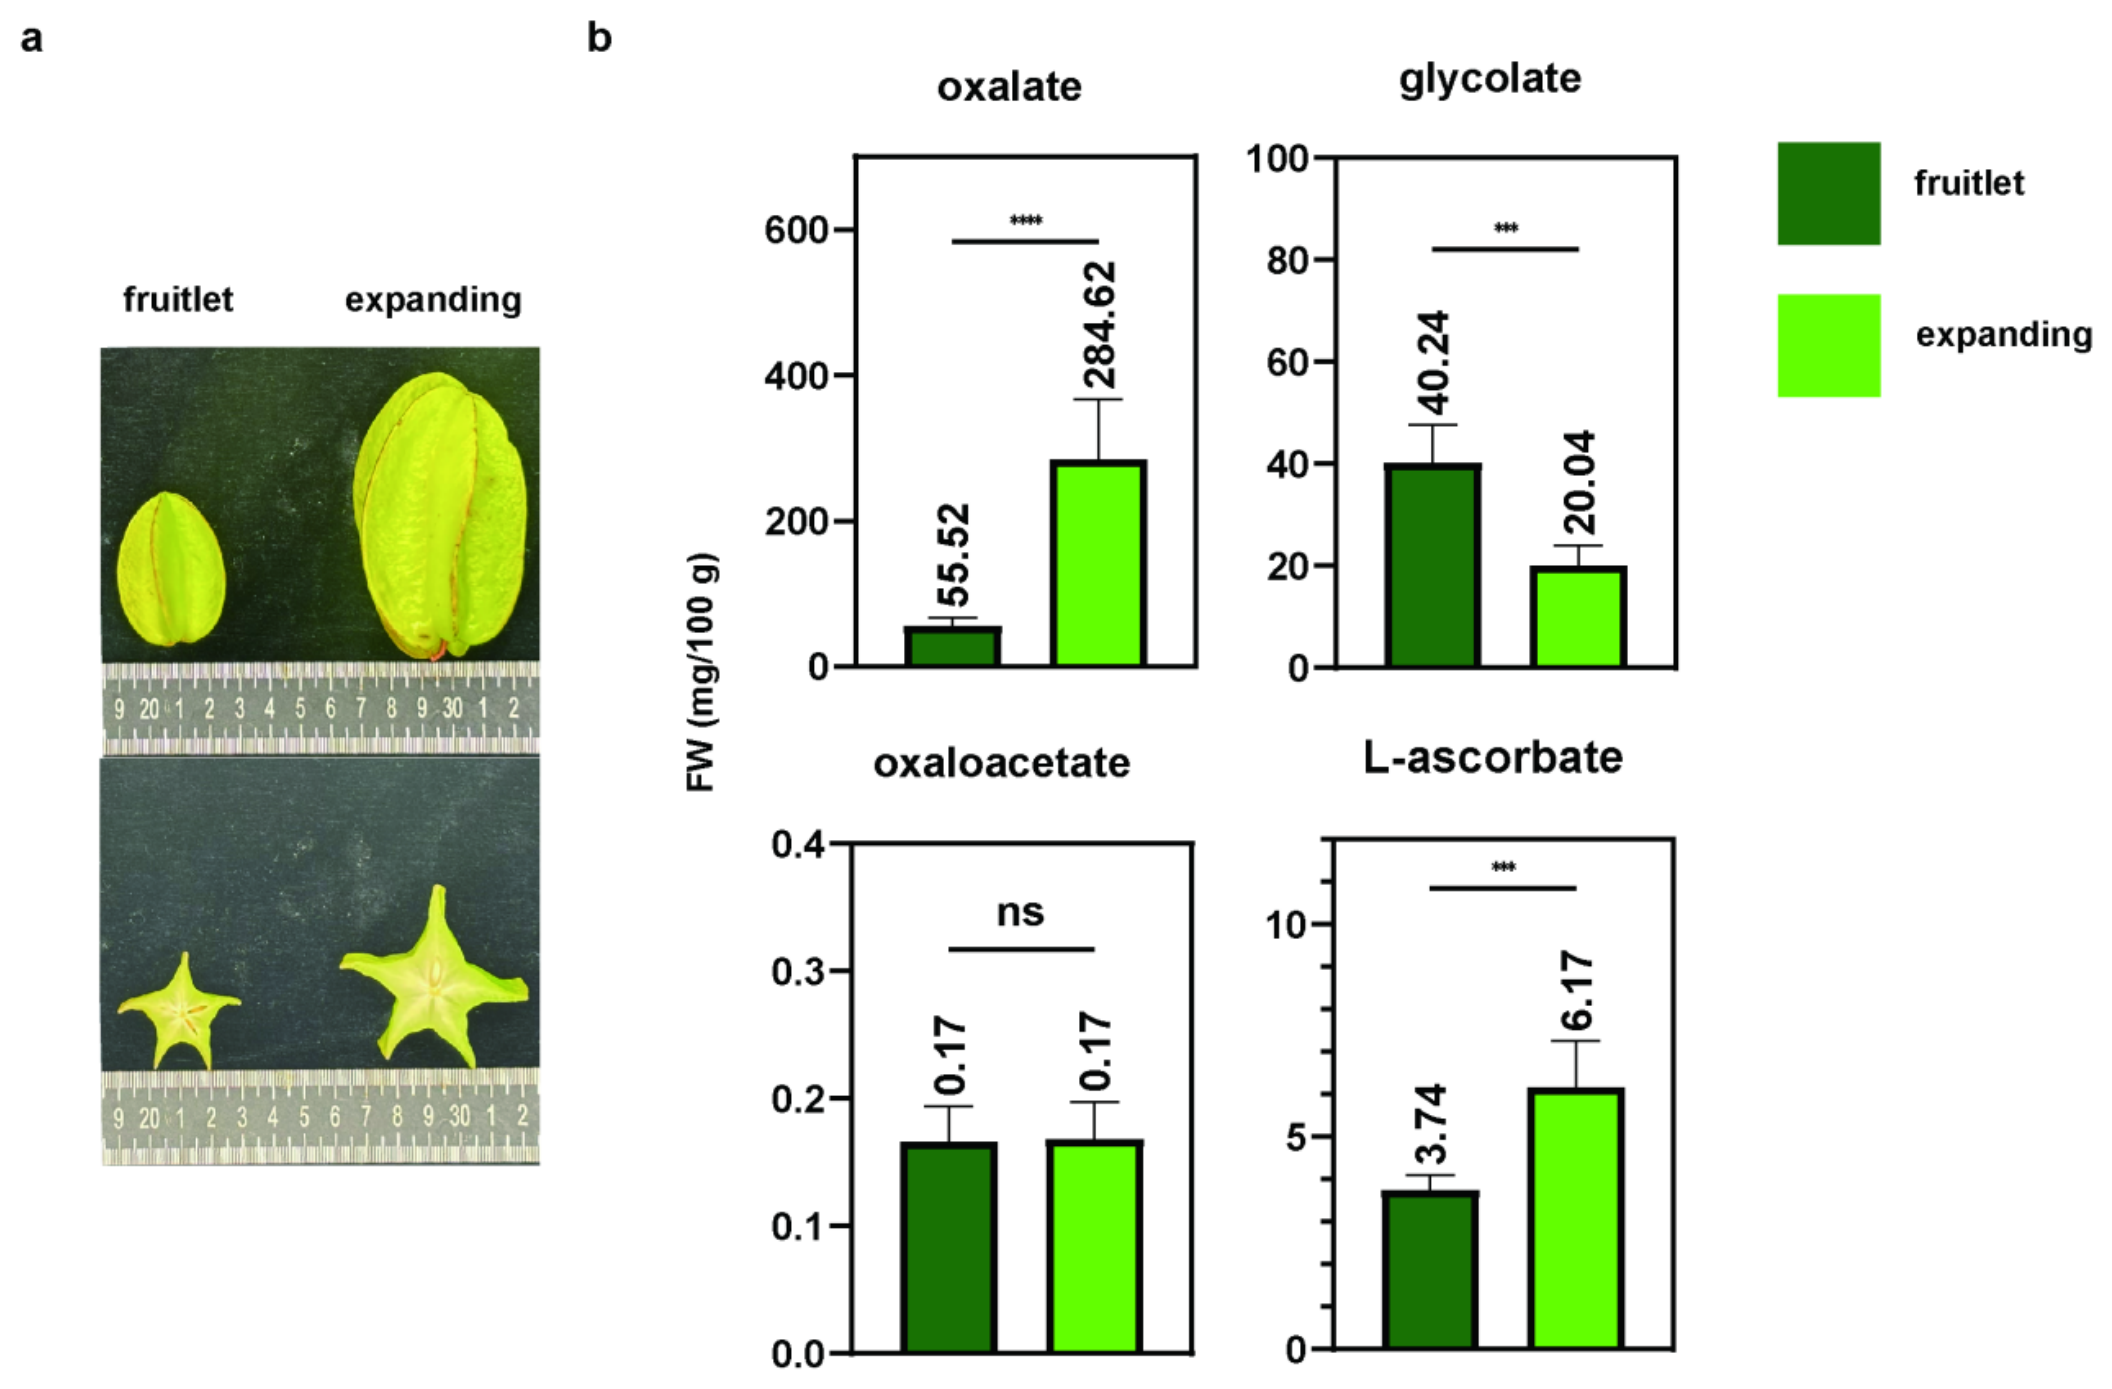
Figure 3.
PCA and PLS-DA of transcriptomic dataset.
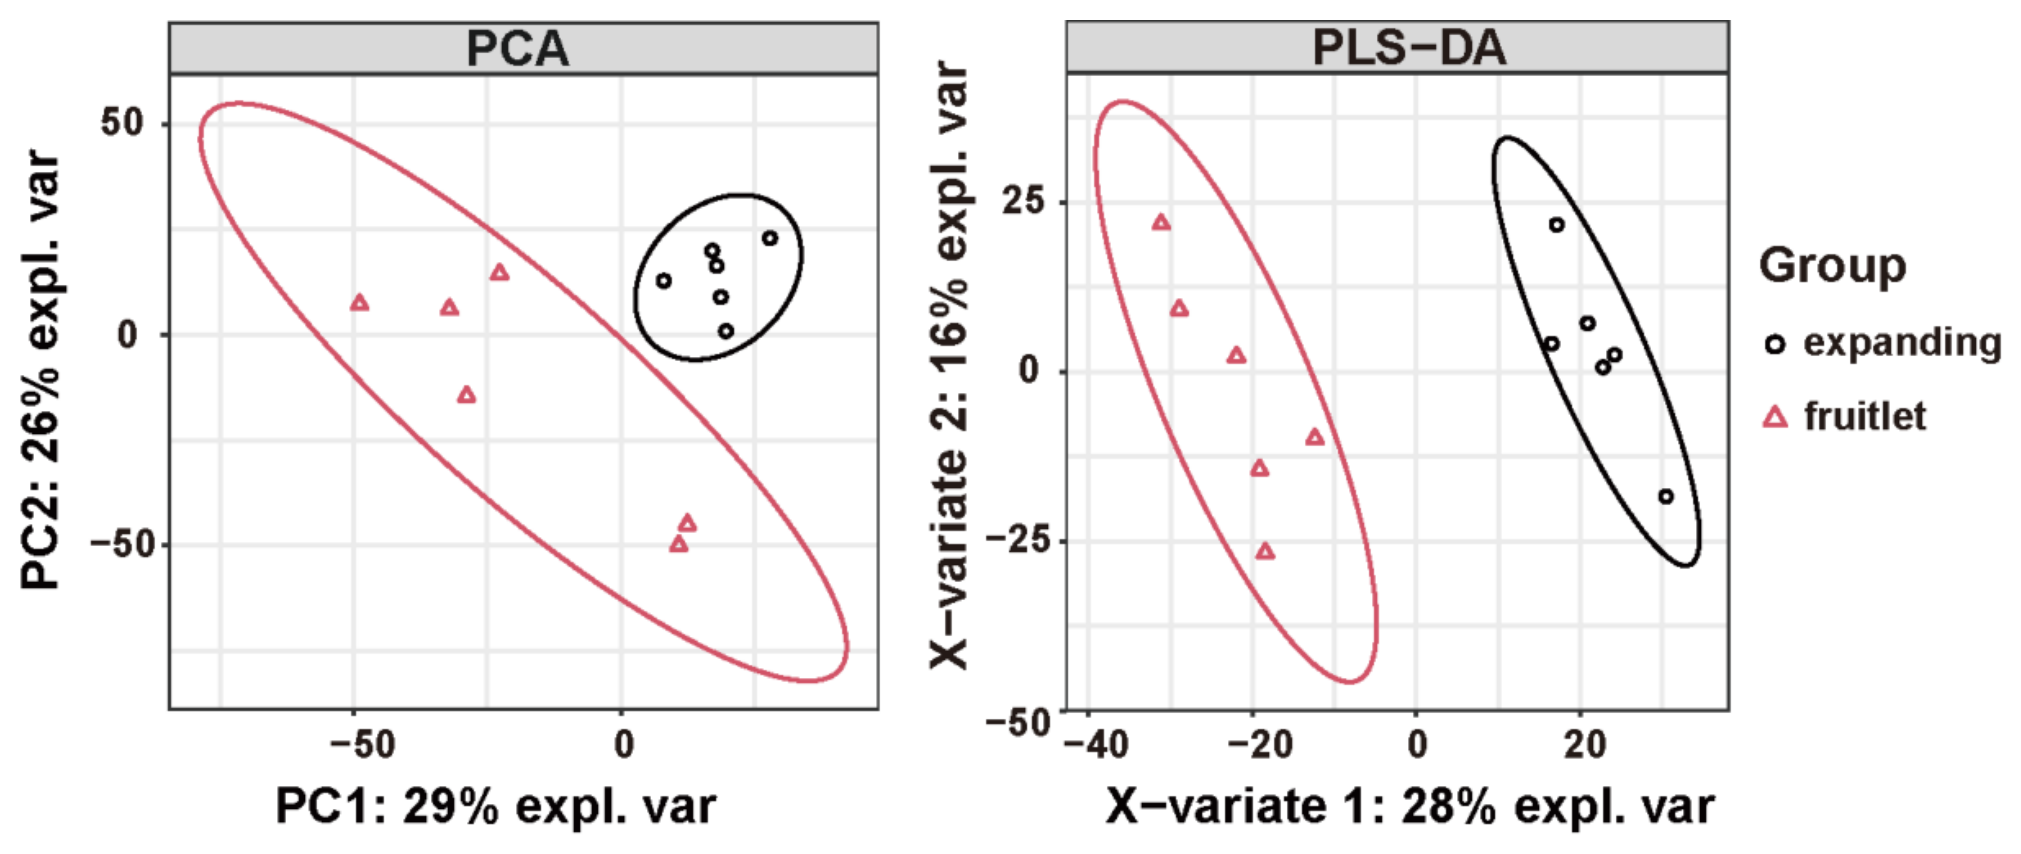
Figure 4.
DEGs discovery (expanding vs fruitlet). a. Volcano plot of DEGs; b. Heatmap plot of DEGs across samples; c. qRT-PCR validation of seven DEGs. In the visualization, symbols highlighted in red denote up-regulated DEGs, while those in blue denote down-regulated DEGs.
Figure 4.
DEGs discovery (expanding vs fruitlet). a. Volcano plot of DEGs; b. Heatmap plot of DEGs across samples; c. qRT-PCR validation of seven DEGs. In the visualization, symbols highlighted in red denote up-regulated DEGs, while those in blue denote down-regulated DEGs.
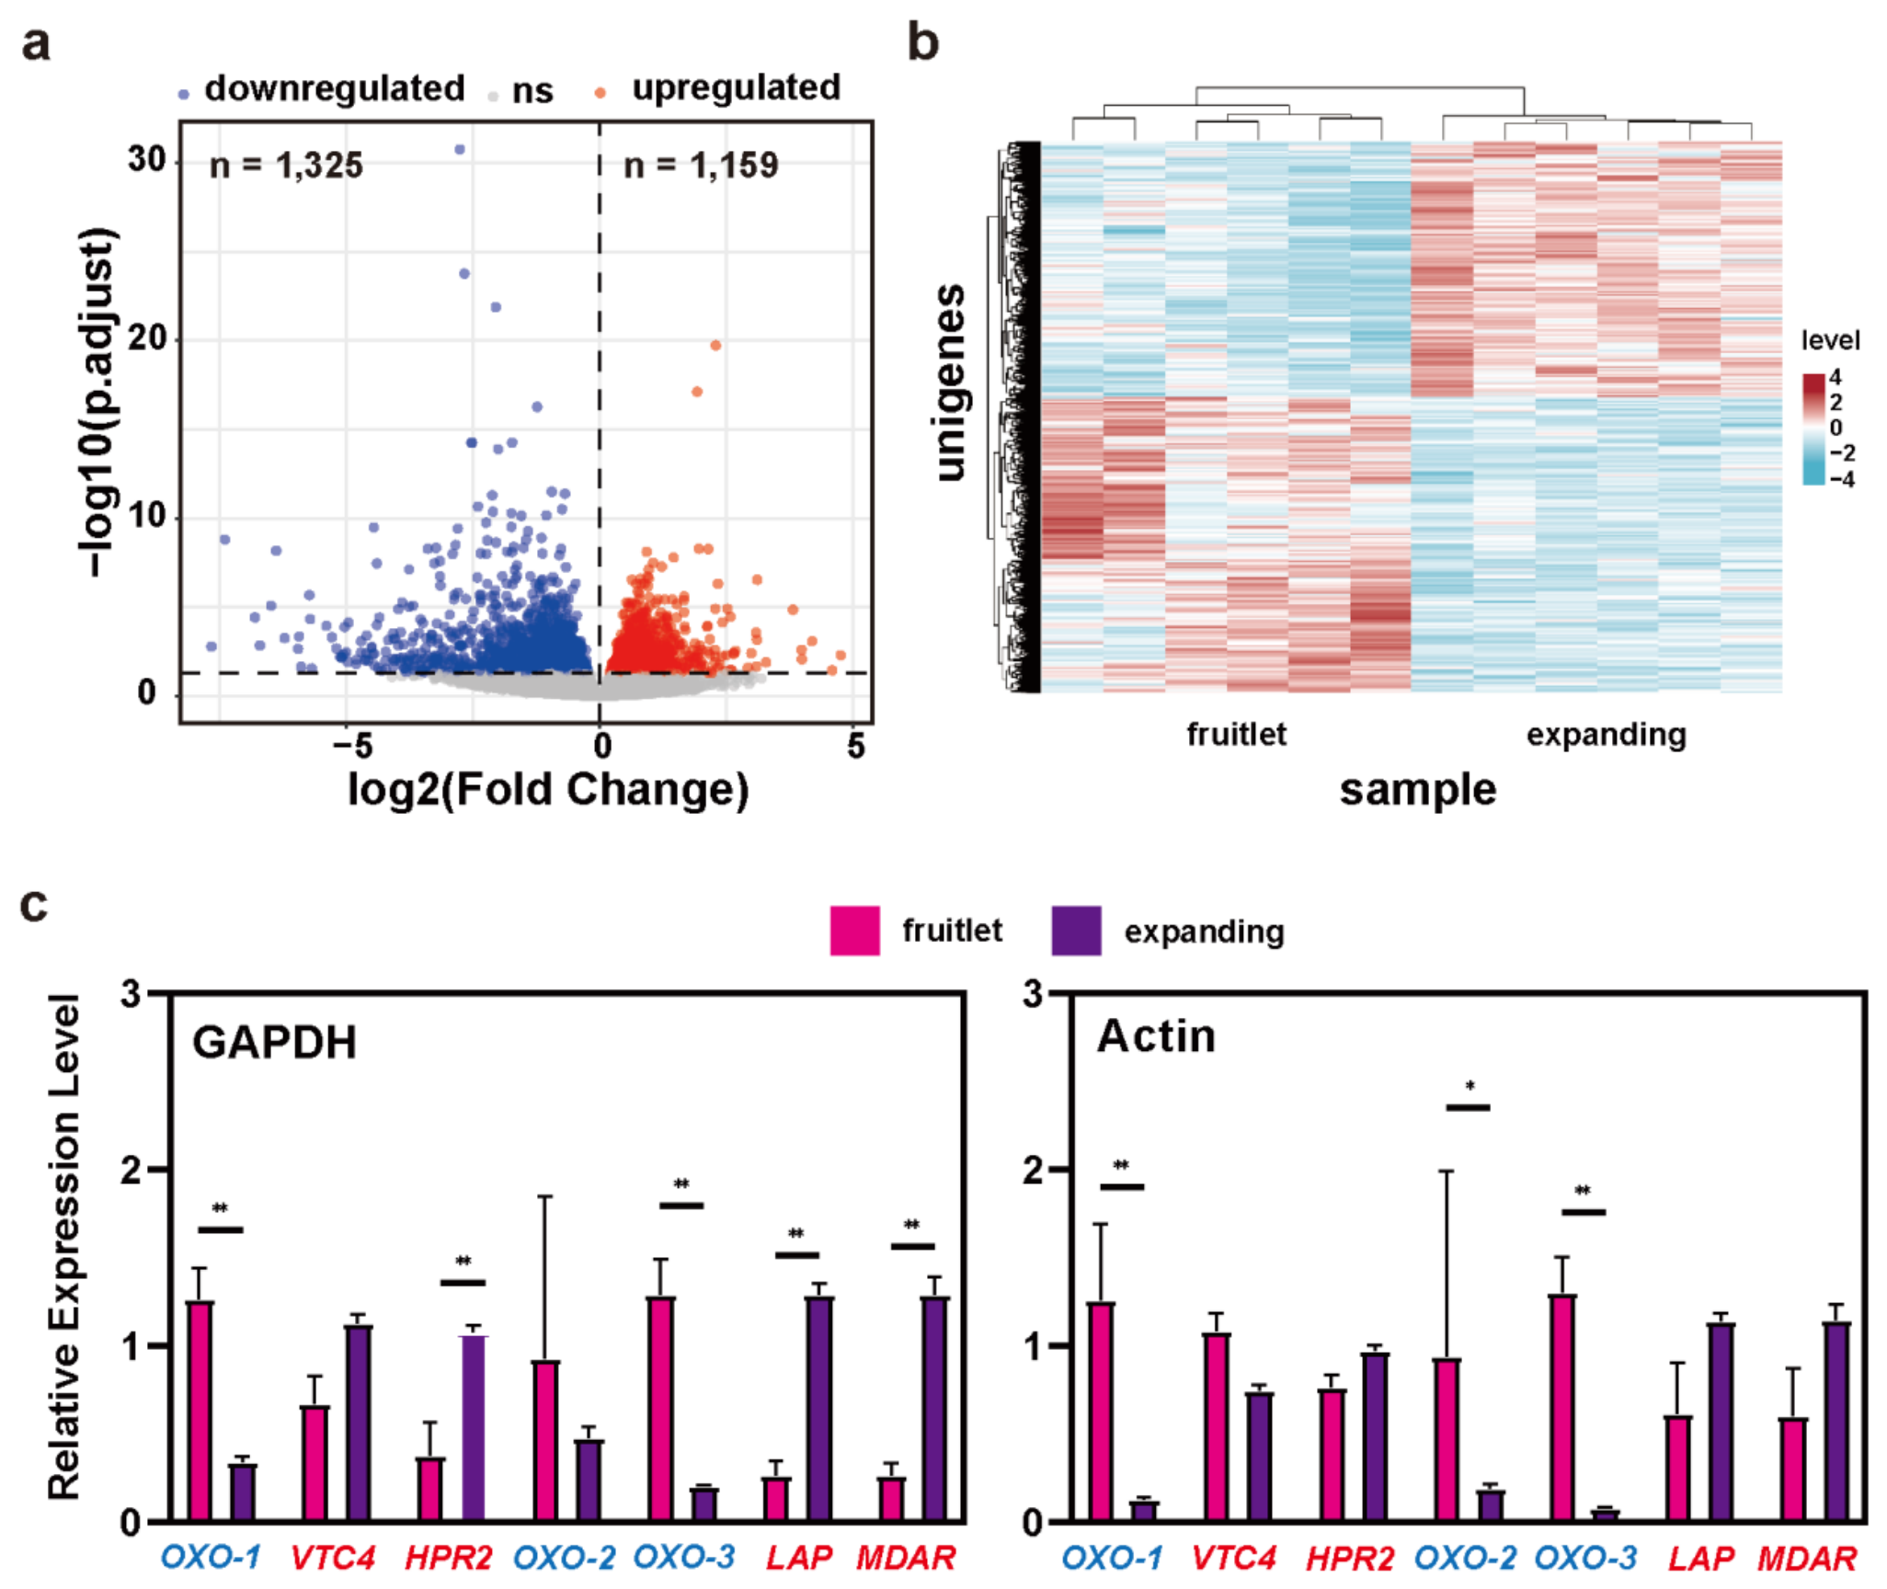
Figure 5.
GO and KEGG enrichment of significantly up-regulated DEGs. a. BP terms; b. CC terms; c. MF terms; d. KEGG terms.
Figure 5.
GO and KEGG enrichment of significantly up-regulated DEGs. a. BP terms; b. CC terms; c. MF terms; d. KEGG terms.
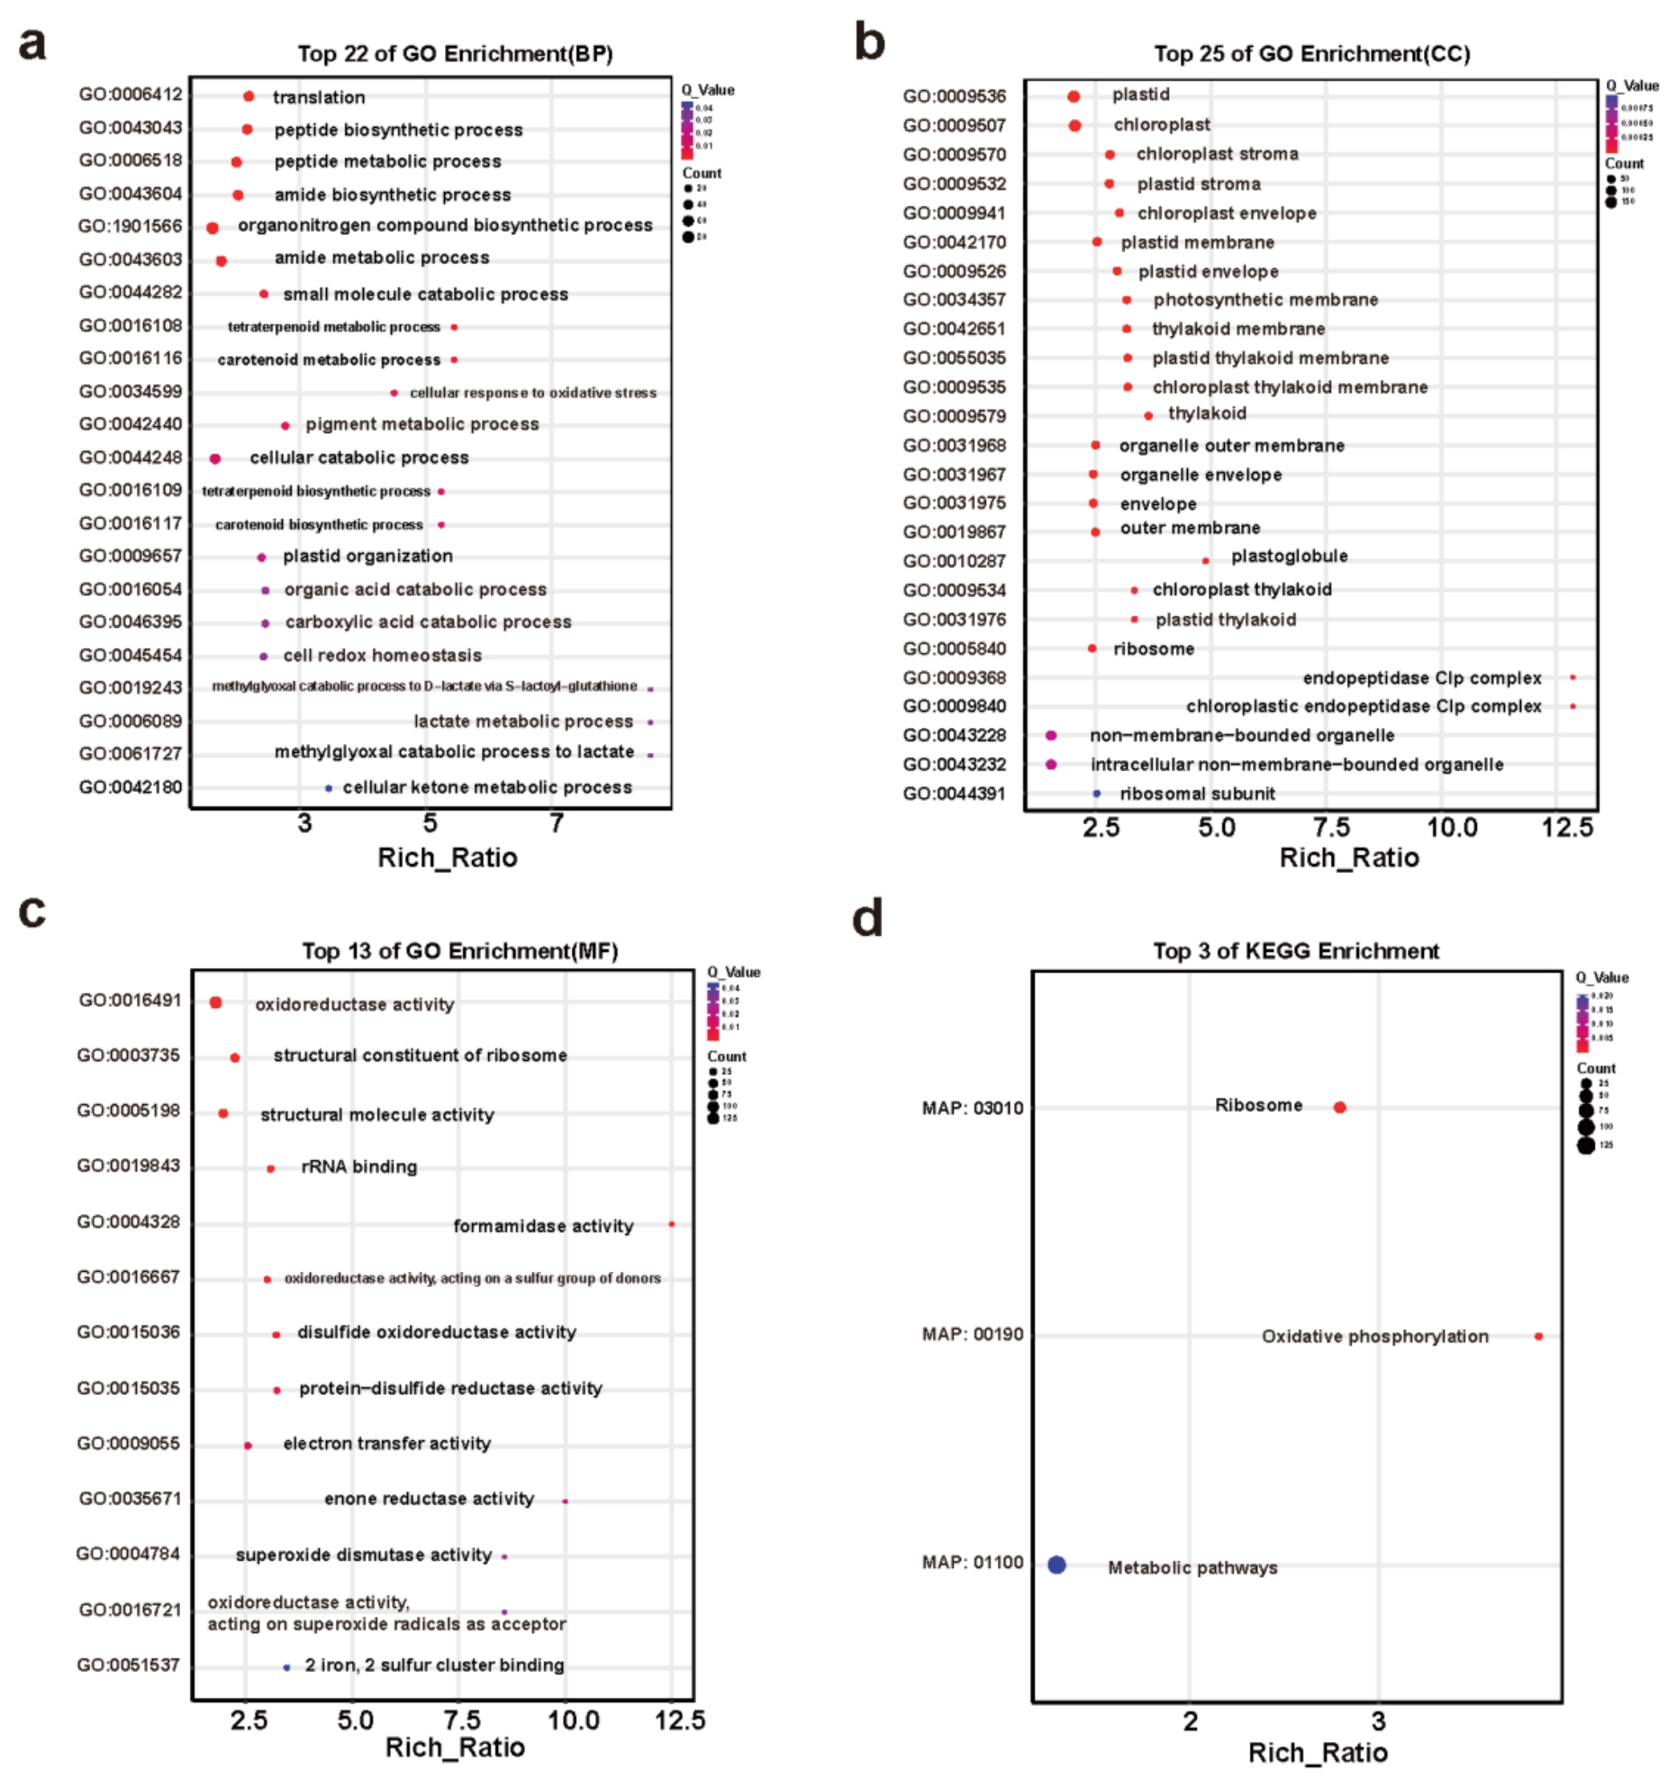
Figure 6.
GO and KEGG enrichment of significantly down-regulated DEGs. a. BP terms; b. CC terms; c. MF terms; d. KEGG terms.
Figure 6.
GO and KEGG enrichment of significantly down-regulated DEGs. a. BP terms; b. CC terms; c. MF terms; d. KEGG terms.
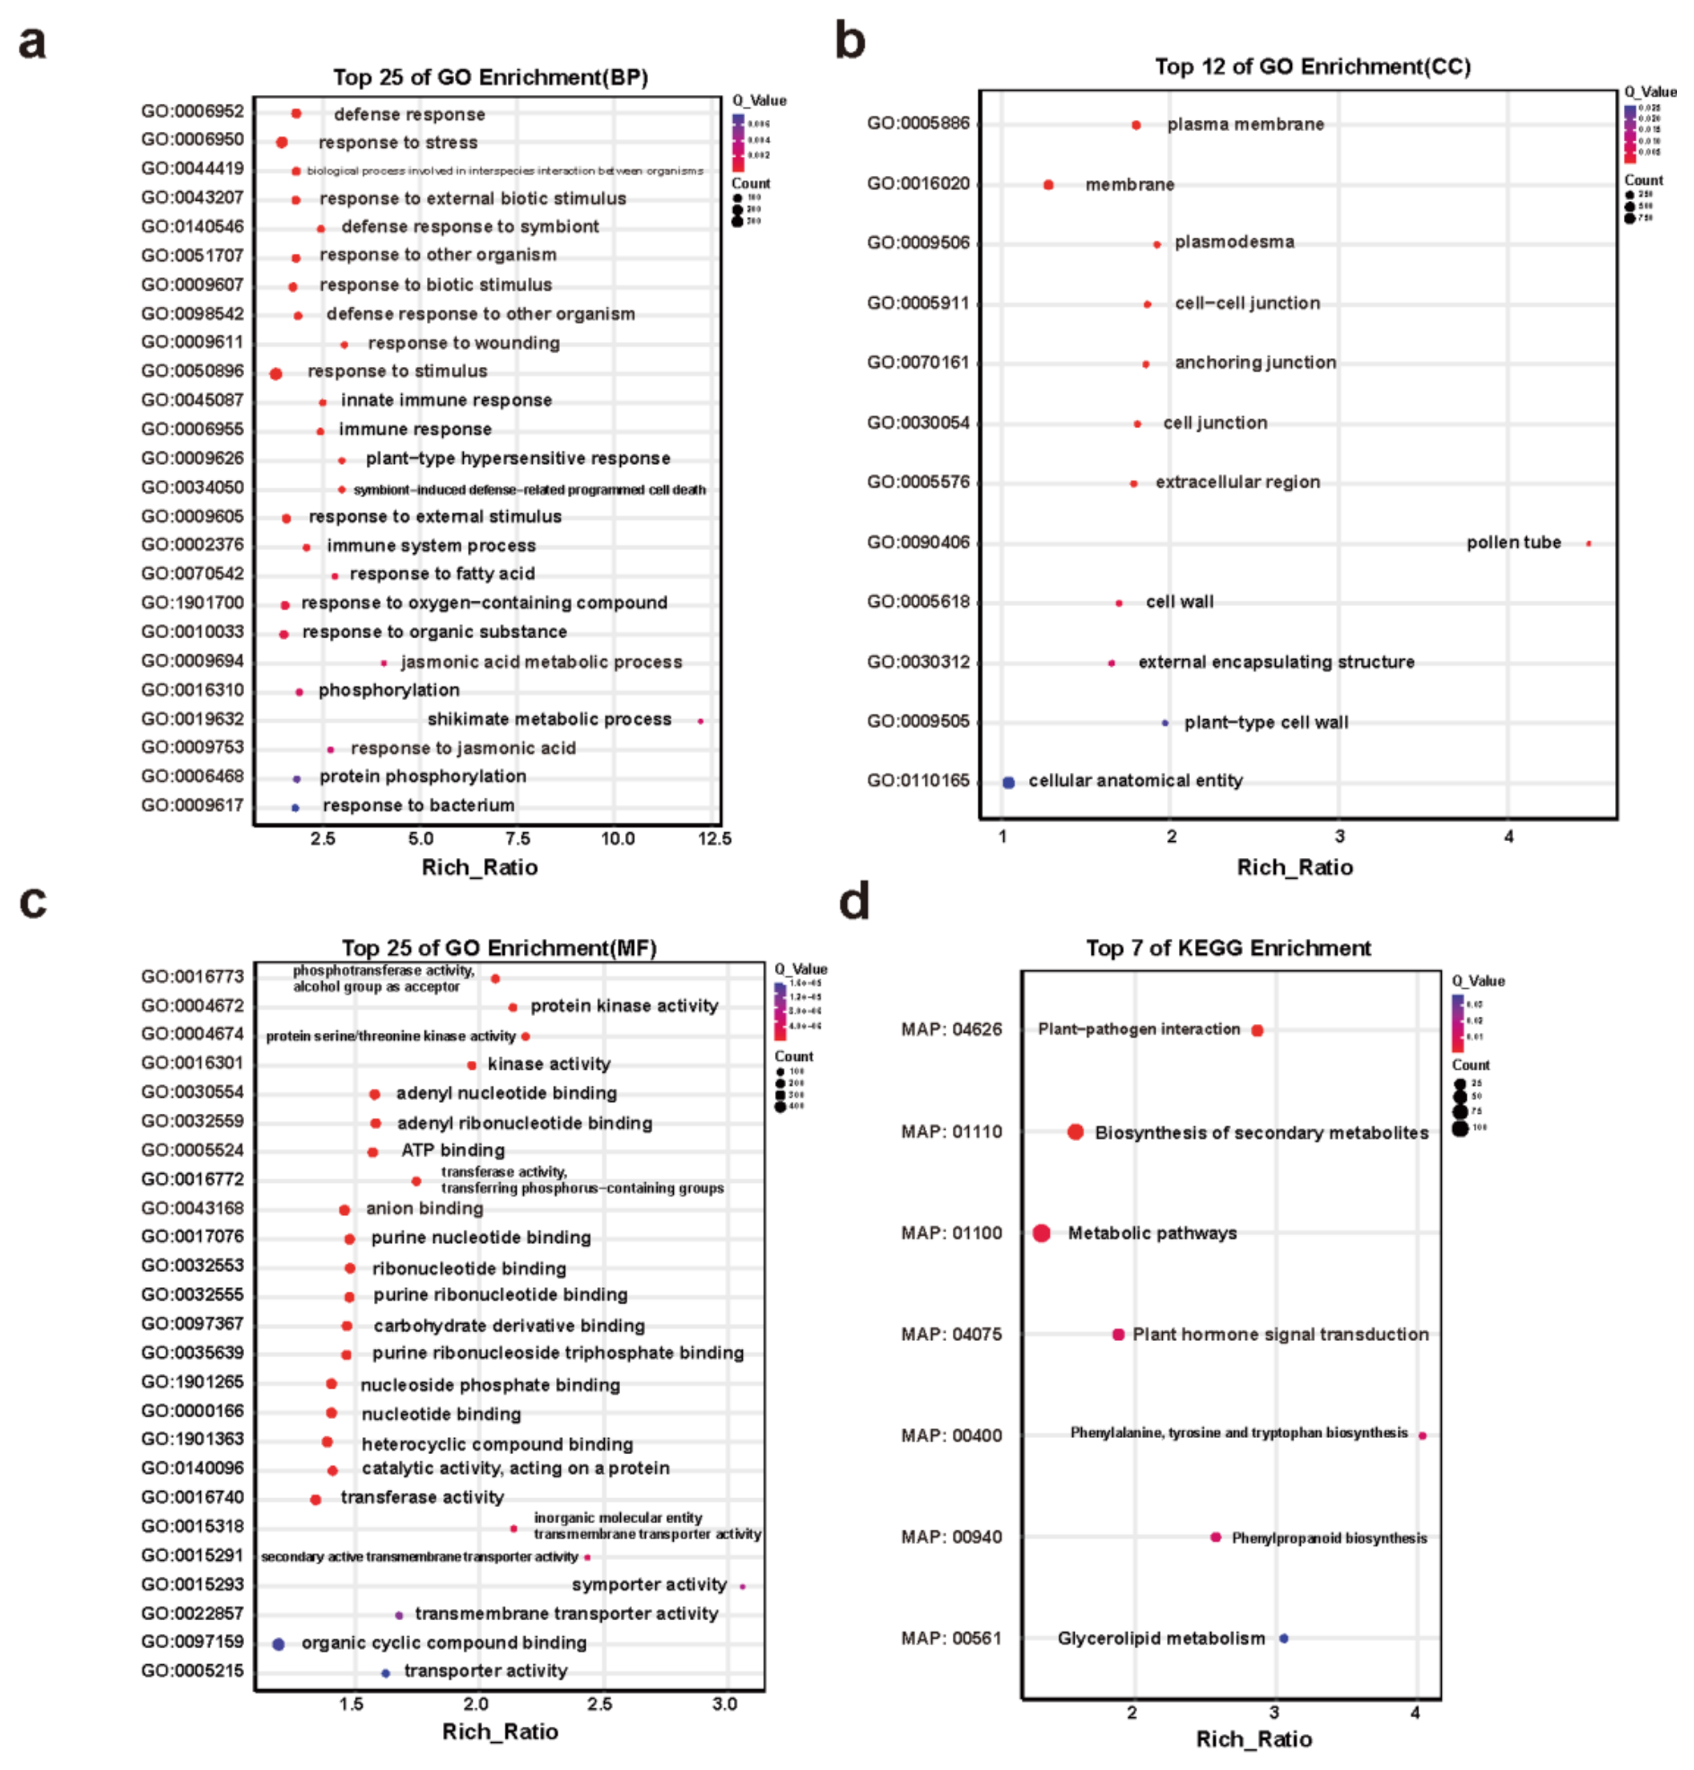
Figure 7.
TFBSs prediction of DEGs involved in oxalate metabolism. a. up-regulated DEGs; b. down-regulated DEGs.
Figure 7.
TFBSs prediction of DEGs involved in oxalate metabolism. a. up-regulated DEGs; b. down-regulated DEGs.
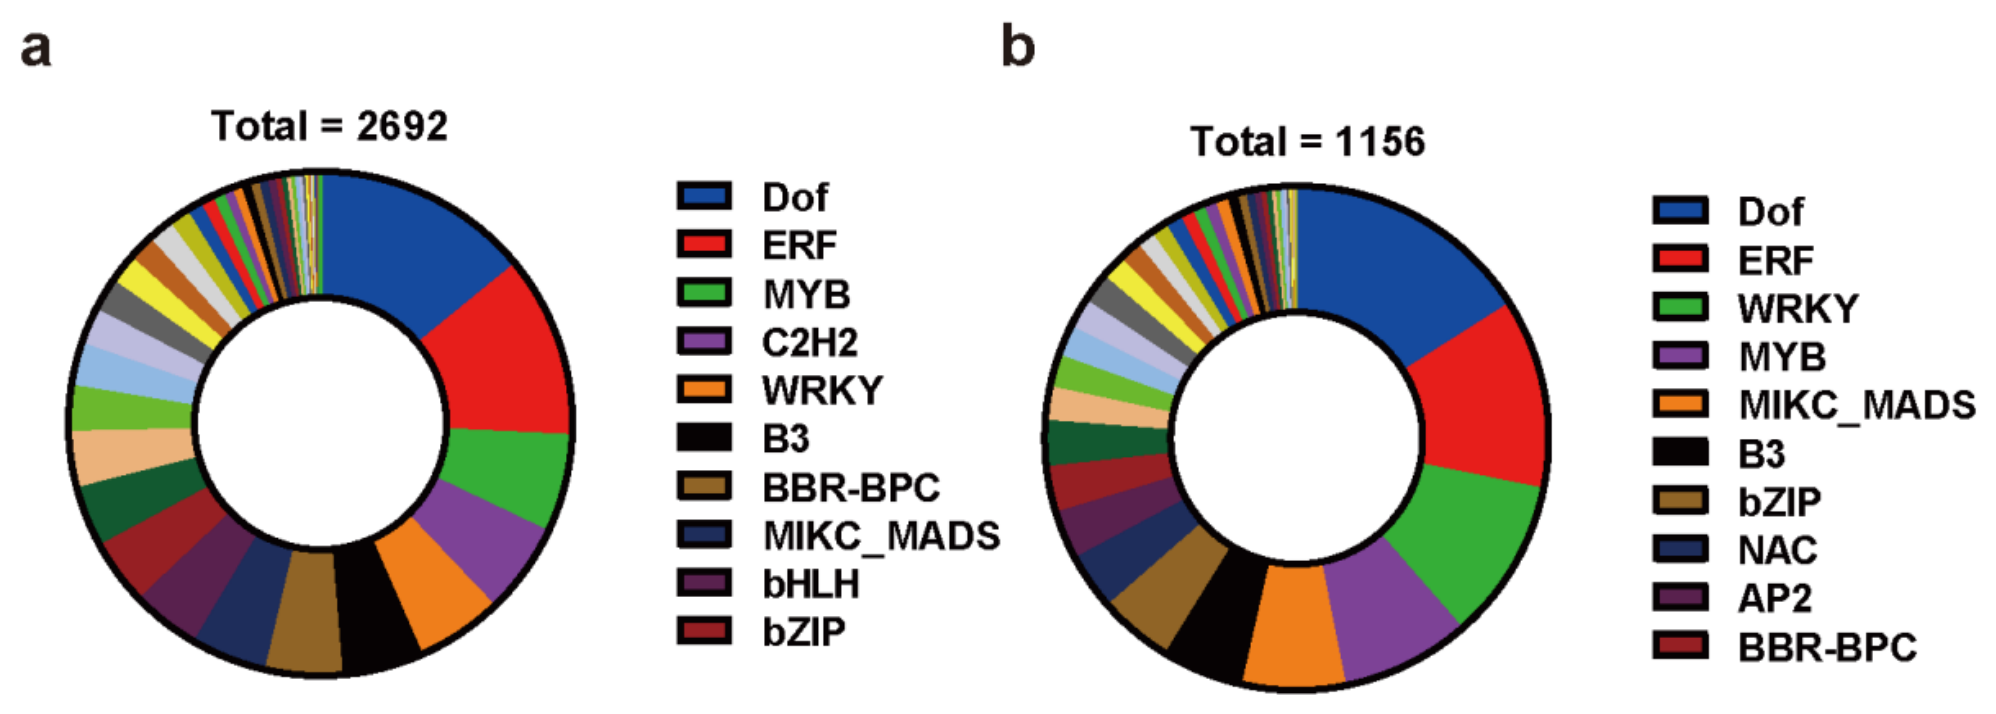
Figure 8.
Gene expression and oxalate level association analysis based on PLS. a. Individual plot of PLS; b. Variable plot of PLS. In the variable plot, α represents the angle between the coordinate vectors of two variables. The correlation between variables is quantified by the cosine of this angle [cos(α)]: as α approaches 0°, the variables exhibit a stronger positive correlation; as α approaches 180°, they exhibit a stronger negative correlation.
Figure 8.
Gene expression and oxalate level association analysis based on PLS. a. Individual plot of PLS; b. Variable plot of PLS. In the variable plot, α represents the angle between the coordinate vectors of two variables. The correlation between variables is quantified by the cosine of this angle [cos(α)]: as α approaches 0°, the variables exhibit a stronger positive correlation; as α approaches 180°, they exhibit a stronger negative correlation.
Disclaimer/Publisher’s Note: The statements, opinions and data contained in all publications are solely those of the individual author(s) and contributor(s) and not of MDPI and/or the editor(s). MDPI and/or the editor(s) disclaim responsibility for any injury to people or property resulting from any ideas, methods, instructions or products referred to in the content. |
© 2026 by the authors. Licensee MDPI, Basel, Switzerland. This article is an open access article distributed under the terms and conditions of the Creative Commons Attribution (CC BY) license (http://creativecommons.org/licenses/by/4.0/).
Copyright: This open access article is published under a Creative Commons CC BY 4.0 license, which permit the free download, distribution, and reuse, provided that the author and preprint are cited in any reuse.