

Submitted:
17 August 2026
Posted:
19 August 2026
You are already at the latest version
Abstract
Forests are major terrestrial carbon sinks, but the relative effects of ecological zones, tree species, stand structure, and site quality on carbon sequestration capacity (CSC) and net ecosystem production (NEP) remain insufficiently quantified at national scales. We integrated MODIS MOD17A3HGF net primary production data for 2000–2023 with ecozone-specific heterotrophic respiration coefficients and Türkiye’s national forest inventory comprising 2,446,889 stand polygons. Welch’s ANOVA, Games–Howell tests, Hedges’ g, Spearman correlations, and path analysis were used to quantify the effects of ecological zone, tree species, canopy closure, site index, and stand development class. Ecological zone was the strongest driver of CSC (η²ₚ = 0.3154) and NEP (η²ₚ = 0.2724), followed by tree species, canopy closure, site index, and stand development class. Euxine–Colchic broadleaf forests had the highest mean CSC (9.001 t C ha⁻¹ yr⁻¹) and NEP (4.801 t C ha⁻¹ yr⁻¹), whereas East Anatolian broadleaf forests showed negative mean NEP. Relative humidity was the strongest continuous correlate of CSC (ρ = 0.732) and NEP (ρ = 0.695). Path analysis indicated that temperature influenced forest carbon functioning mainly through moisture-mediated indirect effects. These findings support ecozone- and structure-sensitive national carbon accounting, monitoring, management, and MRV frameworks for Türkiye’s heterogeneous forests.
Keywords:
ecozonation
; canopy closure
; site productivity
; heterotrophic respiration
; hydroclimatic gradient
; path analysis
; MODIS NPP
1. Introduction
Forests function as one of the most important terrestrial carbon sinks, partly offset by anthropogenic CO₂ emissions through the uptake and storage of atmospheric carbon in biomass and soils [1]. However, this role is neither spatially uniform nor temporally stable. Forest carbon dynamics are shaped by the interaction of climatic gradients, topographic controls, species composition, stand development stage, structural attributes, and site productivity, all of which influence both carbon uptake through net primary production (NPP) and carbon release through ecosystem respiration [2,3]. Identifying which drivers dominate on national scales is essential for evidence-based carbon accounting, MRV systems, and climate adaptation planning.
In this context, carbon sequestration capacity (CSC), here represented by MODIS-derived annual NPP (t C ha⁻¹ yr⁻¹), and net ecosystem production (NEP = NPP − Rₕ) provide two complementary indicators of forest carbon functioning [4]. The CSC reflects the productivity-based potential of forest ecosystems to accumulate carbon, while the NEP indicates the net carbon balance of the ecosystem after accounting for heterotrophic respiration. Evaluating these two metrics together allows a more complete interpretation of whether forest ecosystems are simply productive or whether they effectively function as net carbon sinks.
Türkiye provides a particularly suitable setting for such an analysis because of its strong ecological heterogeneity. Situated at the intersection of the phytogeographic regions of the Euro-Siberian, Mediterranean, and Irano-Turanian, the country contains approximately 23.4 million ha of forest, covering nearly 30% of its land area [5]. Ecosystems range from humid Black Sea broadleaf forests to semi-arid interior steppe–forest mosaics over short spatial gradients. These marked topoclimatic and biogeographical gradients indicate that the forest carbon dynamics in Türkiye cannot be reliably represented by uniform national coefficients alone.
Despite the ecological and managerial importance of Türkiye forests, previous studies have generally focused on static biomass estimates, limited regional case studies, or species groups [6,7,8]. Accordingly, a national analysis at the stand level that simultaneously quantifies both CSC and NEP in the entire forest inventory of the General Directorate of Forestry (OGM) has remained lacking.
The objectives of this study were to: (i) characterize the national-scale distribution of CSC and NEP and quantify the relative contributions of ecological zone, tree species, canopy closure, site index, and stand development class using Welch’s ANOVA and effect size analysis; and (ii) identify the dominant climatic and topographic correlates and decompose direct and indirect climatic effects using path analysis. This baseline analysis constitutes part I of a broader research framework, providing the ecological driver hierarchy for subsequent assessments of climate sensitivity and future carbon sink trajectories.
2. Materials and Methods
2.1. Study Area
Türkiye covers approximately 779,646 km² between 36–42 ° N and 26–45 ° E and occupies a biogeographically strategic position at the junction of Europe and Asia. Surrounded by the Black Sea to the north, the Aegean Sea to the west, and the Mediterranean Sea to the south, the country exhibits strong contrasts in maritime influence, continentality, and elevational gradients over relatively short distances. This setting has produced a highly heterogeneous ecological mosaic in which humid coastal systems, Mediterranean forest formations, and semi-arid interior landscapes occur within the same national territory.
From a phytogeographical perspective, Türkiye lies at the intersection of the Euro-Siberian, Mediterranean and Iraniano-Turanian regions, making it one of the most ecologically diverse forest landscapes in the wider Mediterranean–West Asian transition zone [9]. This transitional setting, together with the complex topography of the country and marked climatic variability, creates a strong spatial differentiation in forest structure, composition, and carbon dynamics.
For analytical purposes, forest areas were evaluated within eight ecologically defined zones. Euxine-Colchic Broadleaf Forest, Mixed Northern Anatolian Forest, East Anatolian Broadleaf Forest, Mediterranean Coastal Forest, Mediterranean Mountain Zone, Mixed Inner Aegean Forest, Inner Anatolian Steppe and East Anatolian Steppe (Figure 1). These zones integrate dominant climate conditions, vegetation physiognomy, and broad bioclimatic characteristics, providing an ecologically meaningful framework for evaluating national-scale variation in carbon sequestration capacity and net ecosystem production.
2.2. Forest Inventory Data
The data on the polygons of the national forest stand were obtained from the General Directorate of Forestry of Turkey (OGM) through an official data request. The original geodatabase contained 3,801,426 polygons representing both forest and nonforest land use categories. To construct the analytical dataset, attribute-based filtering was applied to retain only polygons classified as productive or unproductive forest stands according to OGM stand type definitions, while nonforest categories such as bare land, water surfaces, settlement-related units, infrastructure corridors, and other nonforest classes were excluded. This procedure yielded a final national forest dataset consisting of 2,446,889 stand polygons.
Each polygon contained inventory-based attributes: dominant tree species (harmonized in standard taxonomic form and assigned to growth rate groups), stand development stage (OGM classes a–e and k), site index (original classes I–V, reclassified as good / moderate / poor for fast and slow-growing species separately) and canopy closure (four classes: very sparse <10% to dense 71–100%).
All preprocessing, filtering, attribute standardization, and spatial data management steps were performed in ArcGIS Pro 3.x using Python/ArcPy-based workflows.
2.3. Carbon Sequestration Capacity (CSC)
The CSC was operationally represented by the mean annual NPP derived from the MODIS MOD17A3HGF v6.1 product (500 m; [10] for 2000–2023. Annual rasters were masked to forest areas, fill values and outside-range pixels were excluded, and raw DN values converted to t C ha-1 yr-1 (DN × 0.0001 × 10). Stand-level CSC was assigned as the polygon median of the 24-year mean NPP surface via zonal statistics (Eq. 1), interpreted as a long-term productivity indicator rather than net carbon storage:
where n = 24 annual composites covering the years 2000–2023.
2.4. Net Ecosystem Production (NEP)
NEP was calculated at the stand level as the difference between net primary production (NPP) and heterotrophic respiration (Rₕ):
where NPP is the net annual carbon gain in plant biomass and Rₕ is the carbon released through microbial decomposition [2,4]. Positive NEP indicates net carbon sink behaviour; negative values indicate source-like conditions.
Because long-term direct measurements of heterotrophic respiration are not available in the Türkiye forest ecosystems, Rₕ was represented using a literature synthesis-based ecological matching approach (Table 1). Representative annual Rₕ values were assigned by ecological zone based on climatically comparable forest and steppe systems, providing ecologically grounded first-order estimates for national-scale comparison.
Each polygon was linked to its ECOZONE attribute and the corresponding Rₕ value assigned; NEP was then calculated as:
where NEPₕₐ is the annual net ecosystem production, NPPₕₐ is the annual net primary production and Rₕₕₐ is the representative annual heterotrophic respiration value assigned according to the ecological zone. In this framework, Rₕ was treated as an independent component based on annual values derived from the literature rather than as a fixed proportion of NPP. All calculations were performed in ArcGIS Pro using Python/ArcPy workflows.
2.5. Environmental Covariates
Topographic covariates comprised elevation, slope, and aspect, all derived from the Shuttle Radar Topography Mission (SRTM) 1 arc-second digital elevation model (~30 m spatial resolution; [18]. Elevation was obtained directly from the DEM, while slope and aspect were derived from the same surface using the spatial analyst tools in ArcGIS Pro. For stand-level analysis, per-polygon median values of elevation, slope, and aspect were extracted using zonal statistics.
Climatic covariates included annual total precipitation (mm yr⁻¹), mean annual temperature (° C) and mean annual relative humidity (%). These raster layers were obtained from a nationwide climate modelling study for Türkiye by [19], (in press), in which data from 1,908 meteorological observation stations of the Turkish State Meteorological Service (MGM) were evaluated together with topographic and locational predictors, including elevation, slope, aspect, distance from the sea and exposure to the sea, to generate continuous climate surfaces. In the present study, these previously produced precipitation, temperature, and relative humidity surfaces were used directly as environmental explanatory layers rather than being remodeled. The median values per pole were extracted from all climate rasters using zonal statistics. All environmental layers were prepared within a common spatial reference framework to ensure compatibility across datasets.
2.6. Statistical Analysis
Descriptive statistics (min, max, mean, median, SD, skewness, kurtosis) were computed for CSC, NEP, and all continuous covariates. The bivariate associations between six environmental predictors and each response variable were evaluated using Spearman’s ρ.
Multiple regression of OLS was initially tested but rejected due to severe multicollinearity among climatic predictors (VIF = 13.3–35.0; Supplementary Table S1). Therefore, path analysis was adopted to decompose direct and indirect climatic effects. The model included five paths (CSC / NEP relative humidity, temperature, precipitation; relative humidity, temperature, precipitation) and one covariance term (temperature precipitation; df = 2). The variables were standardised by z score prior to fitting; the analysis used a random subsample of 50,000 polygons (parameter stability confirmed across 100,000 and 200,000 subsample replicates; max. deviation < 0.01). Statistical significance of indirect pathways was evaluated by bootstrap resampling (1,000 replications; bias-corrected 95% CI).
Differences in CSC and NEP among five categorical drivers were tested using one-way Welch’s ANOVA (preferred over classical ANOVA given variance heterogeneity verified by Levene’s test, p < 0.001, and unbalanced group sizes). Effect sizes were reported as partial eta-squared (η²ₚ; thresholds: <0.01 negligible, 0.01–0.06 small, 0.06–0.14 moderate, 0.14 large) and pairwise contrasts as Hedges’ g (Games–Howell post hoc test).
The spatial dependence in CSC and NEP was assessed using Moran’s I, calculated by ecological zone on a stratified random subsample of 5,000 polygons per zone (k = 8 nearest neighbor weights; PySAL KNN; 499 permutation test; random_state = 42).
All statistical analyzes were performed in Python using pandas, scipy, pingouin, statsmodels, semopy, and PySAL within a Jupyter Notebook environment.
3. Results
3.1. National Distribution of CSC, NEP and Stand Attributes
On the national scale, CSC ranged from 0.67 to 32.77 t C ha-1 yr-1 (mean = 6.46 ± 2.64 t C ha⁻¹ yr⁻¹) and NEP from -4.28 to 30.97 t C ha-1 yr-1 (mean = 2.45 ± 2.54 t C ha⁻¹ yr⁻¹; Table 2). Both distributions were right-skewed (skewness: CSC = 2.02, NEP = 2.24), reflecting the dominance of moderately productive stands alongside a smaller proportion of highly productive humid zone stands. The inclusion of negative NEP values indicates that a fraction of stands functioned as marginal carbon sources under current conditions. The descriptive statistics for all continuous environmental covariates are provided in Table 2; the distribution of stand polygons among categorical drivers is summarized in Table 3.
The distribution of stand polygons across categorical drivers is summarised in Table 3. Among the eight ecological zones, the mixed forest of the north Anatolian region contained the largest share of stands (606,827; 24.80%), followed by the Euxine-Colchic broadleaf forest (440,731; 18.01%), the mixed forest of the inner Aegean (418,771; 17.11%) and the Mediterranean mountain zone (413,681; 16.91%), which together accounted for 76.83% of all polygons of the stands. The East Anatolian Steppe (61,321; 2.51%) and the Inner Anatolian Steppe (69,315; 2.83%) were the least represented zones. Among canopy closure classes, class 0 (very sparse, <10%) was the most frequently recorded (811,416 stands; 33.16%), followed by class 3 (dense, 71–100%; 689,390 stands; 28.17%), indicating that a substantial proportion of Türkiye’s legally defined forest estate consists of open or very sparsely canopied stands. For the site index, class III was the most represented among stands with recorded values (673,329; 27.52%), while classes I and II together accounted for 16.15%. For the stand development class, classes B and C were dominant (25.95% and 23.76%, respectively), while class E was negligibly represented (2,272 stands; 0.09%). Approximately 35% of the stand polygons lacked recorded values for both the site index and the stand development class, reflecting incomplete attribute recording in the OGM national forest inventory database; analyses involving these variables were carried out only in the available subsets.
3.1. Hydroclimatic and Topographic Controls
3.1.1. Bivariate Associations with Continuous Environmental Predictors
The Spearman rank correlations showed that relative humidity was the strongest positive predictor of both CSC (ρ = 0.732) and NEP (ρ = 0.695), followed by precipitation (ρ = 0.581 and 0.507, respectively), while temperature showed moderate negative associations (ρ = 0.226 and −0.283; Table 4), confirming the availability of atmospheric moisture as the main continuous environmental driver.
Elevation showed a moderate negative association with both variables (CSC: ρ = −0.428; NEP: ρ = 0.331), while slope and aspect were negligibly correlated (ρ ≤ 0.078; Table 4).
3.2.2. Path Analysis of Direct and Indirect Climate Effects
Path analysis decomposed direct and indirect climatic effects on CSC and NEP into interpretable components (Table 5). Relative humidity emerged as the strongest direct driver of both response variables, while temperature and precipitation operated through both direct and humidity-mediated indirect pathways.
For CSC, relative humidity was the strongest direct driver (β = 0.684), followed by temperature (β = 0.200) and precipitation (β = 0.197; Figure 2; Table 5). Despite a negative Spearman correlation (ρ = 0.232), temperature showed a positive direct effect on CSC because it suppressed relative humidity (β = -0.571), generating a large negative indirect effect (β = −0.391; 95% CI: -0.397 to -0.385) that dominated the total effect (total effect = 0.169). Precipitation exerted a direct (β = +0.197) and a humidity-mediated indirect effect (β = +0.309; total = +0.506).
3.3. Spatial Dependence of CSC and NEP
Moran’s I indicated weak to moderate positive spatial autocorrelation within all ecozones (I = 0.048–0.289; mean = 0.177; all p = 0.002; Table 6), consistent with shared local environmental conditions between adjacent stands. Because the Rh at the zone level was a fixed constant, the spatial structure of NEP is mathematically identical to the CSC within each zone. Within-zone dependence was insufficient to compromise stand-level comparisons across zones.
3.4. Categorical Drivers of CSC and NEP
The effects of five categorical drivers (ecological zone, tree species, canopy closure, site index, and stand development class) on CSC and NEP were assessed using one-way Welch’s ANOVA with Games-Howell post hoc comparisons and Hedges’ g effect sizes. The results are presented in order of decreasing effect size, beginning with the ecological zone as the dominant driver and concluding with the stand development class as the weakest categorical predictor examined.
3.4.1. Ecological Zone Contrasts in CSC and NEP
The ecological zone was the dominant categorical driver of both CSC (η²ₚ = 0.3154; F = 262,193, df = 7, p < 0.001) and NEP (η²ₚ = 0.2724; F = 194,297, df = 7, p < 0.001). The Euxine-Colchic broadleaf forest recorded the highest mean CSC (9.001 t C ha⁻¹ yr⁻¹) and the East Anatolian zones the lowest (3.24 t C ha⁻¹ yr⁻¹; Figure 4). The pairwise contrasts between the humid and dry ecozones were very large (Hedges g = 3.22–3.26), while the contrast between the two zones lowest ranked was negligible (g = 0.02).
For NEP, the Euxine-Colchic Broadleaf Forest also ranked highest (4.801 t C ha - 1 year - 1) and the East Anatolian Broadleaf Forest was the only zone with negative mean NEP (-0.302 t C ha⁻¹ yr⁻¹; Figure 5). The largest NEP contrast was between the Euxine-Colchic and East Anatolian Broadleaf zones (Hedges g = 2.92); the comparison of the East Anatolian Steppe to the Mediterranean coastal forest was not significant (g = 0.01).
3.4.2. Tree Species-Level Variation in CSC and NEP
The tree species was the second categorical driver (CSC: η²ₚ = 0.2106, F = 22,796, df = 51, p < 0.001; NEP: η²ₚ = 0.1930, F = 19,729, df = 51, p < 0.001). Fast-growing conifers and mesic broadleaved taxa (Acacia saligna, Pinus radiata, Pinus pinaster, Pseudotsuga menziesii, Alnus glutinosa) ranked highest for CSC, while drought-tolerant dry site taxa (Olea europaea, Pinus eldarica) ranked lowest (Figure 6). The contrasts between the highest and lowest-ranked species frequently exceeded Hedges’ g = 3.0, while adjacent species in the intermediate range showed smaller, often nonsignificant differences.
The NEP ranking closely paralleled CSC, with the same fast-growing taxa at the upper end and Olea europaea and Pinus eldarica at the lower end, where some species distributions extended to negative values (Figure 7).
3.4.3. Canopy Closure Effects on CSC and NEP
The closure of the canopy was the third rank driver (CSC: η²ₚ = 0.0884, F = 77,431, df = 3, p < 0.001; NEP: η²ₚ = 0.0826, F = 71,658, df = 3, p < 0.001). Both CSC and NEP increased monotonically from very sparse (class 0) to dense (class 3) canopy, with mean CSC rising from 5.800 to 7.608 t C ha - 1 yr-1 and mean NEP from 1.833 to 3.511 t C ha - 1 yr-1 (Figure 8 and Figure 9). The largest contrast was class 3 vs. class 0 (CSC: g = 0.73; NEP: g = 0.70); notably, classes 0 and 1 were nearly indistinguishable for NEP (1.833 vs. 1.825 t C ha⁻¹ yr⁻¹; g = 0.00, ns), suggesting a functional threshold between classes 1 and 2.
3.4.4. Effects of the Site Index on CSC and NEP
The site index was the fourth rank driver (CSC: η²ₚ = 0.0640, F = 58,361, df = 2, p < 0.001; NEP: η²ₚ = 0.0547, F = 48,359, df = 2, p < 0.001). The mean CSC decreased from good (8.191 t C ha⁻¹ yr⁻¹) to poor (6.296 t C ha⁻¹ yr⁻¹) site-quality stands, with NEP following the same gradient (4.015 to 2.278 t C ha⁻¹ yr⁻¹; Figure 10 and Figure 11). All pairwise differences were significant; the greatest contrast was between good and poor sites (CSC: g = 0.77; NEP: g = 0.71).
3.4.5. Effects of Stand Development Class on CSC and NEP
The stand development class was the weakest categorical driver (CSC: η²ₚ = 0.0153, F = 3,940.96, df = 5, p < 0.001; NEP: η²ₚ = 0.0136, F = 3,697.16, df = 5, p < 0.001). Class k (mixed stands) showed the highest mean CSC (7.290 t C ha⁻¹ yr⁻¹) and NEP (3.171 t C ha⁻¹ yr⁻¹), while class a recorded the lowest (CSC 6.065; NEP 2.092 t C ha⁻¹ yr⁻¹; Figure 12 and Figure 13). The largest pairwise contrast was between classes k and a (CSC: g = 0.44; NEP: g = 0.40); adjacent developmental classes showed negligible differences (min. g = 0.01–0.06).
3.5. Effect Size Hierarchy of Ecological and Structural Driver Effects
Welch’s effect sizes produced a similar ranking of categorical drivers for both CSC and NEP, with the ecological zone explaining the highest share of variance, followed by tree species, canopy closure, site index, and stand development class (Table 7). The ecological zone was the dominant first-order control, the tree species represented the strongest biological modifier, the canopy closure and the site index acted as structural and productivity controls relevant to management, and the stand development class showed the weakest but still statistically significant effect.
3.6. Sensitivity of NEP Estimates to Rₕ Uncertainty
A differentiated perturbation analysis (±10% for high-confidence Rₕ zones to ±30% for low-moderate confidence zones; Table 1) confirmed that the Euxine-Colchic–East Anatolian Broadleaf Forest ranking was robust in all scenarios. Intermediate zone rankings showed sensitivity to Rₕ uncertainty (one-rank shifts). In particular, the NEP sign for the east Anatolian Broadleaf Forest reversed from negative (0.302) to weakly positive (+0.418 t C ha⁻¹ yr⁻¹) under a 20% Rₕ reduction; absolute NEP magnitudes should be treated as estimates of order of magnitude, particularly for zones with moderate or low-moderate confidence in Rh.
4. Discussion
Türkiye forests should not be interpreted as a spatially uniform carbon sink. The effect size hierarchy identified here indicates that forest carbon functioning is structured first by macroecological gradients and then progressively modified by biological composition and stand-level structure. This baseline hierarchy has direct implications for national carbon accounting and forest management, as spatially uniform assumptions can obscure substantial ecological variation in carbon sink performance. The following sections examine the mechanisms underlying this hierarchy, beginning with the hydroclimatic template and proceeding through species identity and stand structural modifiers.
4.1. Hydroclimatic Template and Moisture-Mediated Temperature Effects
Relative humidity was the strongest positive correlate of both CSC (ρ = 0.732) and NEP (ρ = 0.695), followed by annual precipitation (ρ = 0.581 and 0.507, respectively), highlighting atmospheric moisture availability as the primary regulator of forest carbon dynamics in Türkiye. The stronger signal from relative humidity than precipitation alone is mechanistically informative: while precipitation represents episodic water input, relative humidity integrates continuous atmospheric moisture demand and more directly reflects the evaporative conditions governing stomatal conductance and net carbon assimilation [20]. This moisture signal constitutes the dominant organizing axis of Türkiye’s forest carbon landscape, consistent with global evidence that VPD and atmospheric moisture exert primary control over water-limited forest systems [21,22,23].
The path analysis confirmed relative humidity as the main proximate driver (CSC: β = 0.684; NEP: β = 0.564) and resolved the apparent negative temperature signal: Spearman correlations (ρ = -0.226 / -0.283) resulted almost entirely from a large negative indirect pathway through humidity (β = -0.571), not from a direct physiological constraint. The true direct temperature effect was positive (β = +0.200 for CSC; +0.075 for NEP), with total effects of 0.119 and 0.247, respectively, demonstrating that temperature limits carbon functioning in Türkiye forests primarily by suppressing atmospheric moisture rather than directly constraining photosynthesis [20,22]. The larger direct temperature effect on CSC than that of NEP is consistent with warming simultaneously stimulating gross assimilation and heterotrophic respiration.
Precipitation also operated through dual pathways (direct: β ≈ 0.20; indirect through humidity: β = +0.309/+0.254; total: +0.506/+0.455), with the moisture-mediated component equaling or exceeding the direct effect (Table 5).
4.2. Topographic Controls and Their Scale-Dependent Significance
The topographic variables did not show evidence of multicollinearity (VIF 2.92–4.19) and only weak intercorrelations (ρ ≤ 0.226), so their associations with CSC and NEP can be interpreted directly from bivariate correlations. Elevation showed the strongest topographic signal (CSC: ρ = −0.428; NEP: ρ = -0.331), attributed to the altitudinal lapse rate that shortens the growing season window for net carbon gain [24]. Although meaningful on the local to regional scales, this secondary control remains subordinate to the hydroclimatic gradient on the national scale.
Slope (ρ = 0.069/0.078) and the aspect (ρ ≈ 0) were effectively uncorrelated with CSC and NEP. Despite their well-documented role at the stand scale [2], these fine-resolution topographic signals are statistically subsumed by ecozone-level hydroclimatic variance across 2.4 million polygons, suggesting that incorporating topographic microstructure into national carbon accounting frameworks is unlikely to improve explanatory power at the country scale.
4.3. Ecological Zonation as the Integrated Expression of Macroclimate and Biogeography
The ecological zone was the strongest categorical driver of both CSC and NEP (η²ₚ = 0.3154 and 0.2724, respectively), reflecting the importance of the macroecological context in shaping forest carbon functioning [25,26]. The results obtained are in good agreement with many other studies based on ecological forest classifications [27,28,29]. Because ecozone boundaries encode the spatial organisation of hydroclimatic gradients, this effect should be interpreted as an integrated signal of the continuous moisture and temperature drivers identified in Section 4.1, rather than as an independent categorical influence. The marked gradient of CSC from Euxine-Colchic Broadleaf Forest (9.001 t C ha⁻¹ yr⁻¹) to East Anatolian zones (3.24 t C ha⁻¹ yr⁻¹), with very large Hedges g values between humid and dry ecozones (g = 3.22–3.26), confirms that these contrasts represent ecologically distinct regimes of carbon function consistent with global evidence on moisture as the main determinant of forest NPP [1,3].
The negative mean NEP of the East Anatolian Broadleaf Forest zone (0.302 t C ha⁻¹ yr⁻¹) reflects two co-occurring continental constraints: a short growing season imposed by late spring frosts and early senescence, and episodic summer heat pulses that can increase soil Rₕ rates. However, as demonstrated in the sensitivity analysis, the negative NEP sign shifts to weakly positive under a 20% Rₕ reduction; this zone should therefore be interpreted as a transitional carbon balance zone rather than a robust emitter.
4.4. Tree Species Identity and Ecozone Dependence
The identity of the tree species was the second most important categorical driver (η²ₚ = 0.2106 for CSC; 0.1930 for NEP), confirming that the functional differences at the species level substantially modify the performance of forest carbon within the macroecological framework imposed by the ecozones. Fast-growing conifers and mesic broadleaved taxa dominated the upper end of the carbon gradient, while drought-tolerant dry-site species (Olea europaea, Pinus eldarica, Juniperus spp.) clustered at the lower end, consistent with the established relationship between hydraulic conductance, leaf area, and stand-level productivity [30,31]. Very large Hedges g values between high and low performing taxa (g > 3.0) indicate substantially different carbon function strategies that persist on the national scale [1,32].
However, the observed species-level variation in CSC and NEP should be interpreted in light of the strong compositional association between dominant tree species and ecological zones. Several high CSC broadleaf species (Alnus glutinosa, Carpinus betulus, Castanea sativa) are strongly concentrated in the Euxine-Colchic zone (>80% of their stands), which independently shows the highest carbon sink strength. In contrast, Quercus spp. (63% of all stands) spans all eight ecozones with substantially varying CSC and NEP depending on ecozone conditions. Consequently, the reported species effect sizes reflect both intrinsic physiological traits and prevailing ecozone conditions and should be interpreted as unconditional marginal rather than independent species effects.
Top-ranked exotics with limited representation (Acacia saligna n = 101; Pinus radiata n = 183; Pseudotsuga menziesii n = 117) should be interpreted with caution, as their values likely reflect favorable ecozone conditions rather than intrinsic physiological advantages.
4.5. Stand-Level Structural Modifiers: Canopy Closure, Site Index, and Development Class
4.5.1. Canopy Closure
Canopy closure was the strongest structural driver (η²ₚ = 0.0884 CSC; 0.0826 NEP), consistent with its role as an integrative indicator of light penetration, leaf area, and biomass production capacity [1,33,34]. The monotonic gradient from very sparse to dense canopy (CSC: 5.800 7.608 t C ha⁻¹ yr⁻¹; NEP: 1.833 3.511 t C ha⁻¹ yr⁻¹) confirms the structural development of the canopy as a major secondary modifier within the constraints of macroclimate and species composition.
The near-identical NEP values of classes 0 and 1 (1.833 vs 1.825 t C ha⁻¹ yr⁻¹; g = 0.00, ns) suggest a functional threshold between classes 1 and 2, consistent with light-use efficiency theory predicting nonlinear carbon gain with canopy closure [3,33]. The 33.16% share of class 0 polygons indicates that a substantial fraction of the national forest estate currently falls below this threshold; management implications are discussed in Section 4.6.
4.5.2. Site Index
The site index (η²ₚ = 0.0640 for CSC; 0.0547 for NEP) was ranked as the fourth categorical driver, with CSC and NEP monotonically decreasing from good to poor site quality classes; the largest good–poor contrast reached g = 0.77 (CSC) and 0.71 (NEP; see Section 3.4.4).
The site index functions as an integrated indicator of edaphic productivity (soil depth, water holding capacity, nutrient availability), helping to define the stand-level productivity ceiling regardless of current canopy structure or development stage [35,36,37]. Also, based on previous studies [38], it can be assumed that the conclusion we have reached will be valid not only for the stand, but also for subordinate forest layers. The slightly stronger effect for CSC than for NEP (η²ₚ = 0.0640 vs. 0.0547) reflects the ecozone-level assignment of heterotrophic respiration, which dampens the edaphic signals within the ecozone in the NEP estimates; therefore, the NEP values should be interpreted as first-order ecozone stratified estimates rather than direct stand-level flux measurements.
4.5.3. Stand Development Class
Stand development class was the weakest categorical driver examined in this study, explaining 1.53% of the variance in CSC (η²ₚ = 0.0153) and 1.36% of the variance in NEP (η²ₚ = 0.0136). Although the effect was statistically significant, mainly due to the very large sample size, its modest magnitude indicates that age class differentiation contributes comparatively little to national-scale variation in forest carbon functioning after accounting for the stronger effects of ecological zone, species identity, canopy closure, and site index. The broad overlap among adjacent development classes, and the small Hedges g values even in the largest pairwise contrasts (g = 0.44 between classes k and a for CSC), further confirm that the development class operates as a secondary modifier rather than a primary control on carbon dynamics at this scale.
This is consistent with growing evidence that age–productivity relationships are neither monotonic nor universal and that many types of forest can maintain or increase carbon uptake into late successional stages where canopy structural complexity continues to develop [33,39,40,41].
The most notable pattern was class k (mixed age structure; 1.70% of the recorded stands), which showed the highest CSC (7.290 t C ha⁻¹ yr⁻¹) and NEP (3.171 t C ha⁻¹ yr⁻¹), suggesting that structural age heterogeneity supports more complete use of resources between canopy layers [37,42], and plant species of subordinate forest layers [43], although the modest effect size and limited representation warrant cautious interpretation.
4.6. Implications for Forest Carbon Accounting and Management
The effect size hierarchy identified in this study has direct practical relevance for how national forest carbon estimates are stratified, interpreted, and reported in Türkiye. Because ecological zonation explained the largest share of CSC and NEP variation, spatially uniform national coefficients are likely to underrepresent the ecological heterogeneity of the forest carbon function. Ecozone-sensitive accounting frameworks would better capture differences in productivity, moisture regime, species composition, and net carbon balance throughout the national forest estate and would provide a more defensible basis for greenhouse gas inventory reporting and MRV systems.
Within the ecozone framework, the identity of the species is the most important biological modifier. Native high-performing species should be prioritised in carbon-oriented afforestation. Castanea sativa, Ostrya carpinifolia and Alnus glutinosa in the Euxine-Colchic zone; Pinus nigra and Cupressus sempervirens in transitional and semi-arid zones. Nonnative taxa should be subject to rigorous ecological risk assessment before deployment [44,45]. At the stand level, canopy closure is the most operationally accessible structural target: 33.16% of all polygons fall in the very sparse class, and the functional threshold between classes 1 and 2 indicates that canopy restoration in degraded open stands represents a feasible lever for national-scale carbon gains wherever moisture conditions permit.
The site index identifies the stands with the highest carbon accumulation potential and can guide silvicultural investment. The elevated CSC and NEP in mixed-age class k stands suggest that structural heterogeneity through uneven-aged silviculture may enhance sink performance, though the modest effect size and limited class k representation warrant further investigation before operational application.
4.7. Methodological Considerations and Limitations
Key limitations include: (i) CSC is a productivity-based MODIS NPP indicator, not a carbon stock measure; (ii) the 500 m resolution may introduce uncertainty in small or heterogeneous polygons; (iii) zone-level Rₕ assignment means NEP estimates are comparative first-order values rather than stand-level flux measurements (see also Section 3.6); (iv) site index and development class analyses excluded polygons with missing inventory records, which may disproportionately represent degraded or under-mapped stands; and (v) path analysis reflects statistical associations in observational data, not definitive causal pathways.
5. Conclusions
Using 2,446,889 stand polygons from Türkiye’s national forest inventory, this study identified a consistent effect size hierarchy of ecological and stand structural controls on carbon sequestration capacity and net ecosystem production. The ecological zone was the dominant driver, reflecting the integrated spatial expression of hydroclimatic gradients, followed by the identity of tree species, canopy closure, site index and class of stand development. Path analysis demonstrated that the negative overall association between temperature and forest carbon functioning operates primarily through a moisture-mediated indirect pathway, with increasing temperature suppressing atmospheric humidity, which in turn limits carbon assimilation. Relative humidity emerged as the strongest proximate correlate of both CSC and NEP across the Türkiye hydroclimatic gradient, underscoring that atmospheric moisture availability, rather than temperature or precipitation alone, is the key regulator of forest carbon dynamics at the national scale.
These results have direct implications for forest carbon accounting and management in Türkiye. National carbon accounting frameworks would benefit from stratification by ecological zone, as spatially uniform coefficients are likely to obscure substantial variation in carbon sink performance. At the stand level, canopy closure and site index provide management-relevant indicators for prioritization in monitoring, reporting, and verification systems. The large proportion of very sparse canopy stands and the functional threshold identified between canopy closure classes 1 and 2 further suggest that structural restoration in degraded open stands represents one of the most operationally feasible pathways for improving the strength of the national forest carbon sink.
The baseline estimates and driver ranking reported here define the starting point for the companion study submitted in parallel, which evaluates future trajectories of CSC and NEP across Türkiye’s ecological zones under projected stand structural changes and alternative climate scenarios. In combination, the two studies link present-day ecological variation with projected climate and structural changes in the stands, providing a more differentiated basis for forest carbon management and greenhouse gas inventory refinement.
Declaration of generative AI and AI-assisted technologies in the manuscript preparation process
During the preparation of this work, the authors used Claude and ChatGPT for language editing, structural refinement, and manuscript formatting support. After using this tool, the authors reviewed, verified, and edited all content as needed and assume full responsibility for the content of the published article.
Supplementary Materials
The following supporting information can be downloaded at: Preprints.org.
Author Contributions
“Conceptualization, B.T., S.A. and S.G.; methodology, B.T., S.G., S.A., software, B.T., T.Y.H.; validation, B.T., S.G., S.A., M.M., and formal analysis, S.G., B.T., T.Y.H.; data curation, T.Y.H., M.M., F.K., N.I., writing—original draft preparation, B.T., S.G. and S.A.; writing—review and editing, S.A.; N.I.; F.K.; M.M., visualization, S.G., .B.T., T.Y.H.; supervision, B.T., S.A.; project administration, B.T.; funding acquisition, N.I.; All authors have read and agreed to the published version of the manuscript.” Please turn to the CRediT taxonomy for the term explanation. Authorship must be limited to those who have contributed substantially to the work reported.
Funding
This study was supported by the Türkiye Scientific and Technological Research Council (TÜBİTAK), Project No. 224O285, and the Turan Demiraslan Graduate Scholarship Program of the TEMA Foundation. Additional support was provided through the Council of Higher Education’s 100/2000 Priority Areas Scholarship at the Graduate School of Natural and Applied Sciences, Kastamonu University. Also, the studies are carried out as a part of the state assignment of the Institute Botanic Garden, the Ural Branch of the Russian Academy of Sciences (state registration no. 123112700125-1). The funding bodies did not play a role in study design, data analysis, interpretation of results, writing of the manuscript, or decision to submit the article for publication.
Data Availability Statement
The MODIS MOD17A3HGF data are publicly available through NASA LP DAAC https://doi.org/10.5067/MODIS/MOD17A3HGF.061 ). The forest stand map used in this study was obtained in January 2025 from the official website of the General Directorate of Forestry of Türkiye, where it was publicly accessible at the time. The authors digitized, georeferenced and converted this source material into an analytical stand-polygon database. The processed data set cannot be publicly redistributed because access to the original forest stand data is governed by the data distribution policies of the General Directorate of Forestry. Derived analytical outputs may be made available by the corresponding author upon reasonable request, subject to these restrictions.
Acknowledgments
This manuscript is derived in part from the doctoral dissertation of Sümeyye Güler, conducted at the Graduate School of Natural and Applied Sciences, Kastamonu University. The study was developed within the scientific framework of the TÜBTAK project entitled ‘Machine learning-based modeling and mapping of spatial and temporal variation in carbon sequestration capacity of Türkiye’s forests’ (Project No. 224O285). The authors acknowledge the General Directorate of Forestry of Türkiye for maintaining national forest stand map resources and the Turkish State Meteorological Service for its contribution to national meteorological data infrastructure. The authors also thank Şahin Işık, and Yıldıray Anagün for their contributions and support within the broader TÜBTAK project framework.
Conflicts of Interest
The authors declare that they have no known competing financial interests or personal relationships that could appear to influence the work reported in this paper.
Abbreviations
The following abbreviations are used in this manuscript:
| ANOVA | Analysis of Variance |
| CI | Confidence Interval |
| CSC | Carbon Sequestration Capacity |
| DEM | Digital Elevation Model |
| DN | Digital Number |
| KNN | K-Nearest Neighbors |
| LP DAAC | Land Processes Distributed Active Archive Center |
| MGM | Turkish State Meteorological Service |
| MODIS | Moderate Resolution Imaging Spectroradiometer |
| MRV | Measurement, Reporting, and Verification |
| NASA | National Aeronautics and Space Administration |
| NEP | Net Ecosystem Production |
| NPP | Net Primary Production |
| OGM | General Directorate of Forestry of Türkiye |
| OLS | Ordinary Least Squares |
| PySAL | Python Spatial Analysis Library |
| Rₕ | Heterotrophic Respiration |
| SD | Standard Deviation |
| SRTM | Shuttle Radar Topography Mission |
| VIF | Variance Inflation Factor |
| VPD | Vapor Pressure Deficit |
References
- Pan, Y.; Birdsey, R.A.; Fang, J.; Houghton, R.; Kauppi, P.E.; Kurz, W.A.; Phillips, O.L.; Shvidenko, A.; Lewis, S.L.; Canadell, J.G.; Ciais, P.; Jackson, R.B.; Pacala, S.W.; McGuire, A.D.; Piao, S.; Rautiainen, A.; Sitch, S.; Hayes, D. A large and persistent carbon sink in the world’s forests. Science 2011, 333(6045), 988–993. [Google Scholar] [CrossRef] [PubMed]
- Chapin, F.S.; Woodwell, G.M.; Randerson, J.T.; Rastetter, E.B.; Lovett, G.M.; Baldocchi, D.D.; Clark, D.A.; Harmon, M.E.; Schimel, D.S.; Valentini, R.; Wirth, C.; Aber, J.D.; Cole, J.J.; Goulden, M.L.; Harden, J.W.; Heimann, M.; Howarth, R.W.; Matson, P.A.; McGuire, A.D.; Schulze, E.D. Reconciling carbon-cycle concepts, terminology, and methods. Ecosystems 2006, 9(7), 1041–1050. [Google Scholar] [CrossRef]
- Luyssaert, S.; Inglima, I.; Jung, M.; Richardson, A.D.; Reichstein, M.; Papale, D.; Piao, S.L.; Schulze, E.-D.; Wingate, L.; Matteucci, G.; Aragao, L.; Aubinet, M.; Beer, C.; Bernhofer, C.; Black, K.G.; Bonal, D.; Bonnefond, J.-M.; Chambers, J.; Ciais, P.; Janssens, I.A. CO₂ balance of boreal, temperate, and tropical forests derived from a global database. Glob. Change Biol. 2007, 13(12), 2509–2537. [Google Scholar] [CrossRef]
- Randerson, J.T.; Chapin, F.S.; Harden, J.W.; Neff, J.C.; Harmon, M.E. Net ecosystem production: A comprehensive measure of net carbon accumulation by ecosystems. Ecol. Appl. 2002, 12(4), 937–947. [Google Scholar] [CrossRef]
- General Directorate of Forestry (OGM). Türkiye Orman Varlığı 2023; General Directorate of Forestry: Ankara, Türkiye, 2023. [Google Scholar]
- Tolunay, D. Total carbon stocks and carbon accumulation in living tree biomass in forest ecosystems of Turkey. Turk. J. Agric. For. 2011, 35(3), 265–279. [Google Scholar] [CrossRef]
- Sivrikaya, F.; Keleş, S.; Çakır, G. Spatial distribution and temporal change of carbon storage in timber biomass of two different forest management units. Environ. Monit. Assess. 2007, 132(1–3), 429–438. [Google Scholar] [CrossRef] [PubMed]
- Erşahin, S.; Bilgili, A.V.; Dikmen, Ü.; Ercanli, İ.; Yurtseven, H. Net primary productivity of Anatolian forests in relation to climate: 2000–2010. For. Sci. 2016, 62(6), 698–709. [Google Scholar] [CrossRef]
- Davis, P.H. Distribution patterns in Anatolia with particular reference to endemism. In Plant Life of South-West Asia; Davis, P.H., Harper, P.C., Hedge, I.C., Eds.; Botanical Society of Edinburgh: Edinburgh, UK, 1971; pp. 15–27. [Google Scholar]
- Running, S.W.; Zhao, M. MODIS/Terra Net Primary Production Gap-Filled Yearly L4 Global 500 m SIN Grid V061 [Dataset]; NASA LP DAAC, 2021. [Google Scholar] [CrossRef]
- Running, S.W.; Nemani, R.R.; Heinsch, F.A.; Zhao, M.; Reeves, M.; Hashimoto, H. A continuous satellite-derived measure of global terrestrial primary production. BioScience 2004, 54(6), 547–560. [Google Scholar] [CrossRef]
- Zhao, M.; Running, S.W. Drought-induced reduction in global terrestrial net primary production from 2000 through 2009. Science 2010, 329(5994), 940–943. [Google Scholar] [CrossRef] [PubMed]
- Kutsch, W.L.; Bahn, M.; Heinemeyer, A. (Eds.) Soil Carbon Dynamics: An Integrated Methodology; Cambridge University Press: Cambridge, UK, 2010. [Google Scholar] [CrossRef]
- Mäki, M.; Ryhti, K.; Fer, I.; Ťupek, B.; Vestin, P.; Roland, M.; Lehner, I.; Köster, E.; Lehtonen, A.; Bäck, J.; Heinonsalo, J.; Pumpanen, J.; Kulmala, L. Heterotrophic and rhizospheric respiration in coniferous forest soils along a latitudinal gradient. Agric. For. Meteorol. 2022, 317, 108876. [Google Scholar] [CrossRef]
- Jiao, Z.; Wang, X. Contrasting rhizospheric and heterotrophic components of soil respiration during growing and non-growing seasons in a temperate deciduous forest. Forests 2019, 10(1), 8. [Google Scholar] [CrossRef]
- Matteucci, G.; Dore, S.; Stivanello, S.; Rebmann, C.; Buchmann, N. Soil respiration in beech and spruce forests in Europe: Trends, controlling factors, annual budgets and implications for the ecosystem carbon balance. In Carbon and Nitrogen Cycling in European Forest Ecosystems; Valentini, R., Ed.; Springer: Berlin/Heidelberg, Germany, 2015; Volume 142, pp. 217–236. [Google Scholar] [CrossRef]
- Lellei-Kovács, E.; Kovács-Láng, E.; Kalapos, T.; Botta-Dukát, Z.; Barabás, S.; Beier, C. Experimental warming does not enhance soil respiration in a semiarid temperate forest-steppe ecosystem. Community Ecol. 2008, 9(1), 29–37. [Google Scholar] [CrossRef]
- Farr, T.G.; Rosen, P.A.; Caro, E.; Crippen, R.; Duren, R.; Hensley, S.; Kobrick, M.; Paller, M.; Rodriguez, E.; Roth, L.; Seal, D.; Shaffer, S.; Shimada, J.; Umland, J.; Werner, M.; Oskin, M.; Burbank, D.; Alsdorf, D. The Shuttle Radar Topography Mission. Rev. Geophys. 2007, 45(2), RG2004. [Google Scholar] [CrossRef]
- Hatay, T.Y.; Turgut, B.; Işık, Ş.; Anagün, Y.; Mısır, M. Spatial modelling of climate variables across Türkiye’s forest ecosystems using meteorological station data. Turk. J. Agric. For. in press. [Google Scholar]
- Novick, K.A.; Ficklin, D.L.; Grossiord, C.; Konings, A.G.; Martínez-Vilalta, J.; Sadok, W.; Trugman, A.T.; Williams, A.P.; Wright, A.J.; Abatzoglou, J.T.; Dannenberg, M.P.; Gentine, P.; Guan, K.; Johnston, M.R.; Lowman, L.E.L.; Moore, D.J.P.; McDowell, N.G. The impacts of rising vapour pressure deficit in natural and managed ecosystems. Plant Cell Environ. 2024, 47(5), 1671–1700. [Google Scholar] [CrossRef] [PubMed]
- Novick, K.A.; Ficklin, D.L.; Stoy, P.C.; Williams, C.A.; Bohrer, G.; Oishi, A.C.; Papuga, S.A.; Blanken, P.D.; Noormets, A.; Sulman, B.N.; Scott, R.L.; Wang, L.; Phillips, R.P. The increasing importance of atmospheric demand for ecosystem water and carbon fluxes. Nat. Clim. Change 2016, 6, 1023–1027. [Google Scholar] [CrossRef]
- He, B.; Chen, C.; Lin, S.; Yuan, W.; Chen, H.W.; Chen, D.; Zhang, Y.; Guo, L.; Zhao, X.; Liu, X.; Piao, S.; Zhong, Z.; Wang, R.; Tang, R. Worldwide impacts of atmospheric vapor pressure deficit on the interannual variability of terrestrial carbon sinks. Natl. Sci. Rev. 2022, 9(4), nwab150. [Google Scholar] [CrossRef] [PubMed]
- Liu, Z.; Wang, Y.; Sun, L.; Jiang, J.; Jiang, L.; Wang, M.; Ye, J.; Cheng, Z. A study on the response characteristics of carbon flux exchange in Chinese fir forests to vapor pressure deficit. Sustainability 2024, 16(24), 10906. [Google Scholar] [CrossRef]
- Sun, Y.; Guan, Q.; Du, Q.; Wang, Q.; Sun, W. Elevation dependence of vegetation growth stages and carbon sequestration dynamics in high mountain ecosystems. Environ. Res. 2025, 273, 121200. [Google Scholar] [CrossRef] [PubMed]
- Churkina, G.; Running, S.W. Contrasting climatic controls on the estimated productivity of global terrestrial biomes. Ecosystems 1998, 1(2), 206–215. [Google Scholar] [CrossRef]
- Nemani, R.R.; Keeling, C.D.; Hashimoto, H.; Jolly, W.M.; Piper, S.C.; Tucker, C.J.; Myneni, R.B.; Running, S.W. Climate-driven increases in global terrestrial net primary production from 1982 to 1999. Science 2003, 300(5625), 1560–1563. [Google Scholar] [CrossRef] [PubMed]
- Rivas-Martínez, S.; Rivas-Sáenz, S.; Penas-Merino, A. Worldwide bioclimatic classification system. Glob. Geobot. 2011, 1(1), 1–638. [Google Scholar]
- Ivanova, N.; Fomin, V.; Kusbach, A. Experience of Forest Ecological Classification in Assessment of Vegetation Dynamics. Sustainability 2022, 14(6), 3384. [Google Scholar] [CrossRef]
- Ivanova, N. Global Overview of the Application of the Braun-Blanquet Approach in Research. Forests 2024, 15, 937. [Google Scholar] [CrossRef]
- Poorter, L.; van der Sande, M.T.; Thompson, J.; Arets, E.J.M.M.; Alarcón, A.; Álvarez-Sánchez, J.; Ascarrunz, N.; Balvanera, P.; Barajas-Guzmán, G.; Boit, A.; Bongers, F.; Carvalho, F.A.; Casanoves, F.; Cornejo-Tenorio, G.; Costa, F.R.C.; de Castilho, C.V.; Duivenvoorden, J.F.; Dutrieux, L.P.; Enquist, B.J.; Peña-Claros, M. Diversity enhances carbon storage in tropical forests. Glob. Ecol. Biogeogr. 2015, 24(11), 1314–1328. [Google Scholar] [CrossRef]
- Reich, P.B. The world-wide ‘fast–slow’ plant economics spectrum: A traits manifesto. J. Ecol. 2014, 102(2), 275–301. [Google Scholar] [CrossRef]
- Salekin, S.; Dickinson, Y.L.; Bloomberg, M.; Meason, D.F. Carbon sequestration potential of plantation forests in New Zealand: No single tree species is universally best. Carbon Balance Manag. 2024, 19, 11. [Google Scholar] [CrossRef] [PubMed]
- Gough, C.M.; Atkins, J.W.; Fahey, R.T.; Hardiman, B.S. High rates of primary production in structurally complex forests. Ecology 2019, 100(10), e02864. [Google Scholar] [CrossRef] [PubMed]
- Xu, Y.; Chen, H.Y.H.; Qiao, X.; Zhang, Y.; Jiang, M. The control of external and internal canopy structural heterogeneity on diversity and productivity relationship in a subtropical forest. For. Ecosyst. 2024, 11, 100246. [Google Scholar] [CrossRef]
- Skovsgaard, J.P.; Vanclay, J.K. Forest site productivity: A review of the evolution of dendrometric concepts for even-aged stands. Forestry 2008, 81(1), 13–31. [Google Scholar] [CrossRef]
- Skovsgaard, J.P.; Vanclay, J.K. Forest site productivity: A review of spatial and temporal variability in natural site conditions. Forestry 2013, 86(3), 305–315. [Google Scholar] [CrossRef]
- Pretzsch, H. Forest Dynamics, Growth and Yield: From Measurement to Model; Springer: Berlin/Heidelberg, Germany, 2009. [Google Scholar] [CrossRef]
- Ivanova, N.S.; Zolotova, E.S.; Li, G. Influence of soil moisture regime on the species biomass of the herb layer of pine forests in the Ural Mountains. Ecol. Quest. 2021, 32(2). [Google Scholar] [CrossRef]
- Luyssaert, S.; Schulze, E.-D.; Börner, A.; Knohl, A.; Hessenmöller, D.; Law, B.E.; Ciais, P.; Grace, J. Old-growth forests as global carbon sinks. Nature 2008, 455(7210), 213–215. [Google Scholar] [CrossRef] [PubMed]
- Binkley, D. Acorn review: The persistent mystery of declining growth in older forests. For. Ecol. Manag. 2023, 538, 121004. [Google Scholar] [CrossRef]
- Tian, L.; Tao, Y.; Simms, J.; Mäkelä, A.; Li, M. How forest age impacts on net primary productivity: Insights from future multi-scenarios. For. Ecosyst. 2024, 11, 100228. [Google Scholar] [CrossRef]
- Forrester, D.I.; Bauhus, J. A review of processes behind diversity–productivity relationships in forests. Curr. For. Rep. 2016, 2(1), 45–61. [Google Scholar] [CrossRef]
- Ivanova, N. Forest Stand Changes Drive Conservation of Understory Composition and Biomass in the Boreal Forest of the Southern Urals. Diversity 2025, 17, 672. [Google Scholar] [CrossRef]
- Sax, D.F.; Stachowicz, J.J.; Brown, J.H.; Bruno, J.F.; Dawson, M.N.; Gaines, S.D.; Grosberg, R.K.; Hastings, A.; Holt, R.D.; Mayfield, M.M.; O’Connor, M.I.; Rice, W.R. Ecological and evolutionary insights from species invasions. Trends Ecol. Evol. 2007, 22(9), 465–471. [Google Scholar] [CrossRef] [PubMed]
- Vilà, M.; Espinar, J.L.; Hejda, M.; Hulme, P.E.; Jarošík, V.; Maron, J.L.; Pergl, J.; Schaffner, U.; Sun, Y.; Pyšek, P. Ecological impacts of invasive alien plants: A meta-analysis of their effects on species, communities and ecosystems. Ecol. Lett. 2011, 14(7), 702–718. [Google Scholar] [CrossRef] [PubMed]
Figure 1.
Spatial distribution of the eight ecological zones in the Turkish forest areas, delineated based on the dominant climate regime, vegetation physiognomy, and bioclimatic characteristics.
Figure 1.
Spatial distribution of the eight ecological zones in the Turkish forest areas, delineated based on the dominant climate regime, vegetation physiognomy, and bioclimatic characteristics.
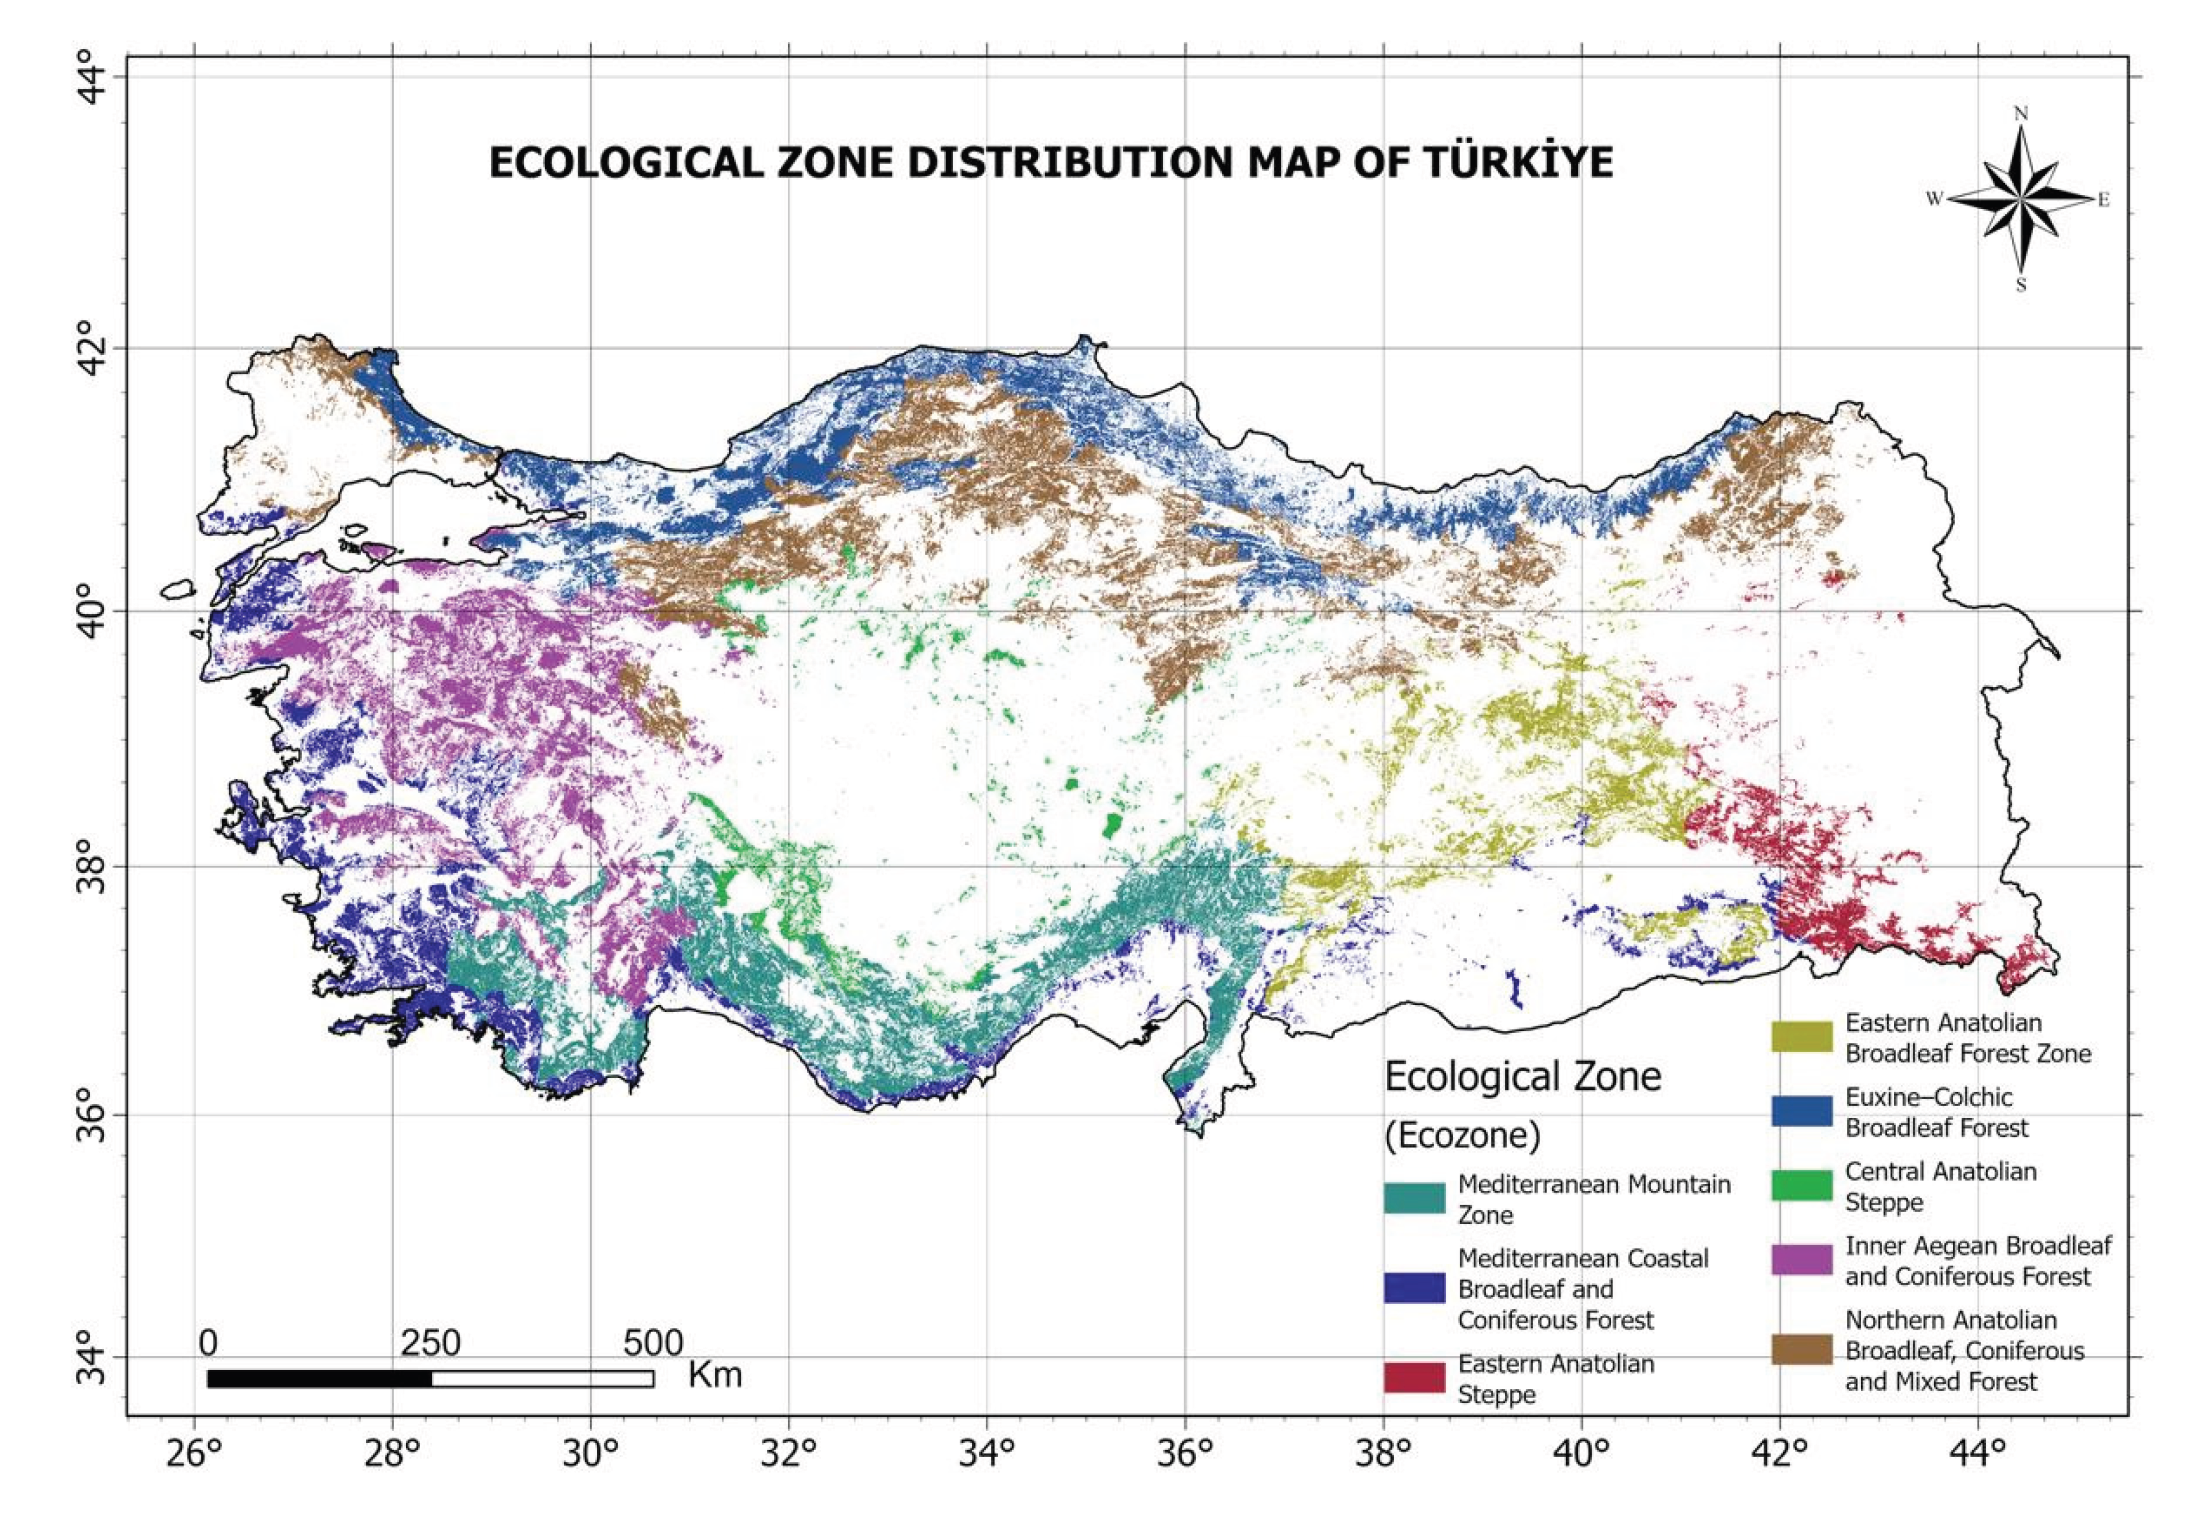
Figure 2.
Path diagram for the CSC. Standardised path coefficients (β) on the arrows; blue solid = positive effect, red dashed = negative effect, doubleheaded = covariance.
Figure 2.
Path diagram for the CSC. Standardised path coefficients (β) on the arrows; blue solid = positive effect, red dashed = negative effect, doubleheaded = covariance.
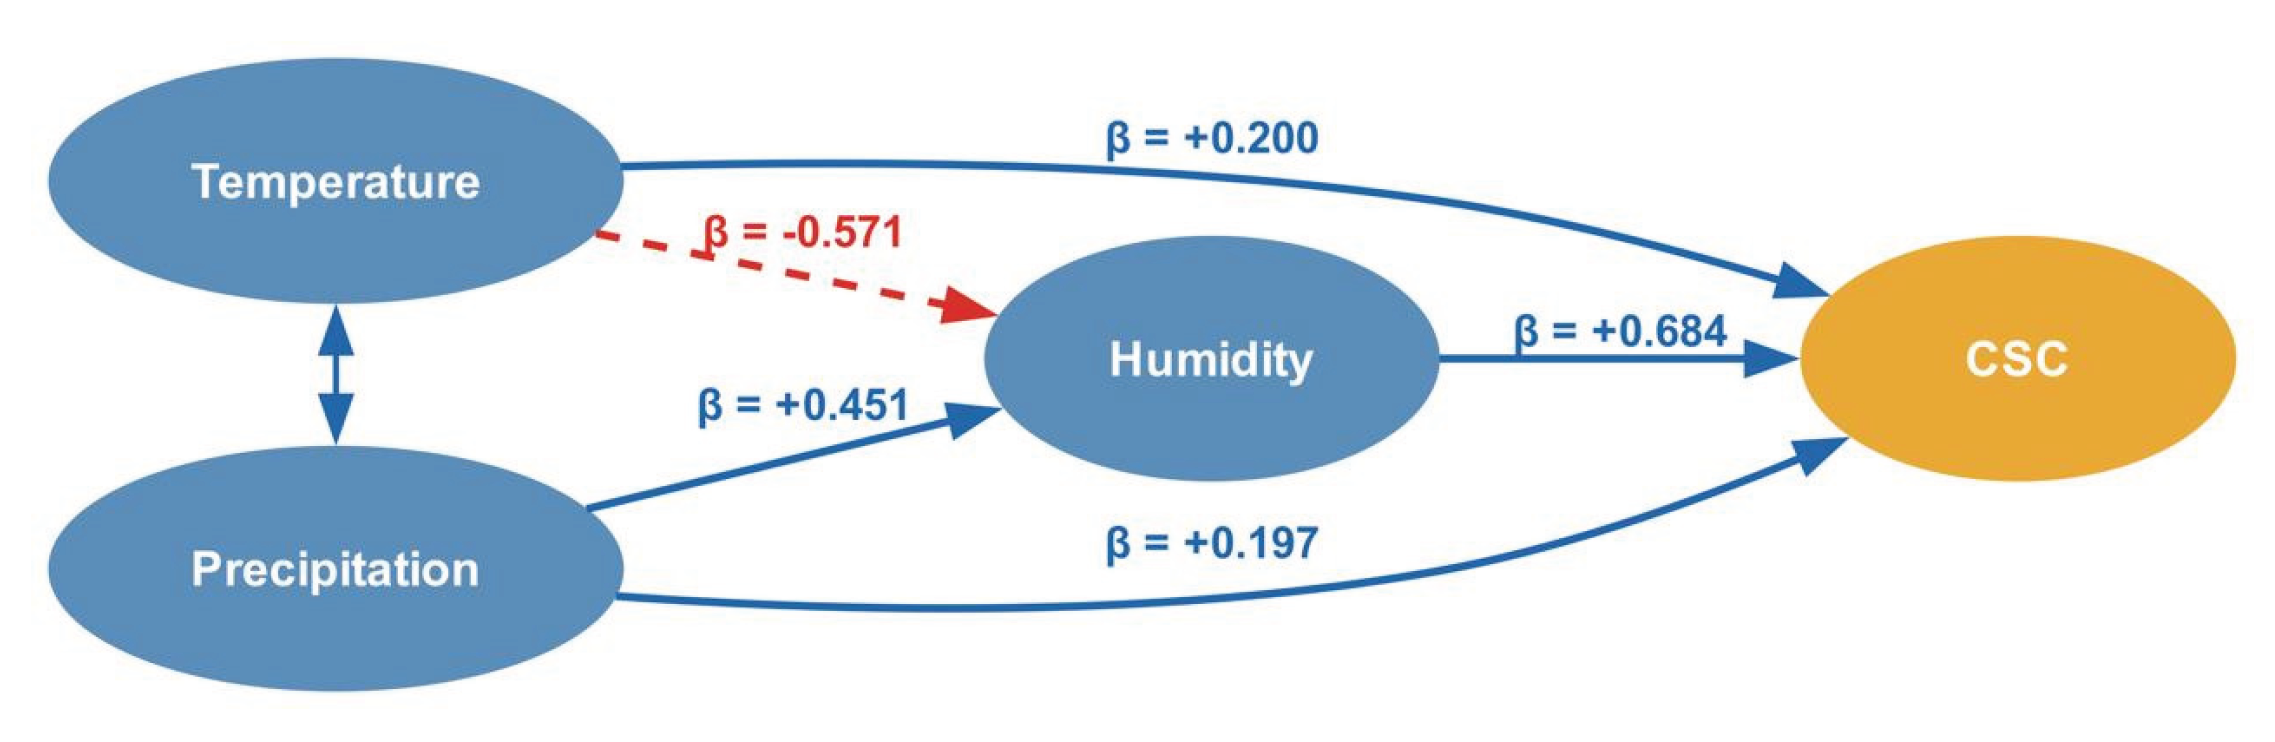
Figure 3.
Path diagram for NEP (symbols as in Figure 2).
Figure 3.
Path diagram for NEP (symbols as in Figure 2).
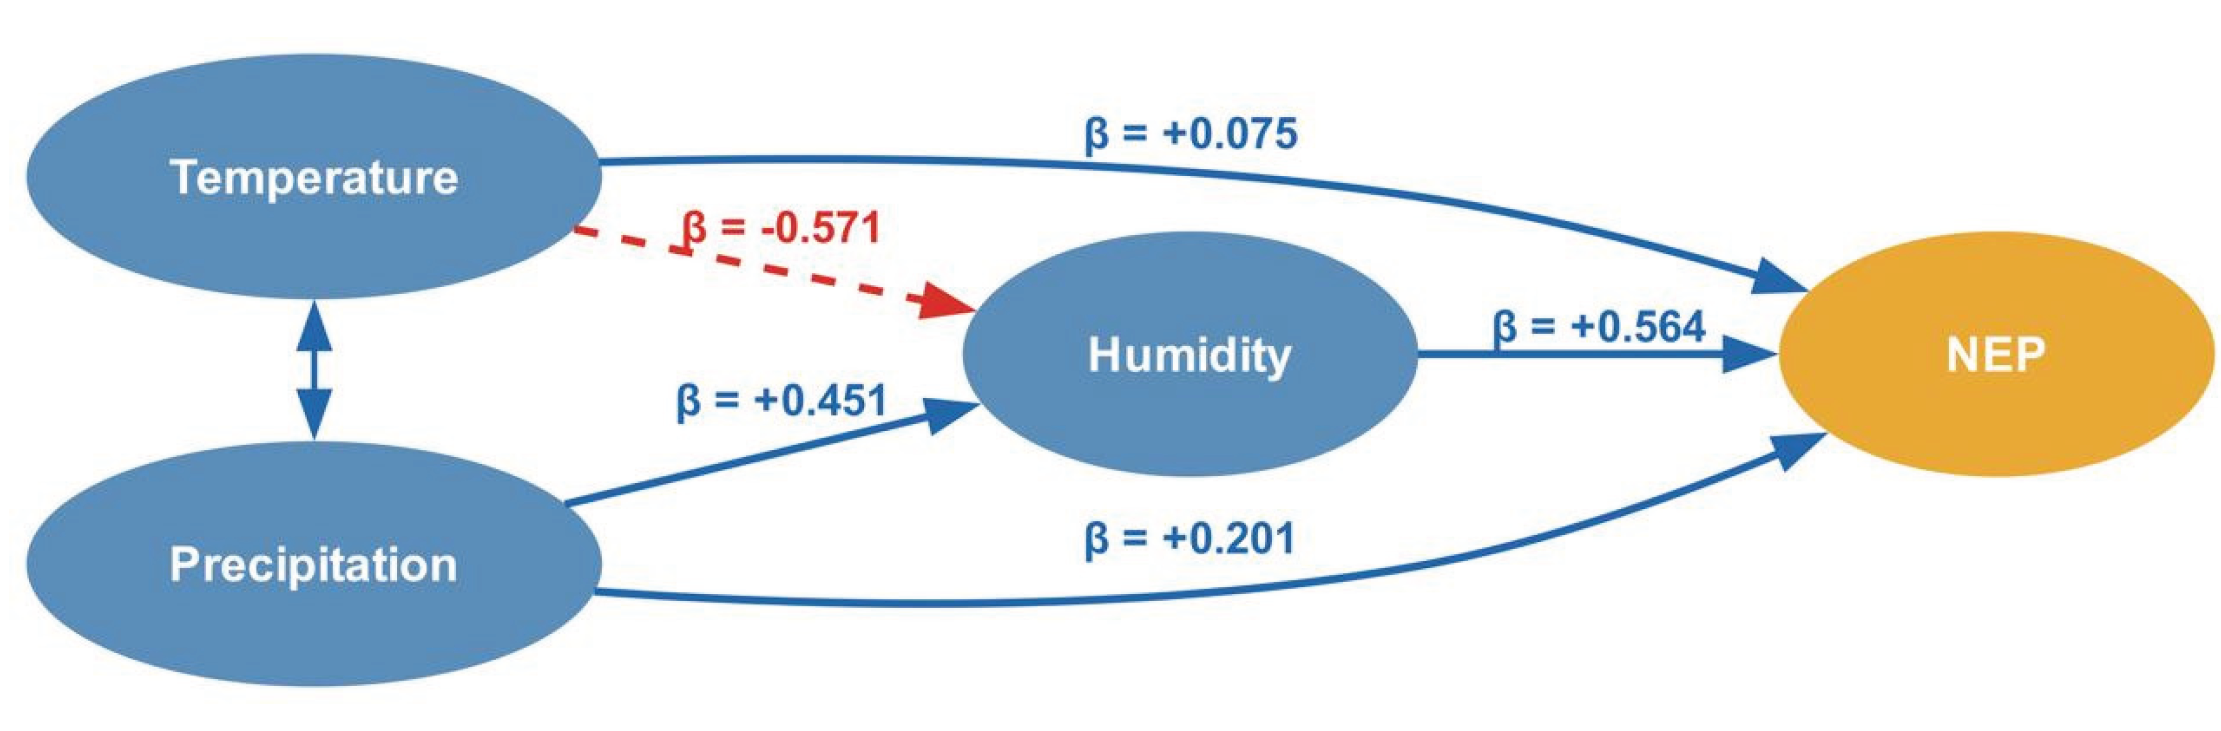
Figure 4.
Distribution of the carbon sequestration capacity (CSC) in ecological zones in Türkiye forest. The The white diamonds indicate ecozone means; the red dashed line shows the national mean.
Figure 4.
Distribution of the carbon sequestration capacity (CSC) in ecological zones in Türkiye forest. The The white diamonds indicate ecozone means; the red dashed line shows the national mean.
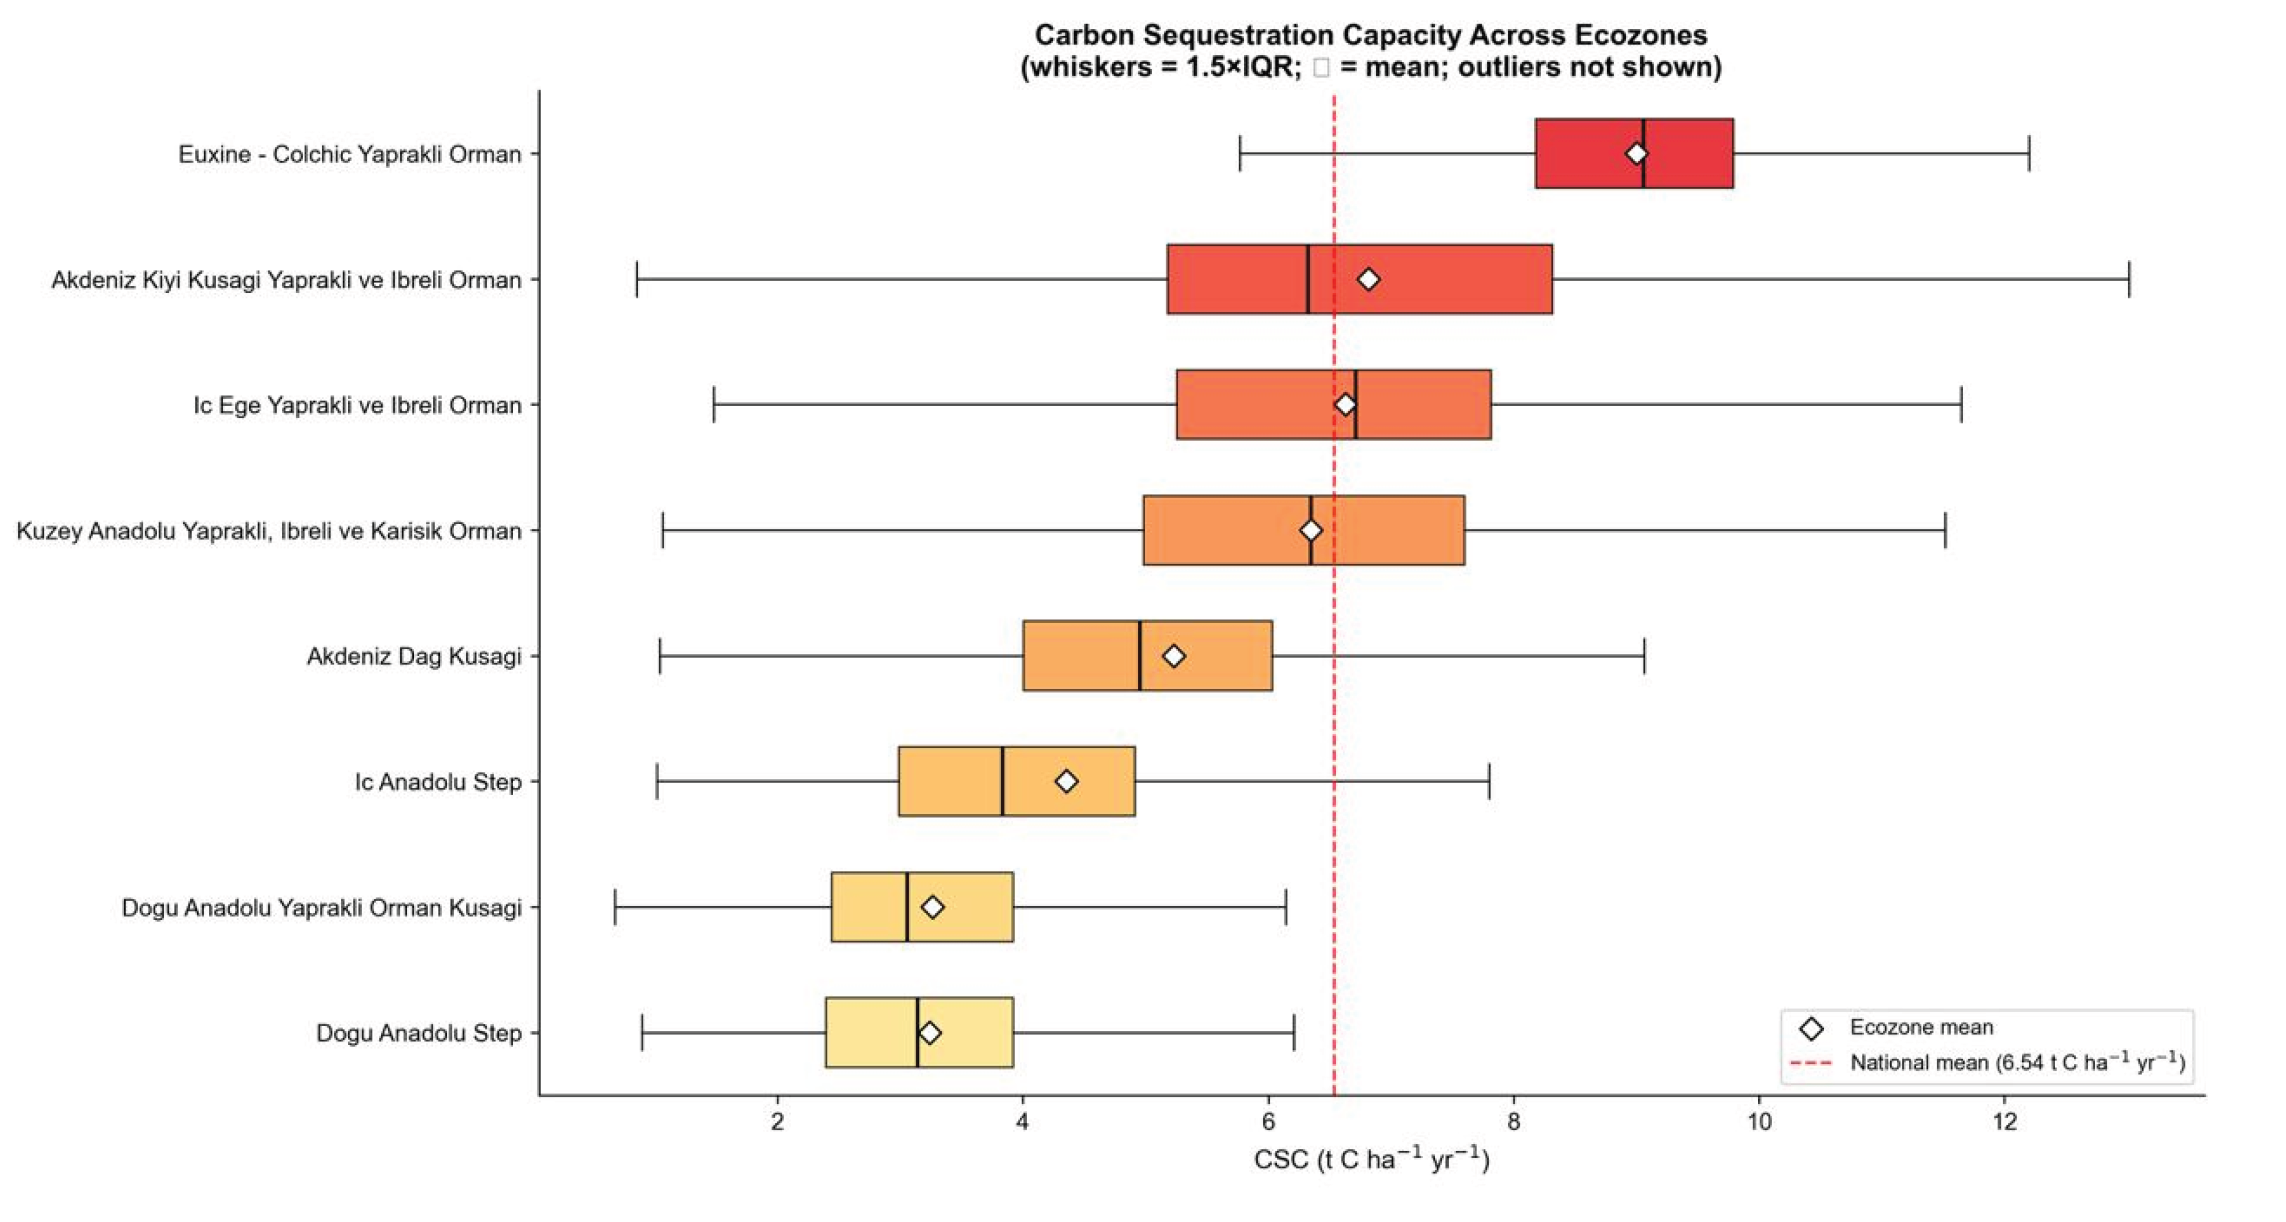
Figure 5.
Distribution of net ecosystem production (NEP) across ecological zones in Türkiye forests. White diamonds indicate ecozone means; the red dashed line shows the national mean.
Figure 5.
Distribution of net ecosystem production (NEP) across ecological zones in Türkiye forests. White diamonds indicate ecozone means; the red dashed line shows the national mean.
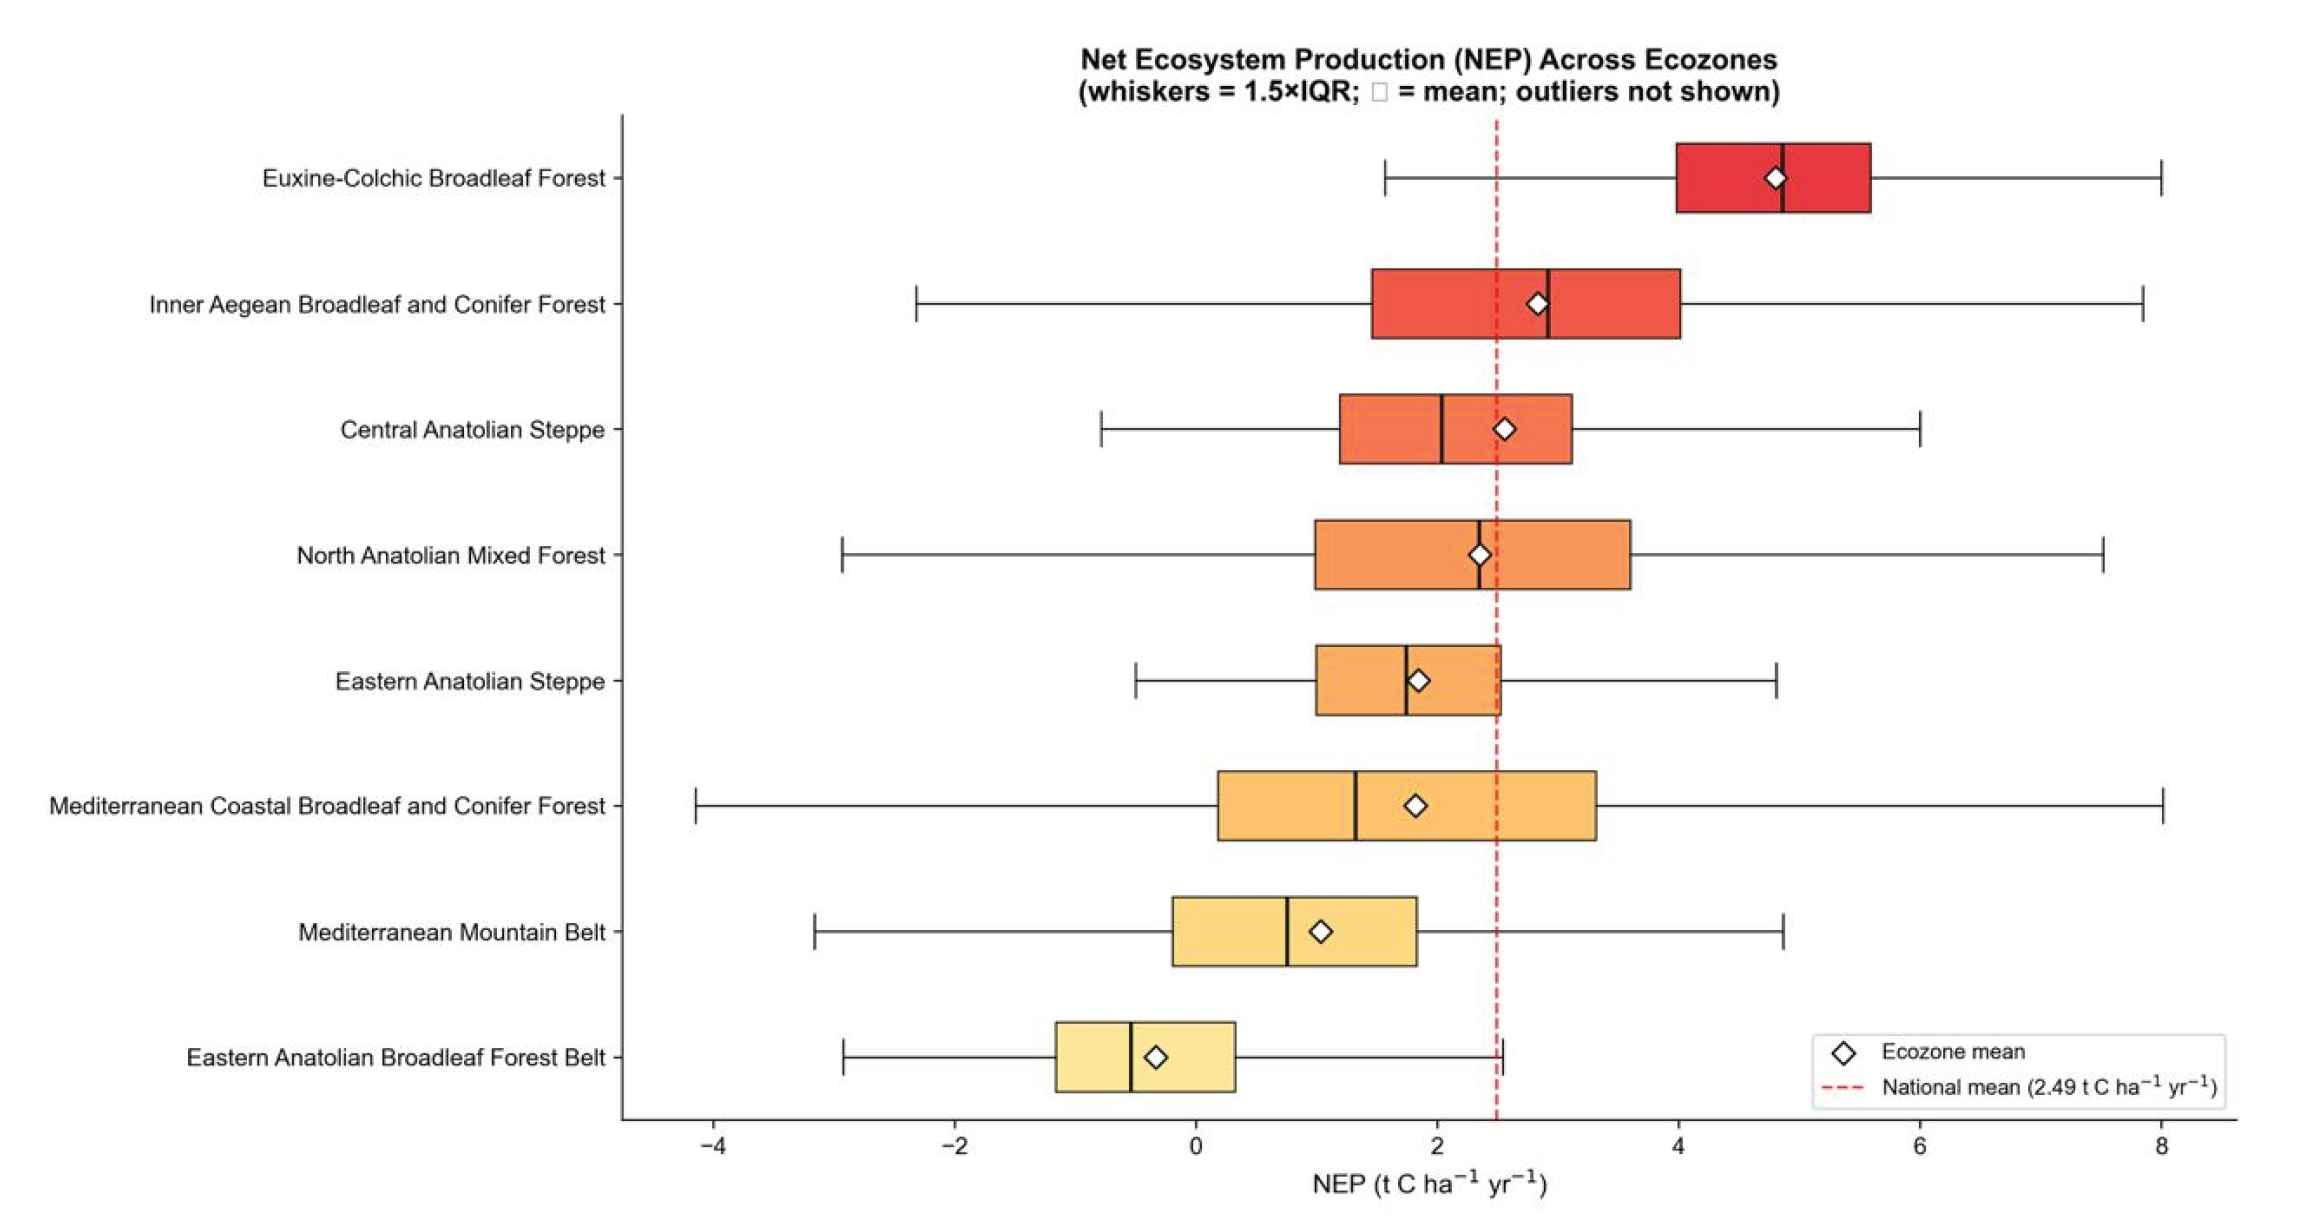
Figure 6.
Distribution of CSC between tree species in Türkiye forests (symbols as in Figure 4).
Figure 6.
Distribution of CSC between tree species in Türkiye forests (symbols as in Figure 4).
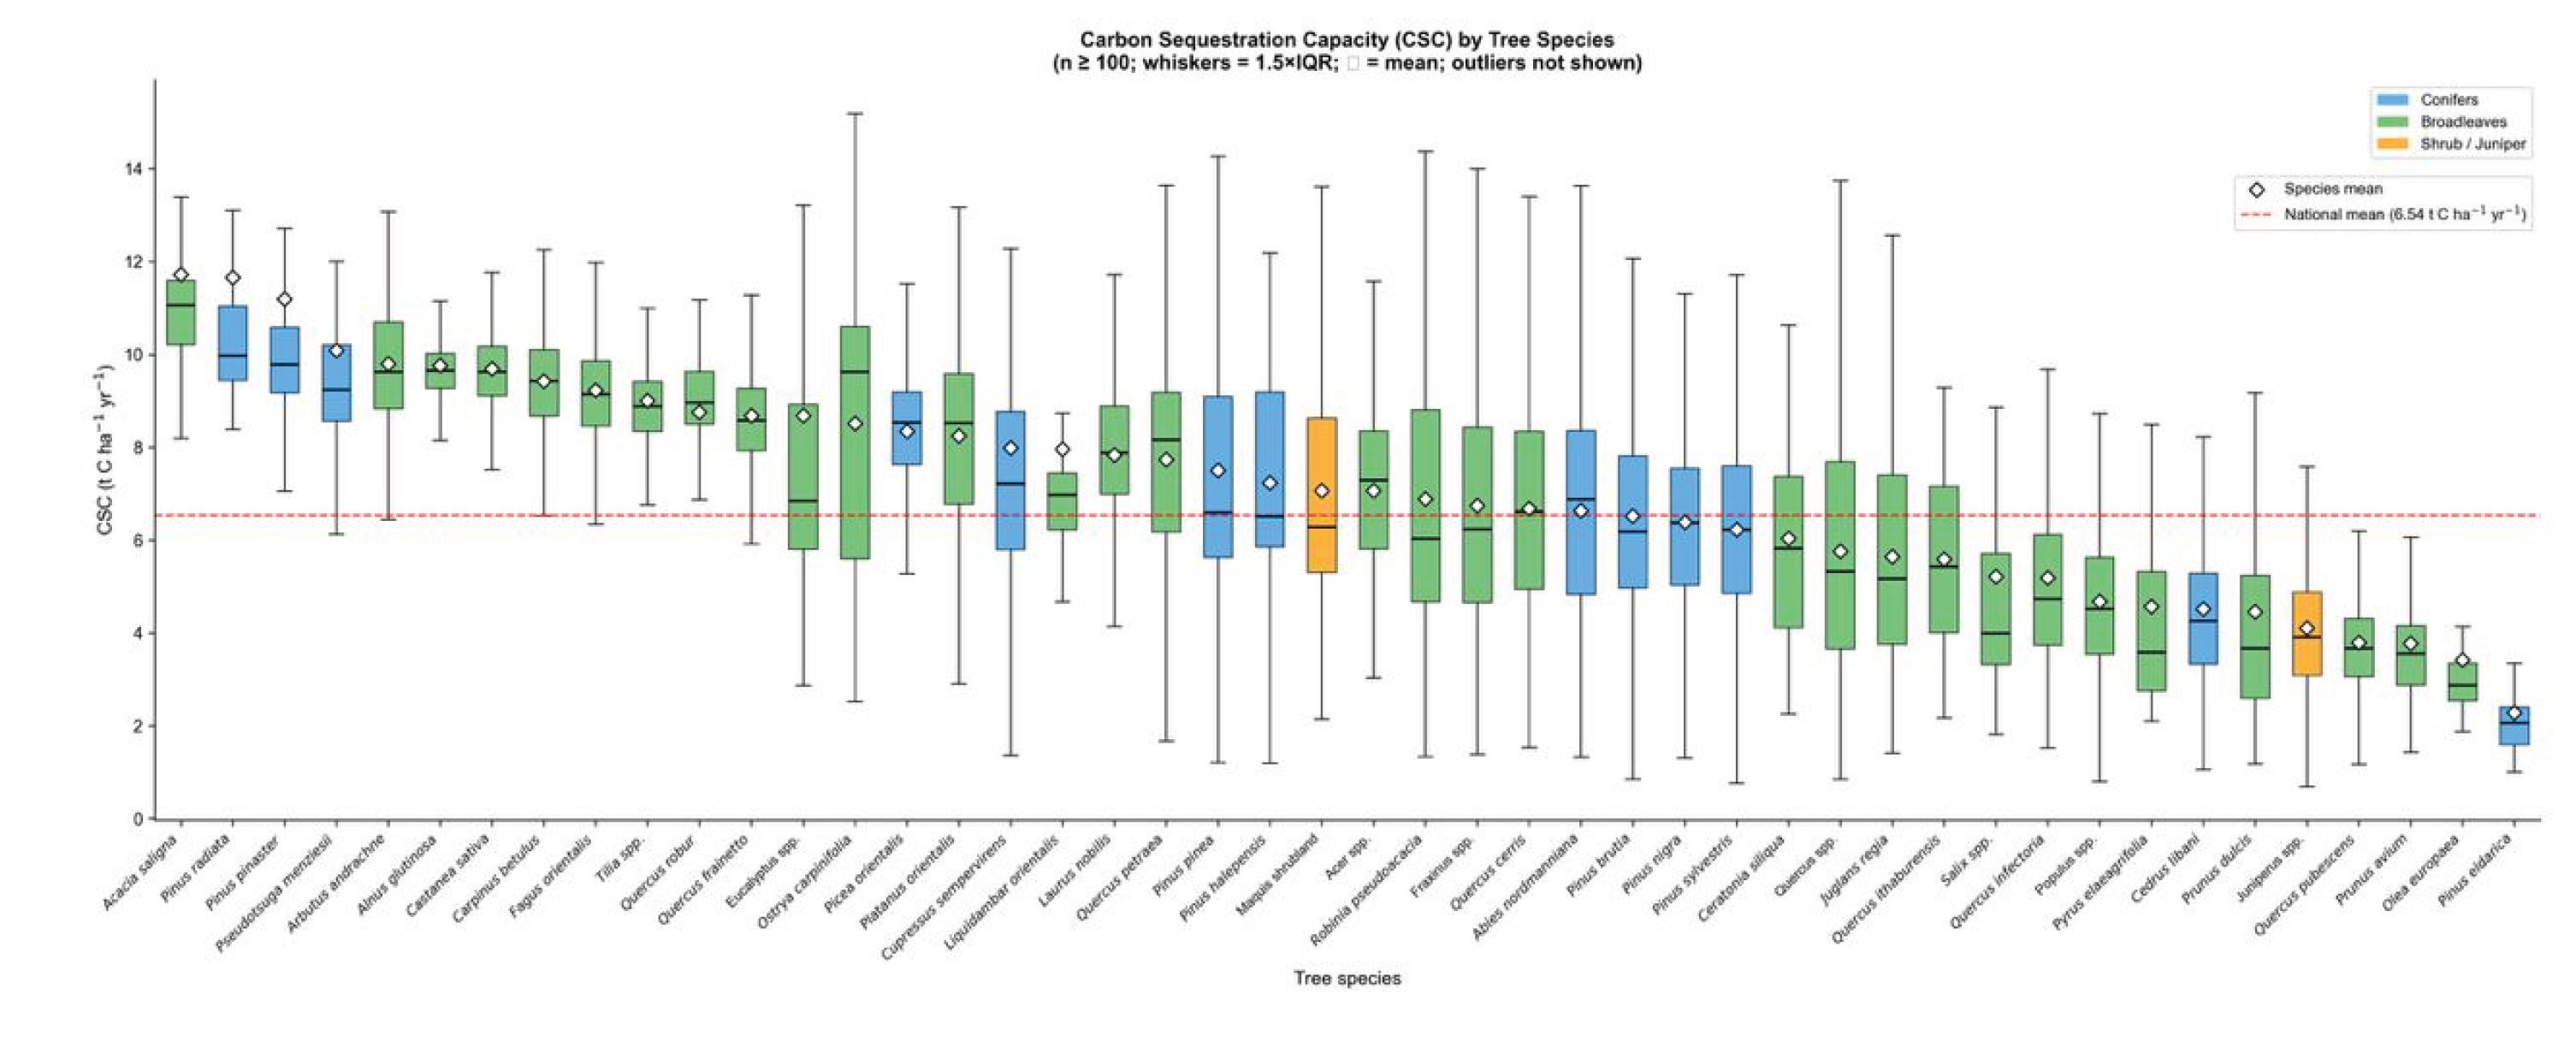
Figure 7.
Distribution of NEP between tree species in Türkiye forests (symbols as in Figure 5).
Figure 7.
Distribution of NEP between tree species in Türkiye forests (symbols as in Figure 5).
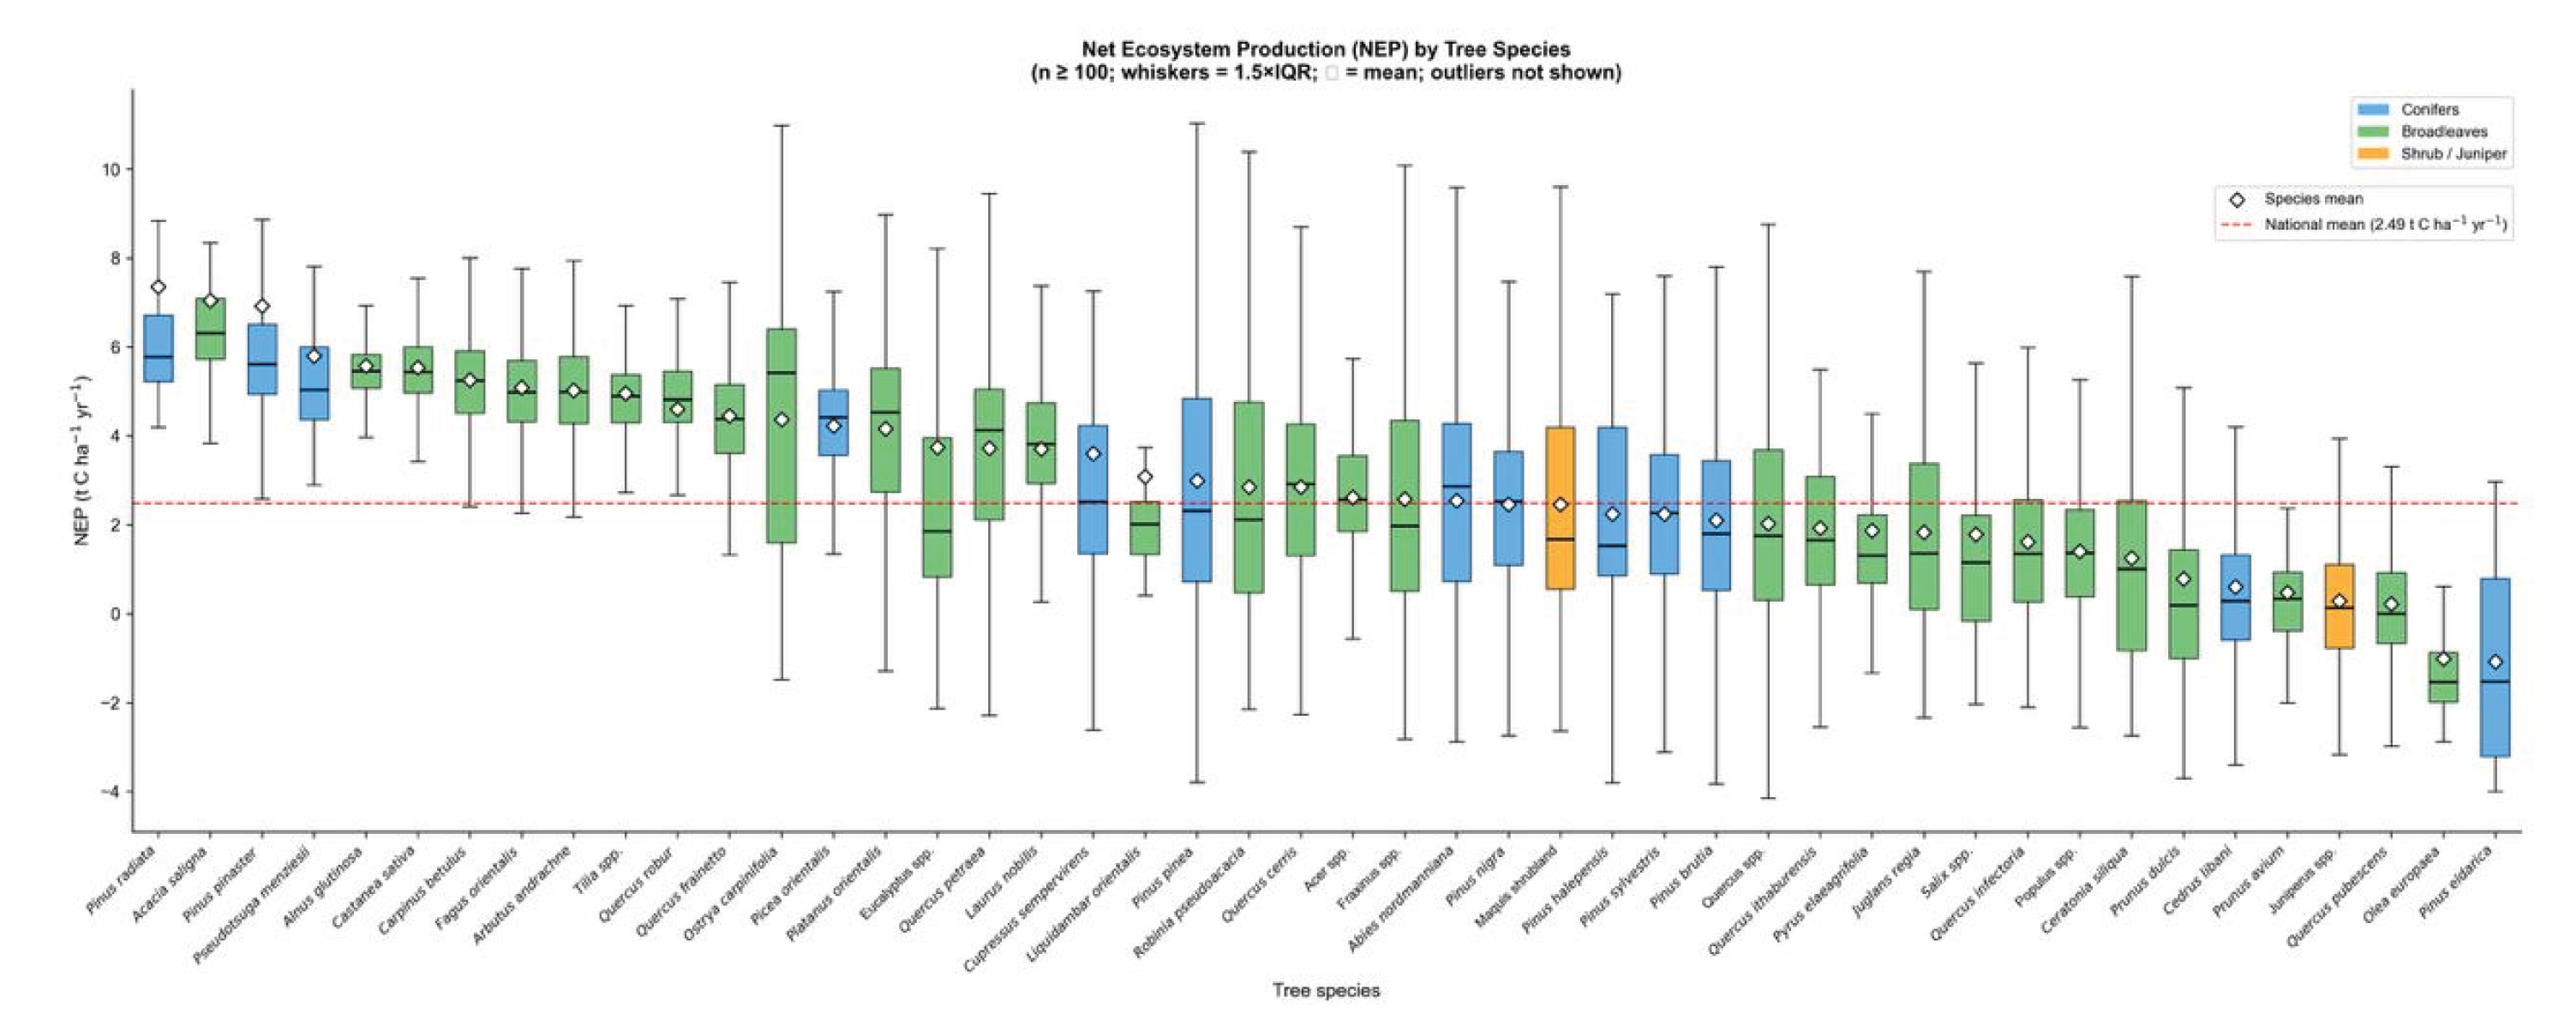
Figure 8.
Distribution of CSC across canopy closure classes in Türkiye’s forests (symbols as in Figure 4).
Figure 8.
Distribution of CSC across canopy closure classes in Türkiye’s forests (symbols as in Figure 4).
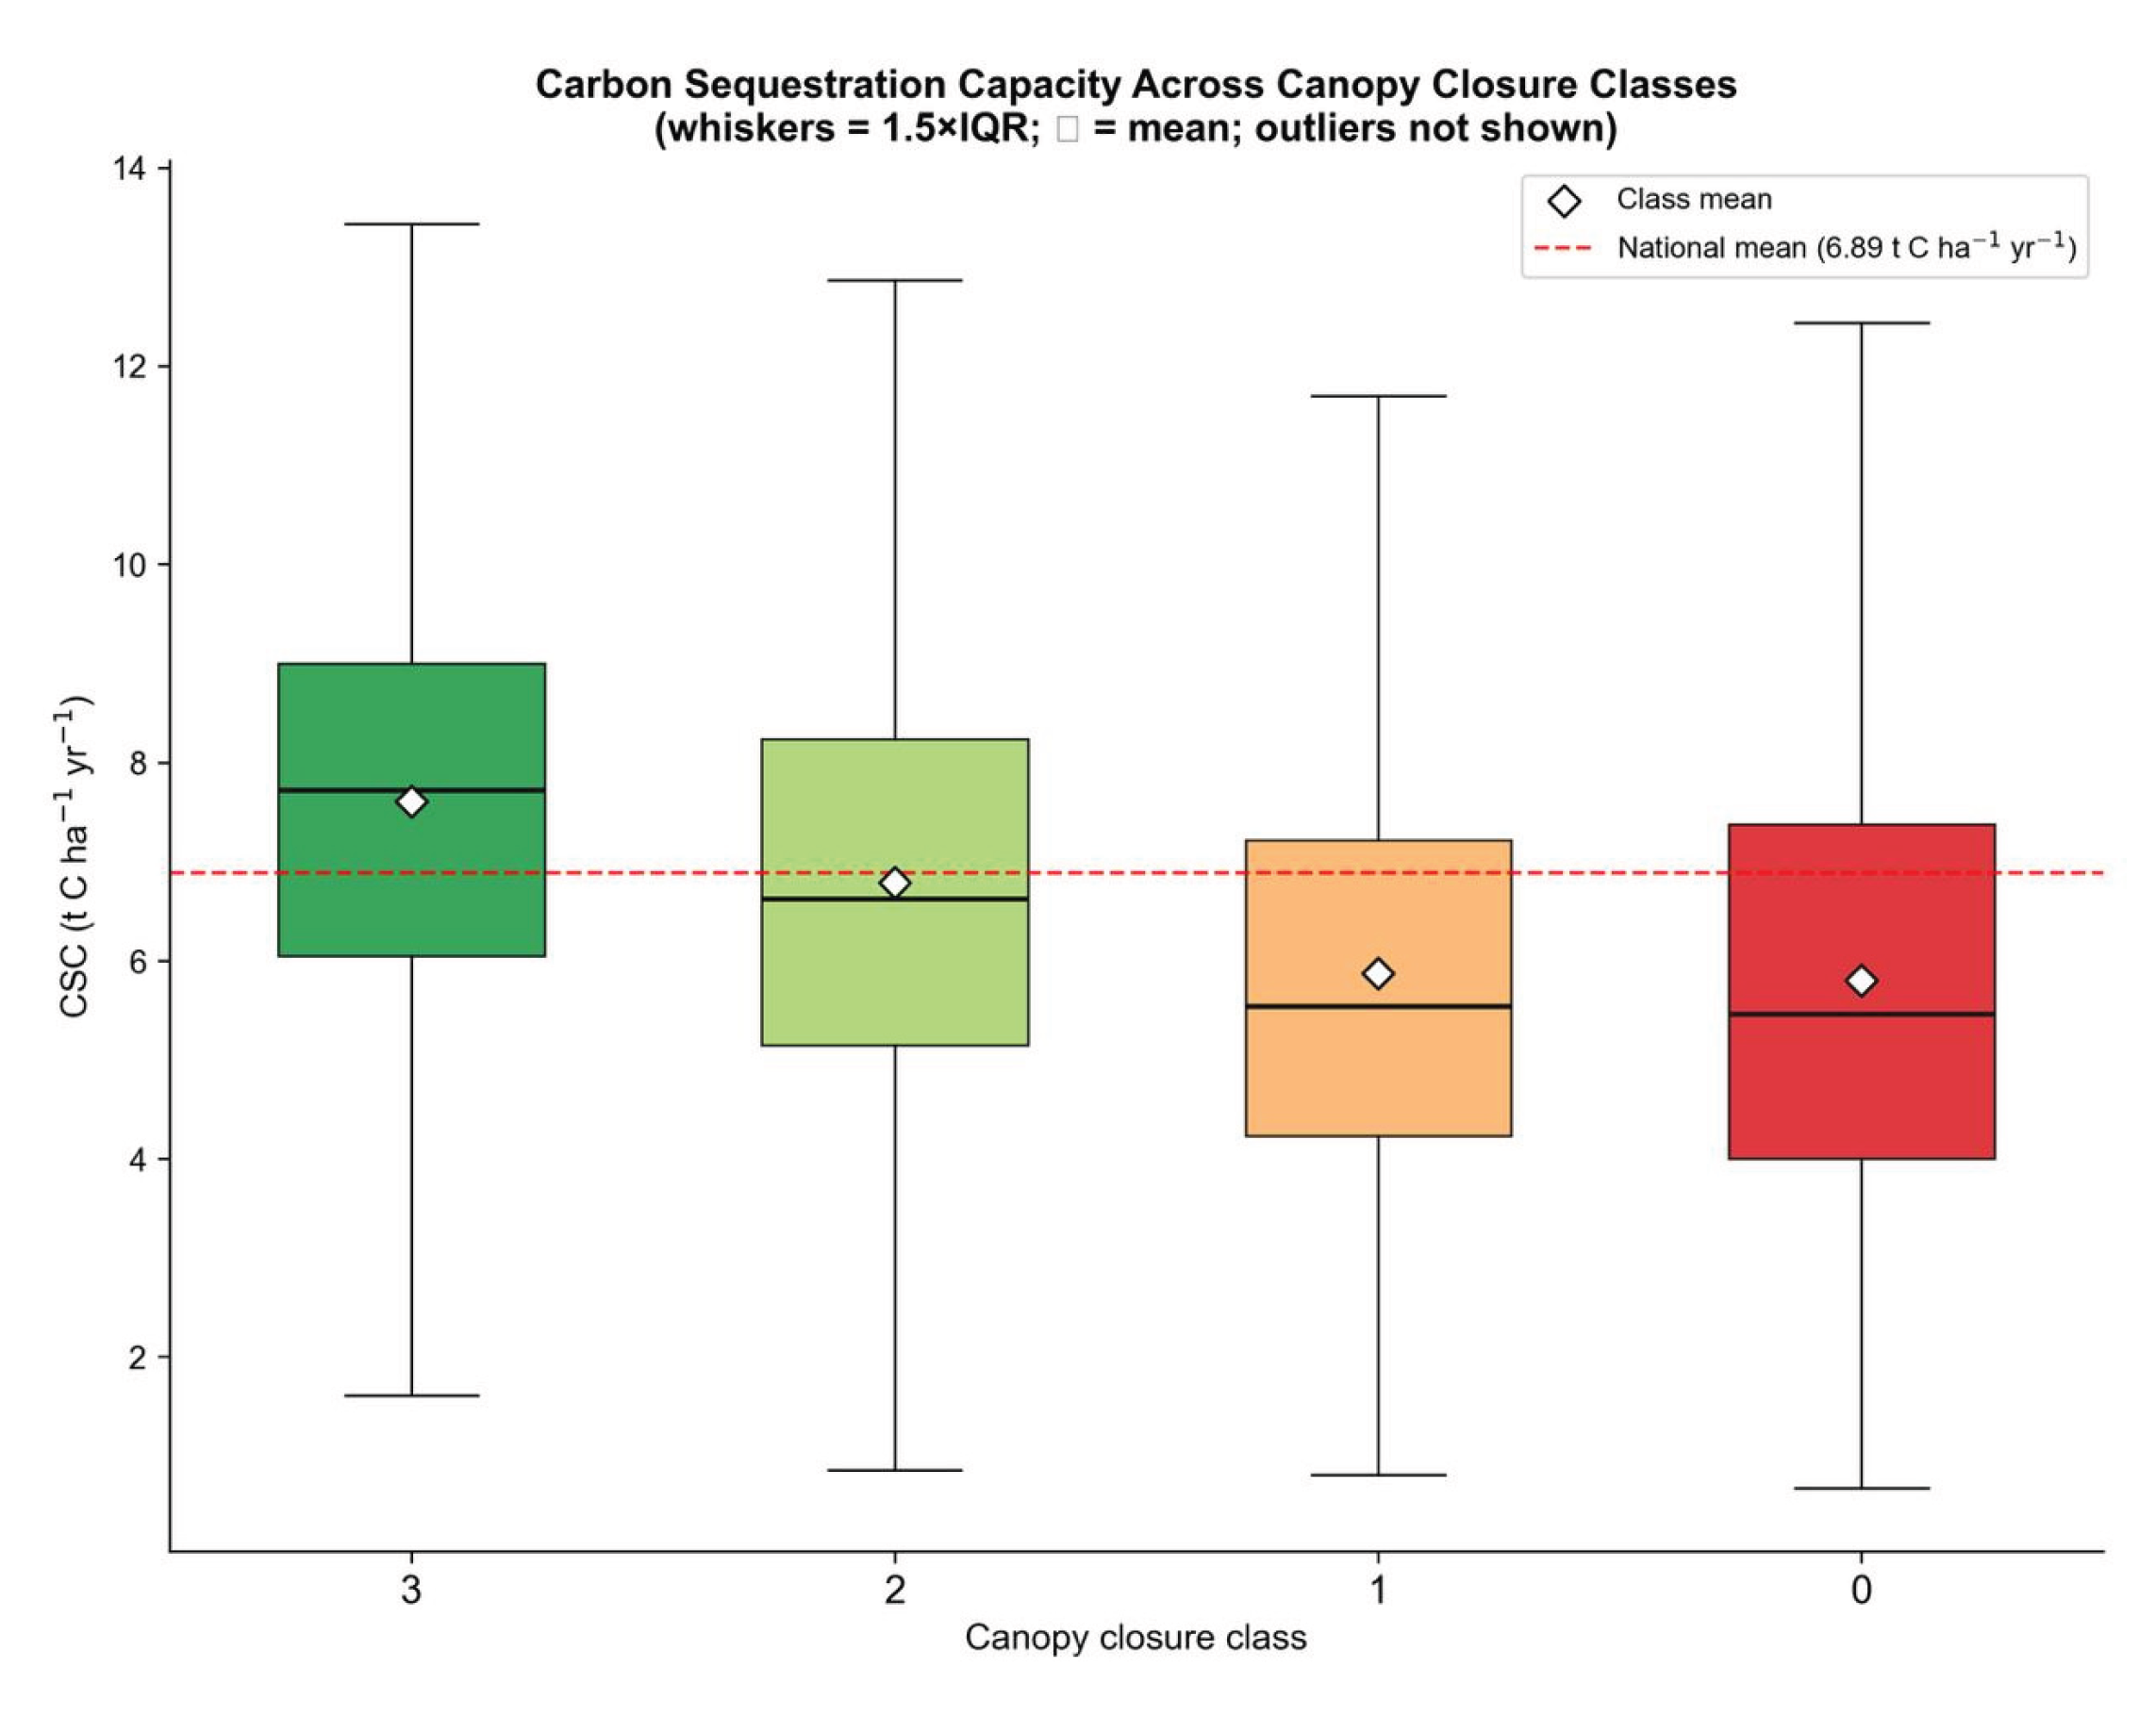
Figure 9.
Distribution of NEP across canopy closure classes in Türkiye’s forests (symbols as in Figure 5).
Figure 9.
Distribution of NEP across canopy closure classes in Türkiye’s forests (symbols as in Figure 5).
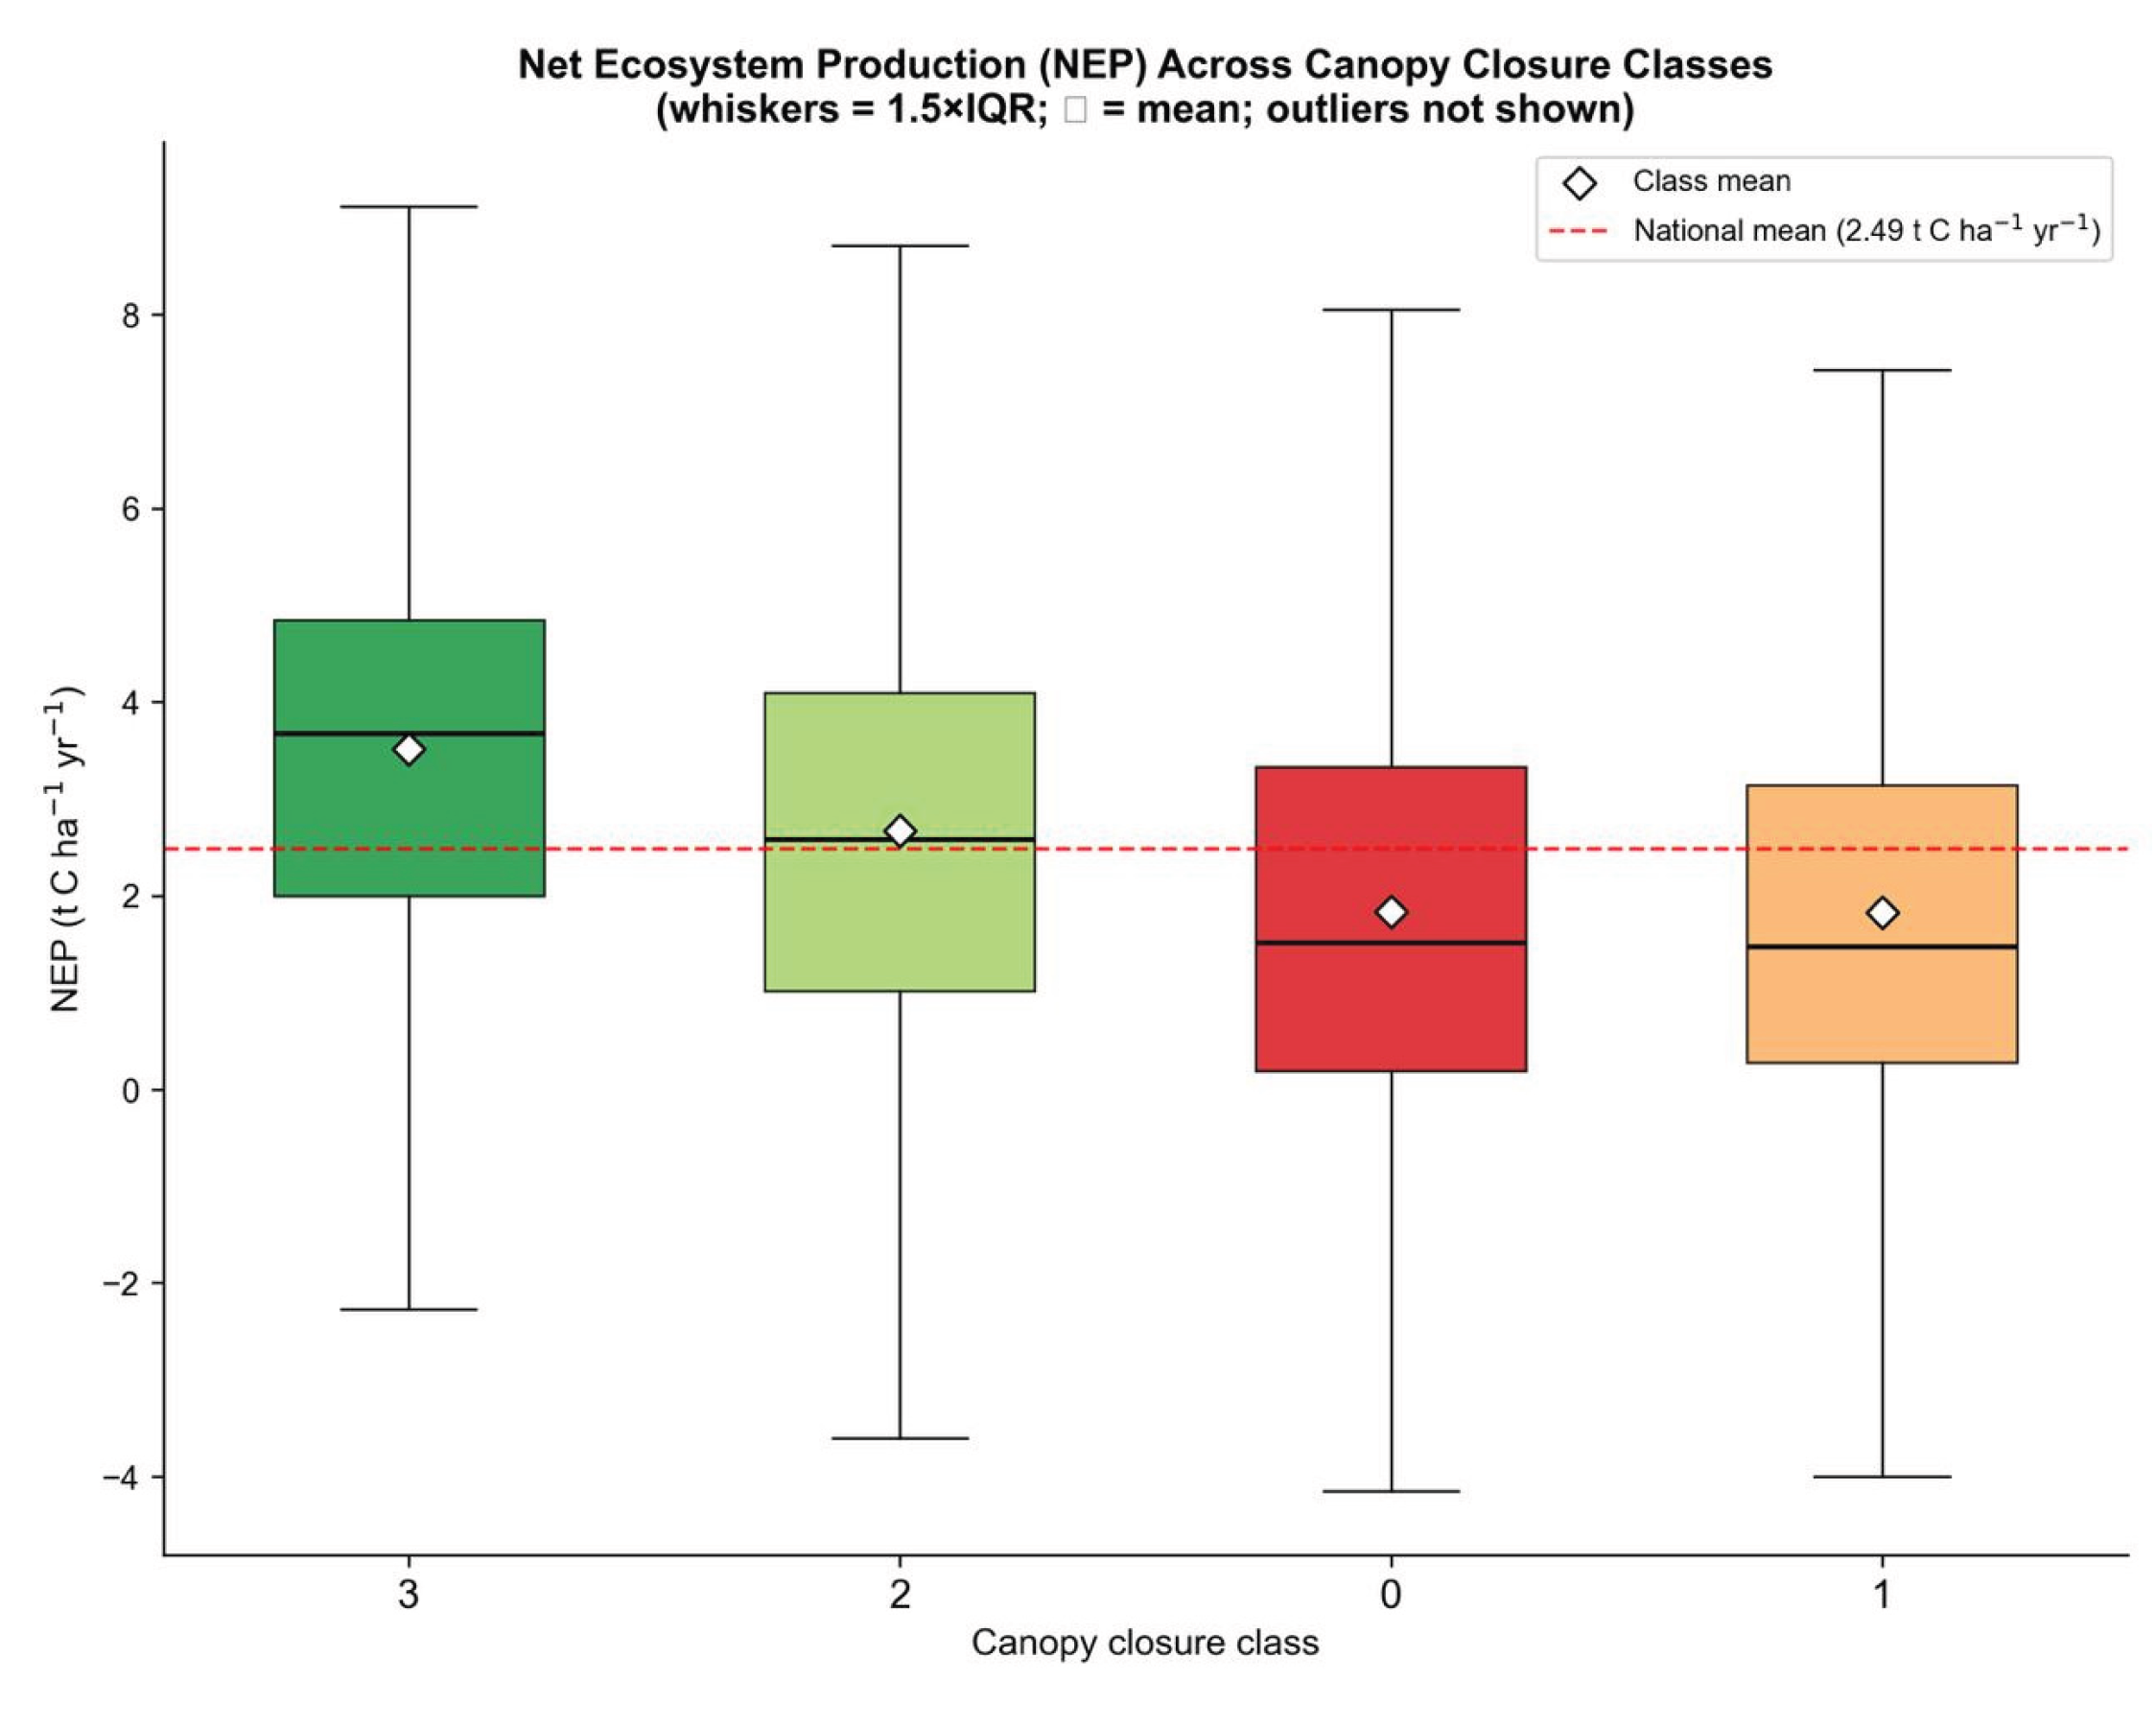
Figure 10.
Distribution of CSC between site index classes in Türkiye’s forests (symbols as in Figure 4).
Figure 10.
Distribution of CSC between site index classes in Türkiye’s forests (symbols as in Figure 4).
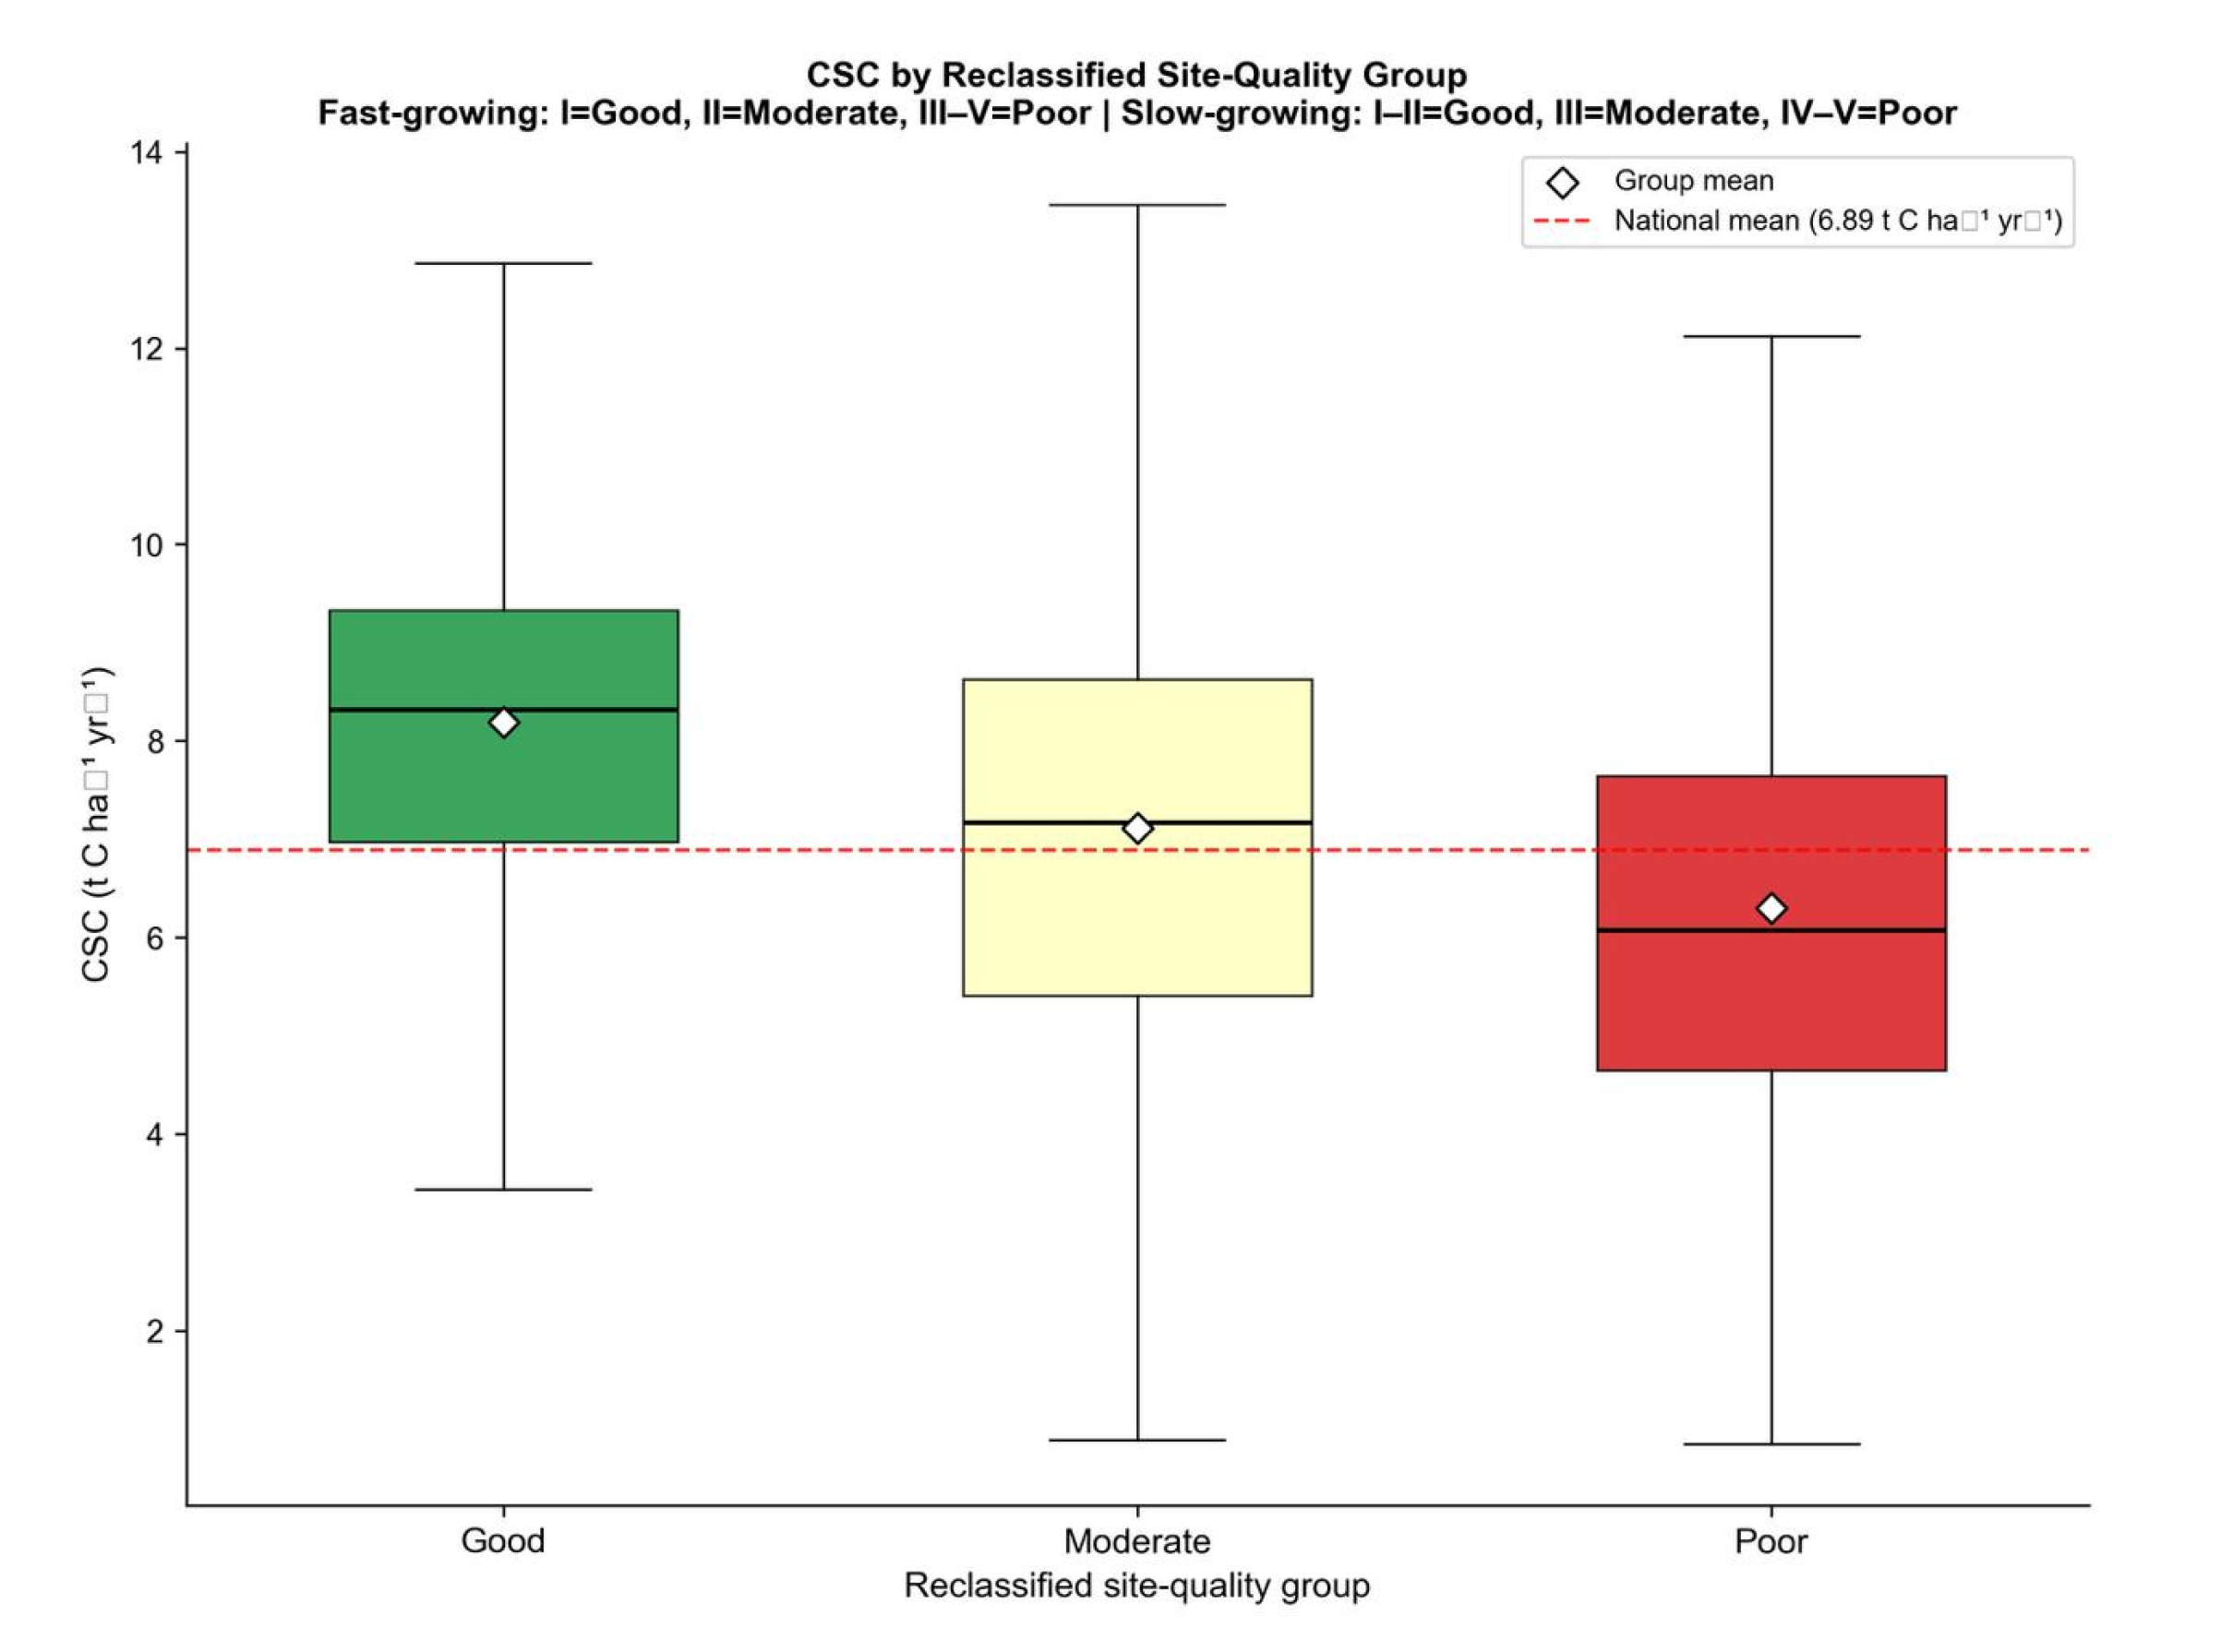
Figure 11.
Distribution of NEP across site index classes in Türkiye forests (symbols as in Figure 5).
Figure 11.
Distribution of NEP across site index classes in Türkiye forests (symbols as in Figure 5).
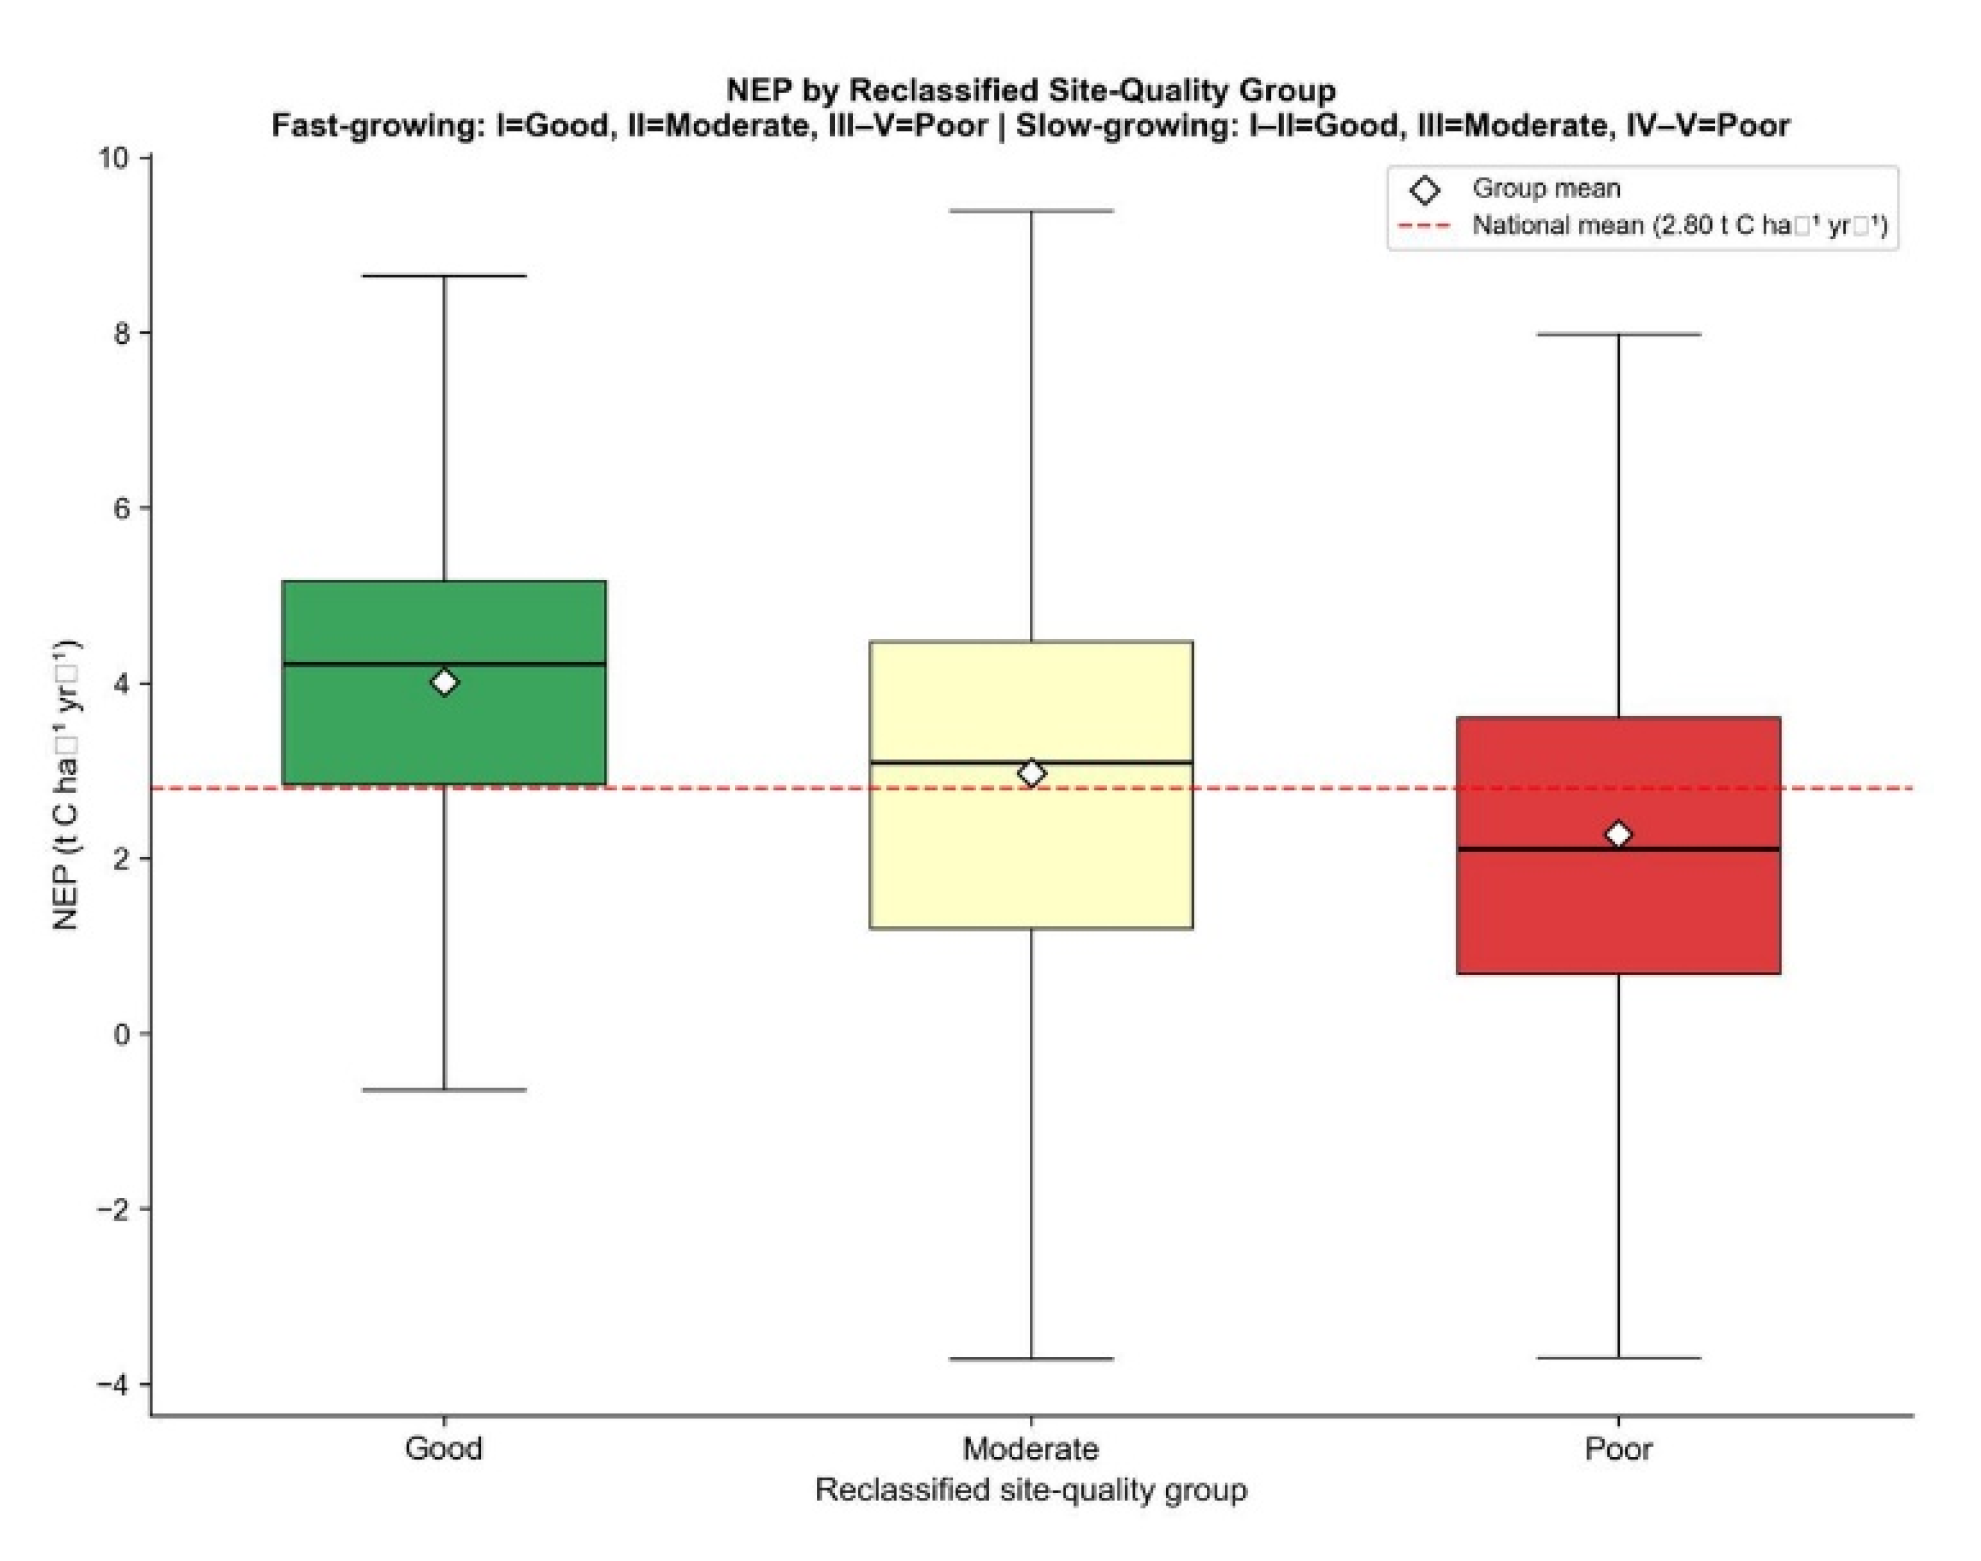
Figure 12.
Distribution of CSC across stand development classes in Türkiye’s forests (symbols as in Figure 4).
Figure 12.
Distribution of CSC across stand development classes in Türkiye’s forests (symbols as in Figure 4).
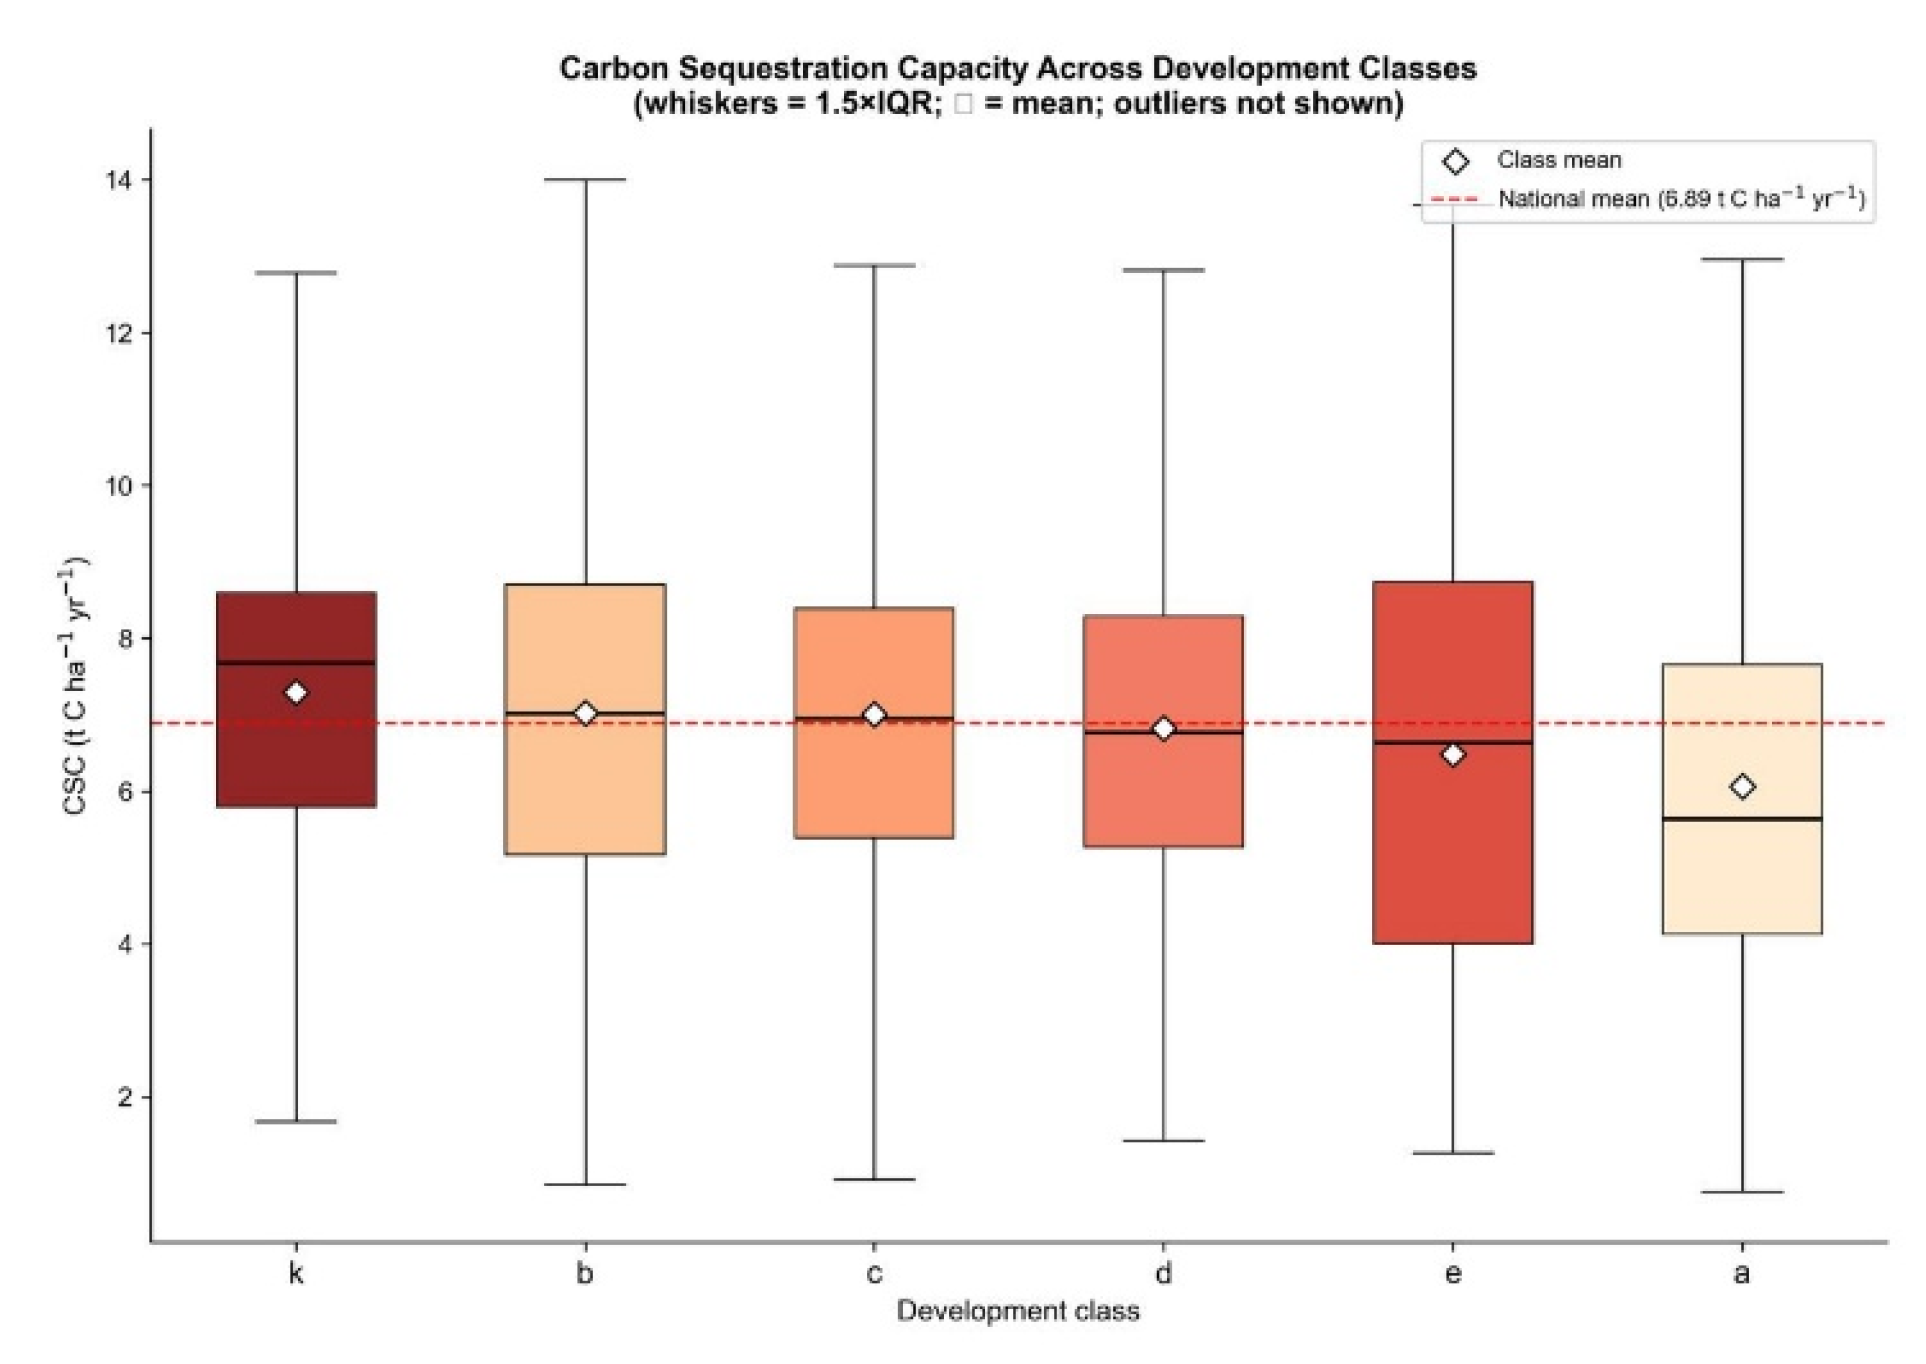
Figure 13.
Distribution of NEP across stand development classes in Türkiye’s forests (symbols as in Figure 5).
Figure 13.
Distribution of NEP across stand development classes in Türkiye’s forests (symbols as in Figure 5).
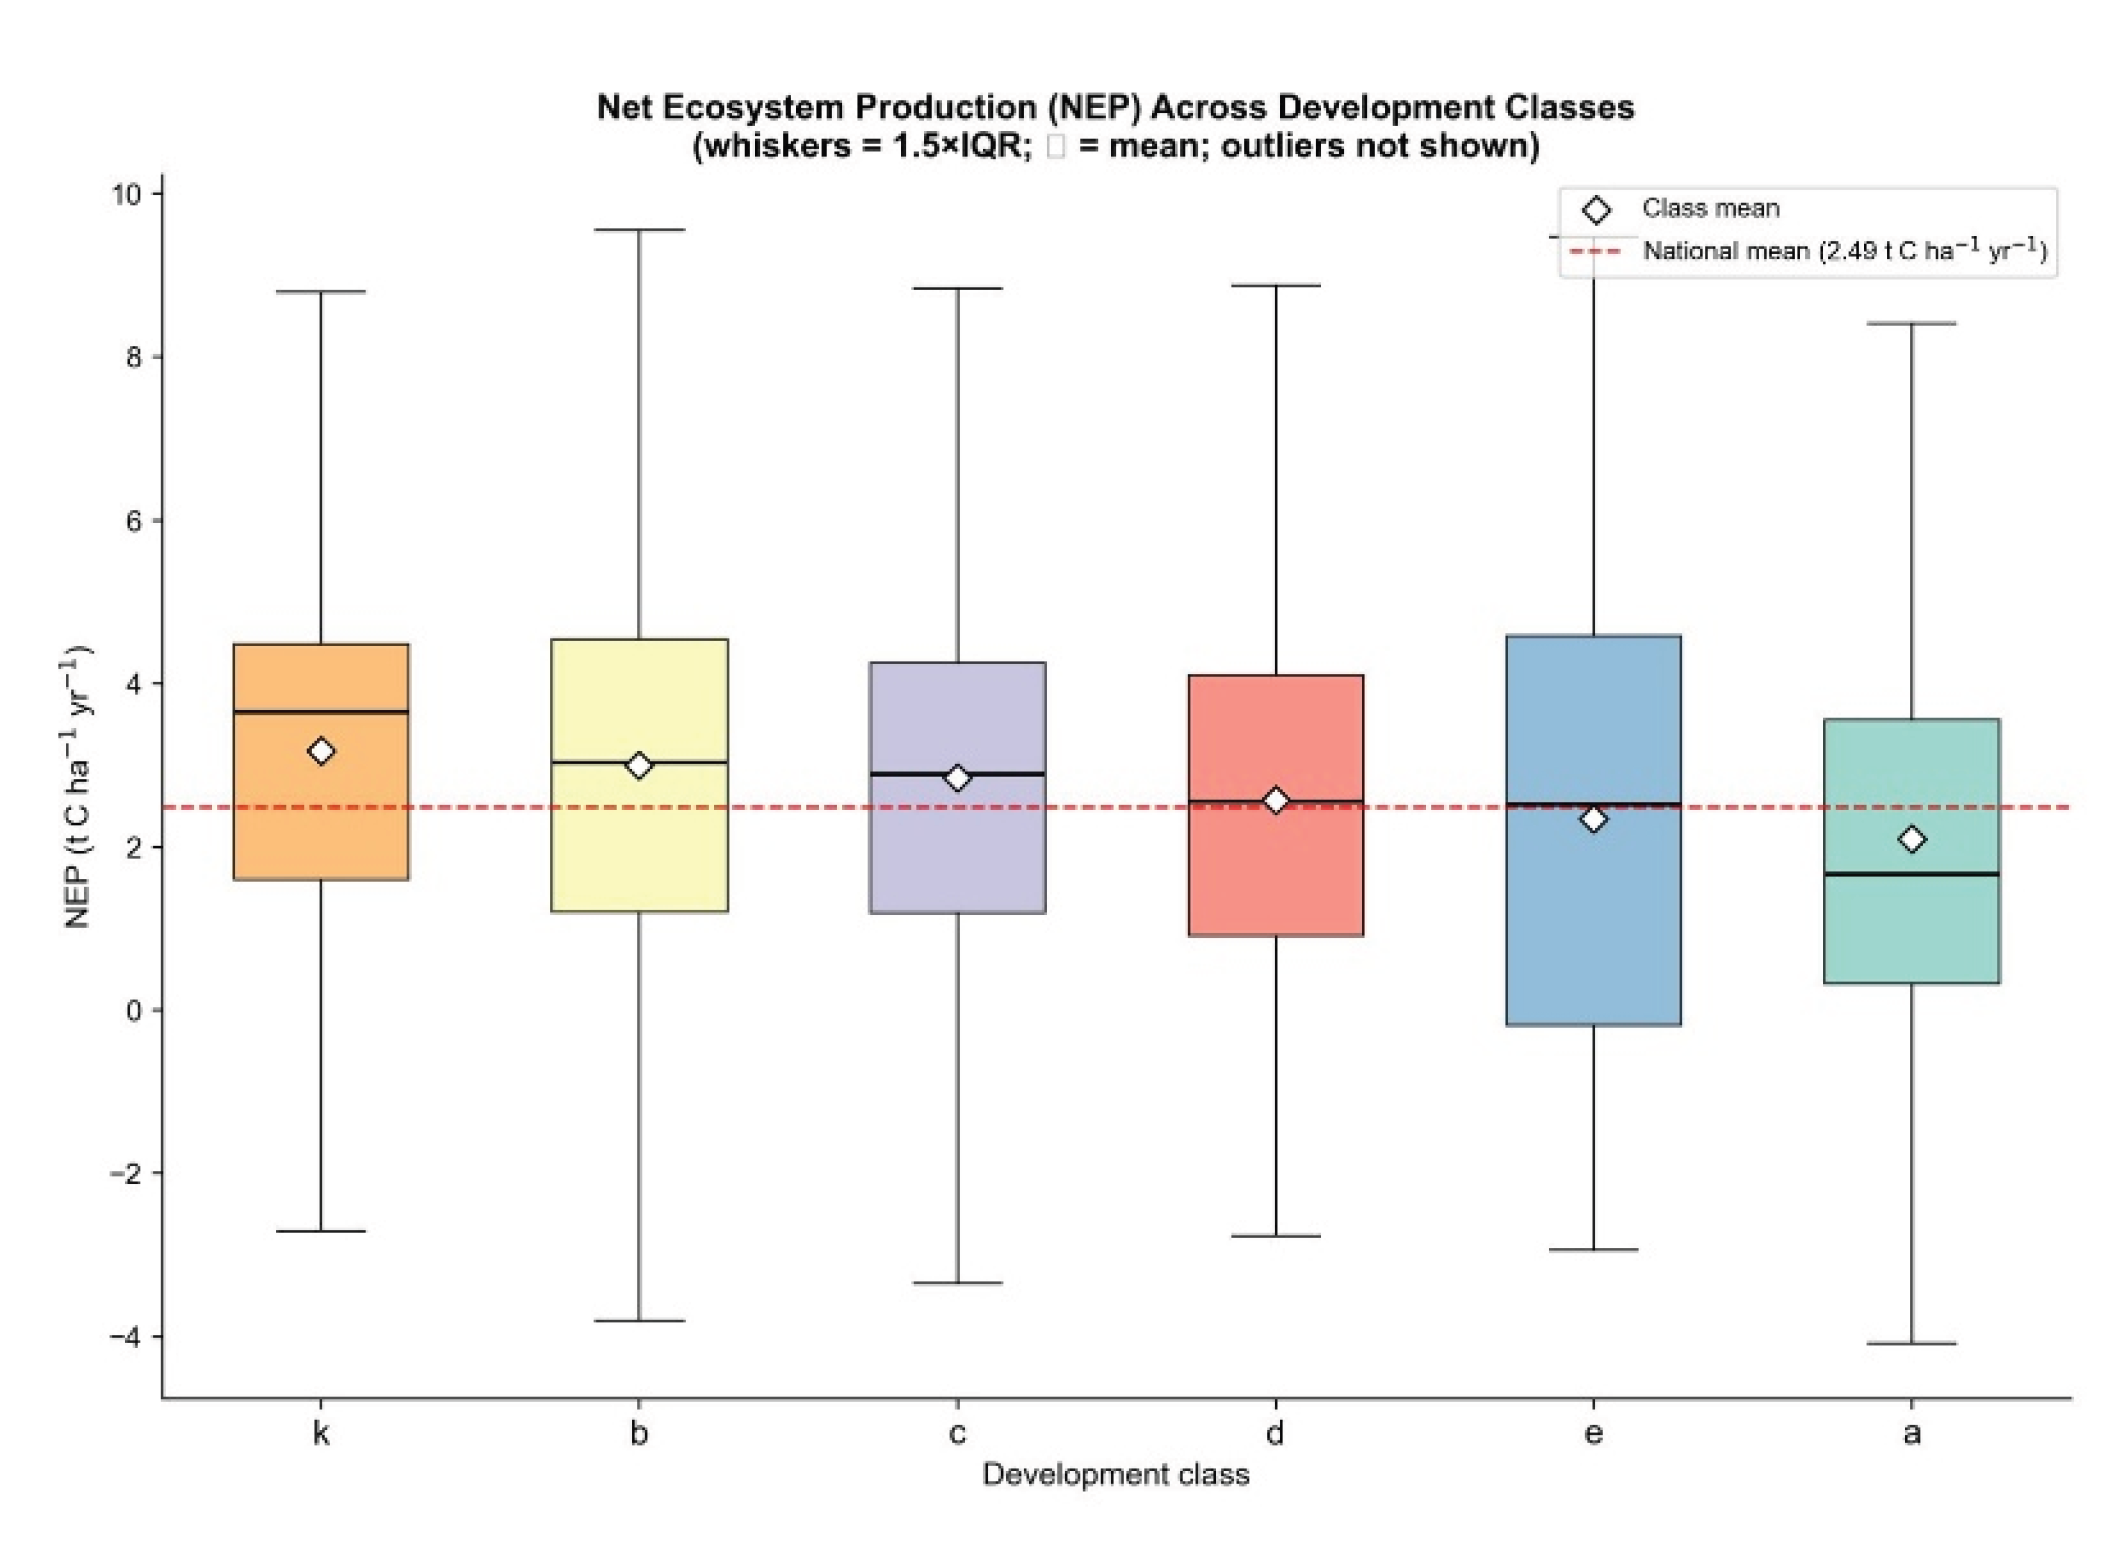

Table 1.
Representative annual heterotrophic respiration (Rₕ) values assigned to each ecological zone based on an ecological matching approach synthesis of the literature.
Table 1.
Representative annual heterotrophic respiration (Rₕ) values assigned to each ecological zone based on an ecological matching approach synthesis of the literature.
| Ecological zone | Target biome / analogous ecosystem | Rₕ (t C ha⁻¹ yr⁻¹) | Confidence | Literature basis |
|---|---|---|---|---|
| Euxine-Colchic Broadleaf Forest | Humid temperate broadleaf / mixed forest | 4.2 | High | [1,3,13] |
| North Anatolian Mixed Forest | Temperate mixed / coniferous forest | 4.0 | Moderate–high | [3,14] |
| East Anatolian Broadleaf Forest | Cool–temperate montane mixed forest | 3.6 | Moderate | [3,15] |
| Mediterranean Coastal Forest | Mediterranean conifer / sclerophyllous forest | 5.0 | High | [1,16] |
| Mediterranean Mountain Zone | High-elevation Mediterranean transitional forest | 4.2 | Moderate | [3,16] |
| Inner Aegean Mixed Forest | Semi-humid transitional forest | 3.8 | Moderate–low | [3,13,14] |
| Inner Anatolian Steppe | Semi-arid steppe–forest transition | 1.8 | Moderate–low | [17] |
| East Anatolian Steppe | Cold semi-arid steppe ecosystem | 1.4 | Low–moderate | [17] |
Table 2.
Descriptive statistics for CSC, NEP, and continuous environmental covariates.
| Variable | Mean | Standard deviation (SD) | Min | Median | Max | Skewness |
|---|---|---|---|---|---|---|
| CSC (t C ha⁻¹ yr⁻¹) | 6.463 | 2.639 | 0.673 | 6.285 | 32.766 | 2.023 |
| NEP (t C ha⁻¹ yr⁻¹) | 2.445 | 2.538 | −4.283 | 2.290 | 30.966 | 2.236 |
| Relative humidity (%) | 65.943 | 6.430 | 42.741 | 65.792 | 83.045 | −0.145 |
| Precipitation (mm yr⁻¹) | 648.758 | 206.175 | 264.138 | 574.004 | 1996.009 | 1.644 |
| Mean temperature (°C) | 14.619 | 1.889 | 8.701 | 14.328 | 20.215 | 0.420 |
| Elevation (m a.s.l.) | 1015.742 | 513.790 | −2.000 | 1039.000 | 3037.000 | 0.062 |
| Slope (°) | 13.965 | 6.785 | 0.000 | 13.112 | 58.271 | 0.652 |
| Aspect (°) | 180.120 | 104.220 | −1.000 | 179.370 | 359.715 | −0.006 |
Table 3.
Distribution of stand polygons among categorical drivers in the national forest inventory dataset.
Table 3.
Distribution of stand polygons among categorical drivers in the national forest inventory dataset.
| Categorical driver | Class | N | % |
|---|---|---|---|
| Ecological zone | North Anatolian Mixed Forest | 606,827 | 24.80 |
| Euxine-Colchic Broadleaf Forest | 440,731 | 18.01 | |
| Inner Aegean Mixed Forest | 418,771 | 17.11 | |
| Mediterranean Mountain Zone | 413,681 | 16.91 | |
| Mediterranean Coastal Forest | 316,351 | 12.93 | |
| East Anatolian Broadleaf Forest | 119,892 | 4.90 | |
| Inner Anatolian Steppe | 69,315 | 2.83 | |
| East Anatolian Steppe | 61,321 | 2.51 | |
| Canopy closure | 0 | 811,416 | 33.16 |
| 1 | 412,739 | 16.87 | |
| 2 | 508,881 | 20.80 | |
| 3 | 689,390 | 28.17 | |
| Missing | 24,463 | 1.00 | |
| Site index | I | 59,386 | 2.43 |
| II | 335,815 | 13.72 | |
| III | 673,329 | 27.52 | |
| IV | 272,996 | 11.16 | |
| V | 212,003 | 8.66 | |
| Undefined | 29,976 | 1.23 | |
| Missing* | 863,384 | 35.28 | |
| Stand development class | a | 191,121 | 7.81 |
| b | 634,912 | 25.95 | |
| c | 581,380 | 23.76 | |
| d | 121,270 | 4.96 | |
| e | 2,272 | 0.09 | |
| k | 41,708 | 1.70 | |
| Missing* | 874,226 | 35.73 |
* Missing values for site index and stand development class primarily reflect incomplete attribute recording in the OGM national forest inventory database; however, their potential nonrandom distribution should be considered when interpreting analyses based on these variables.
Table 4.
Spearman rank correlations (ρ) of CSC and NEP with continuous environmental predictors (all p < 0.001).
Table 4.
Spearman rank correlations (ρ) of CSC and NEP with continuous environmental predictors (all p < 0.001).
| Predictor | ρ with CSC | ρ with NEP |
|---|---|---|
| Climatic | ||
| Relative humidity (%) | 0.732 | 0.695 |
| Precipitation (mm yr⁻¹) | 0.581 | 0.507 |
| Mean temperature (°C) | −0.226 | −0.283 |
| Topographic | ||
| Elevation (m a.s.l.) | −0.428 | −0.331 |
| Slope (°) | 0.069 | 0.078 |
| Aspect (°) | 0.001 | −0.002 |
Table 5.
Standardised path coefficients (direct, indirect, total) for climatic predictors in CSC and NEP, with bootstrap 95% CIs for indirect effects.
Table 5.
Standardised path coefficients (direct, indirect, total) for climatic predictors in CSC and NEP, with bootstrap 95% CIs for indirect effects.
| CSC | NEP | ||||
|---|---|---|---|---|---|
| Predictor | Effect type | β | 95% CI | β | 95% CI |
| Relative humidity | Direct | +0.684 | — | +0.564 | — |
| Total | +0.684 | — | +0.564 | — | |
| Temperature | Direct | +0.200 | — | +0.075 | — |
| Indirect (→ humidity) | −0.391 | [−0.397, −0.385] | −0.322 | [−0.328, −0.316] | |
| Total | −0.191 | — | −0.247 | — | |
| Precipitation | Direct | +0.197 | — | +0.201 | — |
| Indirect (→ humidity) | +0.309 | [+0.302, +0.315] | +0.254 | [+0.249, +0.260] | |
| Total | +0.506 | — | +0.455 | — | |
| Temperature → Humidity | Direct | −0.571 | — | −0.571 | — |
| Precipitation → Humidity | Direct | +0.451 | — | +0.451 | — |
Table 6.
Moran’s I statistics for CSC and NEP within ecological zones.
| Ecological zone | Moran’s I (CSC) | p-value | Moran’s I (NEP) | p-value |
|---|---|---|---|---|
| Inner Aegean Mixed Forest | 0.289 | 0.002 | 0.289 | 0.002 |
| East Anatolian Steppe | 0.251 | 0.002 | 0.251 | 0.002 |
| Mediterranean Coastal Forest | 0.206 | 0.002 | 0.206 | 0.002 |
| East Anatolian Broadleaf Forest | 0.200 | 0.002 | 0.200 | 0.002 |
| Mediterranean Mountain Zone | 0.168 | 0.002 | 0.168 | 0.002 |
| North Anatolian Mixed Forest | 0.146 | 0.002 | 0.146 | 0.002 |
| Euxine-Colchic Broadleaf Forest | 0.107 | 0.002 | 0.107 | 0.002 |
| Inner Anatolian Steppe | 0.048 | 0.002 | 0.048 | 0.002 |
| Cross-ecozone mean | 0.177 | — | 0.177 | — |
Table 7.
Effect size hierarchy of ecological and stand structural drivers of CSC and NEP based on partial eta-squared (η²ₚ).
Table 7.
Effect size hierarchy of ecological and stand structural drivers of CSC and NEP based on partial eta-squared (η²ₚ).
| Driver | CSC η²ₚ | CSC rank | NEP η²ₚ | NEP rank |
|---|---|---|---|---|
| Ecological zone | 0.3154 | 1 | 0.2724 | 1 |
| Tree species | 0.2106 | 2 | 0.1930 | 2 |
| Canopy closure | 0.0884 | 3 | 0.0826 | 3 |
| Site index | 0.0640 | 4 | 0.0547 | 4 |
| Stand development class | 0.0153 | 5 | 0.0136 | 5 |
Disclaimer/Publisher’s Note: The statements, opinions and data contained in all publications are solely those of the individual author(s) and contributor(s) and not of MDPI and/or the editor(s). MDPI and/or the editor(s) disclaim responsibility for any injury to people or property resulting from any ideas, methods, instructions or products referred to in the content. |
© 2026 by the authors. Licensee MDPI, Basel, Switzerland. This article is an open access article distributed under the terms and conditions of the Creative Commons Attribution (CC BY) license (http://creativecommons.org/licenses/by/4.0/).
Copyright: This open access article is published under a Creative Commons CC BY 4.0 license, which permit the free download, distribution, and reuse, provided that the author and preprint are cited in any reuse.