

Submitted:
18 August 2026
Posted:
19 August 2026
You are already at the latest version
Abstract
Environmental, climatic, and socio-economic conditions coexist in La Guajira, in north-western Colombia, that favour the transmission of dengue. However, gaps in knowledge remain regarding the distribution and temporal dynamics of its main vector, Aedes aegypti. This study assessed the potential distribution and temporal dynamics of Ae. aegypti in the municipality of Manaure, incorporating climatic variables using maximum entropy (MaxEnt) and autoregressive integrated moving average (ARIMA) models, to identify entomological risk areas and support vector surveillance. First, for environmental suitability, occurrence records were obtained from published literature, the National Institute of Health’s collection of medically important insects, the Global Biodiversity Information Facility, and field surveys. Nineteen WorldClim v2.1 bioclimatic variables were used to model the potential distribution using MaxEnt, with model performance evaluated using the area under the curve (AUC). Second, temporal dynamics of Ae. aegypti, were carried out over the course of a year in two neighbourhoods with high and low dengue incidence, using Prokopack aspirators for indoor sampling. MaxEnt models showed good predictive performance (AUC >0.8), with temperature annual range (BIO7) as the most influential predictor. In the study of temporal dynamics, a total of 2,313 mosquitoes (53% females) were collected. La Cruzada neighbourhood showed greater temporal dependence (φ1 = 0.679; p < 0.001) compared with Altos de Salinas (φ1 = 0.309; p = 0.02), while rainfall one to two weeks earlier was positively associated with an increase in female abundance in both neighbourhoods. The integration of spatial and temporal models enabled the prioritization of risk areas. At the spatial level, MaxEnt estimated patterns consistent with the ecology of the vectors at state level; in those municipalities where entomological risk is highest, it is recommended that time series analyses be carried out to improve forecasts and planning for the integrated management of arboviruses transmitted by the Ae. aegypti mosquito.
Keywords:
Aedes aegypti
; dengue
; arbovirus
; ecological niche
; MaxEnt
; ARIMA
; time series
; La Guajira
1. Introduction
In the Region of the Americas, dengue is the most impactful arbovirus disease, with epidemics occurring cyclically every three to five years [1] . The transmission of arbovirus diseases has become a major public health problem over the last four decades. It is estimated that nearly half of the world population is at risk of infection, with approximately 390 million cases of dengue (DENV) reported annually, and 3.9 billion people exposed and at risk of infection [2,3]. The scale of this problem is exacerbated by the limited and costly treatment options available, as well as the wide range of clinical manifestations, which range from mild viral symptoms to severe and potentially fatal forms [3,4] .
Furthermore, other emerging viruses are circulating in the region simultaneously, such as Chikungunya (CHIKV) and Zika (ZIKV). Both are transmitted by the same vector, the Aedes aegypti mosquito (Linnaeus, 1762). Since 2020, the circulation of these arboviral diseases has coincided with the active transmission of the SARS-CoV-2 virus, which has posed additional challenges for surveillance and vector control programmes [5,6].
In Colombia, dengue remains the vector-borne disease with the greatest impact in terms of incidence and burden on health services, particularly in urban and peri-urban areas. According to the Colombian National Institute of Health, the total number of clinically confirmed cases of this infection in 2024 was 231,392; of which 1,528 were laboratory-confirmed. There were also 3,848 suspected cases, bringing the overall total to 236,768. In the La Guajira department, 5,587 cases were reported between 2019 and 2023, with rates ranging from 107 to 408 per 100,000 inhabitants, indicating ongoing transmission of the virus.
The department of La Guajira has heterogeneous environmental conditions, characterised by gradients in temperature, rainfall, and altitude, as well as marked social inequalities and limited access to basic services. These conditions may favour the persistence and spread of vectors of public health importance, such as Aedes aegypti, the primary vector for dengue. Despite the epidemiological importance of these diseases in the department, detailed spatial information on the distribution of this vector is limited [7] .
Understanding the current and potential distribution of these vectors is essential for identifying areas of risk, guiding entomological surveillance, prioritising interventions and strengthening the response capacity of the local health system (8). In this context, ecological niche models integrate biological and environmental data to estimate the area potentially suitable for the presence of a species, representing its realised niche [8] , which refers to the environmental space where the species is actually found. However, factors such as competition, predation, geographical barriers and human activity may limit the distribution of the fundamental niche [9]. Similarly, these models have established themselves as useful tools for estimating the potential distribution of species based on the presence data and environmental variables. Among these models, the maximum entropy algorithm (MaxEnt) has been widely used due to its good performance with small sample sizes and its ability to identify the environmental variables most influential on species distribution. It is designed to model distributions based on presence data for the species under study [8,10,11,12,13] .
Similarly, analysing the temporal dependence of this vector enables the identification of distribution patterns, seasonal variations, and cyclical fluctuations providing valuable information for entomological surveillance. In this regard, time series have become a fundamental statistical tool for studying time-dependent phenomena and are widely used in meteorology, economics, and the health sciences (15). In the field of vector-borne diseases, their application has gained importance in recent years, as they enable the modelling of incidence, the making of future projections and the exploration of relationships with climatic and environmental variables [14,15,16]. However, their use for modelling time-series of arthropods vectors of public health importance remains limited globally [17,18]. Previous studies have been carried out in Brazil, where analysis using ARIMA models revealed seasonal patterns in the Mansonia genus [19] . Vector population modelling has been studied using different approaches in other regions of the Americas. For example, dynamic models influenced by meteorological conditions have been employed in Brazil [20], and time-series clustering algorithms have been used in Argentina [21]. Nevertheless, a study incorporating the temporal dependence of entomological time series has yet to be conducted in Colombia.
In public health, these models facilitate the generation of relevant entomological surveillance inputs, the identification of risk areas, and the prioritisation of interventions. In areas permanently colonised by a mosquito species, control interventions require the prior identification of critical spatial and temporal hotspots of mosquito abundance. Therefore, it is essential to understand the dynamics of vector populations in relation to ecological factors in order to evaluate the implementation of timely and targeted control strategies.
As the transmission of arboviral diseases is closely linked to vector abundance [17], mosquito population dynamics determine pathogen transmission dynamics. For a health system with limited resources, being able to predict vector abundance patterns in advance can lead to more accurate forecasting of the likelihood of pathogen transmission. This enables effective vector control and the prevention of health risks [22] . However, developing predictive models with robust predictive capacity requires accurate information on vector dynamics, obtained from time-series using a reliable methodology that can accurately capture important aspects such as seasonality, population trends or the stochastic occurrence of abundance peaks [23,24] .
Given the burden of arboviral diseases in La Guajira [7,25] and the need to enhance surveillance and vector control strategies, this study aimed to assess the potential distribution and temporal dynamics of Ae. aegypti in the municipality of Manaure. This was achieved by integrating climatic variables using MaxEnt and ARIMA models, in order to identify areas of entomological risk and make predictions to support surveillance systems.
2. Materials and Methods
The Materials and Methods should be described with sufficient detail to allow others to replicate and build on the published results. Please note that the publication of your manuscript implies that you must make all materials, data, computer code, and protocols associated with the publication available to readers. Please disclose at the submission stage any restrictions on the availability of materials or information. New methods and protocols should be described in detail while well-established methods can be briefly described and appropriately cited.
Research manuscripts reporting large datasets that are deposited in a publicly available database should specify where the data have been deposited and provide the relevant accession numbers. If the accession numbers have not yet been obtained at the time of submission, please state that they will be provided during review. They must be provided prior to publication.
In this section, where applicable, authors are required to disclose details of how generative artificial intelligence (GenAI) has been used in this paper (e.g., to generate text, data, or graphics, or to assist in study design, data collection, analysis, or interpretation). The use of GenAI for superficial text editing (e.g., grammar, spelling, punctuation, and formatting) does not need to be declared.
Study area
The study was conducted in the department of La Guajira (11°46′30″N 72°26′40″W), located in the far north of Colombia (Figure 1). This region is characterised by semi-arid climatic conditions, coastal areas, as well as high variability in rainfall within a bimodal regime and altitudinal gradients ranging from 0 to 1,000 metres above sea level, resulting in marked climatic and ecological heterogeneity across the territory [26] . The area receives approximately 459–533 mm of rainfall per year, with the heaviest rainfall occurring between September and November, lighter rainfall between April and May, and a dry season between January and March [26,27,28] .
With regard to temperature, it remains constant throughout the year within a range of 28 °C–39 °C [27,29,30] . The months with the lowest temperatures are January, February, March and April, with an average of 24.0 °C. The warmest months are June, July and August, with an average of 29.9 °C. September is the hottest month [26,30]. Furthermore, the municipality is part of the tropical desert biome of La Guajira and Santa Marta, as well as the dry tropical Caribbean biome. These are ecosystems that are mainly covered by scrubland and bare, degraded land [29]. It is worth highlighting the role of the winds, as they are responsible for mitigating extreme temperatures, whilst also contributing to an increase in potential evapotranspiration and hindering vegetation growth.
This context, combined with the presence of a vulnerable Wayuu population—with a multidimensional poverty index (MPI) exceeding 87 per cent [31] —linked to environmental sanitation issues that prevent adequate healthy housing conditions in urban areas, favours the persistence of vector-borne diseases and justifies the selection of the study area (La Guajira) for the spatial component of the study.
Study design
To identify the entomological risk posed by the Ae. aegypti mosquito at spatial (department) and temporal (municipality) levels, an integrated spatiotemporal approach was developed for this vector. This approach comprises two components: 1) Spatial modelling of the potential distribution of the Ae. aegypti mosquito using MaxEnt and 2) Temporal modelling analysis using the time-series approach (ARIMA). The detailed methodology for each of the components is set out below:
1. Spatial modelling: potential distribution of the Ae. aegypti mosquito using MaxEnt
The potential distribution of Ae. aegypti specimens in La Guajira department, was estimated using occurrence data for the species, via the maximum entropy algorithm [9,32], which utilises the Java-based, machine learning modelling software MaxEnt, version 3.4.4, and its ArcGIS Pro® plugin.
Occurrence data for the species Ae. aegypti:
A total of 76 records of adult Ae. aegypti mosquitoes were compiled for the department from three main sources: (i) historical records published between 1984 and 2017 (n=6) [7,25] , (ii) data from collections of immature mosquitoes previously reported in the department as part of a study on the spatial distribution of pyrethroid resistance (n=15) [33] , and (iii) taxonomically validated occurrence records (n=8) available on the Global Biodiversity Information Facility (GBIF) [34] . In addition, 47 primary data points were included, obtained through entomological sampling carried out between August and October 2024 indoors in the neighbourhoods of Altos de Salinas (AS) and La Cruzada (LC), using a Prokopack mosquito aspirator. Bear in mind that MaxEnt operates using a presence algorithm that utilises simulated absence data when original absence data are limited [9] . All presence records were cleaned by removing duplicates and records without coordinates, as well as points with geographical errors.
Environmental variables at departmental level:
Bioclimatic variables from the WorldClim version 2.1 dataset [35] , covering the period 1970–2000 with a spatial resolution of 1 km ( 30’’), were used for modelling. Initially, 19 bioclimatic variables related to temperature and precipitation were considered. These variables were evaluated to reduce collinearity, selecting those with the greatest ecological relevance and the lowest correlation with one another (r ≤ 0.8), in accordance with criteria established in previous ecological niche modelling studies [8,13,36]. Distribution models for these specimens were generated using MaxEnt with presence data [9,37]. The bioclimatic variables that best fit the data were selected as predictors, taking into account the significance of the coefficients. Model performance was assessed using the area under the ROC curve (AUC) and omission rates.
Model performance evaluation:
The potential distribution of Ae. aegypti was estimated using the maximum entropy (MaxEnt) algorithm, implemented in MaxEnt software version 3.4 and ArcGIS Pro®. The cloglog (complementary log-log) output was used, with a random split of the data. Model training involved the use of 25,970 randomly generated background points and 75% of the occurrence records allocated to this stage. The remaining 25% of the Aedes aegypti presence data was used exclusively for model validation.
Five replicates were run, using random seeds, to assess the stability of the predictions. The final model was selected based on its predictive performance and spatial consistency. AUC values above 0.7 were considered indicative of acceptable performance. Additionally, the response curves of the environmental variables were analysed to interpret their influence on the potential distribution of the species (Figure S1).
2. Temporal modelling: analysis using the time series approach (ARIMA)
This pilot study for temporal modelling was carried out in the municipality of Manaure, given that, following the MaxEnt analysis, the area was classified as having environmental conditions favourable to the presence of the species under study. Furthermore, Manaure is one of the municipalities in the department that accounted for 70 per cent of the cumulative DENV cases during the period 1999–2010 [38]. In recent years, between 2021 and 2025, 357 out of a total of 455 cases were hospitalised, showing that the annual distribution of dengue cases in the municipality is characterised by marked variability in the incidence rate, with persistence in the time series.
Data on the occurrence of Aedes aegypti:
Weekly time series on the abundance of Aedes aegypti mosquitoes were obtained from sentinel households in two neighbourhoods of the municipality of Manaure (La Guajira): Altos de Salinas (AS) and La Cruzada (LC). These data were collected from October 2024 to October 2025. The response variable was the number of adults captured per epidemiological week, distinguishing between females and males.
Data on the abundance of adult Ae. aegypti mosquitoes were obtained through weekly entomological surveillance (Figure 2). The weekly counts of adult mosquitoes captured constituted the dependent variable in the time-series models. A Prokopack mosquito aspirator [39] was used to capture adult mosquitoes; this was operated indoors for a variable duration of between 10 and 15 minutes. Sampling was carried out in two neighbourhoods in the municipality of Manaure during the period from October 2024 to October 2025. The criteria used to establish sampling sites were ecological, climatic and sociodemographic conditions with a high probability of mosquito development; furthermore, priority was given to neighbourhoods that form part of routine entomological surveillance activities.
In each locality, around 20 households were selected at random each week; in addition, larval and pupal stages were collected manually from water reservoirs and subsequently processed to determine their infection status (unpublished data). Morphological identification of individuals was carried out using dichotomous keys for mosquitoes (Diptera: Culicidae) associated with the transmission of the dengue virus [40,41] .
Exploratory analysis and assessment of stationarity:
Weekly counts of adult Ae. aegypti were calculated as the sum of captures recorded in the KoboToolBox application (https://www.kobotoolbox.org/), from Monday evening to Sunday evening of each capture week during the study period, and were used for modelling. Initially, an exploratory analysis of the time series was carried out to assess trends, seasonality, the presence of outliers and differences between neighbourhoods. Due to the non-normal distribution of the data, the non-parametric Mann-Whitney test was applied to compare abundance between neighbourhoods. The stationarity of the time series was assessed using the augmented Dickey–Fuller (ADF) test [42,43] . This test tests the null hypothesis of the presence of a unit root (non-stationarity) against the alternative hypothesis of stationarity [44,45] . Where non-stationarity was detected, appropriate transformations, typically differentiation of order d, were applied to stabilise the mean of the time series [46] .
Autoregressive integrated moving average (ARIMA(p,d,q)) models were fitted for each time series, using the overall model fit, the significance of the parameters and the residual analysis as selection criteria. The identification of the autoregressive (p), integration (d) and moving average (q) orders of the ARIMA(p,d,q) model was carried out by analysing the autocorrelation function (ACF) and partial autocorrelation function (PACF). The ACF allows the order of the moving average component (q) to be identified, whilst the PACF facilitates the determination of the autoregressive order (p) [20] . This methodological approach has been extensively validated in time-series modelling studies of vector mosquito populations [21,47,48].
Environmental variables:
The exogenous climatic variables included minimum temperature (°C), mean temperature (°C), relative humidity (%) and weekly cumulative rainfall (mm), obtained from a local weather station situated in situ. The selection of these variables was based on scientific evidence documenting their influence on the life cycle of Ae. aegypti [49,50,51] . The municipality has recorded a temperature range of between 28 and 33 °C and variable rainfall data, with values ranging from 0 to 61.4 mm, suitable for the survival of the Ae. aegypti vector.
Considering the extreme climatic conditions in the municipality, climatic variables were incorporated as exogenous regressors in an ARIMAX model, including minimum temperature, mean temperature, relative humidity and weekly cumulative precipitation. Including climatic covariates in ARIMAX models has been shown to significantly improve predictive capacity in studies of disease vectors [43,52,53]. A comparative analysis of the ARIMAX models fitted for both localities (AS and LC) was carried out to identify differential patterns in the response of Ae. aegypti populations to climatic variables. This approach allows the evaluation of spatial heterogeneity in the temporal dynamic of the vector, a relevant aspect for the development of control strategies adapted to the local context [21,54] .
Based on the cross-correlation analysis, time lags of between one and two weeks were evaluated for the climatic variables, taking into account the biological plausibility associated with the vector’s life cycle (23, 24). In the present study, lags of 1 and 2 weeks were evaluated for each climatic variable, bearing in mind that the complete life cycle of Ae. aegypti from egg to adult can be completed in 7–14 days under optimal conditions [54,55] . This approach is consistent with previous studies that have documented delayed effects of precipitation (1–4 weeks) and temperature (1–3 weeks) on adult mosquito abundance [49,56,57] . The following exogenous variables were evaluated, along with their respective lags: (i) weekly cumulative rainfall with lags of 1 and 2 weeks (lag-1 and lag-2); (ii) minimum temperature with lags of 1 and 2 weeks; and (iii) mean temperature with lags of 1 and 2 weeks – relative humidity with lags of 1 and 2 weeks.
Model performance evaluation:
The final selection of models was based on the Akaike Information Criterion (AIC), which balances model fit with complexity by penalising the number of parameters [42,46] . The model with the lowest AIC value was selected as the most parsimonious [45] .
The selected models were validated through residual analysis. The Portmanteau (Ljung-Box) test was applied to assess the independence of the residuals, testing the null hypothesis that the residuals constitute a white noise process [18,58] . Additionally, the normality of the residuals was verified through visual inspection of Q-Q plots and formal tests of normality [20] . The absence of significant autocorrelation in the residuals and their approximately normal distribution are indicators of an appropriately specified model [52,53] .
The results of the potential distribution (MaxEnt) and time series (ARIMAX) models were integrated using a comparative approach, assessing the consistency between the environmental variables that explain spatial suitability—that is, the structure of the species’ potential niche—and those that regulate the temporal dynamics of the vector within this niche. Overlaps in the main climatic predictors were analysed, as well as differential patterns between spatial units, in order to interpret entomological risk from a spatio-temporal perspective.
3. Results
3.1. Spatial Modelling: Potential Distribution of the Ae. Aegypti Mosquito Using MaxEnt
To reduce multicollinearity and improve the interpretability of the model, a subset of bioclimatic variables was selected from the complete set of 19 WorldClim predictors. Variable selection was based on ecological relevance to the distribution of Ae. aegypti [8,10,13] , and on pairwise correlation analysis, retaining variables representing key climatic dimensions—such as temperature, precipitation and seasonality—whilst minimising redundancy. The final set included six variables: BIO4 (seasonality of temperature), BIO7 (annual temperature range), BIO12 (annual precipitation), BIO14 (precipitation in the driest month) and BIO18 (precipitation in the warmest quarter), BIO19 (precipitation in the coldest quarter). These variables capture the main environmental gradients known to limit the distribution of mosquitoes [11] (Figure S1).
The results reflect patterns consistent with the ecology of the Ae. aegypti mosquito, which showed a strong association with urban areas and the temperature and precipitation variables, consistent with its preference for microhabitats with artificial breeding sites and intermittent water availability.
The MaxEnt models demonstrated high predictive performance (AUC = 0.81; omission rate = 0.17), suggesting that approximately 17% of presence records were not correctly classified by the model using a cut-off threshold of 0.5. This indicates good discrimination between suitable and unsuitable environmental conditions. When considering a set comprising the six climatic variables mentioned above, the most influential variables were the annual temperature range (BIO7), which showed a positive association with the probability of presence, whilst temperature seasonality (BIO4) and precipitation-related variables showed negative associations within the model, indicating that the probability of presence decreases as thermal seasonality or annual precipitation increases (Table 1). This suggests that thermal limits and climatic variability are key determinants of the distribution of Ae. aegypti mosquitoes in the department of La Guajira.
| Variable | Coefficient |
Minimum Environmental value |
Maximum Environmental value |
Minimum probability |
Maximum probability |
Probability range |
| BIO 4 | -0.1056 | 38.728 | 127.346 | 0.005 | 1.000 | 0.995 |
| BIO7 | 0.7847 | 9.583 | 13.747 | 0.136 | 0.978 | 0.843 |
| BIO12 | -0.0016 | 107.790 | 2309.962 | 0.104 | 0.982 | 0.878 |
| BIO14 | -0.0582 | -3.477 | 38.246 | 0.167 | 0.873 | 0.707 |
| BIO18 | -0.0075 | -52.096 | 975.250 | 0.004 | 1.000 | 0.996 |
| BIO19 | -0.0010 | -22.259 | 454.150 | 0.551 | 0.717 | 0.166 |
Suitability Species Map
The environmental suitability map generated by MaxEnt was processed and visualised using geographic information systems with ArcGIS Pro software (Figure 3). The continuous probability-of-presence values were categorised to facilitate the spatial interpretation of the areas with the highest environmental suitability, which were considered priority areas for entomological surveillance.
Figure 3 shows a heterogeneous distribution of the vector; the highest probabilities of occurrence (orange to red) are concentrated in the south of the department, the central strip near Maicao and Manaure, and some probabilities in scattered coastal areas. In contrast, the lowest probabilities of occurrence were found in the Alta Guajira region, particularly in the municipality of Uribia and the north-eastern tip of the department. The occurrence records used for modelling were predominantly located within areas classified as having medium and high suitability.
The ROC (Receiver Operating Characteristic) curve demonstrated the MaxEnt model’s good predictive ability to distinguish between areas suitable and unsuitable for the presence of Ae. aegypti in the department of La Guajira (Figure 4). The curve consistently lay above the random classification line, showing a progressive increase in sensitivity as the false positive rate increased. This behaviour indicates that the environmental variables included in the model enabled the species’ presence records to be adequately identified and allowed favourable conditions to be distinguished from unfavourable ones within the study area.
Six models were run, all of which yielded AUC values ranging from 0.8237 to 0.8823 (M1: AUC = 0.8819; M2: AUC = 0.8823; M3: AUC = 0.8725; M4: AUC = 0.8423; M5: AUC = 0.8237, and M6: AUC = 0.8078). The potential distribution models yielded AUC values above 0.8, indicating adequate predictive performance. The final model yielded an AUC of 0.8078, indicating good discriminatory power for predicting the potential distribution of the Ae. aegypti mosquito in La Guajira. The model showed a positive association with annual temperature range (BIO7; β = 0.7847), whereas temperature seasonality (BIO4; β = −0.1056), annual precipitation (BIO12; β = −0.0016), precipitation of the driest month (BIO14; β = −0.0582), precipitation of the warmest quarter (BIO18; β = −0.0075), and precipitation of the coldest quarter (BIO19; β = −0.0010) showed negative associations with the modelled probability of occurrence.
The evaluation of the MaxEnt model’s binary classification (threshold = 0.5) showed that 83.3% of presence records were correctly identified as being within environmentally suitable areas, whilst the remaining 16.7% were classified as falling below the suitability threshold. Meanwhile, 71.6% of the background points were classified below the threshold and 28.4% as potential presenc’. This pattern suggests that the final model was able to discriminate between environmental conditions associated with observed occurrences and background locations, supporting the use of the selected environmental variables to characterize the potential environmental suitability of Ae. aegypti in La Guajira.
3.2. Temporal Modelling: Analysis Using the Time Series Approach (ARIMA)
Surveillance carried out in 1,962 dwellings confirmed the presence of the vector mosquito Ae. aegypti, with a total of 2,313 individuals collected, of which 53% were females (n=1,223) and 47% were males (n=1,090). Descriptive analysis of the abundance of Ae. aegypti revealed high temporal variability in both neighbourhoods, with positively skewed distributions and the presence of extreme values (Figure 5). In Altos de Salinas (AS), the average abundance was 12.42 adults per week (SD = 12.03), with a maximum of 74 individuals per day, whilst in La Cruzada (LC) the mean was 11.44 (SD = 10.12) and a maximum of 57 individuals (Figure 5). In both cases, the median was lower than the mean (Me = 9 (AS) and 8 (LC)); although the general pattern of infestation was comparable between the two neighbourhoods, AS tends to experience larger increases in vector density, indicating a strong influence of isolated high-infestation events and greater variability in the AS neighbourhood.
No statistically significant differences in abundance were found between neighbourhoods (Mann-Whitney U = 5,018.5; p = 0.421), suggesting comparable infestation patterns during the study period (Figure 6). The time series showed a pattern characterised by initial peaks in abundance during the final epidemiological weeks of 2024, followed by a decline in December and January, and a subsequent gradual recovery. This behaviour suggests the presence of a seasonal component, possibly associated with climatic conditions favourable to the vector’s development.
The relationship between meteorological variables recorded in situ with a time lag and the weekly dynamics of Ae. aegypti using cross-correlation matrices, a useful method for visualising and modelling associations between the response variable and the lags of the exogenous variables [17,23] and for visualising the effects of lagged meteorological conditions on mosquito abundance (Figure 7). In both neighbourhoods, the abundances of females, males and total individuals were strongly correlated with one another (r > 0.82). The mean, minimum and maximum temperature variables showed high positive correlations with one another (r = 0.76–0.92), whilst relative humidity was negatively associated with temperature and positively associated with precipitation. The abundance of female Ae. aegypti was positively correlated with cumulative rainfall and its lags (lag-1 and lag-2), particularly in the LC neighbourhood, where the correlations were strongest. In contrast, minimum temperature (lag-1) showed weak or negative associations in both neighbourhoods, although of low to moderate magnitude.
3.2.1. Modelling of Time Series in the La Cruzada and Altos de Salinas Neighbourhoods
The time series for females in the La Cruzada neighbourhood showed non-stationary behaviour in terms of trend, although the augmented Dickey–Fuller test indicated stationarity at the level (ADF = -3.028; p = 0.032), allowing for the direct fitting of an ARIMA model without the need for differentiation (d=0). Analysis of autocorrelation (ACF) and partial autocorrelation (PACF) suggested a first-order autoregressive process; therefore, an ARIMA (1,0,0) model was fitted.
The model showed a significant autoregressive coefficient (φ1 = 0.592; p < 0.001), indicating moderate temporal persistence in the time series; in other words, the abundance of mosquitoes in each week is positively correlated with the abundance in the previous week (Table 2). The inclusion of climatic variables resulted in an ARIMAX (1,0,0) model, in which precipitation with a two-week lag (lag-2) showed a significant positive association (β = 0.332; p < 0.001), whilst the minimum temperature with a one-week lag (lag-1) showed a negative association (β = -2.67; p < 0.01). These results (Figure 8) indicate that increases in precipitation are reflected in increases in vector abundance approximately two weeks later, whilst decreases in minimum temperature are associated with increases in abundance in the following week. The model showed a good fit (AIC = 328.23) and non-autocorrelated residuals (p = 0.771), confirming its suitability. The new AIC was significantly lower than that of the ARIMA model without covariates, indicating an improved balance between fit and parsimony. The Portmanteau test applied to the residuals of the ARIMAX model detected no significant autocorrelation (p > 0.05), confirming the model’s suitability.
Meanwhile, in the Altos de Salinas (AS) neighbourhood, the time series also showed high variability, with a maximum of 106 adults in one week. An ARIMAX (1,0,0) model was fitted, in which precipitation lagged by one week showed a significant positive association (β = 0.326; p < 0.05), whilst minimum temperature showed a non-significant negative association (Figure 9; Table 3). The autoregressive coefficient was lower than that for LC (φ = 0.309; p < 0.05), suggesting lower temporal persistence of abundance in this neighbourhood. The model showed an adequate fit (AIC = 372.69) and residuals consistent with white noise (p = 0.888).
A comparison of the models revealed differences in the population dynamics of the vector between neighbourhoods (Figs 6–7). In La Cruzada, the higher value of the autoregressive coefficient (φ = 0.679) indicates greater temporal inertia, that is, a greater dependence of current abundance on previous weeks. In contrast, the AS neighbourhood exhibited more variable and less persistent dynamics (Figure 9).
In both neighbourhoods, rainfall emerged as the main positive predictor of Aedes aegypti abundance, although with differences in response time (two weeks in LC and one week in AS), suggesting local variations in the vector’s ecological dynamics. Minimum temperature showed a consistent negative effect, although this was only significant in La Cruzada, indicating a possible modulatory role of thermal conditions on the vector’s activity.
Finally, regarding the autoregressive component of the time series, the AR(1) coefficient was higher in LC (φ1 = 0.592) than in AS (φ1 = 0.309), indicating greater temporal persistence in mosquito abundance in LC. This difference could reflect greater stability of breeding sites or lower environmental variability in LC. In studies carried out by the research group (unpublished data), the incidence rate was modelled using the ARIMA(p,d,q) approach for the period 2014–2023, yielding a (1,0,0) model (φ1 = 0.62, p = 0.000), where the AR(1) coefficient indicates a 62% persistence in the behaviour of dengue; that is, more than half of the current incidence is explained by data from one month ago (unpublished data).
These findings relate to the epidemiological dynamics of dengue, as a total of 113 cases were recorded in the municipality during the study period, of which 90 were hospitalised. In both neighbourhoods, it can be observed that the increase in female density and its positive association with rainfall precedes the peaks in cases (n=113); likewise, an inversely proportional association is observed between the minimum temperature and the occurrence of cases (Figure 8 and Figure 9).
3.2.2. Integration of Environmental Suitability and the Temporal Dynamics of Ae. aegypti
The integration of results derived from ecological niche modelling (MaxEnt) and time-series modelling (ARIMAX) enabled the identification of complementary patterns in the distribution and dynamics of Ae. aegypti in the study area.
The environmental suitability maps generated using MaxEnt showed that the areas with the highest probability of vector presence are concentrated in urban and peri-urban areas of the department, particularly in municipalities with favourable rainfall and temperature conditions. In these scenarios, annual rainfall (BIO12) was identified as the main determinant of the vector’s spatial distribution.
Consistently, the time-series models showed that rainfall also acts as a significant predictor of the vector’s abundance on a temporal scale, with delayed effects of between one and two weeks depending on the local context. This pattern suggests that the availability of water associated with rainfall events not only defines the vector’s environmental suitability but also regulates its short-term population dynamics.
Furthermore, minimum temperature showed a negative association with abundance in the temporal models, indicating a possible modulating effect on the vector’s activity. This finding is consistent with the physiological sensitivity of Ae. aegypti to temperature variations, particularly in environments with extreme climatic conditions such as those found in La Guajira.
A comparison between neighbourhoods revealed differences in the temporal persistence of vector abundance, with greater persistence observed in La Cruzada compared with Altos de Salinas. These differences may be associated with microenvironmental variations not fully captured by the bioclimatic variables used in the spatial model, highlighting the importance of integrating different scales of analysis.
Taken together, these results indicate that areas with high environmental suitability not only represent potential zones of vector presence, but also contexts where climatic conditions favour the persistence and fluctuation of their populations over time. This integration allows for a better understanding of entomological risk, by simultaneously considering the spatial dimension of the ecological niche and the temporal dynamics of the vector.
4. Discussion
Authors should discuss the results and how they can be interpreted from the perspective of previous studies and of the working hypotheses. The findings and their implications should be discussed in the broadest context possible. Future research directions may also be highlighted.
This study integrates two complementary methodological approaches to characterize the entomological risk associated with Ae. aegypti in La Guajira: (1) spatial distribution modelling using MaxEnt, which identifies areas of high environmental suitability for the vector, and (2) temporal dynamics modelling using ARIMA/ARIMAX, which captures temporal patterns of abundance and their relationship with climatic variables. This spatio-temporal integration provides a more holistic understanding of vector risk than either approach alone [21,53,54].
The MaxEnt models developed achieved AUC values of ≥ 0.8, indicating excellent discriminatory power for predicting the presence of Ae. aegypti based on environmental variables. These models identified areas of high environmental suitability that spatially coincide with the locations where temporal monitoring was carried out (AS and LC), thereby validating the consistency between the two methodological approaches. The convergence of spatial (MaxEnt) and temporal (ARIMAX) evidence in these locations reinforces the identification of these areas as zones of high entomological risk requiring intensified surveillance [57] .
Spatial modelling: potential distribution of the Ae. aegypti mosquito using MaxEnt
The results reflect patterns consistent with the ecology of the Aedes aegypti mosquito, which showed a close relationship with urban areas and precipitation variables; this is consistent with its preference for microhabitats with artificial breeding sites and intermittent water availability. The AUC values (>0.82) confirm the MaxEnt ability to model the realised niche in species even with heterogeneous data. The integrated use of historical and institutional records alongside recent sampling data [10] has been employed by other researchers to develop models at a finer scale; as a result of this research, the information available for the department has been updated. However, the need for entomological validation in the field in areas predicted to have high suitability is recognised, particularly in areas where no previous records exist.
For Ae. aegypti, the annual temperature range was the variable with the greatest contribution to the model. This suggests that areas with greater differences between annual maximum and minimum temperatures present more favourable conditions for the proliferation of the species. This variable is obtained by subtracting BIO 6 from BIO 5, making it a variable of interest when analysing the distribution of species that may be affected by extreme temperatures [59].
In regions such as La Guajira, where rainfall exhibits marked seasonality, rainy periods may favour increases in vector density and, consequently, in the risk of dengue transmission. However, the variables related to rainfall showed negative effects of low magnitude (-0.002 to -0.06), indicating a relatively minor influence on the potential distribution of the vector within the study area. Only rainfall during the driest month (BIO14) showed the most pronounced negative effect; this suggests that higher rainfall levels in the middle of a dry season reduce the environmental suitability for the species.
Previous studies, such as the one carried out for Colombia in 2024 [8] , included the BIO14 variable amongst the selected variables as an important predictor of the species’ environmental suitability, as well as temperature, provided that it remains within a range of 20 to 32 °C, whilst temperatures above 39 °C could affect the mosquito’s survival. Although it is mentioned that for the department of La Guajira the probability of the species’ presence is greater than 0.7, it should be noted that only the records by Maestre-Serrano [33] were used to model this distribution; furthermore, the spatial resolution was lower (21 km) – as this was a national study – compared with the 1 km resolution of other studies carried out in the country [13] and in Florida, United States [10]. However, it is noteworthy that, as this is a study of future scenarios, it is expected that, under the influence of climate change, these areas would become zones with high temperatures that could affect the development of mosquitoes [8] .
Although studies conducted at national level have highlighted the role of rainfall (BIO12 and BIO14) as one of the key determinants of the distribution of Ae. aegypti [13], [13], the potential distribution of this vector in La Guajira appears to be less influenced by rainfall availability and more closely associated with regional temperature gradients. The negative association observed between environmental suitability and rainfall variables, also identified by Portilla and Selvaraj in 2020 [13], may reflect the vector’s adaptation to semi-arid environments, where domestic water storage constitutes a permanent source of breeding sites regardless of rainfall patterns. Instead, our results suggest that annual temperature variability may play a more significant role than precipitation in the potential distribution of Ae. aegypti in La Guajira, a region characterised by predominantly arid conditions [27] . It is noteworthy that other variables closely associated with the annual temperature range (BIO7), such as isothermality (BIO3), have shown a positive association with the species’ suitability; however, this is the first time that the BIO7 variable has been reported as the most important predictor of environmental suitability in an area characterised by severe water stress and high temperatures.
From a public health perspective, the environmental suitability map generated in this study provides a valuable tool for strengthening entomological surveillance in La Guajira. The identification of areas with a high probability of vector presence, such as Manaure, allows for the prioritisation of areas for entomological sampling, the optimisation of resource use and the targeting of vector control interventions [60] . Furthermore, these models can be integrated into geographic information systems and spatial planning processes, contributing to more effective risk management. Although the use of MaxEnt proved to be a suitable tool for modelling the potential distribution of the vectors assessed, even in scenarios with limited information. It is important to recognise that the models are based on presence data and historical environmental variables, which may limit their ability to capture recent dynamics associated with climate change, migration or land-use changes; it is therefore suggested that these variables be incorporated into future studies.
Temporal modelling: analysis using the time series approach (ARIMA)
A key finding of this study was the identification of spatial heterogeneity in the structure of the ARIMAX models between LC and AS, manifested in differences in the time lags for precipitation (2 vs. 1 week) and in the significance of the minimum temperature. This spatial variability in the temporal response to climatic and environmental factors has been documented in other studies of Ae. aegypti conducted using ovitraps in Córdoba (Argentina) [21] and in a study that integrated epidemiology (ARIMAX) with entomological surveillance of immature stages of the species in Brazil [54] , thus reflecting the influence of local factors that modulate the climate-vector relationship.
Possible explanations for this heterogeneity include: 1) Differences in breeding site types: the composition and characteristics of breeding sites may vary between localities, affecting the rate of post-rainfall colonisation and sensitivity to temperature fluctuations [55,61,62]; 2) Microclimatic variability: differences in urban structure, building density and vegetation cover generate local microclimates that modulate the effect of regional climatic variables on mosquito populations [51,63]; and 3) Water management practices: differences in water storage, the frequency of cleaning containers and breeding site elimination practices between communities may influence the population dynamics of the vector [55,61] .
In the Americas, few studies have addressed the analysis of entomological time series using ARIMA models or their integration with exogenous variables. The first such study was carried out in 2008 using mini-CDC traps on Ae. vexans and the Culex pipiens-restuans complex in New York (NY); one of the key findings of the study was that climate explained more variation in Aedes (R2 = 0.548 ) compared with Culex (R2 = 0.164).
More recently, in a study carried out in Brazil by Piovesan in 2026 [54] , an ARIMAX model was applied to assess the predictive potential of entomological surveillance. The study found that, unlike vector density, no consistent seasonality was observed across the 17 regions analysed, and concluded that the abundance of positive Ae. aegypti breeding sites alone has limited capacity to predict dengue epidemics [54].
The results of the ARIMAX models carried out in La Guajira reveal that rainfall is the main temporal modulator of Ae. aegypti abundance in both study sites, with significant positive effects and lags of 1–2 weeks. Similar correlations were obtained in the only recorded study on the peri-urban vector, Aedes albopictus, in Sicily, Italy, where rainfall had a negative correlation (r = −0.335). However, the correlation increased as lags were incorporated into the analysis (3–4 weeks), as we observed in Manaure [17] .
This time lag is biologically plausible, given that rainfall creates breeding sites and the development from egg to adult takes approximately 7–14 days [51,55,62] . This finding is consistent with multiple studies that have documented positive associations between rainfall and the abundance of Ae. aegypti with lags of 1–4 weeks [49,56,57]. Precipitation not only creates new oviposition sites, but also maintains the humidity necessary for larval survival and adult emergence [51] .
Temperature, particularly the minimum temperature, had a significant effect on LC but not on AS, suggesting that the thermal sensitivity of Ae. aegypti populations varies spatially. This heterogeneity could be related to microclimatic differences between localities, influenced by factors such as urban structure, vegetation cover, and availability of shade [20,50]. Although the negative association with minimum temperature may seem contradictory, it is important to consider that in tropical and subtropical regions, high minimum temperatures may be associated with thermal stress or the drying out of breeding sites, particularly in the absence of adequate rainfall [20,50] . Alternatively, this pattern could reflect complex interactions between temperature and other environmental variables not included in the model [52], as well as the climatic characteristics specific to the desert ecosystem context, where arid zones predominate.
However, previous studies have documented that temperature affects multiple aspects of the life cycle of Ae. aegypti, including development rates, survival, fertility and vector competition [50,51,62] . Temperature and rainfall are essential for the mosquito’s life cycle, and their interaction better captures population dynamics than either variable alone [18] .
Limitations: among the main limitations of the study is the possible under-representation of some areas of the department due to the uneven availability of entomological records. Furthermore, the validation of the areas of high environmental suitability predicted by the models requires systematic entomological sampling, with representative spatial coverage to reduce biases associated with the non-uniform distribution of presence records. Given that MaxEnt models are constructed using presence data, they may be affected by spatial biases arising from unequal sampling efforts. A standardised sampling strategy would enable the collection of independent data to assess the accuracy of the predictions and confirm the presence of the species in areas of environmental suitability.
Similarly, in the analysis relating to time series, despite the significance of the methodological advances in this study, a longer time series—such as that carried out by Torina et al. [17] —would allow for the capture of interannual variability and the assessment of the model’s temporal stability. Furthermore, the validation stage of the model’s predictions through prospective monitoring is essential for assessing its operational utility in early warning systems [47,64,65] .
Future studies could incorporate additional socio-environmental variables, future climate scenarios and longitudinal entomological data, with the aim of improving the accuracy of the models and assessing potential changes in the distribution of the Ae. aegypti mosquito under different contexts of environmental change.
5. Conclusions
The potential distribution of Aedes aegypti in the department of La Guajira is determined by key environmental factors; the predominance of the annual temperature range as a variable positively associated with environmental suitability suggests that regional temperature gradients could play an important role in the potential distribution of Ae. aegypti in La Guajira. The models developed provide a valuable tool for strengthening strategies for the surveillance and control of vector-borne diseases in the region. It is recommended that entomological sampling be stepped up in those areas of suitability that have not yet been investigated.
Longitudinal studies based on weekly captures of adult Ae. aegypti are scarce in Colombia, where entomological surveillance has traditionally focused on larval indices [60]. This is the first development of a time-series model of the weekly abundance of Aedes aegypti in Colombia; previous studies on other species or different life stages were carried out by Trawinski and Mackay in New York [18] , Torina et al. in Sicily [17] , Ferreira et al. in Porto Velho [19] , and Piovesan et al. in Santa Catarina (Brazil) using the Box-Jenkins approach. The latter study focused on immature stages of the species Ae. aegypti.
The ARIMAX models developed demonstrate that the temporal dynamics of Ae. aegypti in La Guajira are significantly influenced by climatic variables, particularly rainfall, with delayed effects of 1–2 weeks. Given that in 2025 almost three times as many cases were recorded as in 2021, the increase in dengue cases in the municipality and the current situation are a cause for great concern. This information is crucial for the design of early-warning systems that enable the anticipation of increases in vector abundance and the proactive targeting of control interventions, directing prevention measures when the models predict significant increases in vector abundance. The spatial heterogeneity observed in the lag structures and in sensitivity to climatic variables underscores the need to adapt surveillance and control strategies to the specific local context.
Integrating these findings with MaxEnt models suggests that areas identified as having high environmental suitability will experience increases in mosquito abundance following rainfall events, possibly associated with weekly delays. This information enables the refinement of spatial risk predictions (MaxEnt) [12] with specific temporal dynamics (ARIMAX), facilitating the implementation of anticipatory and targeted control interventions.
Author Contributions
Conceptualization, CMD and ES; methodology, CMD and ES.; software CMD; formal analysis, CMD; resources, MDA and LC; data curation, NG, LC, CMD and ES; writing—original draft preparation, CMD and ES; writing—review and editing, NG, MDA and LC; visualization, CMD and ES; project administration and funding acquisition, ES. All authors have read and agreed to the published version of the manuscript.
Funding
This research received external funding. This research was funded by the Colombian Ministry of Science, Technology and Innovation (MinCiencias), the National Institute of Health (INS) and Guajira University through the Health Research Fund (FIS, its Spanish acronym), under grant number 798 of 2023.
Institutional Review Board Statement
The study was conducted in accordance with the Declaration of Helsinki, and the protocol was approved by the Institutional Review Board (or Ethics Committee) of National Institute of Health (CEMIN 18-2023), on 14th July 2023).
Data Availability Statement
Dataset available on request from the authors.
Acknowledgments
We would like to thank the technical staff of the Manaure Health Secretariat, in particular Jose Antonio Reales Freile, Juan Carlos Gutiérrez and Andora Salas Uriana, for the support they provided during the entomological monitoring activities that enabled this research to be carried out. We would also like to extend our thanks to the organisations that supported the development of other components of the project, such as the Guajira Department of Health, in particular the entomologist Keila Díaz, and the technicians Anibal Torres, Jose Alexander Cantillo and Roiber Vargas. We would also like to thank the organisations that allow the free download of climate and biodiversity data (WorldClim, SiB-GBIF). The entire study, from the research question and methodological design to data collection and analysis, as well as the drafting of the article sections and figures, was carried out entirely by the authors. During the preparation of this manuscript, the authors used DeepL Write to improve the grammatical quality of the manuscript. After using this tool, the authors reviewed and edited the content as needed and takes full responsibility for the content of the publication
Conflicts of Interest
The authors declare no conflicts of interest. The funders had no role in the design of the study; in the collection, analyses, or interpretation of data; in the writing of the manuscript; or in the decision to publish the results.
Abbreviations
The following abbreviations are used in this manuscript:
| ARIMA | Autoregressive Integrated Moving Average |
| MaxEnt | Maximum Entropy |
| AS | Altos de Salinas |
| LC | La Cruzada |
References
- Organización Panamericana de la Salud, “Actualización epidemiológica: dengue y otras arbovirosis en las Américas,” 2023.
- S. Bhatt et al., “The global distribution and burden of dengue,” Nature, vol. 496, no. 7446, pp. 504–507, 2013. [CrossRef]
- World Health Organization, “Dengue and severe dengue – Fact Sheet.” Geneva, 2023, [Online]. Available: https://www.who.int/news-room/fact-sheets/detail/dengue-and-severe-dengue.
- G. MG and E. Harris, “Dengue,” Lancet, vol. 385, no. 9966, pp. 453–465, 2015.
- Pan American Health Organization, “Epidemiological update: Dengue and other arboviruses,” 2021.
- Instituto Nacional de Salud INS, “Boletín Epidemiológico Semanal,” Semana 52 de 2023, 2024. .
- Morales, C. Ferro, C. Isaza de Rodríguez, and E. Cura, “Encuesta sobre artropodos de interés médico en La Guajira, Colombia, Suramérica,” Biomédica, vol. 7, no. 3–4, p. 89, 1987. [CrossRef]
- E. Mejía-Jurado, E. Echeverry-Cárdenas, and O. A. Aguirre-Obando, “Potential current and future distribution for Aedes aegypti and Aedes albopictus in Colombia: important disease vectors,” Biol. Invasions, vol. 26, no. 7, pp. 2119–2137, Jul. 2024. [CrossRef]
- J. Elith, S. J. Phillips, T. Hastie, M. Dudík, Y. E. Chee, and C. J. Yates, “A statistical explanation of MaxEnt for ecologists,” Divers. Distrib., vol. 17, no. 1, pp. 43–57, 2011. [CrossRef]
- K. A. Hopperstad, M. F. Sallam, and M. H. Reiskind, “Estimations of Fine-Scale Species Distributions of Aedes aegypti and Aedes albopictus (Diptera: Culicidae) in Eastern Florida,” J. Med. Entomol., vol. 58, no. 2, pp. 699–707, Mar. 2021. [CrossRef]
- T. L. Johnson et al., “Modeling the Environmental Suitability for Aedes (Stegomyia) aegypti and Aedes (Stegomyia) albopictus (Diptera: Culicidae) in the Contiguous United States,” J. Med. Entomol., vol. 54, no. 6, pp. 1605–1614, Nov. 2017. [CrossRef]
- M. Espinosa, D. Weinberg, C. H. Rotela, F. Polop, M. Abril, and C. M. Scavuzzo, “Temporal Dynamics and Spatial Patterns of Aedes aegypti Breeding Sites, in the Context of a Dengue Control Program in Tartagal (Salta Province, Argentina),” PLoS Negl. Trop. Dis., vol. 10, no. 5, p. e0004621, May 2016. [CrossRef]
- C. V. Portilla Cabrera and J. J. Selvaraj, “Geographic shifts in the bioclimatic suitability for Aedes aegypti under climate change scenarios in Colombia,” Heliyon, vol. 6, no. 1, p. e03101, 2020. [CrossRef]
- Pacheco, P. León Velasco, and C. Muñoz, Análisis de series de tiempo y espacial de eventos de interés en salud pública y su relación con las variables climáticas. Bogota: Insyituto Nacional de Salud, 2022.
- W. Morin, A. C. Comrie, and K. C. Ernst, “Climate and dengue transmission: Evidence and implications,” Environ. Health Perspect., vol. 121, no. 11–12, pp. 1264–1272, 2013. [CrossRef]
- X. Chen and P. Moraga, “Assessing dengue forecasting methods: a comparative study of statistical models and machine learning techniques in Rio de Janeiro, Brazil,” Trop. Med. Health, vol. 53, no. 1, 2025. [CrossRef]
- Torina et al., “Modelling time-series Aedes albopictus abundance as a forecasting tool in urban environments,” Ecol. Indic., vol. 150, no. August 2022, p. 110232, 2023. [CrossRef]
- P. R. Trawinski and D. S. MacKay, “Meteorologically conditioned time-series predictions of West Nile virus vector mosquitoes,” Vector-Borne Zoonotic Dis., vol. 8, no. 4, pp. 505–521, 2008. [CrossRef]
- J. F. Saraiva, N. V. R. Furtado, A. Maitra, D. P. Carvalho, A. K. R. Galardo, and J. B. P. Lima, “Trends of Mansonia (Diptera, Culicidae, Mansoniini) in Porto Velho: Seasonal patterns and meteorological influences,” PLoS One, vol. 19, no. 5 May, pp. 1–16, 2024. [CrossRef]
- F. da S. Cordeiro, A. E. Eiras, F. R. Silva, and J. L. Acebal, “A Model for Aedes aegypti Infestation According to Meteorological Variables: Case of Caratinga (Minas Gerais – Brazil),” Trends Comput. Appl. Math., vol. 22, no. 1, pp. 61–78, 2021. [CrossRef]
- V. Andreo, M. Izquierdo, X. Porcasi, M. Scavuzzo, and W. Ferral, “Time Series Clustering Applied to Eco-Epidemiology: the case of Aedes aegypti in Córdoba, Argentina.” IEEE Biennial Congress of Argentina (ARGENCON), pp. 1–6, 2019.
- M. Kilpatrick and W. J. Pape, “Predicting Human West Nile Virus Infections With Mosquito Surveillance Data,” Am. J. Epidemiol., vol. 178, no. 5, pp. 829–835, 2013. [CrossRef]
- K. Lebl, K. Brugger, and F. Rubel, “Predicting Culex pipiens/restuans population dynamics by interval lagged weather data,” Parasites and Vectors, vol. 6, no. 1, pp. 1–11, 2013. [CrossRef]
- T. A. Groen et al., “Ecology of West Nile virus across four European countries: Empirical modelling of the Culex pipiens abundance dynamics as a function of weather,” Parasites and Vectors, vol. 10, no. 1, pp. 1–11, 2017. [CrossRef]
- C. Ferro et al., “¿Existen condiciones que favorecen la reaparición del virus de la encefalitis equina venezolana en la Alta Guajira colombiana?,” Biomedica, vol. 35, no. 1, pp. 62–72, 2015. [CrossRef]
- Instituto de Hidrología Meteorología y Estudios Ambientales-IDEAM, “Atlas climatológico de Colombia.” Bogotá, Colombia, 2019.
- P. O. Varela, “La Guajira,” Boletín la Soc. Geográfica Colomb., p. 23, 1952, [Online]. Available: www.sogeocol.edu.co.
- ANLA, “Reporte de Alertas Zona Hidrográfica Caribe - Guajira,” Aut. Nac. Licencias Ambient., pp. 5–24, 2018.
- M. Mejía, “Caracterización Hidrogeoquímica De Los Municipios de Manaure y Uribia en La Guajira , Colombia .,” Universidad del Norte, 2022.
- Instituto de Hidrología Meteorología y Estudios Ambientales-IDEAM, “Distribución de la Temperatura Media Anual Promedio Multianual durante el periodo 1981-2010. República de Colombia.” 2014.
- DANE, “Pobreza multidimensional en Colombia 2025 - Boletín técnico,” pp. 1–26, 2025, [Online]. Available: https://www.dane.gov.co/files/operaciones/PM/bol-PMultidimensional-2024.pdf.
- S. Phillips, R. Anderson, and R. Schapire, “Maximum entropy modeling of species geographic distributions.,” Ecol. Modell., vol. 190, no. 3–4, pp. 231–259, 2006.
- R. Maestre-Serrano et al., “Spatial Distribution of Pyrethroid Resistance and kdr Mutations in Aedes aegypti from La Guajira, Colombia,” Insects, vol. 14, no. 1, 2023. [CrossRef]
- GBIF.org, “GBIF Occurrence Download.” 2025. [CrossRef]
- S. Fick and R. Hijmans, “WorldClim 2: new 1km spatial resolution climate surfaces for global land areas.,” Int. J. Climatol., vol. 37, no. 12, pp. 4302–4315, 2017.
- M. U. G. Kraemer et al., “The global compendium of Aedes aegypti and Ae. albopictus occurrence,” Sci. Data, vol. 2, pp. 1–8, 2015. [CrossRef]
- C. Merow, M. J. Smith, and J. A. Silander, “A practical guide to MaxEnt for modeling species’ distributions: What it does, and why inputs and settings matter,” Ecography (Cop.)., vol. 36, no. 10, pp. 1058–1069, 2013. [CrossRef]
- J. C. Padilla, D. P. Rojas, and S.-G. Roberto, Dengue en Colombia: Epidemiología de la reemergencia a la hiperendemia. 2012.
- Vazquez-Prokopec, G. G. M., K. W. A., and U. Kitron, “A new, cost-effective, battery-powered aspirator for adult mosquito collections.,” J. Med. Entomol., vol. 46, no. 6, pp. 1256–1259, 2009. [CrossRef]
- B. Harrison, B. Byrd, C. Sither, and P. Whitt, The Mosquitoes of the Mid-Atlantic Region: An Identification Guide. 2016.
- G. Rúa-Uribe, C. Suarez Acosta, and R. A. Rojo, “Implicaciones epidemiológicas de Aedes albopictus (Skuse) en Colombia,” Rev. Nac. Salud Pública, vol. 3, no. 30, pp. 328–337, 2012.
- Earnest, S. B. Tan, and A. Wilder-Smith, “Comparing statistical models to predict dengue fever notifications,” Comput. Math. Methods Med., p. 758674, 2012.
- K. Wangdi, P. Singhasivanon, T. Silawan, S. Lawpoolsri, N. J. White, and J. Kaewkungwal, “Development of temporal modelling for forecasting and prediction of malaria infections using time-series and ARIMAX analyses: A case study in endemic districts of Bhutan,” Malar. J., vol. 9, no. 1, p. 251, 2010. [CrossRef]
- N. A. Mustaffa, S. M. Zahari, N. Ismail, S. M. Norrulashikin, and N. Z. Abidin, “Forecasting the incidence of dengue fever in Malaysia: A comparative analysis of seasonal ARIMA, dynamic harmonic regression, and neural network models,” Int. J. Adv. Appl. Sci., vol. 13, no. 1, pp. 18–33, 2024. [CrossRef]
- M. Othman, M. Yusof, and M. Zainuddin, “Model forecasting development for dengue fever incidence in Surabaya City using time series analysis.,” Processes, vol. 10, no. 11, p. 2454, 2022.
- R. Anokye;, S. Acheampong;, I. Owusu;, and I. Isaac, “Time series analysis of malaria in Kumasi: Using ARIMA models to forecast future incidence.,” Cogent Soc. Sci., vol. 4, no. 1, p. 1461544, 2018.
- C. V. Ventura;, A. Lippi;, M. Rosa;, F. Rizzoli, Montarsi;, and G. Marini;, “Forecasting the relative abundance of Aedes vector populations to enhance situational awareness for mosquito control operations.,” PLoS Negl. Trop. Dis., vol. 18, no. 12, p. e0012671, 2024.
- V. Steindorf;, A. Barandika;, A. L. García-Pérez, and R. Jado, “Forecasting invasive mosquito abundance in the Basque Country, Spain using machine learning techniques,” medRxiv, 2025.
- Q.-L. Jing; et al., “Imported cases and minimum temperature drive dengue transmission in Guangzhou, China: evidence from ARIMAX model,” Epidemiol. Infect., vol. 146, no. 10, pp. 1226–1235, 2018.
- T. C. Simões, R. L. Codeço, R. A. Santos, E. Massad, M. A. Sanchez, and C. Struchiner, “Modeling the Non-Stationary Climate Dependent Temporal Dynamics of Aedes aegypti,” PLoS One., vol. 8, no. 6, p. e64773, 2013.
- K.-C. Ng, L. Chaves, K. Tsai, and T. Chuang, “Increased Adult Aedes aegypti and Culex quinquefasciatus Abundance in a Dengue Transmission Hotspot,” Insects, vol. 9, no. 3, p. 98, 2018.
- E. A. Bakare;, O. J. Peter;, and O. Uwaheren, “Modelling the association of rainfall and temperature with malaria incidence in Adamawa State, Nigeria.,” Sci. Rep., vol. 16, no. 1, p. 87061, 2026.
- K. E. Alam et al., “Time series analysis of dengue incidence and its association with meteorological risk factors in Bangladesh,” PLoS One, vol. 20, no. 8, p. e0323238, Aug. 2025. [CrossRef]
- M. Piovesan, M. A. Marques, L. F. Schneck, and M. Gottdenker, “Spatiotemporal macroecological patterns of Aedes aegypti and dengue fever in a subtropical region of Brazil,” Acta Trop., vol. 265, pp. 108–141, 2026.
- Á. Eiras, M. Resende, J. Acebal, and K. Paixão, “New Cost-Benefit of Brazilian Technology for Vector Surveillance Using Trapping System,” IntechOpen Malar., 2018.
- D. R. Xavier;, L. M. Magalhães;, A. Gracie;, C. Reis;, and W. Matos, “Analysis of climate factors and dengue incidence in the metropolitan region of Rio de Janeiro, Brazil,” PLoS One., vol. 16, no. 5, p. e0251403, 2021.
- C. Hettiarachchige, S. von Cavallar, T. Lynar, R. Hickson, and and M. Gambhir, “Risk prediction system for dengue transmission based on high resolution weather data,” PLoS One., vol. 13, no. 12, p. e0208203, 2018.
- R. C. M. P. Srimath-Tirumula-Peddinti;, C. Neelapu;, G. Sidagam;, S. Simhadri;, and L. Duvvur, “Association of Climatic Variability, Vector Population and Malarial Disease in District of Visakhapatnam, India: A Modeling and Prediction Analysis,” PLoS One., vol. 10, no. 6, p. e0128377, 2015.
- M. S. O’donnell and D. A. Ignizio, “Bioclimatic Predictors for Supporting Ecological Applications in the Conterminous United States Data Series 691,” USGS Publ. Wareh., p. 10p., 2014, [Online]. Available: http://www.usgs.gov/pubprod.
- R. Barrera, “Recomendaciones para la vigilancia de Aedes aegypti,” Biomédica, vol. 36, pp. 454–62, 2016. [CrossRef]
- R. M. Lana;, T. G. Carneiro;, N. A. Honório;, and C. Codeço, “Assessment of a trap based Aedes aegypti surveillance program using mathematical modeling,” PLoS One, vol. 13, no. 1, p. e0190673, 2018.
- M. D. Eastin, E. Delmelle, I. Casas, J. Wexler, and C. Self, “Intra- and interseasonal autoregressive prediction of dengue outbreaks using local weather and regional climate for a tropical environment in Colombia,” Am. Soc. Trop. Med. Hyg., vol. 91, no. 3, pp. 598–610, Sep. 2014. [CrossRef]
- M. S. Alam, M. H. Kabir, M. A. Islam, M. S. Hossain, and M. M. Rahman, “Spatiotemporal macroecological patterns of Aedes aegypti and dengue fever in a subtropical region of Brazil: seasonal synchrony of larval-positive sites and limited predictive capacity of entomological surveillance,” PLoS One, vol. 20, no. 1, p. e0323238, 2025. [CrossRef]
- L. Hussain-Alkhateeb et al., “Early warning and response system ({EWARS}) for dengue outbreaks: Recent advancements towards widespread applications in critical settings,” PLoS One, 2024. [CrossRef]
- R. Cárdenas, C. M. Sandoval, A. J. Rodriguez-Morales, and C. Franco-Paredes, “The Early Warning and Response System ({EWARS-TDR}) for dengue outbreaks: can it also be applied to chikungunya and {Zika} outbreak warning?,” BMC Infect. Dis., vol. 22, no. 1, pp. 1–12, 2022. [CrossRef]
Figure 1.
Map showing the location of the study area. The top panel shows the department of La Guajira, and within it the municipality of Manaure is highlighted, where the analysis of the temporal dynamics of Ae. aegypti was carried out.
Figure 1.
Map showing the location of the study area. The top panel shows the department of La Guajira, and within it the municipality of Manaure is highlighted, where the analysis of the temporal dynamics of Ae. aegypti was carried out.
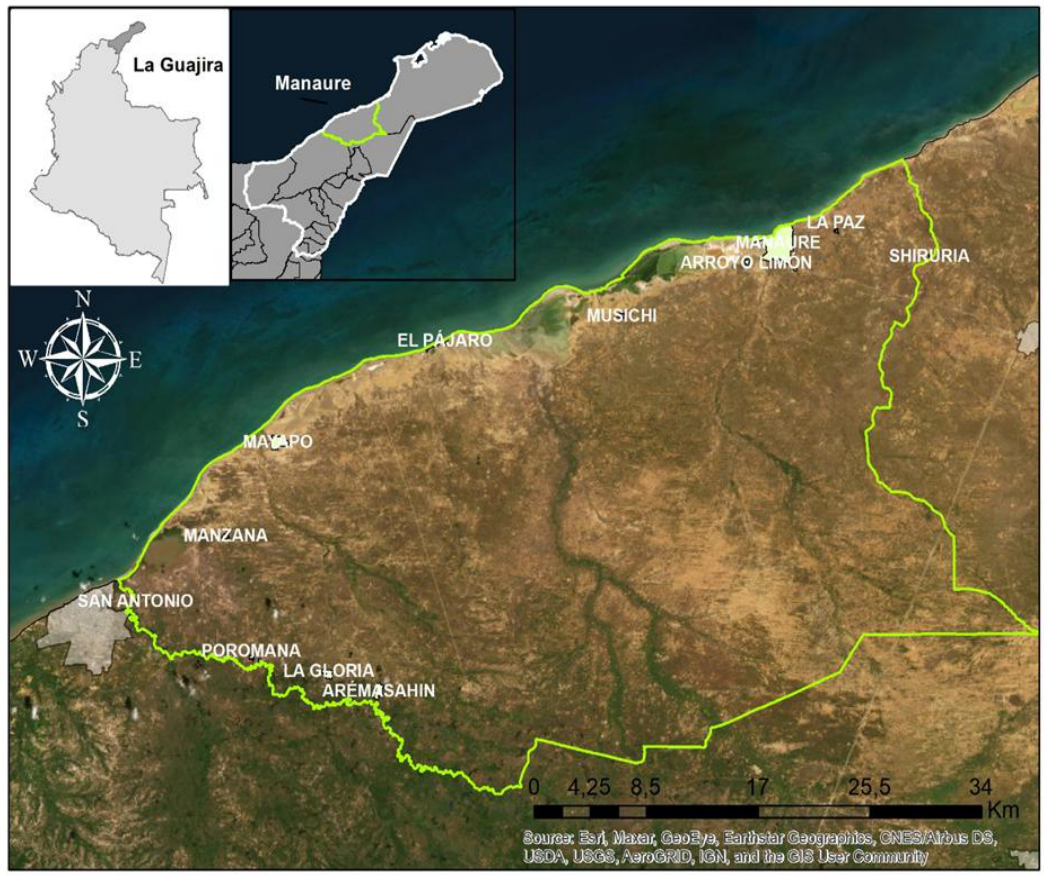
Figure 2.
Entomological sampling process implemented in Manaure. The diagram illustrates the systematic stages of household inspection, sample collection, taxonomic confirmation and integration with meteorological data.
Figure 2.
Entomological sampling process implemented in Manaure. The diagram illustrates the systematic stages of household inspection, sample collection, taxonomic confirmation and integration with meteorological data.
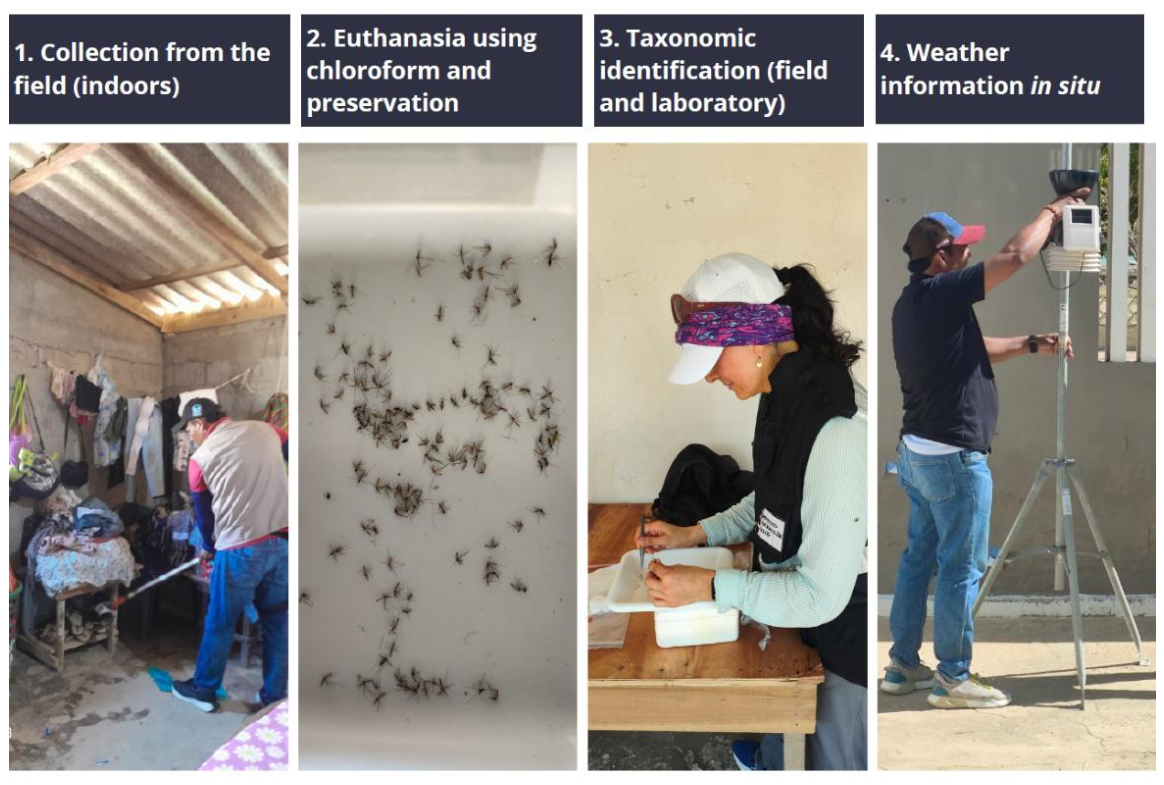
Figure 3.
Potential distribution model for Aedes aegypti. The presence records showed that Ae. aegypti is distributed mainly in low-altitude areas associated with urban centres and settlements, with an altitudinal range between 10 and 227 metres above sea level.
Figure 3.
Potential distribution model for Aedes aegypti. The presence records showed that Ae. aegypti is distributed mainly in low-altitude areas associated with urban centres and settlements, with an altitudinal range between 10 and 227 metres above sea level.
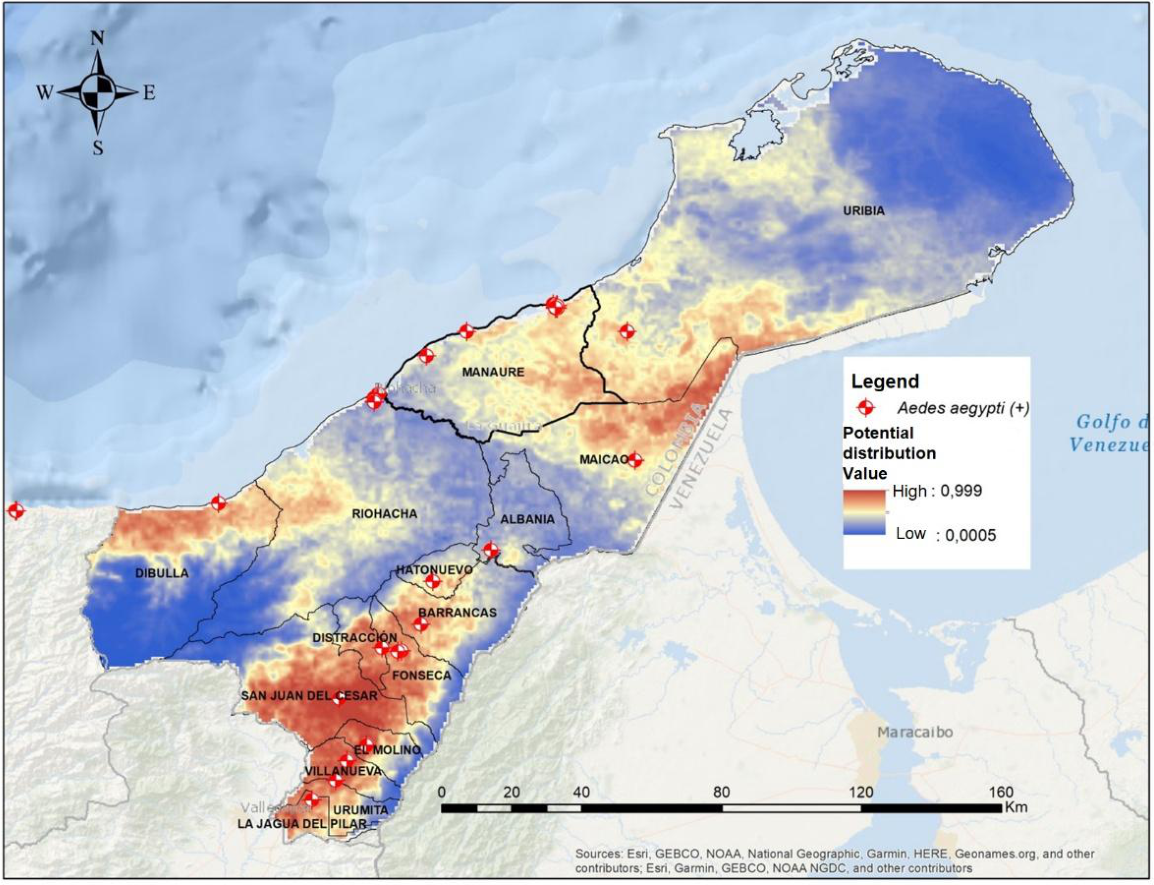
Figure 4.
ROC curve of the MaxEnt model for Aedes aegypti in La Guajira (AUC = 0.81). The AUC value indicates good predictive ability for identifying areas potentially suitable for the presence of the vector.
Figure 4.
ROC curve of the MaxEnt model for Aedes aegypti in La Guajira (AUC = 0.81). The AUC value indicates good predictive ability for identifying areas potentially suitable for the presence of the vector.
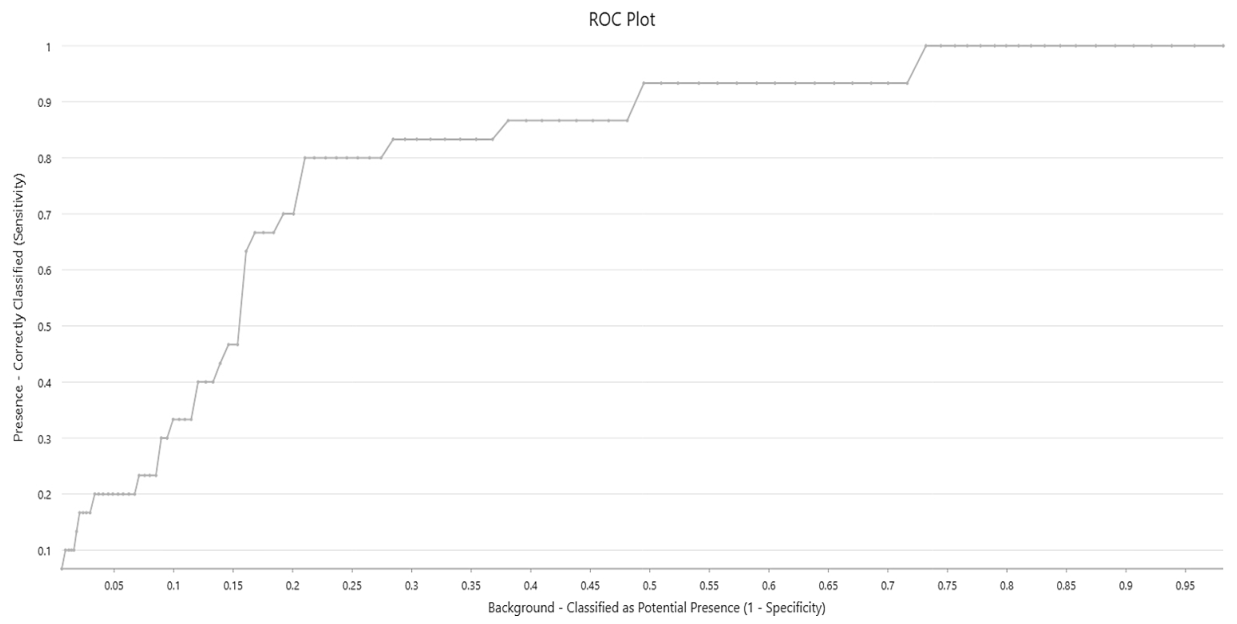
Figure 5.
Comparative box plot of the distributions of females and males by year (2024–2025) and comparisons between the neighbourhoods of La Cruzada (LC) (top) and Altos de Salinas (AS) (bottom).
Figure 5.
Comparative box plot of the distributions of females and males by year (2024–2025) and comparisons between the neighbourhoods of La Cruzada (LC) (top) and Altos de Salinas (AS) (bottom).
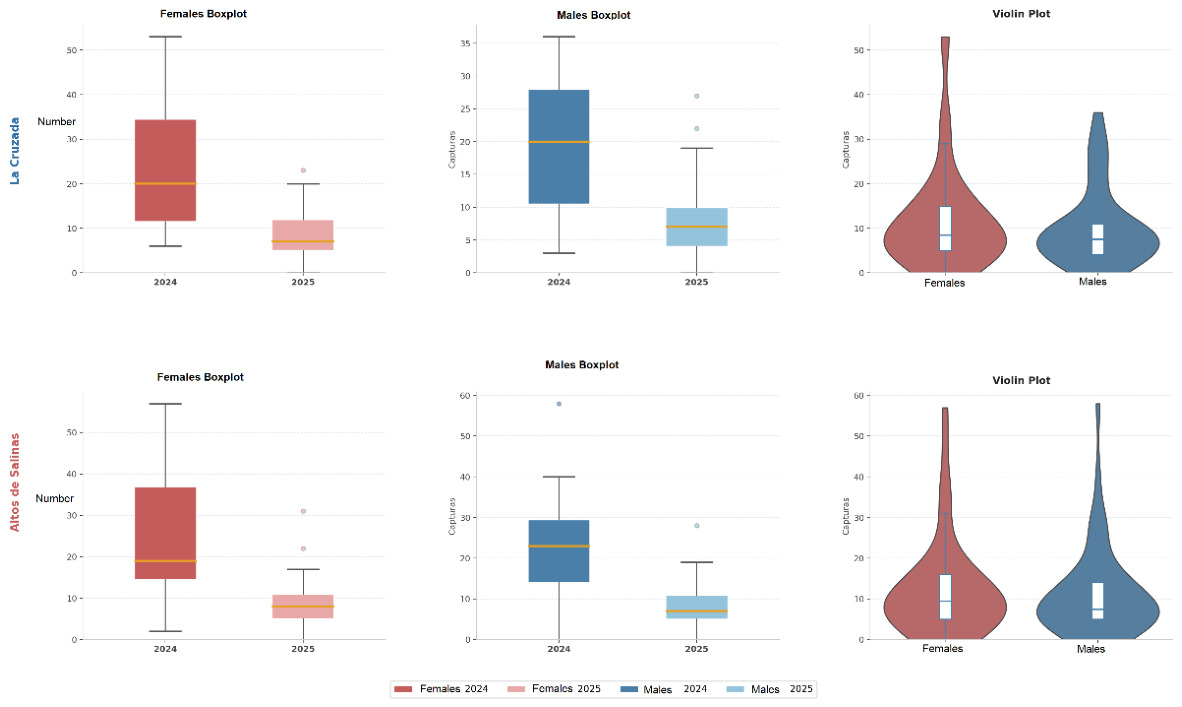
Figure 6.
Location of capture points in the municipality of Manaure, in the neighbourhoods of Altos de Salinas (AS) and La Cruzada (LC); a detailed view of the entomological sampling carried out using Prokopack mosquito aspirator, showing various characteristics of the dwellings inspected.
Figure 6.
Location of capture points in the municipality of Manaure, in the neighbourhoods of Altos de Salinas (AS) and La Cruzada (LC); a detailed view of the entomological sampling carried out using Prokopack mosquito aspirator, showing various characteristics of the dwellings inspected.
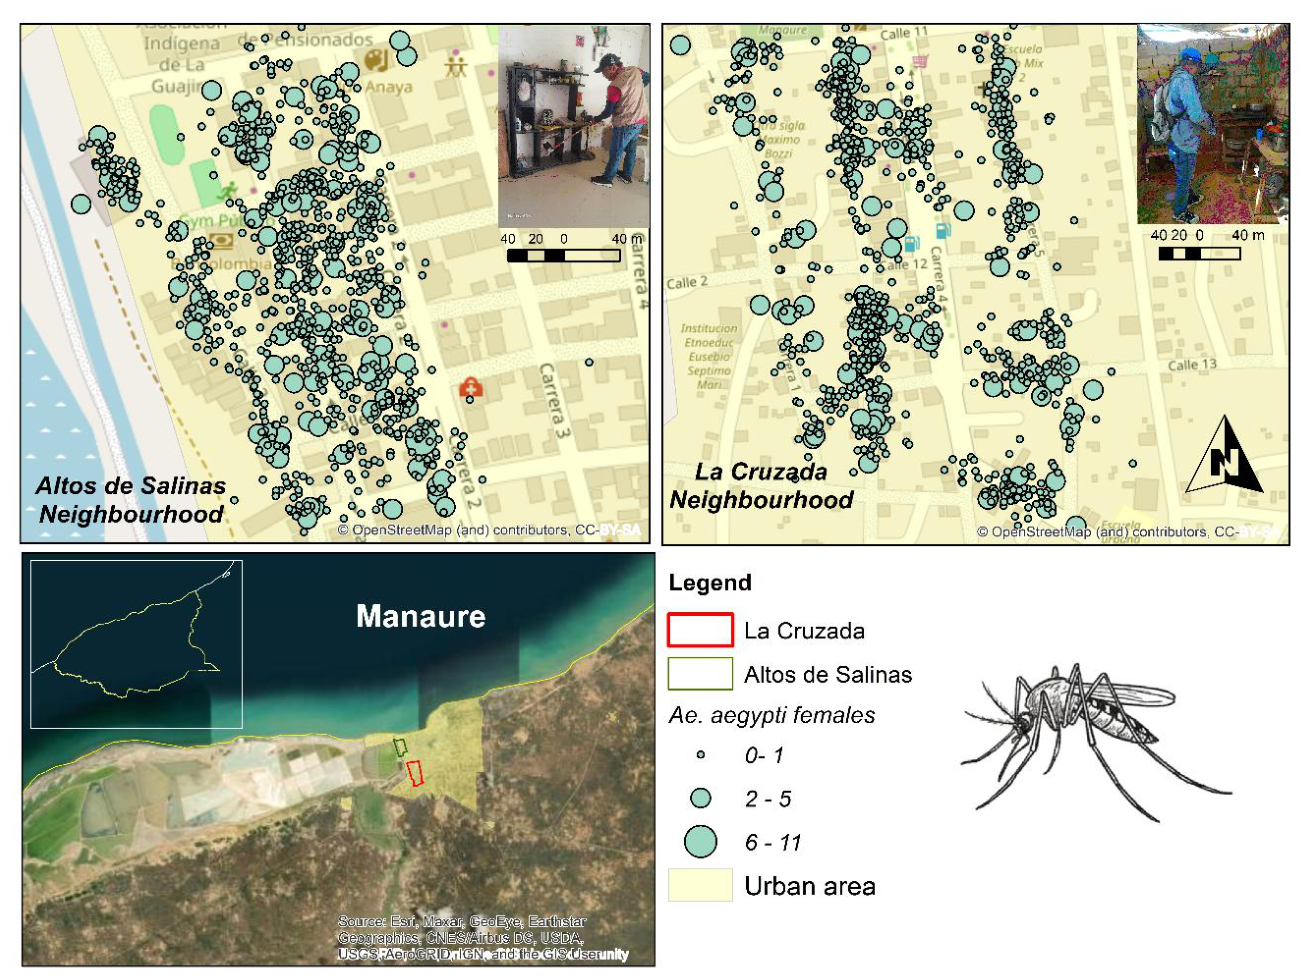
Figure 7.
Heat map. Correlations between meteorological variables in the Altos de Salinas (AS) and La Cruzada (LC) neighbourhoods.
Figure 7.
Heat map. Correlations between meteorological variables in the Altos de Salinas (AS) and La Cruzada (LC) neighbourhoods.
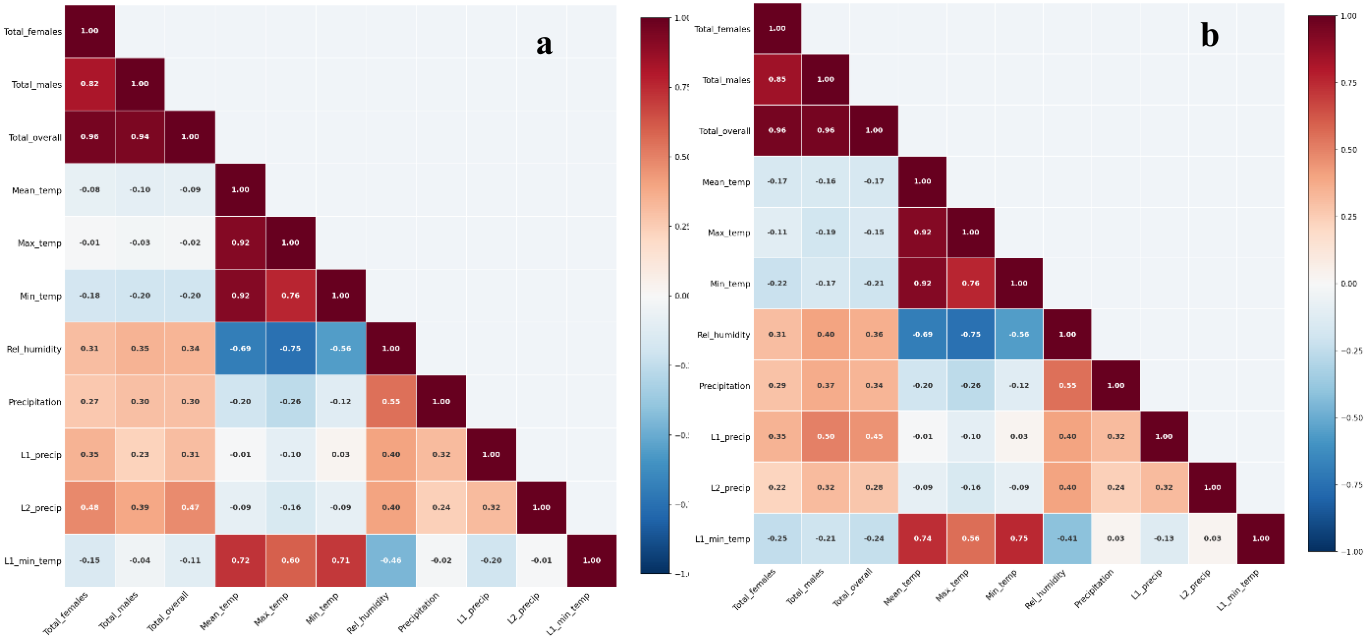
Figure 8.
Time series for Aedes aegypti in the LC neighbourhood (2024–2025). Including the exogenous variables a) precipitation (lag-2) and b)minimum temperature (lag-1).
Figure 8.
Time series for Aedes aegypti in the LC neighbourhood (2024–2025). Including the exogenous variables a) precipitation (lag-2) and b)minimum temperature (lag-1).
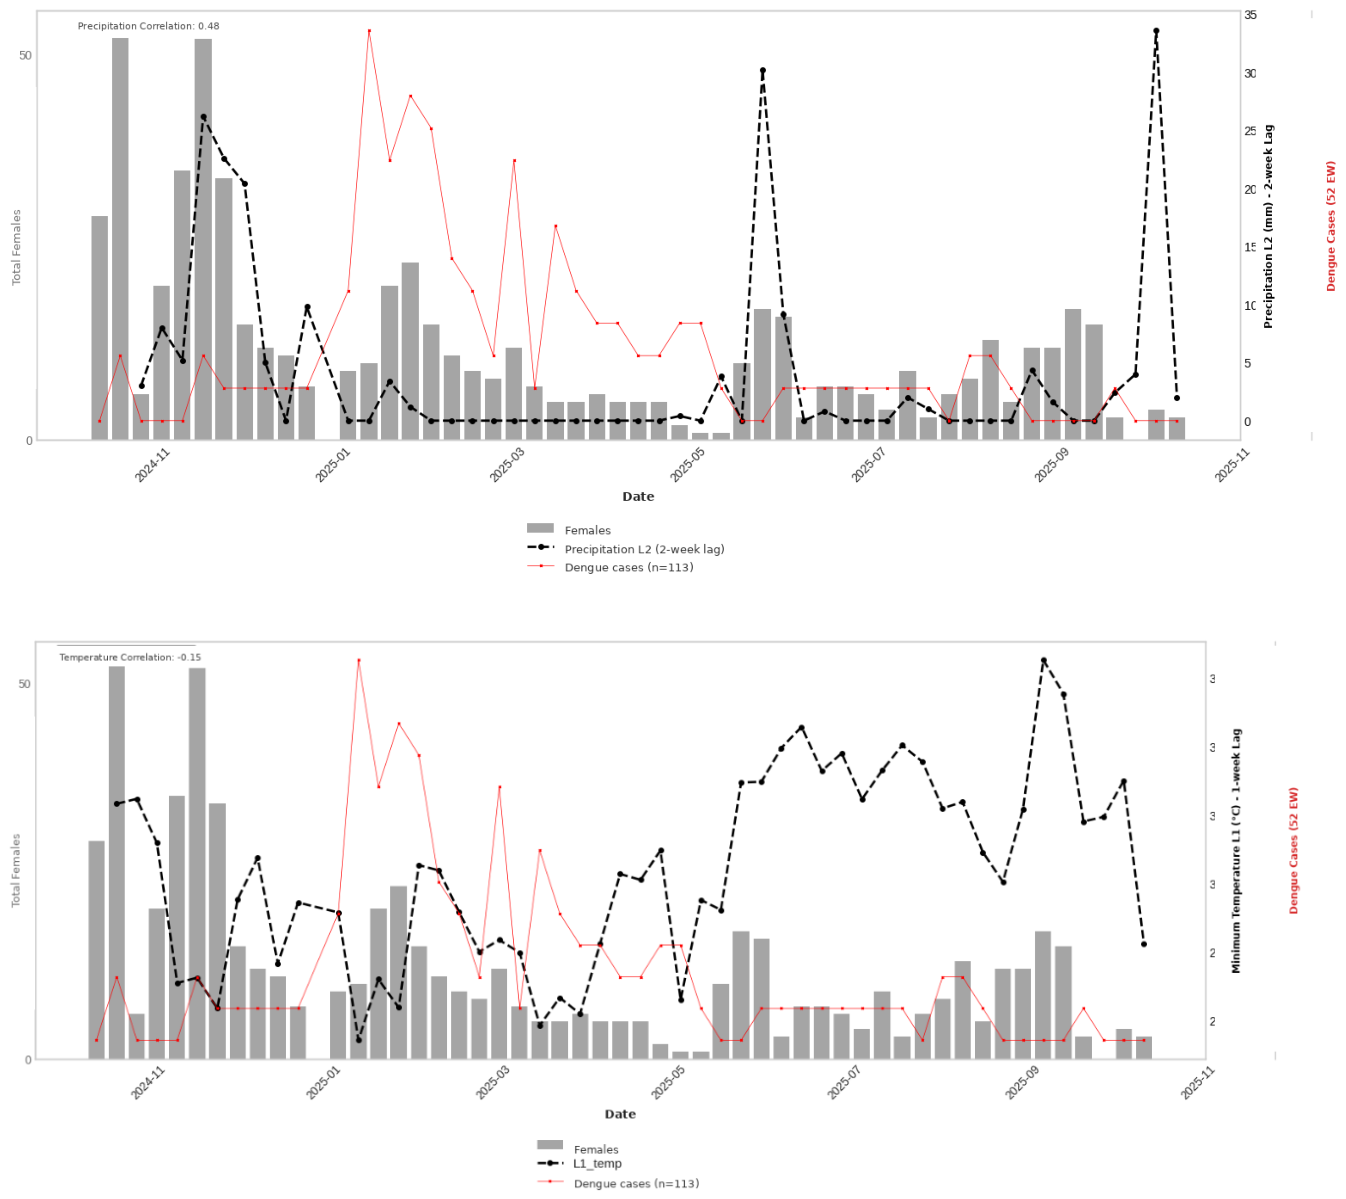
Figure 9.
Time series for Aedes aegypti in the AS neighbourhood (2024–2025). Including the exogenous variables a) precipitation (lag-1) and b) minimum temperature.
Figure 9.
Time series for Aedes aegypti in the AS neighbourhood (2024–2025). Including the exogenous variables a) precipitation (lag-1) and b) minimum temperature.
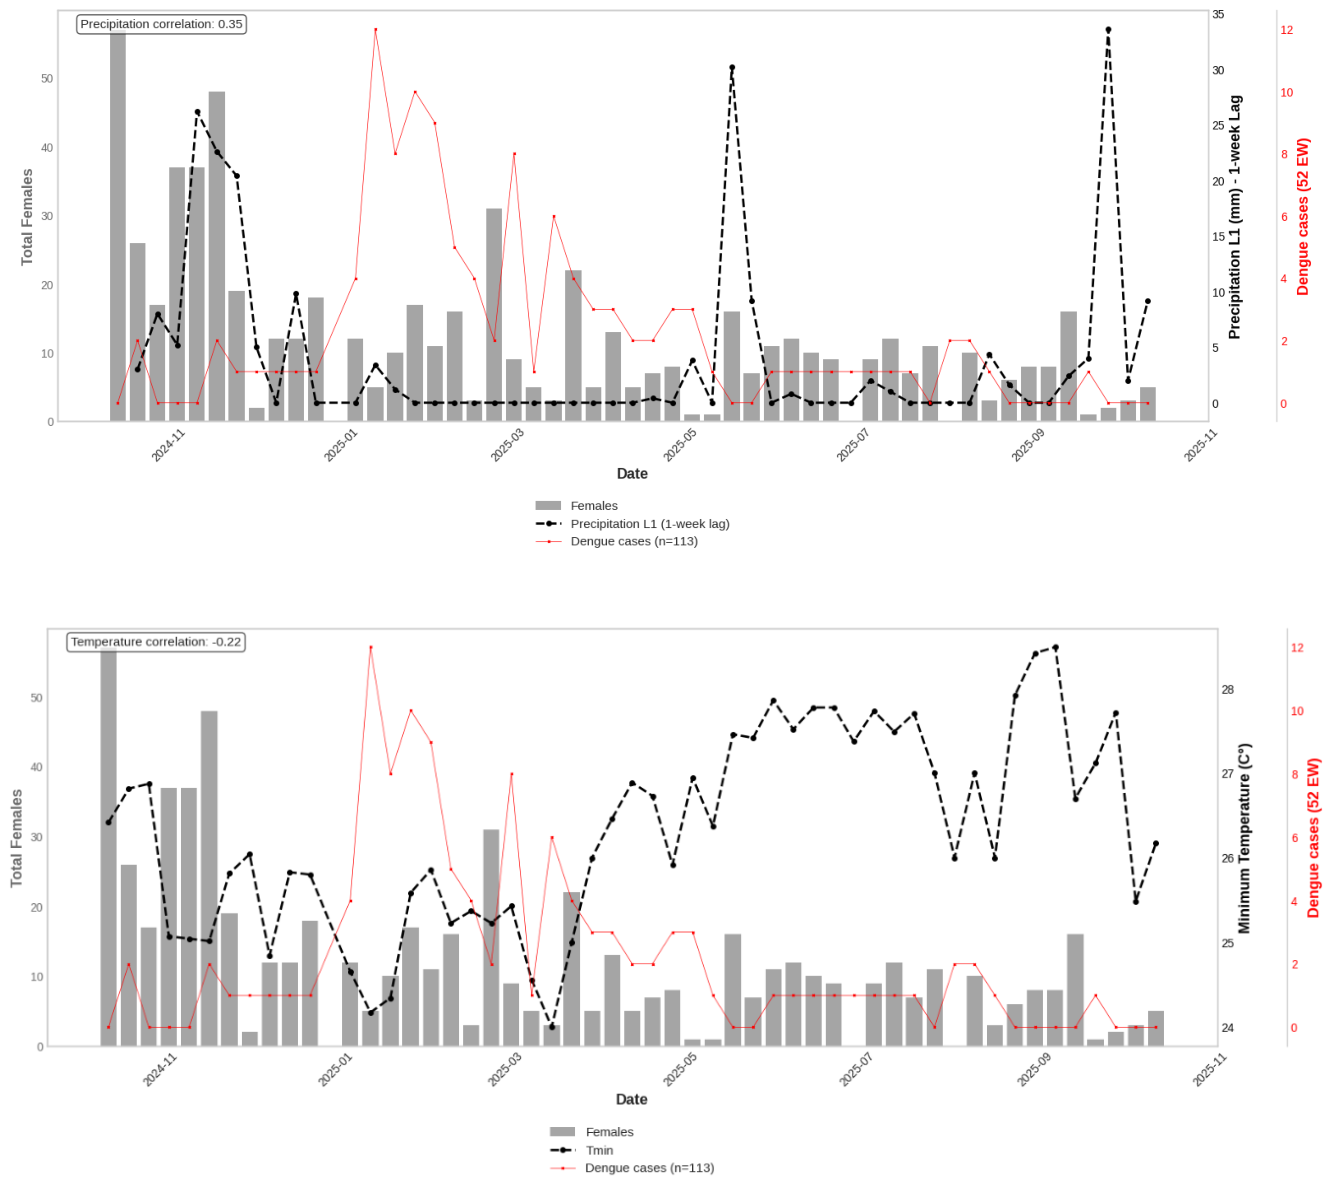

Table 2.
ARIMA (1,0,0) model with exogenous variables for the La Cruzada neighbourhood (2024–2025).
| Variable | Coefficient |
Standard error |
z-value | P-value | 95% CI | ||
| Precipitation (lag-2) | 0.332 | 0.100 | 3.29 | 0.001 | 0.133; –0.529 | ||
|
Minimum temperature (lag-1) |
-2.67 | 1.020 | -2.61 | 0.009 | –4.667; –0.668 | ||
| Constant | 79.03 | 26.65 | 2.97 | 0.003 | 26.79; 131.27 | ||
| AR(1) | 0.679 | 0.095 | 7.14 | <0.001 | 0.492; 0.865 | ||
Table 3.
ARIMA (1,0,0) model with exogenous variables for the Altos de Salinas neighbourhood (2024–2025).
Table 3.
ARIMA (1,0,0) model with exogenous variables for the Altos de Salinas neighbourhood (2024–2025).
| Variable | Coefficient |
Standard error |
z-value | P-value | 95% CI |
| Precipitation (lag-1) | 0.326 | 0.152 | 2.14 | 0.033 | 0.027; 0.624 |
|
Minimum temperature |
-2.33 | 1.726 | -1.35 | 0.177 | –5.714; 1.054 |
| Constant | 71.37 | 44.70 | 1.60 | 0.110 | -16.24; 158.98 |
| AR(1) | 0.309 | 0.133 | 2.32 | 0.020 | 0.048; 0.570 |
Disclaimer/Publisher’s Note: The statements, opinions and data contained in all publications are solely those of the individual author(s) and contributor(s) and not of MDPI and/or the editor(s). MDPI and/or the editor(s) disclaim responsibility for any injury to people or property resulting from any ideas, methods, instructions or products referred to in the content. |
© 2026 by the authors. Licensee MDPI, Basel, Switzerland. This article is an open access article distributed under the terms and conditions of the Creative Commons Attribution (CC BY) license (http://creativecommons.org/licenses/by/4.0/).
Copyright: This open access article is published under a Creative Commons CC BY 4.0 license, which permit the free download, distribution, and reuse, provided that the author and preprint are cited in any reuse.