

Submitted:
17 August 2026
Posted:
19 August 2026
You are already at the latest version
Abstract
Purpose: To describe short- and long-term visual outcomes after MAIA microperimetry Biofeedback Training (BT) in a low-vision rehabilitation cohort.
Methods: Retrospective study of patients who completed BT between 2017 and 2023 (4.1 ± 0.6 sessions). The MAIA device recorded P1 and P2 parameters, defined as the percentage of fundus-tracked fixation points falling within device-defined circular windows centered on the trained retinal locus (TRL). Outcomes: baseline, short-term follow-up (< 6 months), and long-term follow-up (≥6 months): best-corrected distance visual acuity (BCVA), near visual acuity, fixation stability (BCEA), mean retinal sensitivity (dB), and reading speed (wpm) MNRead app.
Results: 346 participants studied. Performance increased: median P1 from 21.5% in session 1 to 32% in session 5, P2 from 66% in session 1 to 81.5% in Session 5. BCVA increased from baseline to short-term follow-up (median 0.40 to 0.30 logMAR; F(2,797)=14.04, p< 0.0001), long-term follow-up did not. Near vision had an improvement (F(2,770)=8.54, p< 0.0001) but no long-term difference from baseline (p=0.0563). In a secondary analysis excluding eyes with documented disease progression, improvements in both distance and near vision were sustained at the long-term follow-up. This finding suggests that disease progression likely attenuated the long-term effect in the full cohort.
Conclusions: BT led to significant short-and- long term functional gains in the absence of disease progression. Given the retrospective design, these findings remain hypothesis-generating evidence supporting further studies.
Keywords:
biofeedback training
Introduction
Low vision substantially limits reading, medication management, face recognition, navigation, and safe mobility, yet many patients are not offered structured rehabilitation that teaches efficient use of their residual vision [1,2]. In individuals with central vision loss, fixation frequently shifts from the damaged fovea to an eccentric preferred retinal locus (PRL), which functions as a “pseudo-fovea.” However, the spontaneously adopted PRL is not always optimally positioned for visual tasks and is often associated with unstable fixation, reducing visual efficiency [3]. Clinically, two characteristics of the PRL are particularly important: its retinal location and its fixation stability, commonly quantified by the 63% bivariate contour ellipse area (BCEA). Although PRLs typically develop near the border of a scotoma, multiple PRLs or task-dependent fixation strategies may emerge in some patients.
Microperimetry-guided Biofeedback Training (BT) has become an important component of contemporary low vision rehabilitation (LVR). By combining real-time retinal tracking with auditory and visual feedback, BT trains patients to improve fixation stability and to optimize—or relocate—their fixation toward a preferred or trained retinal locus (PRL/TRL) located in an area of greater retinal sensitivity and more favorable retinal span [4]. The macular integrity assessment (MAIA) microperimeter provides an integrated platform for identifying PRLs, quantifying fixation stability, measuring retinal sensitivity, and delivering targeted training within routine clinical practice.
Evidence supporting microperimetry-guided BT has accumulated across several retinal and neuro-ophthalmic conditions. Small prospective and retrospective studies have demonstrated improvements in distance and near visual acuity, fixation stability, reading performance, and patient-reported visual function. Functional neuroimaging studies in Stargardt disease further suggest that these behavioral gains may be accompanied by cortical reorganization, with increased activation of visual cortical areas following training [5,6,7,8]. Together, these findings support the biological plausibility of BT; however, most published studies remain limited by relatively small sample sizes, single-disease populations, and short follow-up periods, leaving important questions regarding its effectiveness and durability in routine clinical practice.
The present study addresses these gaps by evaluating one of the largest real-world cohorts of patients undergoing MAIA-guided Biofeedback Training. We retrospectively analyzed 367 patients with a broad spectrum of low vision diagnoses to quantify short- and long-term changes in distance and near visual acuity, fixation stability (63% BCEA), retinal sensitivity, and reading speed following BT. By reflecting routine clinical workflows across a heterogeneous patient population, this study aims to provide clinically relevant evidence to guide patient selection, counseling, treatment scheduling, and program development in low vision rehabilitation.
Methods
Study Design
We conducted a retrospective cohort study of patients receiving microperimetry-guided BT in the Low Vision Rehabilitation services of the Department of Ophthalmology & Vision Sciences (DOVS), University of Toronto. Care was delivered in routine practice at two clinics (Toronto Western Hospital and CNIB Low Vision). Clinical assessment data and BT session logs were abstracted from the medical records. The study adhered to the Declaration of Helsinki and was approved by the University Health Network Research Ethics Board (number 23-5412) in Toronto, Canada, and all the patients signed an informed consent allowing their data to be included in the study.
Participants
All consecutive patients who initiated BT between January 1, 2017 to June 22, 2023 were screened. Inclusion criteria were age ≥5 years and availability of a baseline (pre-BT) assessment and ≥1 post-BT follow-up within a predefined window. Exclusion criteria were incomplete BT protocol (<3 sessions), missing primary outcome at all post-BT timepoints, or inadequate microperimetry quality (operator-flagged unreliable fixation or artifact precluding BCEA computation). Cases in which visual acuity declined during long term follow-up were reviewed in detail, including microperimetry patterns and, when applicable, measurements of maculopathy progression. In all such cases, the decline was attributed to the natural progression of the underlying ocular disease rather than the Biofeedback intervention. These patients were therefore included in the overall cohort description but excluded from a predefined secondary analysis aimed at evaluating outcomes in participants whose visual function remained stable or improved over time.
Biofeedback Training Protocol
BT was delivered using the biofeedback module of the MAIA microperimeter (Centervue, Padova, Italy). The intervention used real-time fundus tracking with auditory and visual feedback to train fixation toward a selected trained retinal locus (TRL). For patients with macular or visual-field loss, the therapeutic goal was relocation and consolidation of fixation at a retinal location with better sensitivity, larger usable visual span, and greater fixation stability. For nystagmus, the therapeutic goal was fixation-stability control rather than relocation. Training was administered across 3–5 sessions (mean 4.1 ± 0.6), each lasting 20 minutes, with rest breaks provided as needed.
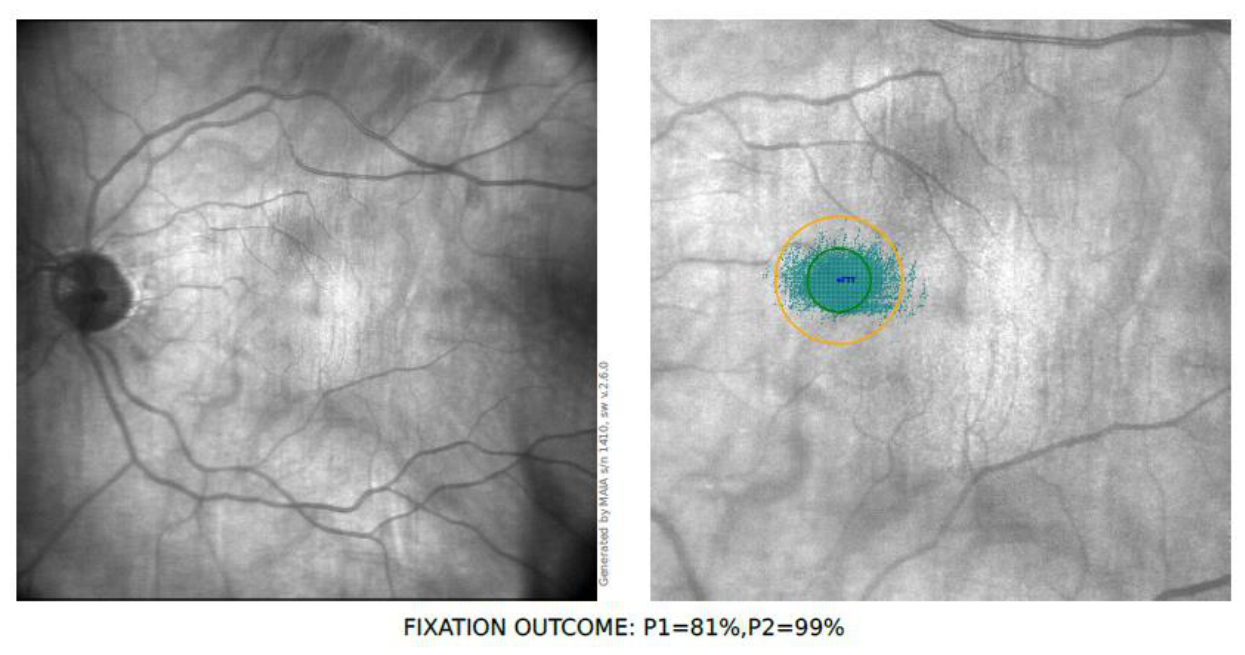
During each BT session, the MAIA device generated two in-session fixation stability metrics, P1 and P2 (Image 1). These are device-derived measures, not separate clinical visual-function tests. P1 indicates the percentage of fixation points that fall within 1° radius of the TRL, and P2 indicates the percentage within 2° radius of the TRL during the training session. Higher P1 and P2 values therefore indicate that a greater proportion of active training time was spent fixating within the intended TRL-centered target area. These metrics were used to summarize performance during BT sessions and were analyzed separately from clinical outcomes such as visual acuity, BCEA, retinal sensitivity, and reading speed.
Figure 1.
In-session fixation control during Biofeedback Training The functional training target (FTT) corresponds to the selected trained retinal locus (TRL). Fixation performance was quantified using MAIA-derived metrics. P1 (green circle) represents the percentage of fundus-tracked fixation points within a 1° radius (2° diameter) centered on the TRL. P2 (yellow circle) represents the percentage of fixation points within the broader target window (2° radius; 4° diameter). In this example, fixation was highly stable during training, with 81% of fixation points within P1 and 99% within P2, indicating consistent adherence to the intended fixation area throughout the session.
Figure 1.
In-session fixation control during Biofeedback Training The functional training target (FTT) corresponds to the selected trained retinal locus (TRL). Fixation performance was quantified using MAIA-derived metrics. P1 (green circle) represents the percentage of fundus-tracked fixation points within a 1° radius (2° diameter) centered on the TRL. P2 (yellow circle) represents the percentage of fixation points within the broader target window (2° radius; 4° diameter). In this example, fixation was highly stable during training, with 81% of fixation points within P1 and 99% within P2, indicating consistent adherence to the intended fixation area throughout the session.
Clinical assessments were abstracted from routine low-vision rehabilitation visits and aligned to three windows: pre-BT baseline, short-term follow-up (<6 months from the final BT session; target 1--3 months), and long-term follow-up (≥6 months; target 9-18 months). Distance BCVA was recorded in logMAR using best correction and ETDRS charts at 4, 2 or 1 meters as adequate. Near visual acuity was recorded in logMAR at the patient’s habitual or documented near working distance with the Colenbrander reading chart. Reading speed was recorded in words per minute with the MNRead App at 40 cm. Microperimetry was performed using the MAIA microperimeter under photopic conditions with real-time fundus tracking. Fixation stability was summarized as the 63% bivariate contour ellipse area (BCEA), and retinal sensitivity was summarized as the mean sensitivity (dB) from microperimetry C 10-2. The same testing approach and microperimetry grid were used within a given patient across visits.
Figure 2.
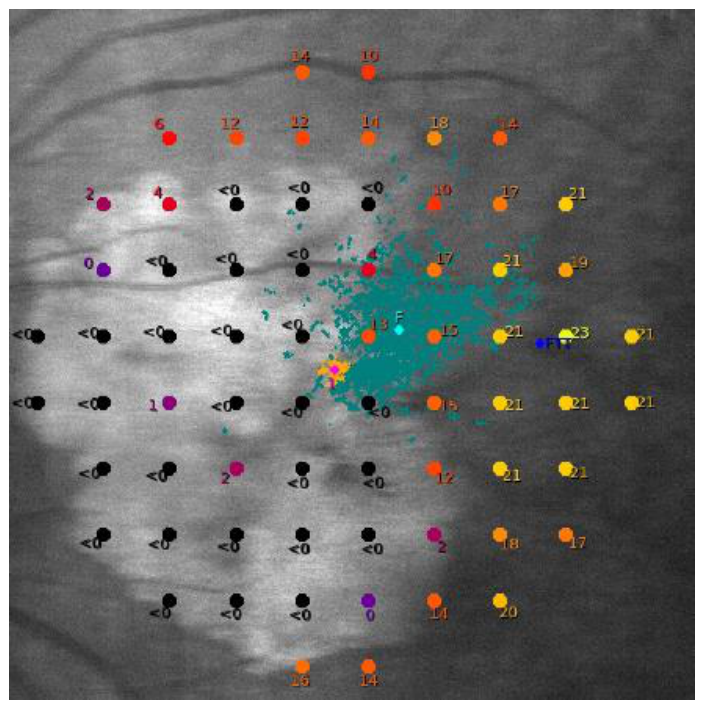
Microperimetry 10-2 The microperimetry image demonstrates a central scotoma with a preferred retinal locus (PRL) located at the temporal border of the defect.PRL is located at a retinal span of lower retinal sensitivity and unstable fixation. The functional training target (FTT - red circle) indicates the selected trained retinal locus (TRL), positioned within a region of higher retinal sensitivity intended to optimize functional vision.
Figure 2.
Microperimetry 10-2 The microperimetry image demonstrates a central scotoma with a preferred retinal locus (PRL) located at the temporal border of the defect.PRL is located at a retinal span of lower retinal sensitivity and unstable fixation. The functional training target (FTT - red circle) indicates the selected trained retinal locus (TRL), positioned within a region of higher retinal sensitivity intended to optimize functional vision.
Outcomes
The primary outcome was the performance during the training sessions (P1/P2) from sessions 1 to 5. BT session performance was summarized as the within-person change from the first to the last session for P1 and P2, separately. Secondary outcomes were the within-person change in best-corrected distance visual acuity (BCVA, logMAR) of the trained eye from pre-BT baseline to the short- and long-term follow-up, binocular near visual acuity (logMAR), fixation stability calculated by the MAIA software as the 63% bivariate contour ellipse area (BCEA, deg2), mean retinal sensitivity, and reading speed calculated by the MNRead app tested at 40 cm in words per minute.
For patients whose trained-eye BCVA worsened relative to baseline at a long-term post-BT visit, we quantified anatomic progression to contextualize functional decline. Absolute scotoma area on microperimetry was defined as the set of loci with 0 dB sensitivity; area (deg2) was estimated as the proportion of 0 dB loci multiplied by the total sampled field area, with a sensitivity analysis using Voronoi tessellation to sum the cell areas of 0 dB points. When imaging was available, geographic atrophy (GA) boundaries on fundus infrared or color fundus photographs were traced using calibrated planimetry (ImageJ/Fiji), converted to mm2 after spatial calibration to the device scale. Change scores were computed from paired images at matched time windows. “Worsened BCVA” was defined as any increase in logMAR at the long-term visit relative to pre-BT. Even a one-line change in BCVA can substantially affect quality of life in patients with low vision, so this was the criteria. In sensitivity analyses, we examined a threshold-based definition of worsening (≥0.10 logMAR).
Statistical Analysis
Continuous variables are reported as mean (SD) or median (IQR), and categorical variables as counts (%). We fit linear mixed-effects models with random intercepts for participants to estimate mean changes across timepoints while accommodating missing-at-random follow-up. Fixed effects included time (pre-BT, short-term and long-term), type of vision loss (central loss, peripheral loss, diffuse loss and nystagmus), age, and gender. Planned contrasts estimated mean differences for pre-BT→short-term (primary), pre-BT→long-term, and short-term→long-term. For BT session performance, we estimated the within-person slope across sessions and summarized the first-to-last session change. A two-sided α = 0.01 was applied to the primary contrast and key secondary outcomes to account for the heterogeneous nature of our cohort, which increases variability and warrants a more conservative significance threshold. Models adjusted for age, sex, clinic, and number of BT sessions. Analyses were performed in SAS (v9.4).
Results
Cohort Characteristics
A total of 346 unique patients were included in the study with a mean age of 56.62 years ± 27.24 years, and sex distribution was balanced (51.7% vs 48.3%; Table 1). Patients were drawn from two clinics in similar proportions (57.35% vs 42.65%).

Table 1.
Participant characteristics at baseline (2017-2023; n=346).
| Variable | Mean | SD |
| Age, years | 56.62 | 27.24 |
| Short-term follow-up interval, months | 1.3 | 1.5 |
| Long-term follow-up interval, months | 18.7 | 11.3 |
| BT sessions per patient | 4.1 | 0.6 |
| Sex | n | % |
| Female | 179 | 51.7 |
| Male | 167 | 48.3 |
| Diagnosis at baseline | ||
| AMD | 65 | |
| Hemianopia/quadrantanopia | 65 | |
| Optic neuropathy | 50 | |
| Nystagmus | 45 | |
| Glaucoma | 35 | |
| Retinal dystrophy | 30 | |
| Other visual-field defects | 14 | |
| Other retinopathies | 7 | |
| Uveitis | 6 | |
| Myopic degeneration | 6 | |
| Macular hole | 5 | |
| Foveal hypoplasia | 4 | |
| Diabetic retinopathy/DME | 4 | |
| ERM | 3 | |
| Oculocutaneous albinism (OCA) | 3 | |
| Congenital cataract | 2 | |
| Corneal disease | 1 | |
| Amblyopia | 1 |
BT = Biofeedback Training, AMD = Age-Related Macular Degeneration, DME = Diabetic Macular Edema, ERM = Epiretinal Membrane.
Primary Outcome - Within-Training Session Performance
P1 and P2 measures increased in parallel across sessions, reflecting progressively better TRL-centered fixation. Median P1 rose from 21.5% in session 1 to 32% in session 5, and P2 improved from 66% in session 1 to 81.5% in Session 5 (Table 3). Linear mixed-effects models demonstrated a significant effect of training on both measures. For P1, the effect of session was significant (F(4,1069)=21.75, p<0.0001), with stepwise increases from Session 1 to Session 5 (Session 2: +3.28; Session 3: +5.00; Session 4: +6.53; Session 5: +7.64, all relative to Session 1; all p<0.0001). For P2, the session effect was similarly significant (F(4,1069)=20.83, p<0.0001), with progressive improvements (Session 2: +3.21; Session 3: +5.65; Session 4: +6.60; Session 5: +7.28 vs. Session 1; all p<0.0001). Higher P1 and P2 values indicate that a greater proportion of fundus-tracked fixation points fell within the device-defined TRL-centered target windows during active training. The smaller number of observations in Sessions 4 and 5 primarily reflects variation in the number of training sessions completed in routine clinical practice, rather than increased task difficulty or reduced patient performance.
Table 2.
Distance and near best corrected visual acuity across visits.
| Outcome | Baseline (logMAR + IQR) | Short term | p-value | Long term | p-value |
| BCVA | 0.40 (0.20 - 0.80) |
0.30 (0.10 - 0.70) |
< 0.0001 | 0.30 (0.10 - 0.80) |
0.4490 |
| Near vision | 0.20 (0.00 - 0.30) |
0.10 (0.00 - 0.30) |
< 0.0001 | 0.10 (0.00 - 0.30) |
0.0563 |
| BCVA (secondary analysis) | 0.40 (0.20 - 0.80) |
0.30 (0.00 - 0.70) |
< 0.0001 | 0.20 (0.00 - 0.70) |
< 0.0001 |
| Near vision (secondary analysis) | 0.10 (0.00 - 0.30) |
0.00 (0.00 - 0.30) |
< 0.0001 | 0.00 (0.00 - 0.30) |
< 0.0001 |
Table 3.
Session performance during Biofeedback Training.
| Session | n (paired) | Median P1 (IQR) (%)* | Median P2 (IQR) (%)* |
| 1 | 346 | 21.5 (9 - 42) | 66.0 (35 - 91) |
| 2 | 346 | 25.0 (10 - 45) | 69.5 (39 - 93) |
| 3 | 339 | 27.0 (13 - 49) | 72.0 (45 - 95) |
| 4 | 312 | 30.0 (13 - 52) | 74.0 (47.5 - 94.5) |
| 5 | 76 | 32.0 (18 - 59) | 81.5 (54.5 - 95.5) |
*P1 and P2 are MAIA device-derived in-session fixation-control metrics recorded during active Biofeedback Training. P1 is the percentage of fundus-tracked fixation points within the 1° radius (2° diameter) of the trained retinal locus (TRL). P2 is the percentage within the broader target window (2° radius/4° diameter). Higher values indicate a greater proportion of training time spent fixating within the intended TRL-centered window. Sessions 1-5 refer to sequential BT sessions, not separate clinical visual function tests. Lower n in Sessions 4-5 reflects incomplete completion of later sessions in routine clinical workflow.
Secondary Outcomes
Distance visual acuity improved in the short term. Median VA at baseline was 0.40 logMAR (IQR 0.20–0.80, n = 344), at short-term follow-up 0.30 logMAR (IQR 0.10–0.70, n = 290), and 0.30 logMAR (IQR 0.10–0.80, n = 185) at long-term follow-up. Mixed-model analysis showed a significant improvement only at the short-term visit (F(2,797) = 14.04, p < 0.0001). Although the long-term median matched the short-term value, it was not significantly different from baseline (p = 0.4490) - likely because greater variability at the long-term visit reduced statistical power despite similar medians.
Near visual acuity also improved over time. Median near VA at baseline was 0.20 logMAR (IQR 0.00–0.30, n = 312), at short-term follow-up 0.10 logMAR (IQR 0.00–0.30, n = 268), and 0.10 logMAR (IQR 0.00–0.30, n = 171) at long-term follow-up. Near vision showed a significant improvement at the short-term visit (F(2,770) = 8.54, p < 0.0001). In contrast, the long-term visit did not differ significantly from baseline (p = 0.0563).
Baseline BCVA was the only significant predictor of final visual acuity following BT, with better initial vision associated with better visual outcomes. This association remained significant after adjustment for age and sex. In contrast, the type of vision loss (central, peripheral, diffuse, or nystagmus-associated) was not a significant predictor of outcome.
Median reading speed at baseline was 94 words per minute (IQR 65–139, n = 77), at short-term follow-up 101 words per minute (IQR 59–137, n = 63), and at long-term follow-up 114 words per minute (IQR 37–145, n = 21). Although median reading speed increased at both short-term and long-term follow-up, mixed-model analysis showed no significant effect of visit (F(2,115) = 0.27, p = 0.898), with neither follow-up timepoint differing significantly from baseline.
BCEA showed modest change over time. Median BCEA at baseline was 4.0°2 (IQR 0.9–10.5, n = 327), at short-term follow-up 2.8°2 (IQR 0.5–7.2, n = 229), and at long-term follow-up 3.4°2 (IQR 0.4–8.3, n = 115). However, mixed-model analysis did not identify a significant overall effect of visit on BCEA (F(2,520) = 0.57, p = 0.685). Analysis of PRL relocation after training was not possible due to insufficient data.
Retinal sensitivity remained largely stable over time. Median retinal sensitivity at baseline was 13.7 dB (IQR 7.3–18.6, n = 258), at short-term follow-up 13.6 dB (IQR 6.7–19.5, n = 175), and at long-term follow-up 14.4 dB (IQR 8.0–20.9, n = 90). Mixed-model analysis did not demonstrate a significant overall effect of visit on retinal sensitivity (F(2,433) = 0.26, p = 0.906).
Cases That Worsened in Visual Acuity and Secondary Analysis
Fifty-two eyes were flagged clinically as worsened on the long term (AMD n = 14; glaucoma n = 9; retinal dystrophy n = 9; optic neuropathy n = 4; nystagmus n = 3; homonymous hemianopia n = 2; other n = 11). In paired analyses, central scotoma cases showed contraction of the seeing island: median absolute scotoma/GA area increased by -172,908 pixels2 (pre 2,276,435 [IQR 789,611-6,404,369] → post 1,857,856 [656,336,3,384,732]; n=26; p=0.045), accompanied by fewer seeing points (-3; n=26; p=0.0011) and lower retinal sensitivity (-1.50 dB; n=24; p=0.0008). BCEA was unchanged for these cases (median Δ -0.48 deg2; n=19; p=0.418).
Tunnel-vision cases showed more variable area change (median +14,389 pixels2; n=11; p=0.139) with no median change in seeing points (0; n=11; p>0.99) and a small, non-significant RS reduction (-0.25 dB; n=10; p=0.314); BCEA remained stable (-0.08 deg2; n=8; p=0.461).
Across all worsened cases with paired data, seeing points (-1.5; n=44; p=0.0016) and retinal sensitivity (-1.20 dB; n=40; p=0.0005) declined, whereas BCEA did not show a consistent shift (median Δ -0.48 deg2; n=32; p=0.160).
A secondary analysis was conducted eliminating the cases that worsened their visual acuity over time. Analyzing the cases that did not get worse, distance visual acuity improved over time. Median VA at baseline was 0.40 logMAR (IQR 0.20–0.80, n = 288), at short-term follow-up 0.30 logMAR (IQR 0.00–0.70, n = 227), and at long-term follow-up 0.20 logMAR (IQR 0.00–0.70, n = 124). Linear mixed-model analysis confirmed a significant effect of training on VA (F(2,349) = 64.95, p < 0.0001), indicating meaningful improvement from baseline to both short and long term follow-ups.
Near vision showed statistically significant improvements after training. Median near VA at baseline was 0.10 logMAR (IQR 0.00–0.30, n = 269), at short-term follow-up 0.00 logMAR (IQR 0.00–0.30, n = 224), and at long-term follow-up 0.00 logMAR (IQR 0.00–0.30, n = 130). Despite these similar distributions, the mixed-effects model detected a significant effect in short and long term visits (F(2,348) = 15.05, p < 0.0001).
For the same cohort, reading speed remained stable across visits. Median reading speed at baseline was 100.95 wpm (IQR 66.0–139.5, n = 68), at short-term follow-up 102.0 wpm (IQR 62.0–139.1, n = 54), and at long-term follow-up 100.0 wpm (IQR 49.0–154.5, n = 16). The linear mixed model showed no significant change over time (F(2,61) = 1.58, p = 0.2149).
BCEA values showed a trend toward improvement from baseline through short- and long-term follow-up. However, the change did not show a significant effect of visit on BCEA (F(2,275) = 1.23, p = 0.2927). Median BCEA at baseline was 3.6°2 (IQR 0.80–10.55, n = 280), at short-term follow-up 2.5°2 (IQR 0.50–6.90, n = 197), and at long-term follow-up 2.4°2 (IQR 0.40–7.20, n = 85).
Retinal sensitivity remained stable across visits. Median sensitivity at baseline was 13.9 dB (IQR 7.75–18.90, n = 220), at short-term follow-up 13.6 dB (IQR 7.30–19.60, n = 150), and at long-term follow-up 15.0 dB (IQR 10.35–21.40, n = 64). Even though there was a trend toward higher median sensitivity at long-term, linear mixed-model analysis showed no significant effect of visit on retinal sensitivity (F(2,205) = 0.40, p = 0.6692).
Side Effects
Right after a training session, some patients reported symptoms of dry eye or a temporary mild headache, which resolved within a few hours or by the next day. No severe side effects were reported from BT in our cohort.
Discussion
In this large retrospective cohort of 346 patients undergoing MAIA-guided Biofeedback Training, we observed significant short-term improvements in both distance and near visual acuity, together with progressive improvements in fixation performance during training. Importantly, eyes without evidence of disease progression maintained these gains over long-term follow-up, suggesting that deterioration in the full cohort primarily reflected progression of the underlying disease rather than loss of the rehabilitation effect.
Progressive improvement in P1 and P2 across training sessions provides objective evidence of acquisition of the trained fixation strategy. These parameters quantify the proportion of fixation maintained within the target retinal locus during the rehabilitation and therefore serve as objective markers of oculomotor learning. Their consistent improvement over time suggests that patients progressively learned to stabilize fixation more effectively at the intended retinal location.
Although the median visual acuity improvement observed in our cohort was approximately one line, this magnitude of change should not be dismissed as clinically trivial. In low-vision populations, even relatively small improvements in acuity can produce meaningful gains in functional independence, reading efficiency, face recognition, medication management, and overall quality of life. Previous studies have demonstrated significant associations between visual acuity and patient-reported quality of life, particularly among individuals with retinal disease [9,10,11]. Moreover, visual acuity thresholds around 20/50 to 20/70 frequently determine eligibility for driving privileges, occupational activities, and rehabilitation services in many jurisdictions. Consequently, a one-line improvement may represent the difference between maintaining or losing important aspects of independence. The functional importance of modest visual acuity gains is therefore likely greater in low-vision populations than in normally sighted individuals.
One notable finding was the apparent discrepancy between improvements in visual acuity and the absence of statistically significant changes in BCEA and retinal sensitivity. Several hypotheses may explain this observation. Visual acuity is a task-specific outcome that may improve through more efficient use of residual retinal function rather than fixation stability alone [12,13,14]. Furthermore, patients may learn to position visual targets more consistently within a small region of relatively preserved retina, thereby improving visual performance while producing only modest changes in BCEA. Second, BCEA is known to exhibit substantial interindividual variability, particularly in heterogeneous low-vision populations with different fixation strategies and underlying disease mechanisms. Finally, improvements in visual performance may reflect adaptive changes in oculomotor control and visual processing that are not fully captured by BCEA [8,15,16]. Although these mechanisms were not directly evaluated in the present study, they may contribute to improved visual function despite relatively stable global fixation metrics.
The subgroup analysis of eyes that experienced visual decline over time provides important clinical insight into the interpretation of long-term outcomes following BT. In these patients, worsening visual acuity was accompanied by objective evidence of disease progression, including enlargement of absolute scotomas or geographic atrophy, reduction in retinal sensitivity, and loss of seeing retinal loci. These findings suggest that deterioration in visual performance was more likely attributable to progression of the underlying disease process than to loss of training-induced adaptations. This distinction is clinically relevant because it supports the concept that BT remains beneficial even in progressive diseases, although the magnitude of improvement may eventually be offset by ongoing retinal degeneration. In such situations, repeat training sessions may be warranted to establish a new TRL and optimize the use of remaining retinal function as disease progression alters retinal architecture and microperimetry.
The biological plausibility of these findings is supported by an expanding body of evidence demonstrating substantial plasticity within both the oculomotor and visual systems following vision loss. Patients with central vision impairment frequently develop eccentric preferred retinal loci (PRLs) that function as substitutes for the damaged fovea. However, naturally selected PRLs are often not located in retinal regions that maximize visual performance [3,12,13,14,15]. Biofeedback training aims to guide patients toward a retinal locus with greater functional potential, such as higher retinal sensitivity and/or promoting more stable fixation, thereby improving the efficiency with which residual visual information is utilized. Functional neuroimaging studies further support this mechanism. Investigations in macular degeneration have demonstrated activation of cortical regions associated with the PRL stimulation, supporting the concept of adaptive cortical reorganization following central vision loss.[17,18]. Furthermore, a randomized controlled trial in Stargardt disease demonstrated increased visual cortical activation following biofeedback training, providing evidence that rehabilitation-induced changes may extend beyond the retina to involve adaptive neural processes within the visual cortex [7]. Together, these findings support the hypothesis of biofeedback training as a rehabilitation strategy that may promote adaptive neuroplastic changes, thereby improving visual performance despite persistent structural retinal damage.
The recent EFFECT randomized trial by Crossland and colleagues reported no measurable benefit of biofeedback training [19]. However, important methodological differences may explain the discrepancy with our findings. The EFFECT protocol consisted of only two 10-minute sessions (approximately 20 minutes in total), whereas patients in our program received a mean of 4.1 sessions lasting 20–30 minutes each (approximately 80–120 minutes in total). Similar training durations have been used in previous studies reporting favorable outcomes [5,6,8,20,21]. Differences in training dose and reinforcement may therefore contribute to the divergent results. Future prospective trials should directly evaluate the dose-response relationship and determine the optimal frequency and duration of biofeedback training.
Our findings have several practical implications for low vision rehabilitation. First, patients can reasonably be counseled to expect improvements in visual acuity following biofeedback training, even when conventional fixation metrics remain relatively unchanged. The magnitude of improvement appeared consistent across a broad range of ocular and neuro-ophthalmic conditions, suggesting that the underlying mechanism of rehabilitation may be applicable across different causes of vision loss.
Second, the attenuation of visual acuity gains observed in some patients at long-term follow-up appeared to be associated primarily with progression of the underlying disease rather than loss of the acquired fixation strategy. Accordingly, patients with progressive conditions may benefit from periodic reassessment and, where appropriate, additional training sessions. Whether scheduled booster sessions improve the durability of treatment effects remains unknown and should be evaluated prospectively.
Finally, biofeedback training should be viewed as one component of comprehensive vision rehabilitation. For patients whose primary goal is reading, combining fixation training with reading-specific interventions may provide greater functional benefit than either approach alone. Likewise, serial microperimetry and structural imaging may help distinguish disease progression from changes related to rehabilitation, allowing treatment strategies to be individualized over time.
Strengths and Limitations
This study has several strengths. It represents one of the largest cohorts of patients undergoing microperimetry-guided biofeedback training and includes a broad spectrum of low-vision disorders encountered in routine clinical practice. Multiple functional outcomes were evaluated using standardized assessments, and longitudinal analyses incorporated repeated measurements over both short- and long-term follow-up. In addition, structural imaging was reviewed in eyes demonstrating deterioration, allowing progression of the underlying disease to be distinguished from potential loss of treatment effect.
Several limitations should also be acknowledged. The retrospective design and absence of a control group preclude causal inference. Attrition at longer follow-up intervals, particularly for reading speed, may have introduced bias despite the use of linear mixed-effects models to accommodate incomplete longitudinal data. The heterogeneous study population and variable number of training sessions likely increased variability in treatment response, although they also reflect routine clinical practice. Furthermore, we relied on summary fixation metrics exported by the microperimeter rather than continuous eye movement recordings, limiting assessment of more subtle oculomotor adaptations. Contrast sensitivity, vision-related quality-of-life measures, and detailed analyses of PRL relocation were not consistently available and therefore could not be evaluated. These outcomes should be incorporated into future prospective studies.
Although the heterogeneous cohort enhances the generalizability of our findings, it may also have obscured diagnosis-specific treatment effects. It is likely that different disease mechanisms respond differently to biofeedback training. Future adequately powered prospective studies should investigate disease-specific outcomes and identify clinical predictors of successful rehabilitation.
Future randomized controlled trials should compare biofeedback training with sham or standard rehabilitation, evaluate the optimal training dose and reinforcement schedule, and incorporate reading-specific interventions where appropriate. Longitudinal assessment of PRL or trained retinal locus relocation, retinal sensitivity, structural progression, contrast sensitivity, and patient-reported vision-related quality of life will provide a more comprehensive understanding of treatment effects. In addition, emerging evidence that cortical activation is not restricted to a single PRL suggests that rehabilitation strategies targeting multiple retinal loci with preserved function may warrant investigation as an alternative to traditional single-locus approaches.7,25,26
Conclusion
Microperimetry-guided biofeedback training was associated with significant short-term improvements in best-corrected visual acuity and objective indicators of fixation learning across a heterogeneous cohort of patients with low vision. Although long-term visual acuity gains were attenuated in some patients, this decline appeared largely attributable to progression of the underlying disease rather than loss of the trained fixation strategy. These findings support the role of biofeedback training as a valuable component of multidisciplinary vision rehabilitation and reinforce the biological plausibility of neuroplastic adaptation following vision loss. Prospective randomized studies are now needed to define the optimal treatment dose, identify patients most likely to benefit, and determine strategies to maximize the durability of functional improvements.
Funding
Donald K. Johnson Eye Institute.
Acknowledgments
We thank our research assistants Oluwafikunmi Adeyemo and Caitlin Falcon from the Clinical Research Unit at the Donald K. Johnson Eye Institute for assistance with data extraction and program administration.
Conflicts of Interest
None.
References
- Khimani K, Battle C, Malaya L, et al. Barriers to Low-Vision Rehabilitation Services for Visually Impaired Patients in a Multidisciplinary Ophthalmology Outpatient Practice - PubMed. Journal of ophthalmology. 11/29/2021;2021doi:10.1155/2021/6122246.
- Klauke S, Sondocie C, Fine I. The impact of low vision on social function: The potential importance of lost visual social cues. Journal of Optometry. 2022 May 12;16(1)doi:10.1016/j.optom.2022.03.003.
- Tarita-Nistor L, González E, Markowitz S, Steinbach M. Plasticity of fixation in patients with central vision loss - PubMed. Visual neuroscience. 2009 Nov;26(5-6)doi:10.1017/S0952523809990265.
- Markowitz S. Principles of modern low vision rehabilitation - PubMed. Canadian journal of ophthalmology Journal canadien d’ophtalmologie. 2006 Jun;41(3)doi:10.1139/I06-027.
- Daibert-Nido M, Patino B, Markowitz M, Markowitz S. Rehabilitation with biofeedback training in age-related macular degeneration for improving distance vision - PubMed. Canadian journal of ophthalmology Journal canadien d’ophtalmologie. 2019 Jun;54(3)doi:10.1016/j.jcjo.2018.10.016.
- Misawa M, Pyatova Y, Sen A, et al. Innovative vision rehabilitation method for hemianopsia: Comparing pre- and post audio-luminous biofeedback training for ocular motility improving visual functions and quality of life - PubMed. Frontiers in neurology. 04/11/2023;14doi:10.3389/fneur.2023.1151736.
- Melillo P, Prinster A, Iorio VD, et al. Biofeedback Rehabilitation and Visual Cortex Response in Stargardt’s Disease: A Randomized Controlled Trial. Translational Vision Science & Technology. 2020 May 11;9(6)doi:10.1167/tvst.9.6.6.
- Daibert-Nido M, Pyatova Y, Markowitz M, Taheri-Shirazi M, Markowitz S. Post audio-visual biofeedback training visual functions and quality of life in paediatric idiopathic infantile nystagmus: A pilot study - PubMed. European journal of ophthalmology. 2021 Nov;31(6)doi:10.1177/1120672121991048.
- Scilley K, DeCarlo DK, Wells J, Owsley C. Vision-specific health-related quality of life in age-related maculopathy patients presenting for low vision services. Optom Vis Sci. 2004;81:15–24.
- Mangione CM, Lee PP, Gutierrez PR, et al. Development of the 25-item National Eye Institute Visual Function Questionnaire (VFQ-25). Arch Ophthalmol. 2001;119:1050–1058. Sep;103(9)doi:10.1016/s0161-6420(96)30483-1.
- Cahill MT, Stinnett SS, Banks AD, et al. National Eye Institute Visual Function Questionnaire in the Age-Related Eye Disease Study (AREDS): AREDS Report No. 10. Arch Ophthalmol. 2005;123:211–217.
- Crossland M, Sims M, Galbraith R, Rubin G. Evaluation of a new quantitative technique to assess the number and extent of preferred retinal loci in macular disease - PubMed. Vision research. 2004;44(13)doi:10.1016/j.visres.2004.01.006.
- Cacho I, Dickinson C, Reeves B, Harper R. Visual acuity and fixation characteristics in age-related macular degeneration - PubMed. Optometry and vision science : official publication of the American Academy of Optometry. 2007 Jun;84(6)doi:10.1097/OPX.0b013e318073c2f2.
- Crossland M, Culham L, Rubin G. Fixation stability and reading speed in patients with newly developed macular disease - PubMed. Ophthalmic & physiological optics : the journal of the British College of Ophthalmic Opticians (Optometrists). 2004 Jul;24(4)doi:10.1111/j.1475-1313.2004.00213.x.
- Guez J, Le Gargasson J, Rigaudiere F, O’Regan J. Is there a systematic location for the pseudo-fovea in patients with central scotoma? - PubMed. Vision research. 1993 Jun;33(9)doi:10.1016/0042-6989(93)90213-g.
- White JM, Bedell HE. The oculomotor reference in humans with bilateral macular disease. Invest Ophthalmol Vis Sci. 1990;31(6):1149–1161.
- Baker C, Peli E, Knouf N, Kanwisher N. Reorganization of visual processing in macular degeneration - PubMed. The Journal of neuroscience : the official journal of the Society for Neuroscience. 01/19/2005;25(3)doi:10.1523/JNEUROSCI.3476-04.2005.
- Dilks D, Baker C, Peli E, Kanwisher N. Reorganization of visual processing in macular degeneration is not specific to the “preferred retinal locus” - PubMed. The Journal of neuroscience : the official journal of the Society for Neuroscience. 03/04/2009;29(9)doi:10.1523/JNEUROSCI.5258-08.2009.
- Rubin G, Crossland M, Dunbar H, et al. Eccentric Viewing Training for Age-Related Macular Disease: Results of a Randomized Controlled Trial (the EFFECT Study) - PubMed. Ophthalmology science. 2023;4(2)doi:10.1016/j.xops.2023.100422.
- Amore FM, Paliotta S, Silvestri V, et al. Biofeedback stimulation in patients with age-related macular degeneration: comparison between 2 different methods. Can J Ophthalmol. 2013;48:431–437.
- Silvestri V, De Rossi F, Piscopo P, et al. The Effect of Varied Microperimetric Biofeedback Training in Central Vision Loss: A Randomized Trial. Optom Vis Sci. 2023;100:737–744.
Disclaimer/Publisher’s Note: The statements, opinions and data contained in all publications are solely those of the individual author(s) and contributor(s) and not of MDPI and/or the editor(s). MDPI and/or the editor(s) disclaim responsibility for any injury to people or property resulting from any ideas, methods, instructions or products referred to in the content. |
© 2026 by the authors. Licensee MDPI, Basel, Switzerland. This article is an open access article distributed under the terms and conditions of the Creative Commons Attribution (CC BY) license (http://creativecommons.org/licenses/by/4.0/).
Copyright: This open access article is published under a Creative Commons CC BY 4.0 license, which permit the free download, distribution, and reuse, provided that the author and preprint are cited in any reuse.