

Submitted:
17 August 2026
Posted:
18 August 2026
You are already at the latest version
Abstract
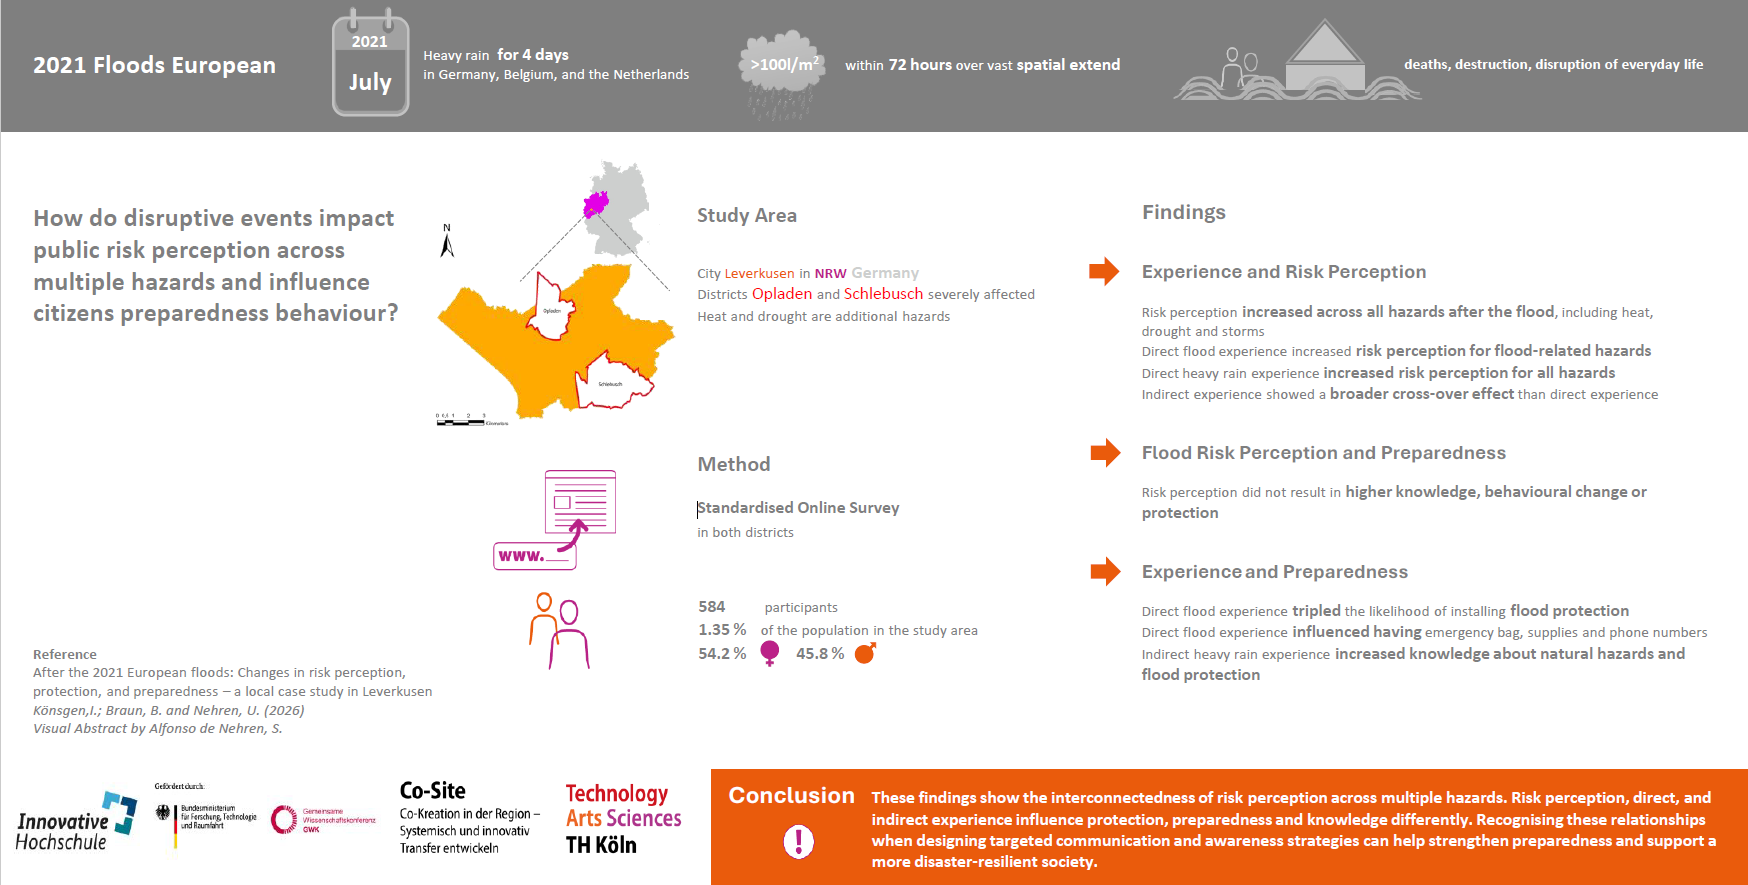
The 2021 European floods were among the most destructive in recent decades, highlighting the importance of understanding how disruptive events shape risk perception and preparedness across multiple hazards, especially under climate change. This study examines how this flood affected risk perception and preparedness among 584 residents in Leverkusen, a city in the Rhine catchment severely impacted by the event. Using a standardised survey, it tests a priori hypotheses derived from cross-over literature and Protection Motivation Theory (PMT), complemented by exploratory analyses of specific hazard pairs and preparedness behaviours. Results show that retrospectively reported risk perception increased across all assessed hazards after the flood, indicating clear crossover effects: experience with one hazard also influenced perceptions of other hazards, with direct heavy-rain experience affecting all hazards, and indirect experiences led to broader effects. Consistent with key elements of PMT, direct flood experience was the strongest indicator of protective installations, whereas indirect experience was mainly linked to higher knowledge about natural hazards and flood protection. Survey responses suggest higher perceived risk and knowledge after the 2021 flood, but changes in protection and behaviour remained limited. The study contributes to empirical evidence of cross-over effects in an urban, multi-hazard context several years after a major flood, where direct and indirect experiences shape perception and preparedness differently, highlighting the need for targeted communication to support adaptation after disruptive flood events.
Keywords:
risk perception
; protection
; preparedness
; cross‐over effect
; 2021 European flood
1. Introduction
Natural hazards, such as droughts, heatwaves, heavy rain and floods, are becoming more prominent in central Europe due to anthropogenic climate change [1]. While fluvial floods in major European river systems like the Rhine [2], Danube, and Elbe [3] have traditionally dominated the region, pluvial and flash floods will likely increase in the future due to intensified spatial heavy rain [1], affecting smaller watersheds regularly [4]. Additionally, projections show that storm severity will double in northwestern Europe due to a location shift of storm frequencies under different climate scenarios [5].
In this changing climate, the state of North Rhine-Westphalia (NRW) in western Germany is experiencing an increase in frequency and intensity of heatwaves [6], droughts [7], and heavy rain [8]. These events interact to amplify risk; for instance, heavy rainfall events can trigger fluvial, pluvial, and flash floods, especially when infiltration capacity is limited, both in sewer and natural systems [9]. Furthermore, increasing summer droughts and heatwaves reduce soil water absorption, thereby amplifying surface runoff and flood risk during subsequent heavy rainfall [10].
Despite this increasing hazard frequency and intensity, public risk perception often does not align with expert risk assessments [11,12,13], which complicates effective preparedness efforts. While previous risk and disaster management practices focused on structural measures, recent studies emphasise the need for an integrated approach that incorporates social factors like individual risk perception [14,15] and previous disaster experience [16,17]. These dimensions are key drivers of preparedness behaviour, fostering greater self-efficacy among the public during hazard events. Nevertheless, current levels of self-efficacy remain insufficient. It is therefore important to develop an appropriate perception of the risks that may arise in one’s immediate environment and to be prepared to withstand the adverse effects of possible natural hazards. Drawing on cognitive heuristics and the psychometric paradigm, this research advances the understanding of how disruptive events impact public risk perception across multiple hazards and investigates how these perceptions shape preparedness behaviours, framed within key elements of the Protection Motivation Theory (PMT).
Leverkusen serves as an ideal case study for these dynamics, as the city is exposed to river and pluvial flooding, experiences a pronounced urban heat island effect, and has recently been affected by droughts. Industrial activity, traffic, sealed surfaces, dense construction, and lack of wind corridors result in temperatures up to 10 °C higher than in surrounding rural areas [18]. Heat stress results in increasing mortality [19], impairs physical and mental well-being, and reduces productivity [20]. While people tend to perceive sudden (acute) onsets like flash floods as more threatening than slow (chronic) onsets like heatwaves and droughts [21,22], Leverkusen has seen a significant increase in both drought months [23] and storm frequency [24]. These stresses interact locally; for example, drought-induced canopy reduction diminishes rainfall interception and exacerbates heat stress through reduced shading [25], while decreasing tree robustness makes them more susceptible to storm damage [26].
The 2021 European flood can be categorised as a disruptive event, characterised by its rare, sudden, and surprising impact on people [15]. Triggered by the low-pressure system “Bernd,” the flood caused widespread devastation across western and central Europe, with particularly severe effects in Germany, the Netherlands, Belgium, and Austria. The disaster resulted in a total of 243 fatalities, including 196 in Germany alone [27]. The economic losses reached approximately 46 billion euros, with 33 billion euros incurred in Germany [28]. In the German states of North Rhine-Westphalia and Rhineland-Palatinate, the floods caused widespread infrastructure collapse and loss of life [29], overwhelming both authorities and the public despite existing warning systems.
During the 2021 floods, the city of Leverkusen was severely affected by flooding from tributaries of the Rhine, despite typically experiencing less significant heavy rainfall and flood damage from smaller rivers. The districts of Opladen and Schlebusch were especially impacted, leading to hospital and retirement home evacuations, destruction of educational facilities and private properties [30]. Reconstruction efforts in these districts required 62 million euros, reflecting damage to municipal infrastructure alone [31].
Existing studies on the 2021 European floods have focused primarily on rural areas, particularly the Ahr Valley, while urban contexts have been examined to a lesser extent. Addressing this gap, this research explores how experiencing a highly disruptive disaster, such as the 2021 European floods, influences public risk perception across multiple natural hazards in an urban setting (Leverkusen’s flood-affected districts) and addresses the role of risk perception, severe affectedness and hazard experience for preparedness, behaviour and knowledge. It contributes to the literature by (1) examining longer-term effects of the 2021 floods in an urban area, (2) distinguishing between direct and indirect disaster experiences, and (3) analysing cross-over effects, that is, the transfer of one hazard experience to perceptions of other hazards.
Understanding these dynamics is essential for developing integrated risk communication and management strategies that foster resilience in communities in the face of climate-induced risks.
2. State of the Art
2.1. Risk Perception
Studies on risk perception first emerged in the early 1960s and have continually evolved ever since. Research on this topic notably expanded during the 2000s, with the most recent field of studies on the risk perception of natural hazards [32].
This study focuses on the cognitive heuristic theory as well as the psychometric paradigm. According to these frameworks, risk perception can be understood as a mental construct influenced by several factors. It involves “the processing of physical signals and/or information about potentially harmful events […], and the formation of a judgement about seriousness, likelihood and acceptability of the respective event […]” [13], (p. 98). People use mental shortcuts to categorise the severity of a risk [33]. This intuitive heuristic is based on experience, probability estimation and potential negative consequences [13,33]. Hence, many individuals adjust their risk-taking behaviour by adopting an optimal risk strategy that does not necessarily maximise their rewards but provides a good payoff while minimising the chance of catastrophic outcomes. Thus, individuals tend to avoid risks when potential losses are high, and are more willing to take risks when the likelihood of rewards is high [34].
Due to these heuristics, risk is perceived differently by each individual. To assess risk perception, laypeople do not use the science-based risk equation of hazard, exposure and vulnerability, but rather rely on their individual perceptions, which are influenced by personal background and emotions [13]. Consequently, there is a significant difference between the risk perception of experts and laypeople. Risks with a high number of potential fatalities but low frequency are perceived as particularly risky by non-experts. In contrast, they may underestimate risks that occur more frequently but have less devastating impacts [11,12]. Typical biases identified in risk assessment are summarised in Table 1.
In addition to these biases, risk is influenced by factors such as dread, control, familiarity, voluntariness, previous experience, stigmatisation, attitude, and personal involvement [11,35]. When individuals voluntarily place themselves in a risky situation, have control over it, are familiar with it, hold a positive attitude towards it, and perceive low stigmatisation, the risk is perceived as minor, and vice versa [11,35,36].
Despite their potentially devastating impacts, natural hazards are generally perceived as less risky than technological hazards [37]. Because the impacts of natural hazards are perceived as more direct and perceptible than those of technological hazards [15], they can be interpreted as better known, which reduces risk perception.
In their review of risk perception of natural hazards in Europe, Wachinger et al. [38] found that the most important factor in risk perception is the experience of natural hazards. This is equally true for floods [39], heat [40] , drought [41] and storms [42]. Wachinger et al. [38] distinguish between direct and indirect experience. Direct experience refers to being personally affected by a hazard [16,43], while indirect experience involves second-hand sources, such as media reports, expert opinions, social networks, or observing the experiences of others [43,44]. Literature states that as the severity of being affected increases as higher one perceives the risk of that experienced hazard [45]. Research from an Irish case study supports these findings that direct experience of a disaster leads to a higher risk perception [46]. Grover et al. [44] found that indirect experience through expert influence, social influence, and political influence had significant effects on storm risk perception. However, the latter had a negative, while the others had positive effects. Experience as an explanatory variable for risk perception is followed by trust or lack of trust in authorities. Social factors such as age, gender, and income have only a minor effect [38].
Only recently has the field of multi-hazard risk gained significant attention, focusing on the perception of risk from more than one hazard. Studies address compound, interconnected, or cascading risks, but little is known about how individuals perceive these risks. Knuth et al. [47] demonstrated in their study of European emergency survivors that individuals’ flood risk perception was influenced not only by direct flood experience but also by exposure to other hazards such as earthquakes and domestic fires. Furthermore, non-natural hazards may also be connected, as the experience of a public fire increased the fear of terrorist attacks. The authors call this the “cross-over effect”, which occurs when experience with one hazard affects the perception of other hazards. Similarly, Sullivan-Wiley and Short Gianotti [48] found cross-over effects between experience of landslides and flood risk perception in Uganda, and Tanner [49] showed that experience with floods increased landslide risk perception. Additionally, a cross-over effect was observed among residents in a wildfire-prone area of southern California, where experience with either wildfire, floods, or mudslides resulted in increased risk perception of the other two hazards [50]. The conditions under which such cross-over effects occur are not yet fully understood. The existing studies suggest that transfer may be stronger when hazards are perceived as physically or causally linked [47,48,49], they share a spatial context [50], or they reflect perceived vulnerability in general rather than hazard-specific learning, consistent with the availability and representation heuristics described in the psychometric paradigm [11]. Distinguishing between these is important for interpreting cross-over patterns and for designing risk communication for multiple risks.
This study will focus on the most common hydrological and climatological hazards in Leverkusen, primarily river floods and heatwaves. Additionally, heavy rainfall, storms, and droughts are also included, as these also occur in the region. Earthquakes, as geohazards, have occurred in the region, but are rather rare events [51] and are therefore excluded from this study. Wildfires are also known; however, the risk of wildfire in urban areas is very low, so they have also been excluded here.
The Influence of Risk Perception on Preparedness
Preparedness is the knowledge and capacity to “effectively anticipate, respond to and recover from the impacts of likely, imminent or current disasters […] and includes such activities as contingency planning, the stockpiling of equipment and supplies […]” [52].
Risk perception is associated with protection and preparedness towards natural hazards. The protection motivation theory (PMT) [53] is a common framework used to explain behaviour in relation to natural hazards [54]. It connects perception to preparedness and protection, and states that higher perceived threat is one component that can increase protection motivation, which in turn may lead to preparedness and protective behaviour [55]. PMT distinguishes between threat appraisal (e.g., perceived severity and vulnerability) and coping appraisal (e.g., self-efficacy, response efficacy, and perceived costs or barriers), which together shape protection motivation and subsequent behaviour [53,54]. It is especially a beneficial framework to explain flood mitigation behaviour [14]. In this research, primarily threat-related constructs (risk perception, direct and indirect experience) and behavioural outcomes (protection, preparedness, information) are measured, while coping appraisal components are only partially captured. Accordingly, PMT is used as a limited interpretive framework to contextualise the observed associations, rather than to test the full theoretical model.
Risk perception and preparedness share some explanatory variables. Hazard experience influences risk perception and is also a driver for preparedness [14]. Bronfman et al. [16] found a correlation where a severe direct experience of a hazard leads to more preparedness. This is confirmed by Thieken et al. [17] and Netzel et al. [55], who both found that previous experience in flood events results in better preparedness, greater acceptance of warnings and improved knowledge of protection behaviour. However, when disaster experience is very severe, preparedness tends to stagnate. The severity of flood damage has an explanatory power of 10-20% for preparedness measures taken afterwards, with non-affected individuals exhibiting lower risk perception and fewer preparedness actions compared to those affected [54].
Even though risk perception sparks the installation of protection and preparedness measures, its effect is under debate. It is found that risk perception can, if at all, only explain a minor share of preparedness against natural hazards [14,38,56]. However, there is a strong correlation that high risk perception benefits the intention to undertake measures of protection and prepare for a natural hazard [14].
The fact that risk perception does not necessarily lead to preparedness is known as the risk perception paradox. This paradox highlights that even when risks are well perceived, people may still confront them because the perceived benefits of being in a risky situation outweigh the risk itself. Additionally, other risks might be more important to the individual than those caused by the natural hazards [57]. For example, the return period of a hazard, such as a 100-year flood event, is often misinterpreted, leading people to believe that after experiencing one such event, they are safe for the next 99 years [58]. Secondly, the paradox describes that despite perceived risk, people may not feel obliged to act. Personal preparedness can be hindered by trust in existing protection measures or governmental interventions, leading individuals to feel sufficiently safe and thus unmotivated to take further action [59]. Lastly, a key reason for inaction is limited resources. Many individuals lack the financial means, time, or knowledge required to effectively protect and prepare themselves to the impacts of natural hazards [54].
While previous research on the 2021 flood event has primarily focused on rural areas such as the Ahr Valley [17,60,61], urban contexts remain understudied despite their unique risk profiles and adaptation needs. Both Opladen and Schlebusch, districts of Leverkusen, were severely affected by the 2021 flood event [30]. In addition, Opladen faces heightened heat risk due to its dense building structures [62]. This case study thus provides novel insights into adaptation strategies and preparedness in a city confronted by both the 2021 flood and ongoing heat stress, revealing lessons for risk communication tailored to urban communities.
3. Study Area
Leverkusen, situated in western Germany within the state of North Rhine-Westphalia (NRW; Figure 1), has a total population of 170,329 residents distributed across 13 districts [63]. The districts of Opladen and Schlebusch were selected as study areas because they were affected by the 2021 flood and together account for 43,277 inhabitants aged over 15 years, with Opladen being slightly more populous (22,398) than Schlebusch (20,879) (Stadt Leverkusen, 2024). This provides a suitable basis for examining risk perception and preparedness in a flood-affected urban setting.
The city experiences a temperate oceanic climate (Cfb according to Köppen and Geiger), with an average annual temperature of 11.2 °C and an average yearly precipitation of 828.5 mm. July is typically the wettest month, with an average precipitation of 86.8 mm, whereas April is the driest, receiving only 48.7 mm [64]. Leverkusen has a pronounced topographic gradient extending from east to west, characterised by the “Bergisches Land,” part of the Rhenish Slate Mountains in the east, and the Rhine Valley to the west [51]. This topographic variation is also reflected in the city’s hydrological setting, as several rivers flow from the hilly eastern part of Leverkusen toward the Rhine River in the west. Floodplains are present along the Rhine, Wupper, and Dhünn rivers, where elevated groundwater levels and strong flow rates have historically contributed to several flood events [51].
Figure 1.
Land use in Leverkusen and location of selected districts of Opladen and Schlebusch Map created by Ines Könsgen, Data Source: OpenGedata.NRW [65], Stadt Leverkusen [66].
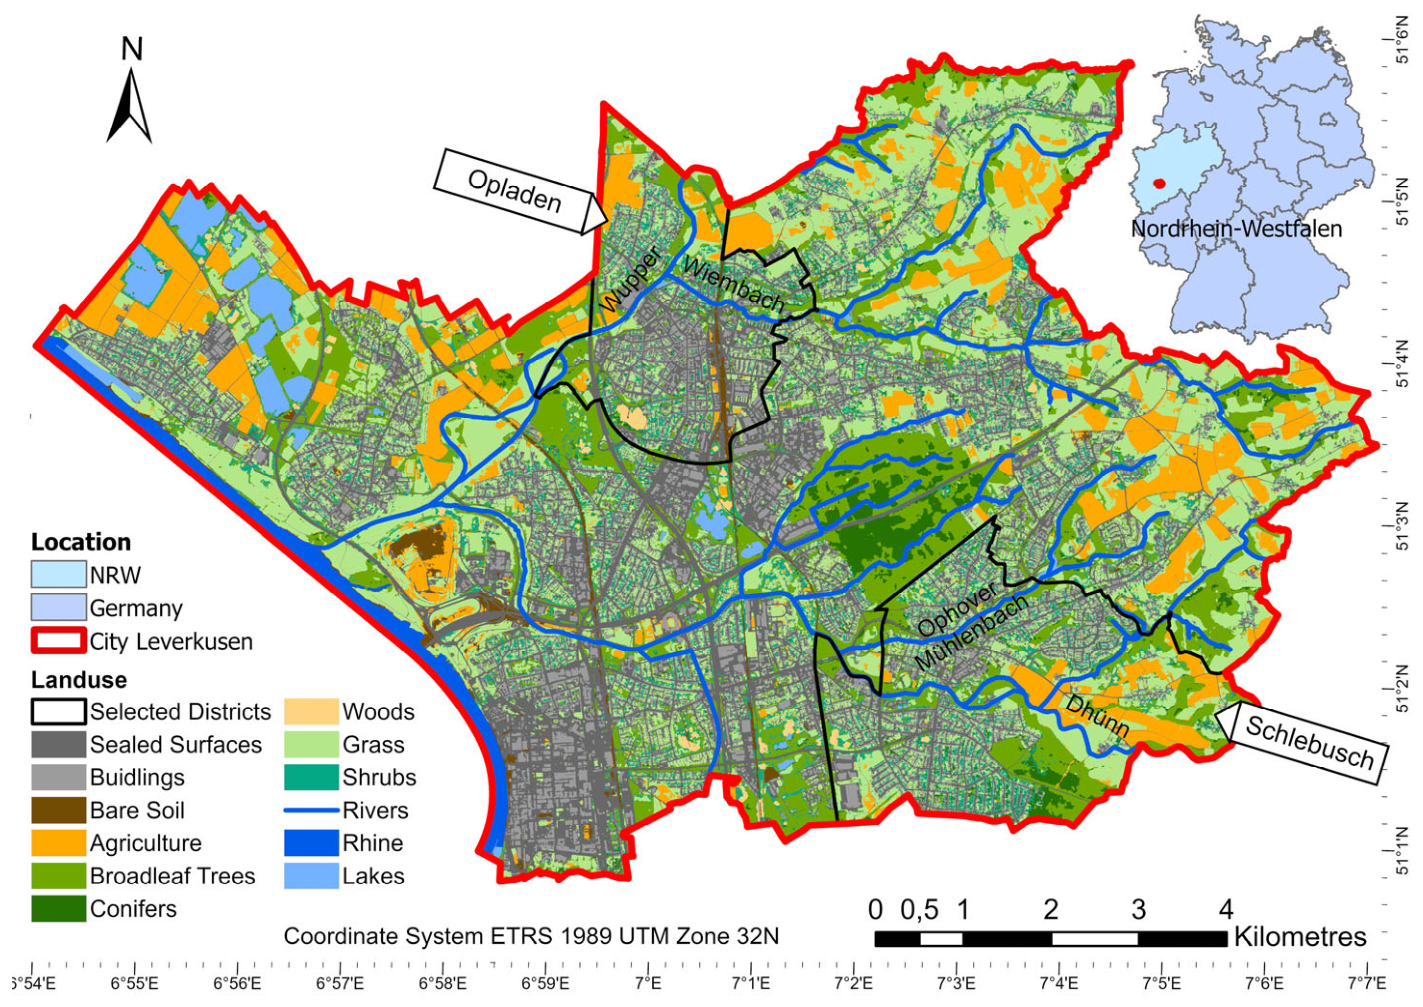
This exposure became particularly evident during the 2021 flood event: Due to extreme, long-lasting, spatially concentrated heavy rainfall over western Europe, the city’s east–west topographic gradient and the characteristics of the small to medium-sized rivers draining towards the Rhine Leverkusen. In the Wupper catchment, maximum daily precipitation increased from 9.6 l/m2 on 12 July 2021 to 151.4 l/m2 on 14 July 2021 [29], generating rapid surface runoff and high peak discharges in the Wupper, Dhünn, Wiembach and Ophover Mühlenbach. Within 24 hours, the water level of the Wupper rose from 0.85 m to 4.55 m, and that of the Dhünn from 0.3 m to 3.45 m [30]. exceeding the capacity of many river sections. As built-up areas constitute the largest share of Leverkusen’s land use (30.94%) (see Figure 1), water masses could not be stored on grasslands but affected the city. Local bottlenecks at bridges and pipings further reduce channel capacity during peak flows and contribute to backwater effects, particularly in the lower reaches of the Wiembach and Dhünn in Opladen and Schlebusch. Figure 2 gives an impression of the water masses during the 2021 flood compared to pictures taken without flooding. Official flood hazard maps for Leverkusen (HQextreme for Wupper, Dhünn, Wiembach and very rare rain events) indicate that high simulated inundation depths overlap with built-up areas of Opladen and Schlebusch (Figure 3). These pictures indicate the devastating impact that the 2021 flood had on the two districts and underline the local relevance of flood experience for the study of preparedness and risk perception. These two districts are thus comparable in terms of their exposure to fluvial and pluvial flooding, while also being similar in population size, making them a suitable case study for analysing risk perception and preparedness in an urban setting with multiple risks.
Besides flooding, heat is also affecting the city. Since 1951, the number of heat days—defined as days with temperatures exceeding 30 °C—has tripled, rising from an average of 4.5 days annually between 1951 and 1960 to 13 days between 2011 and 2020 [67]. Especially densely built-up areas like Opladen are suffering even more from heat and will experience increased adverse effects. The average building footprint ranges here from 40% to over 70%, with building heights commonly exceeding 20 meters. In contrast, the citywide average building footprint is between 20% and 30%, and average building heights range from 6 to 14 meters [68]. Future climate projections indicate an increase in heat days by 100% and tropical nights by 100-200% for the period 2031-2060 compared to 1971-2000 [68].
Taken together, the flood exposure and existing and increasing heat stress in Leverkusen provide a relevant setting for examining how multiple hazards are linked to preparedness and risk perception in the two districts.
4. Materials and Methods
4.1. Methodological Approach
To answer the research questions, a standardised online survey after Porst [69] was conducted to assess the risk perception, affectedness and preparedness of the citizens in Opladen and Schlebusch. Due to the large population, this method was chosen to obtain a large dataset of numerous individuals. Since this study explicitly focuses on the 2021 flood event and its consequences for residents of the affected neighbourhoods, participants were specifically recruited from these areas through various channels. The sample was gathered using a combination of public and online distribution (resulting in a self-selected sample) as well as direct invitations via postcards distributed in specific neighbourhoods. The decision to participate remained entirely voluntary, independent of the undertaken invitation. Therefore, the resulting sample is also considered a self-selection or volunteer sample rather than a probability sample. The survey responses were analysed using SPSS statistical software, and the results were compared with existing studies. Figure 4 visualises the connection between the three objectives, the chosen methodology, and data analysis to answer the overall research question.
4.2. Survey
The survey questions are based on various sources [70,71]. A copy of the questionnaire is provided in the supplementary materials. The questionnaire was created using the web-based platform SoSci-survey, version 3.5.07. After two pretests, minor issues regarding style, grammar, and typographical errors were solved. However, the questionnaire was drastically shortened as it required too much time to complete.
The questionnaire was distributed in the two districts and was accessible from the 1st of September 2024 until the 30th of March 2025. 3,500 postcards with QR-Codes were spread in Opladen by placing them into post boxes. In Schlebusch, QR codes linking to the questionnaire were distributed by personally handing them out to the public and explaining the study and its purpose without mentioning any specific natural hazard. Additionally, the questionnaire was shared in several local Facebook groups. The different distribution methods - personal questionnaires in Schlebusch and QR-Codes in Opladen – were chosen based on the previously mentioned age differences between the two districts, to ensure that individuals with limited technical skills could receive assistance in accessing the questionnaire. There was no natural hazard event during the time of the survey that could have altered the perception or preparedness.
The survey contains a combination of closed, semi-open, and open-ended questions. Closed questions ensure the collection of standardised responses, facilitating comparability and quantitative analysis. Semi-open and open-ended questions allow respondents to elaborate on their answers in their own words, where predefined categories do not fully capture their perspectives, thus enhancing the depth of the collected data [69].
The questionnaire comprises both nominal, ordinal and metric variables. Ordinal questions include, for example, Likert scale questions that assess feelings or opinions. The supplied categories of the answers are labelled only at their extreme ends. All Likert scales were constructed with an even number of points to prevent a neutral midpoint, reducing the tendency of respondents to choose an indifferent position when uncertain [69]. Six-point Likert scales were chosen for questions expressing feelings of affectedness or concern, while four-point scales were used for questions assessing agreement. This design facilitates a nuanced assessment of subjective perceptions within a standardised framework.
4.2.1. Questionnaire Content
The questionnaire was divided into five different sections, as shown in Table 2. Recognising that the feeling of dread is a significant component of risk perception [11,35], participants were specifically asked about their level of concern regarding various natural hazards. Both direct and indirect experiences are known to influence risk perception, preparedness, and protective behaviours, making their assessment crucial. These experiences were evaluated through questions addressing the impacts of natural hazards on personal belongings and one’s neighbourhood. This approach facilitates an assessment of preparedness within the PMT framework, which encompasses a range of measures, including behavioural changes and information-seeking activities. Behaviours are obtained from the website of the Federal Office of Civil Protection and Disaster Assistance (BBK) [72], while protection was collected from the Hochwasser Kompetenz Centrum e.V. (HKC) [73].
Although asking individuals to recall past experiences always carry some risk, the questions were formulated in this way because, to date, no risk perception data prior to the 2021 flood event are available.
4.3. Statistical Analysis
The question of whether the experience of a disruptive natural hazard alters the risk perception, protection and preparedness of participants can be assessed through different statistical analyses. IBM SPSS version 29.0.0.0 was used for data analysis. The statistical tests focused on frequencies, Mann-Whitney U tests, Wilcoxon signed rank test, Spearman correlations, and multivariate logistic regressions. Effect sizes of significant Wilcoxon-signed-rank-tests, Mann-Whitney U tests and Spearman correlations were obtained from Cohen [74], with thresholds of 0.1, 0.3, and 0.5 and indicating small, medium, and strong effects, respectively.
In the beginning, all Likert Scale Variables were tested for normality. Shapiro-Wilk tests indicated significant departures from normality for all variables (all p = < .001). Given the large sample sizes, this is a common occurrence as this test is sensitive to outliers [75]. Hence, normality was additionally assessed using histograms and Q-Q plots. Several variables showed only minor visual deviations from normality, whereas variables related to prior flood concern, knowledge of evacuation routes, and pre-flood knowledge exhibited substantial skewness and clear departures from the normal distribution. To assure reproducibility the decision was made to treat all Likert scales as ordinal scales and reject the assumption of normality.
Various statistical methods were employed to evaluate the link of direct and indirect experiences with natural hazard risk perception. To examine whether direct experience of the 2021 flood or general direct experience of flood, heavy rain, heatwave or storm, as well as indirect experience, is associated with risk perception, frequencies, Wilcoxon-signed-rank tests, Spearman correlation and Mann-Whitney U tests were calculated. Frequency analysis and Wilcoxon-signed-rank tests focused on the responses to the question of perceived risk for multiple natural hazards before and after the 2021 flood (6-Point-Likert-Scales). Participants could state whether their risk perception had changed after the flood. If it had, they rated their pre-flood risk perception on a Likert scale; if not, the pre- and post-flood values were assumed equal. Direct experience of the 2021 flood was obtained using a 6-Point Likert Scale question about being affected by the 2021 flood, as well as a nominal question regarding affectedness of one’s own possessions by different natural hazards in general. Indirect experience of natural hazards was gained through a nominal question, asking whether one’s district had ever been affected by floods, heavy rain, heatwaves or storms. This resulted in several Mann-Whitney U tests. To protect against the inflation of the Type I error rate (false positives) due to multiple testing, p-values were adjusted using the Benjamini-Hochberg (BH) procedure [76] to control the False Discovery Rate (FDR) at α = .05. As questions about risk perception of Wupper and Wiembach were only answered by citizens living in Opladen, and those about the Dhünn and Ophover Mühlenbach were only answered by citizens living in Schlebusch, a variable called “mean flood perception” was created. This variable describes the mean flood perception of citizens in Schlebusch (mean risk perception of Dhünn and Ophover Mühlenbach floods) and Opladen (mean risk perception of Wupper and Wiembach floods). This approach ensures a better comparison with the other natural hazards mentioned, which were asked simultaneously in both districts.
Further statistical analyses were conducted to investigate the influence of direct and indirect experience of floods and heavy rain, as well as risk perception of these hazards on protection, information and preparedness. Only the perception of floods and heavy rain were used here as the questionnaire solely focused on protection and preparedness for flood hazards. To determine whether the 2021 flood event also caused an increase in protection, information and preparedness, we compared the frequencies of installed measures before and after the event, as well as preparedness in terms of behaviour and information value. Additionally, we conducted multivariate logistic regressions to obtain the predictive power of risk perception (6-point Likert scale), direct experience with the floods and heavy rain (dichotomy nominal scale), and indirect experience with floods and heavy rain (dichotomy nominal scale) on installed protection measures, precautionary behaviours, and information. Demographic variables, such as gender, age, education and district were used as control variables. The tests were executed in blocks starting with demographics (Q1, Q20, Q21, Q23 (with aggregated items of no formal education and secondary school certificate)), followed by direct experience (Q5b floods and heavy rain), indirect experience (Q5c floods and heavy rain) and perception (Q2, floods in general and heavy rain) to see how each factor contributes to the explanatory power of the model. . For the final models, a BH correction was applied to the p-values of the primary hypothesis tests to reduce the FDR at α = .05. Results from the intermediate models (Blocks 1–3) were reported unadjusted and used as modelled intermediate steps to contextualise the effects. To exclude the possibility of collinearity Variance Inflation Factors (VIF) and tolerance values were obtained with a standard OLS regression using the same set of predictors that entered the logistic models. VIF > 5 or tolerance < 0.20 would indicate problematic multicollinearity [77].
Table 3 provides an overview of the assumptions tested as well as the questions and statistical tests used to address them. All main hypotheses were formulated a priori on the basis of existing literature. Assumptions 1, 2, and 4 draw on research on the cross-over effect of experience on risk perception [47], while assumptions 5–8 are grounded in Protection Motivation Theory. Assumption 3, concerning indirect experience, is additionally informed by evidence that the geographical scale of exposure (neighbourhood, city, country) influences risk perception [50]. While the core hypotheses are confirmatory, some specific tests (e.g., associations between direct heatwave experience and flood perception) should be regarded as exploratory elaborations of these broader expectations.
5. Results
5.1. Demographic Characteristics of the Sample
Overall, 690 people assessed the survey. After data cleaning, 584 valid questionnaires remained, excluding all individuals who were not from Opladen or Schlebusch and those who did not answer any questions after agreeing to the terms and conditions. This corresponds to 1.35% of the total population in the two districts (1.18% for Opladen, n = 264, and 1.53% for Schlebusch, n = 320), providing sufficient statistical power for the planned analyses while covering a substantial number of participants across the two districts.
The respondents were 54.2% female and 45.8% male (n = 487). No participants stated themselves as “divers”. Compared with the population data for Opladen, Schlebusch, and both districts combined, gender was well represented, with a residual of under 3% [78].
Age was grouped into four categories: 16-24 years, 25-44 years, 45-65 years and 65 years and older, following the categorisation used by the City of Leverkusen [63]. In Schlebusch, the age distribution matched the population well, with maximum residuals of 5.1%. In Opladen, respondents aged 45 to 65 years were somewhat overrepresented, while those aged 25 to 44 years and 16 to 24 years were underrepresented.
Compared with census data for Leverkusen [79], the sample was better educated than the general population. University graduates were overrepresented by 30.97%, while respondents with a secondary school certificate (Hauptschule) and those without formal education were underrepresented by 14.2% and 8.96%, respectively. Intermediate education (Realschule) and extended secondary school (Abitur) were well represented, with residuals below 5%. No district-level data is available for comparison.
5.2. Overview of Affectedness by the 2021 Flood
In total, 76.5% of the participants were affected by the 2021 floods, while 23.5% were not. 50% experienced damage to their property, and 47.8% had damage to their house or flat. A lower share of 22.6% had damage to their motorised vehicle (Figure 5). Main impacts were road closures (71.4%, n = 401), followed by closed supermarkets (45.7%, n = 257), and loss of power supply (39%, n = 219). Only a few suffered from loss of water (10.3%, n = 58) or gas supply (11%, n = 62).
5.3. Risk Perception of Natural Hazards
A Wilcoxon-Signed-Rank test indicates significant differences in risk perception before the 2021 flood and afterwards for all hazards, suggesting an increase of risk perception for all hazards after the 2021 flood. According to Cohen [74] the effects are strong for Wiembach and Wupper floods and medium for all other floods, as well as for heavy rain, drought and storm. Only the effect on heatwaves was small. Full test results are shown in Table A1. Before the 2021 flood, storms and heatwaves were perceived as posing the highest risk on average (M = 3.1 each). After the 2021 flood, heavy rainfall is clearly perceived as posing the highest risk on average (M = 4.3), followed by flooding of the Wupper river (M = 4.1). Moreover, risk perception also increased for all other natural hazards after the 2021 flood, even though these are not directly related to flood hazards (Figure 6).
5.3.1. Influence of Direct Experience on Risk Perception
A Spearman correlation shows that direct flood experience was positively associated with flood-related risk perception, particularly for the Wiembach (r = 0.332, p < 0.001, n = 254), Wupper (r = 0.313, p <.001, n = 254), and flood risk in general (r = 0.318, p <.001, n = 565). Smaller but significant associations were also found for the Ophover Mühlenbach (r = 0.218, p <.001, n = 302), Dhünn (r = 0.273, p <.001, n = 311), and heavy precipitation (r = 0.200, p <.001, n = 566). In contrast, no significant effect was observed for storms, heatwaves, or droughts. Overall, 2021 flood experience was most strongly related to higher risk perception of flood-related hazards.
Mann-Whitney U tests were conducted to compare participants with and without direct experience of floods, heavy rain, heatwaves, and storms on all risk perception variables. BH corrections were applied to control the FDR. The full test results and effect sizes are reported in the Annex (Table A3), and a visual overview of the adjusted significance is shown in Figure 7.
Direct flood experience was associated with significantly higher perceived risk across all flood-related hazards and with heavy rain, while perceived drought risk was lower among those who had experienced floods (non-affected median = 4, affected median = 3). No significant differences were found for heatwaves and storms. The strongest effects were observed for Wiembach (padj = .002, r = .302), Wupper (padj = .003, r = .346), and floods in general (padj = .003, r = .296).
Direct experience with heavy rain was associated with higher risk perception across all hazard types. The effect was strongest for heavy rain itself (padj = .008; r = .274), while the remaining effects were smaller.
Heatwave experience, although less common, was also associated with higher risk perception. Participants with direct heatwave experience perceived heatwaves, storms, and drought as riskier, but no significant differences were found for river floods or heavy rain. The strongest effects were observed for heatwaves (padj = .005; r = .143) and droughts (padj = .019; r = .123).
Storm experience showed the weakest pattern of association and was related only to higher perceived storm risk (padj = .026; r = .103). Overall, direct experience of a specific hazard had the strongest effect on the risk perception of the same hazard.
5.3.2. Influence of Indirect Experience on Risk Perception
To examine whether district-level impacts of natural hazards were associated with individual risk perception, Mann-Whitney U tests were conducted comparing residents who reported impacts in their district with those who did not. Flood, heavy rain, heatwave, and storm impacts at the district level were each tested against the set of risk perception variables. BH corrections were applied to control the FDR. The full test results and effect sizes are reported in the Annex (Table A4) and a visual overview of the adjusted significance is portrayed in Figure 7.
District-level flood impacts were associated with higher perceived risk for all hazards except storms. Effects were small for drought, heatwaves, flood of the Ophover Mühlenbach, Wiembach, and heavy rain, and exceeded r = 0.200 for floods of the Wupper, Dhünn, and floods in general.
District-level heavy rain impacts showed a similar pattern, with associated higher risk perception for drought, heatwaves, heavy rain, storms, floods of the Dhünn and Ophover Mühlenbach, and floods in general. No significant differences were found for the Wiembach and Wupper. The effect was small for most hazards but close to medium for heavy rain (r = 0.273).
District-level heatwave impacts were associated with higher risk perception of storms, heavy rain, droughts, and heatwaves, but no significant differences were found for the river-specific flood hazards. The effect was strongest for heatwaves (padj = .010; r = 0.355) and droughts (padj = .012; r = 0.365), and smaller for heavy rain and storms. While indirect heatwave experience initially showed a nominal effect on the risk perception of floods in general (p = .030), this relationship was no longer statistically significant after applying the BH correction (padj = .029; r = 0.091).
District-level storm impacts were associated with higher risk perception of heatwaves (padj = .022; r = 0.118), and storms (padj = .015; r = 0.167). Storm experience was not associated with any flood-related hazard or heavy rain. The effect size was small for heatwaves and storms. While district storm experience initially showed a significant result on the risk perception of drought (p = .047), this relationship was no longer statistically significant after applying the BH correction (padj = .030; r = 0.083).
5.4. Change in Flood Protection and Preparedness After the 2021 Flood
Preparedness was divided into three variables: information, behaviour, and protection measures. Information values rose after the 2021 flood across all items (Figure 8). This increase is statistically significant for all information variables (all p<.001), with medium effects for all information, except the knowledge about evacuation routes after a Wilcoxon signed rank test (Table A2).
Several behaviours increased after the 2021 flood. 32% of participants started using a warning app, followed by having emergency supplies at home (20.2%), obtaining natural hazard insurance (16.5%), and 14.1% acquiring a battery-operated radio. At least half of the people already followed certain behaviours, such as having insurance, using a warning app, having cash at home, regularly replenishing the household medicine cabinet, or having important phone numbers readily available. An emergency bag was the least common measure and was absent in 85% of cases.
Only a small share of participants installed protection measures. 14.1% (n = 76) had protection measures before the 2021 flood; afterwards, 21.7% (n = 117) installed new protection measures. Among these, 22.2% (n = 26) had already had protection measures before the 2021 flood. The most prominent measure is the installation of backwater valves (Figure 9).
Participants also installed other protection measures. 14 participants mentioned further protection measures before the flood, and 28 mentioned some afterwards (that the questionnaire did not ask for). These included pumps, mobile protections (sandbags and mobile flood walls), structural changes (removal of windows or doors), higher storage and emergency generators.
Identified reasons against flood protection after the 2021 flood are shown in Table 4. Insurance was the most frequently selected reason among the predefined response options. Other reasons stated by the participants included not being affected by the flood, and tenancy. In tenancy situations, many respondents stated that their landlord saw no reason to install protection measures; which prevented the implementation of permanent measures. The questionnaire did not explicitly ask for tenancy.
5.4.1. Influence on Protection
To assess the influence of flood and heavy-rain risk perception, as well as direct and indirect experience, on protection, multivariate logistic regressions were used. A hierarchical logistic regression was fitted to predict whether respondents reported having taken protective measures against flooding.
The final model was statistically significant (Table A5). After BH correction, the only significant predictor for the installation of protection measures is direct flood experience, whereas the apparent effect of district did not remain significant (Table A6). Thus, direct flood experience was associated with a higher likelihood of installing protection measures.
Only block 2 showed a substantial increase in fit (Table A5), while blocks one, three and four did not contribute to more explanatory power.
The test on collinearity revealed that predictors showed VIFs well below the threshold of 5 (maximum VIF = 1.144) and tolerance values <.10 (minimum Tolerance = 0.874), indicating that collinearity was not a concern. As the same predictors were used in the following multivariate logistic regressions, collinearity is unlikely to be problematic in the subsequent models as well.
5.4.2. Influence on Information
To simplify comparisons between the regressions, the ordinal Likert scale variables about information were merged into dichotomous variables (rather informed vs. rather not informed). Hierarchical models were fitted for each variable.
The final hierarchical model was statistically significant for three outcomes: knowledge about natural hazards in one’s neighbourhood, knowledge about flood protection, and knowledge about heavy-rain protection (Table A6). Across these models, direct experience, indirect experience, age, and district were relevant predictors. Risk perception variables did not show significant associations in any of the final models.
Age was associated with higher odds of reporting being informed about natural hazards in one’s neighbourhood by roughly 2%. Age was also positively associated with knowledge about flood protection and heavy-rain protection before BH correction, but these effects did not remain significant after adjustment (Table A6).
Direct flood experience was associated with higher odds of being informed about flood protection. Respondents whose property had previously suffered flood damage were more than twice as likely to report being informed about flood protection. This effect remained significant after BH correction. Respondents with prior flood experience were also more likely to report being informed about heavy-rain protection. This effect was significant before BH correction but did not remain significant after adjustment (Table A6).
Indirect heavy-rain experience was associated with higher odds of being informed about natural hazards in general and about flood and heavy-rain protection. Living in a district that had previously been hit by heavy rain raised the odds of being informed by roughly 70–80%. These effects were significant before BH correction but did not remain significant after adjustment (Table A6).
District of residence showed modest associations with information. Residents of Schlebusch were more likely to report being informed about natural hazards compared with those in Opladen, but these effects did not remain significant after BH correction (Table A6).
The final model for evacuation-route awareness was not significant. None of the predictors showed robust associations with this outcome after BH correction, and the hierarchical blocks did not yield reliable improvements in model fit.
Taken together, the results suggest that experience (both direct and indirect) and age are the key catalysts for acquiring factual information about natural hazards and protective actions, whereas risk perception variables show no robust associations in the final models.
5.4.3. Influence on Preparedness
Hierarchical multivariate logistic regressions were performed for each of the eight preparedness variables.
The final hierarchical models were statistically significant for five outcomes: having an emergency bag, important telephone numbers, emergency supplies, a battery-operated radio, and insurance. Across these models, direct experience and age were predictors. Risk perception and indirect experience variables did not show significant associations in any of the final models (Table A5).
Direct flood experience was associated with higher odds of having an emergency bag, keeping important telephone numbers handy, and having emergency supplies at home. Respondents with direct flood damage were about twice as likely to report having an emergency bag or emergency supplies, and roughly 70% more likely to report keeping important telephone numbers. However, after BH correction these effects did not remain statistically significant (Table A7).
Age was a consistent predictor across several preparedness behaviours. Older respondents seemed more likely to have important telephone numbers readily available, to keep emergency supplies, and to have a battery-operated radio. Each additional year increased the odds of having emergency supplies by about 1%, having phone numbers by 2% and of having a radio by roughly 3%. Age was also associated with higher odds of having insurance, with each year increasing the likelihood by about 1%. After BH correction, only the association with having phone numbers and a battery- operated radio remained significant(Table A7).
Having a university degree was associated with lower odds of having an emergency bag compared to respondents with lower educational levels. This effect was significant before BH correction but did not remain significant after adjustment (Table A7).
District of residence showed a modest association with preparedness. Residents of Schlebusch were more likely to report having important telephone numbers readily available compared with those in Opladen, but this effect did not remain significant after BH correction (Table A7).
The final models for regular replenishment of the household medicine cabinet and keeping cash at home were not significant. None of the predictors showed robust associations with these outcomes, and the hierarchical blocks did not yield reliable improvements in model fit. Despite a significant improvement in fit after adding direct experience of heavy rain in Block 2, the final model for having a warning app installed remained non-significant, too. Direct heavy-rain experience more than doubled the odds of having a warning app (unadjusted), but this effect and the model as a whole did not remain robust once all predictors were included (Table A7).
Taken together, the preparedness models indicate that direct experience and age are the most consistent, but often modest, correlates of preparedness behaviours, whereas indirect experience and risk perception show no robust associations with preparedness once multiple predictors are considered.
6. Discussion
6.1. The Influence of the 2021 Flood on Risk Perception
The results show that, based on self-reported-data, risk perception rose after the 2021 flood for all natural hazards. Not only were flood-related hazards perceived as riskier after the event, but droughts, heatwaves, and storms were also rated as more threatening. This indicates that the 2021 flood influenced risk perception beyond the immediate hazard category.
Considering direct experience, the 2021 flood indicated only a medium to small effect on the perception of flood-related hazards, including flooding of the Dhünn, Ophover Mühlenbach, Wupper, Wiembach, and heavy rainfall. In contrast, no associations for an increase in risk perception were found for droughts, storms, or heatwaves. Direct experience through damage to personal possessions by floods showed a similar pattern, with higher risk perception for all water-related hazards and heavy rainfall. In addition, it was associated with a lower perception of drought risk. The largest number of links with risk perception was observed for direct experience with heavy rainfall, as it was associated with heightened risk perception across all hazard types, both hydrological and meteorological. Direct experience with heatwaves was linked to increased risk perception not only for heat-related hazards, but also for storms. This suggests that flood and heavy rain experience can also be associated with the perception of hazards that imply the opposite condition, namely too little water, while heatwave perception linked the perception of hazards that imply wind. By contrast, direct experience with storms affected only storm risk perception.
These results suggest a crossover effect [47], whereby experience with one hazard is associated with the perceived risk of other, related hazards. Such effects are plausible because many of these hazards are physically and temporally connected. Heavy rainfall can trigger pluvial flooding, and drought-affected soils can increase runoff and flood risk once rainfall occurs [80]. Likewise, heavy rain may follow periods of high temperatures or be accompanied by thunderstorms and strong winds. This exemplifies the interconnected nature of these hazards and their potential to trigger a multi-hazard cascade [80,81]. In this sense, the findings support the view that hazard experience can reshape perceptions across a broader multi-hazard context.
Indirect experience of floods also shows more links with risk perception than direct experience. While direct flood experience was mainly associated with an increased perception of water-related hazards, indirect flood experience was also linked to raised perception of heatwaves. This suggests that district-level exposure may broaden risk perception beyond the immediately experienced event. Our results differ somewhat from Wachinger et al. [38], who found a stronger effect of direct than indirect experience. However, this difference may partly reflect our operationalisation of indirect experience, which was based on district-level affectedness rather than media exposure. In line with Houston et al. [50], the spatial scale of affectedness may shape risk perception and help explain why indirect experience in this study is linked to a wider range of hazards.
A particularly relevant local pattern emerged for Opladen and the Wiembach. Indirect heavy-rain experience did not translate into higher risk perception of flooding of the Wupper or Wiembach, which may reflect the way residents interpret the 2021 event locally. Only residents of Opladen were asked about these river-specific risks, and many appear to associate the flooding more strongly with the Wupper than with the Wiembach. Historically, Opladen has experienced more frequent fluvial floods from the Wupper, leading some residents to believe that the Wupper, rather than the Wiembach, was primarily responsible for the 2021 flooding. This interpretation is also visible in local discussions about flood protection, where some residents attribute the event to upstream floodgate management rather than to the heavy rainfall itself [82,83]. The questionnaire responses reflected this view as well, suggesting that local experiences and narratives may shape how hazard experience is translated into risk perception.
Overall, the results suggest that the 2021 flood acted as a disruptive event that altered risk perception in both directly and indirectly affected populations. Risk perception increased after the event across hazards, and direct exposure was particularly associated with higher perception of water-related hazards. At the same time, direct experience with heavy rain was also linked to the perception of other hazards, showing that the crossover effect extends beyond the immediately experienced event. Although the mechanisms behind this effect are not yet fully understood, the pattern is clearly visible across different hazard types.
Leverkusen is already the second most affected city by heatwaves in North Rhine-Westphalia [67]. Before the 2021 flood, the self-reported risk perception of heatwaves, together with storms, was already relatively high among survey participants, although the mean values still indicated moderate perceived severity. After the 2021 flood, heatwave risk perception rose further, and indirect experience of floods and heavy rain as well as direct heavy-rain experience were both associated with higher heatwave perception. This is important because heatwaves remain a persistent and intensifying threat in Leverkusen, especially in densely built-up areas such as Opladen, where future climate projections indicate substantial increases in heat days and tropical nights by more than 100% for the period 2031-2060 [68]. These findings underscore the importance of incorporating the crossover effect into risk communication strategies by ensuring a balanced presentation of cognitive interconnected hazards. From a practical perspective, this supports the need for integrated risk communication that addresses both flood and heat risks.
6.2. The Influence of the 2021 Flood on Preparedness
Even though protection and preparedness have increased, the increase is relatively small. The number of people who installed protection measures increased by 8% after the 2021 flood. Just over 22% of participants installed protection measures after the flood. In the following, the influence of risk perception, direct experience, indirect experience and the demographic control variables is discussed regarding protection measures, behaviour, and information.
Risk perception had no explanatory power for protection measures. These findings align with previous research showing that risk perception only weakly, if at all, explains the actual installation of protection measures [14,38,56].
Direct experience of floods had a positive effect on the installation of protection measures. The final logistic regression model emphasises that direct experience with floods triples the odds of installing protection measures. Indirect flood experience did not affect the installation of protection measures. Overall, direct experience appears to be the only predictor of actual protection behaviour in this sample, rather than risk perception or indirect experience.
Behavioural change among the participants was relatively small. More than half had already followed six of the eight defined preparedness habits before the flood. After the 2021 flood, the most visible changes concerned warning app use, emergency supplies, insurance, and battery-operated radios, while emergency bags remained uncommon. This indicates that preparedness behaviour changed, but only in a limited way and mainly for specific habits.
Risk perception and indirect experience had no relevance for behaviour. This suggests that perceived risk and affectedness on district level may not contribute to behavioural change.
Direct experience of floods had a medium effect on some preparedness behaviours, especially on storing emergency supplies, keeping an emergency bag, and having important phone numbers at hand. However, after BH correction, the effects are no longer significant. Still, the tendency may have been supported by the nationwide campaign by the Federal Office of Civil Protection and Disaster Assistance at the end of 2022, which aired brief TV ads explaining optimal emergency supply keeping in case of power loss [84]. In contrast, direct experience did not explain behaviours such as having insurance, owning a battery-operated radio, having cash at home or installing a warning app. The results therefore indicate that direct experience mainly motivated specific precautionary habits rather than preparedness behaviour overall.
After the 2021 flood, knowledge generally increased across all information categories, especially regarding natural hazards in the neighbourhood, flood and heavy rain protection measures, and evacuation routes. Interestingly, knowledge of evacuation routes increased despite the absence of officially established routes, as each flood event requires a tailored response. This rise in knowledge on evacuation routes may be attributed to individual planning of potential evacuation paths and self-identification of safe locations during a flood.
However, the overall level of knowledge remained limited, as mean values for flood and heavy-rain protection did not exceed 2.4 on a four-point scale.
Risk perception was not associated with more information.
Direct experience of floods had a medium effect on information about flood and heavy rain protection. After BH correction, the effect remained significant for knowledge about flood protection measures but not for heavy rain protection measures. This pattern suggests that direct affectedness may result in stronger knowledge about how to prepare, but not about natural hazards in general. This is in line with Thieken et al. [17], who also report that direct experience positively influences preparedness in terms of situational knowledge, but contrasts with findings by Kirby-Straker and Straker [85] showing that personal affectedness does not necessarily lead to higher preparedness.
Indirect experience showed a similar pattern. Indirect heavy rain experience was associated with higher knowledge about natural hazards, and flood and heavy rain protection with a medium effect, while indirect experience of floods did not predict any knowledge successfully. Even so, the effects did not remain significant after BH correction; they indicate that indirect experience mainly contributes to knowledge rather than to behavioural change or protection.
The mentioned lack of knowledge is especially critical as it is stated as a reason for not implementing protection measures. Despite the severe impact of the 2021 flood and the high share of affected participants, only few respondents had installed protection measures, followed the defined preparedness behaviours consistently, or sufficiently informed themselves. The main reasons given for not preparing were tenancy, not being personally affected, and living above the ground floor, which aligns with Netzel et al. (2021) who also found that people living on higher levels or tenants are less likely to install protection measures. Additional reasons included existing insurance, uncertainty about effective measures, lack of knowledge and the belief that such an event would not happen again. Closely to PMT [53], tenancy, uncertainty about effective measures, and lack of knowledge reflect low self-efficacy, as respondents feel they have limited control or capability to implement protective actions. Uncertainty and lack of knowledge also indicate low response efficacy, because people are unsure whether available measures would effectively reduce their risk. Not being personally affected and living on a higher floor correspond to low threat appraisal, as respondents perceive their own vulnerability and the severity of potential flood impacts as low. Together, these factors suggest that even when general risk perception is elevated, low self-efficacy, low response efficacy and low threat appraisal can jointly constrain protection motivation.
In addition to experience and risk perception, demographic control variables showed systematic but small associations with protection and preparedness. Age was the most consistent predictor: older respondents were more likely to report being informed about natural hazards in their neighbourhood; they were also more likely to keep important phone numbers, maintain emergency supplies, and own a battery-operated radio. Before BH correction, age was additionally associated with knowledge about flood and heavy rain protection, as well as with having insurance and having emergency supplies. This may reflect a natural process, as older individuals typically have more experience and knowledge about protection and natural hazards, whereas younger people may be less concerned if they do not yet own property. Keeping phone numbers and a battery-operated radio at home is also more common among older than younger people.
Place of residence also showed modest associations. Before BH correction, residents of Schlebusch were more likely to report having taken protection measures and to have important phone numbers readily available compared with those in Opladen. They were also more likely to feel informed about natural hazards. However, none of these district effects remained significant after BH correction. This suggests that local contextual factors may contribute to protection and preparedness, but their influence is weaker than that of direct flood experience and age.
Education showed a more limited pattern. Having a university degree was associated with lower odds of having an emergency bag compared to respondents with lower educational levels, but this effect did not remain significant after BH correction. Surprisingly, education had no significant effect on knowledge.
Taken together, demographic factors appear to structure preparedness in the background: age consistently supports some information and preparedness behaviours, whereas district and education show more limited and non-robust associations after correction for multiple testing.
All these statements exemplify the risk perception paradox: people have a relatively good perception of the risks from floods and heavy rain, yet there is limited adaptation towards these hazards. The findings therefore point to a need for more targeted education and information on effective flood and heavy-rain preparedness and protection, including tailored communication for tenants and landlords.
The presented results show that risk perception, direct and indirect experience have different effects on different preparedness and protection activities. While direct experience is associated with protection and knowledge, risk perception is not. Knowledge about protection and natural hazards in general is mainly induced by indirect heavy rain experience and slightly by direct experience but not by risk perception. This is supported by Mondino et al. [39] and underlines the importance of considering all three aspects, risk perception, direct and indirect experience, while preparing risk communication and engagement strategies.
6.3. Limitations and Future Research
Some limitations that should be considered when interpreting the findings. First, the sample relied on self-selection rather than probability sampling, limiting generalisability. The survey covered both districts but represents only a small share of the local population and was not fully representative in terms of age and education. Respondents aged 45 to 65 years and participants with a university degree were overrepresented, while younger age groups and lower education levels were underrepresented – a common bias in risk perception studies even though education is often found to have only limited influence on risk perception [86]. Nevertheless, it limits the extent to which the findings can be generalised beyond the study sample. Although questionnaire distribution methods varied, identical content and no significant differences between Schlebusch and Opladen suggest limited influence. The 76.5% reporting flood impacts appears high but reflects self-estimated severity and includes all values above 1 on the Likert scale. The distinction between direct personal experience (32.7% reporting affected possessions by floods) and indirect experience (83.9% reporting district impacts by floods), yields nuance that is broadly consistent with fewer experiencing direct personal damage. The 2,013 approved emergency aid applications in Leverkusen [87] likely underestimate the share of residents experiencing at least some form of impact, as they capture mainly more severe, financially relevant damage presumably often submitted by homeowners rather than tenants. As Opladen and Schlebusch were the districts severely affected by the 2021 flood, a relevant share of the applications likely relates to buildings in these two districts (n = 9,048), supporting the interpretation that a noteworthy proportion experienced at least some form of flood impact. At the same time, it remains plausible that stronger flood impact may have driven interest in participating.
Second, the study relies on retrospective self-report and is therefore subject to memory and response bias. Risk perception and knowledge were assessed retrospectively and potentially reflect reconstructed rather than observed perceptions. Still, national trends support the plausibility of increased risk perception after the flood, with around 60% of respondents fearing an increase in natural catastrophes and 63% fearing weather extremes such as drought, heatwaves, or heavy rain in 2022 —values roughly 20 percentage points higher than before the flood [88]. Although these reflect general environmental fears rather than local hazard-specific risk, they align with observed before/after changes, though recall bias may still influence results.
Self-reported changes in protection and preparedness are also subject to social desirability and reconstruction biases. The even-numbered Likert scales were used to avoid neutral responses [69], but this may also have constrained respondent expression.
Third, some constructs were only partially captured. Although the discussion is informed by PMT, not all components were measured comprehensively. Coping-appraisal and threat-appraisal elements were not fully covered, limiting full theoretical testing. Moreover, covariates like income, homeowner/renter status, and building type were excluded, though potentially influencing protective measures.
Indirect experience was operationalised via district-level affectedness: a broad proxy potentially covering neighbourhood damage observations, media exposure, and communication with neighbours/officials rather than a precise measure of vicarious experience. This ambiguity should be taken into account when interpreting the results.
Finally, the logistic regression models showed only limited explanatory power. Although some effects were statistically significant, the Nagelkerke values were low, and classification performance was dominated by the larger group (e.g., respondents without protection).
These methodological constraints also point to opportunities for future research. More representative samples would help verify whether the observed patterns hold in the broader population, particularly across age, education, income, and housing-status groups. Longitudinal or panel designs would help to reduce memory bias and to better capture how risk perception develops over time after a disruptive event.
Future studies should also measure indirect experience more precisely, for example by distinguishing media exposure, neighbourhood observation, interpersonal communication, and official warning channels. In addition, a more complete measurement of Protection Motivation Theory would allow the relative roles of threat appraisal, coping appraisal, and motivational processes to be tested more rigorously. The cross-over effect observed here also warrants further investigation, especially regarding the conditions under which experience with one hazardous event alters the risk perception of other events. Finally, future research should examine more explicitly how perception, experience, and preparedness interact in contexts with multiple hazards, including the decision to install protection measures.
7. Conclusions
The study examined how the 2021 European flood is linked to public’s risk perception and preparedness in the districts of Opladen and Schlebusch (Leverkusen), both of which experienced severe impacts. The findings suggest that residents retrospectively report higher risk perception after the disruptive 2021 flood event, and that perception is shaped differently by direct and indirect experiences.
Results indicate an overall increase in retrospectively reported risk perception and a pronounced crossover effect: experience with one hazard is associated with higher perceived risk of other hazards as well. Direct experience is mainly linked to risk perception of related hazards, whereas indirect experience corresponds to broader awareness across multiple risks.
After the 2021 flood, preparedness -such as the installation of protection measures, knowledge of natural hazards and flood protection and behavioural change- increased moderately. However, risk perception showed no robust effect on protection, preparedness and information in the final models, aligning with previous studies.
Direct flood experience was linked to a higher likelihood of installing flood protection and to greater knowledge about flood protection, but its links with behavioural change and knowledge about heavy rain protection were weaker and mostly non-robust after correction for multiple testing. Indirect experience was associated with increased knowledge about natural hazards and flood and heavy rain protection before correction, but these effects did not remain significant in the final models.
In the long run, limited individual mitigation activities owing to reliance on insurance may result in increasing aggregate losses, potentially challenging the sustainability of insurance schemes through higher premiums or reduced coverage.
These insights highlight the necessity of considering perception, direct and indirect affectedness and their distinct impacts on preparedness when designing targeted communication and awareness strategies. Understanding the interconnectedness of risk perception across multiple hazards is crucial for effective timing and tailoring communication content and awareness-raising strategies that effectively empower citizens to prepare for natural hazards, thereby contributing to a more disaster-resilient society. This has direct practical relevance for professionals engaged in risk management and disaster preparedness.
Given that natural hazards such as heavy rain, heatwaves, droughts, and floods are expected to intensify and increase in frequency with climate change, developing integrated communication strategies that address multiple risks simultaneously will become increasingly important – not only for Leverkusen but for other municipalities with similar hazard profiles. The Leverkusen case highlights that the post-disaster communication window should be used to address multiple risks collectively.
However, the findings also emphasise research gaps. Further studies are needed to explain the conditions under which experience with one hazardous event coincides with changes in risk perception of other events. While the cross-over effect is present, its underlying mechanisms remain insufficiently understood. Additionally, protection, preparedness and knowledge are affected differently by experience and perception. Future research should explore in more detail how perception and direct and indirect experiences of natural hazards shape protection and preparedness in the population.
Supplementary Materials
The following supporting information can be downloaded at the website of this paper posted on Preprints.org, Document S1: Complete Questionnaire.
Author Contributions
Ines Könsgen: Conceptualisation, Methodology, Formal Analysis, Investigation, Writing - Original Draft, Visualisation, project administration; Boris Braun: Resources, Writing - Review & Editing, Supervision; Udo Nehren: Writing - Review & Editing, Supervision, Funding acquisition.
Funding
This study was supported by the Federal Ministry of Research, Technology and Space under the funding line Innovative Hochschule [grant number 031HS208]. The funding source had no role in the study design, collection, analysis and interpretation of data, writing of the report and decision to submit the article for publication.
Institutional Review Board Statement
The study was conducted in accordance with the Declaration of Helsinki, and declares no conflicts with central ethical principles, neither tackles this research security-related content, and it does not pose any security-related risks to cooperation partners. Furthermore, the research does not conflict with legal regulations. Hence, approval by the Institutional Ethics Committee of TH Köln – University of Applied Sciences is not applicable.
Informed Consent Statement
Informed consent was obtained from all subjects involved in the study.
Data Availability Statement
Data is not publicly available as the questionnaire ensures confidential data treatment and no data distribution to third parties according to the German general data protection regulation (Datenschutzgrundverordnung – DSGVO).
Acknowledgments
We thank all participants who responded to the questionnaire. During the preparation of this work, the author(s) used ChatGPT to improve the quality of picture “d” in Figure 2. This picture was screenshotted out of a video, taken by the authors at the time of the 2021 flood. However, the screenshot was of poor quality. AI-generated improvement was made to provide a higher-quality picture. No alterations have been undertaken to the picture content. After using this tool/service, the authors reviewed and edited the content as needed and take full responsibility for the content of the published article.
Conflicts of Interest
Ines Könsgen reports financial support was provided by Federal Ministry of Research, Technology and Space. If there are other authors, they declare that they have no known competing financial interests or personal relationships that could have appeared to influence the work reported in this paper. However, the funders had no role in the design of the study; in the collection, analyses, or interpretation of data; in the writing of the manuscript; or in the decision to publish the results.
Abbreviations
The following abbreviations are used in this manuscript:
| BBK | Bundesamt für Bevölkerungsschutz und Katastrophenhilfe (Federal Office of Civil Protection and Disaster Assistance) |
| BH | Benjamini-Hochberg |
| DWD | Deutscher Wetterdienst (German Weather Service) |
| FDR | False discovery rate |
| GDV | Gesamtverband der Versicherer |
| IPCC | Intergovernmental Panel on Climate Change |
| NRW | North-Rhine Westphalia |
| PMT | Protection Motivation Theory |
| UNDRR | United Nations Office of Disaster Risk Reduction |
| WHO | World Health Organisation |
Appendix
Wilcoxon Signed-Rank Tests

Table A1.
Wilcoxon-signed-rank test risk perception before and after 2021.
| Risk perception of | Median before | Median after | z1 | p | r |
|---|---|---|---|---|---|
| Heatwave | 3 | 4 | -7.234 | <.001 | 0.213 |
| Dhünn flood | 2 | 4 | -11.671 | <.001 | 0.463 |
| Ophover Mühlenbach flood | 2 | 3 | -10.567 | <.001 | 0.424 |
| Wiembach flood | 2 | 4 | -11.568 | <.001 | 0.506 |
| Wupper flood | 2 | 4 | -11.878 | <.001 | 0.519 |
| Floods in general | 2 | 4 | -15.974 | <.001 | 0.495 |
| Heavy rain | 3 | 5 | -12.009 | <.001 | 0.469 |
| Storm | 3 | 4 | -10.871 | <.001 | 0.353 |
| Drought | 3 | 3 | -10.041 | <.001 | 0.320 |
1z = z-value, p = significance, r = effect size.
Table A2.
Wilcoxon-signed-rank test information before and after 2021.
| Information about | Median before | Median after | z1 | p | r |
|---|---|---|---|---|---|
| Natural hazards | 3 | 3 | -10.081 | <.001 | 0.435 |
| Flood protection | 2 | 2 | -9.210 | <.001 | 0.398 |
| Heavy rain protection | 2 | 2 | -9.833 | <.001 | 0.424 |
| Evacuation routes | 1 | 1 | -5.277 | <.001 | 0.228 |
1z = z-value, p = significance, r = effect size.
Mann-Whitney U Tests
Table A3.
Mann-Whitney U test results of direct experience represented by possession affectedness by different hazards (Q5b) and risk perception (Q2).
Table A3.
Mann-Whitney U test results of direct experience represented by possession affectedness by different hazards (Q5b) and risk perception (Q2).
| Q2: Risk perception of | Yes Mean |
No Mean |
u1 | z | p | padj | r |
|---|---|---|---|---|---|---|---|
| Q5b: My possessions were affected by floods | |||||||
| Dhünn | MD = 5 N = 91 |
MD = 4 N = 223 |
6871.5 | -4.594 | <.001* | .001* | 0.259 |
| Ophover Mühlenbach | MD = 4 N = 90 |
MD = 3 N = 215 |
7291.5 | -3.448 | <.001* | .001* | 0.197 |
| Wiembach | MD = 5 N = 96 |
MD = 3 N = 160 |
4956.5 | -4.832 | <.001* | .002* | 0.302 |
| Wupper | MD = 5 N = 96 |
MD = 4 N = 160 |
4583.0 | -5.529 | <.001* | .003* | 0.346 |
| Floods in general | MD = 5 N = 187 |
MD = 4 N = 383 |
23026.0 | -7.075 | <.001* | .003* | 0.296 |
| Heavy rain | MD = 5 N = 187 |
MD = 4 N = 384 |
29093.5 | -3.795 | <.001* | .004* | 0.159 |
| Storm | MD = 4 N = 187 |
MD = 4 N = 384 |
35032.0 | -0.483 | .629 | .043 | - |
| Heatwave | MD = 4 N = 186 |
MD = 3.5 N = 384 |
35439.5 | -0.150 | .880 | .049 | - |
| Drought | MD = 3 N = 187 |
MD = 4 N = 382 |
31034.5 | -2.582 | .010* | .024* | 0.108 |
| Q5b: My possessions were affected by heavy rain | |||||||
| Dhünn | MD = 5 N = 112 |
MD = 4 N = 202 |
8783.0 | -3.360 | <.001* | .006* | 0.141 |
| Ophover Mühlenbach | MD = 4 N = 110 |
MD = 3 N = 195 |
8987.5 | -2.387 | .017* | .028* | 0.135 |
| Wiembach | MD = 5 N = 79 |
MD = 4 N = 177 |
5424.5 | -2.914 | .004* | .021* | 0.182 |
| Wupper | MD = 5 N = 79 |
MD = 4 N = 177 |
5620.5 | -2.565 | .010* | .025* | 0.160 |
| Floods in general | MD = 5 N = 191 |
MD = 4 N = 379 |
28654.0 | -4.151 | <.001* | .007* | 0.174 |
| Heavy rain | MD = 5 N = 191 |
MD = 4 N = 380 |
24455.0 | -6.560 | <.001* | .008* | 0.274 |
| Storm | MD = 4 N = 191 |
MD = 4 N = 380 |
29744.5 | -3.605 | <.001* | .008* | 0.151 |
| Heatwave | MD = 4 N = 190 |
MD = 3 N = 380 |
29842.0 | -3.434 | <.001* | .006* | 0.144 |
| Drought | MD = 4 N = 191 |
MD = 3 N = 378 |
31916.0 | -2.294 | .022* | .028* | 0.094 |
| Q5b: My possessions were affected by heatwaves | |||||||
| Dhünn | MD = 4 N = 13 |
MD = 4 N = 301 |
1795.0 | -0.516 | .606 | .042 | - |
| Ophover Mühlenbach | MD = 3. N = 13 |
MD = 3 N = 292 |
1731.5 | -0.544 | .587 | .042 | - |
| Wiembach | MD = 4 N = 12 |
MD = 4 N = 244 |
1294.5 | -0.689 | .491 | .040 | - |
| Wupper | MD = 4.5 N = 12 |
MD = 4.5 N = 244 |
1298.0 | -0.679 | .497 | .040 | - |
| Floods in general | MD = 4 N = 25 |
MD = 4 N = 545 |
6209.0 | -0.766 | .444 | .039 | - |
| Heavy rain | MD = 5 N = 25 |
MD = 5 N = 546 |
5517.5 | -1.671 | .095 | .031 | - |
| Storm | MD = 4 N = 25 |
MD = 4 N = 546 |
4942.5 |
-2.391 | .017* | .027* | 0.100 |
| Heatwave | MD = 4 N = 25 |
MD = 3 N = 545 |
4097.0 | -3.430 | <.001* | .005* | 0.143 |
| Drought | MD = 5 N = 251.411 |
MD = 3 N = 544 |
4427.0 | -2.999 | .003* | .019* | 0.123 |
| Q5b: My possessions were affected by storms | |||||||
| Dhünn | MD = 4 N = 72 |
MD = 4 N = 242 |
8016.5 | -1.053 | .292 | .037 | - |
| Ophover Mühlenbach | MD = 3 N = 72 |
MD = 4 N = 233 |
7960.0 | -0.665 | .506 | .041 | - |
| Wiembach | MD = 4 N = 47 |
MD = 4 N = 209 |
4846.5 | -0.144 | .885 | .050 | - |
| Wupper | MD = 5 N = 47 |
MD = 4 N = 209 |
4553.5 | -0.799 | .424 | .038 | - |
| Floods in general | MD = 4 N = 119 |
MD = 4 N = 451 |
26212.0 | -0.398 | .691 | .045 | - |
| Heavy rain | MD = 5 N = 119 |
MD = 5 N = 452 |
25059.5 | -1.181 | .238 | .035 | - |
| Storm | MD = 4 N = 119.337 |
MD = 4 N = 452 |
23043.5 | -2.464 | .014* | .026* | 0.103 |
| Heatwave | MD = 4 N = 119 |
MD = 4 N = 451 |
26558.5 | -0.176 | .861 | .049 | - |
| Drought | MD = 4 N = 119 |
MD = 3 N = 450 |
26154.0 | -0.395 | .692 | .046 | - |
1 u = Value of Mann-Whitney U test, z = z-value, p = significance, padj = significant results after the Benjamini-Hochberg correction to reduce false discovery rates, r = effect size, MD = median. * The test is significant after Benjamini-Hochberg correction.
Table A4.
Mann-Whitney U test results of indirect experience represented by district affectedness by different hazards (Q5c) and risk perception (Q2).
Table A4.
Mann-Whitney U test results of indirect experience represented by district affectedness by different hazards (Q5c) and risk perception (Q2).
| Q2: Risk perception of | Yes Mean |
No Mean |
u1 | z | p | padj | r |
|---|---|---|---|---|---|---|---|
| Q5c: My district was affected by floods | |||||||
| Dhünn | MD = 4 N = 252 |
MD = 3 N = 62 |
5153.5 | -4.250 | <.001* | .009* | 0.240 |
| Ophover Mühlenbach | MD = 4 N = 243 |
MD = 3 N = 62 |
5888.0 | -2.697 | .007* | .022* | 0.154 |
| Wiembach | MD = 4 N = 227 |
MD = 3 N = 29 |
2292.5 | -2.707 | .005* | .023* | 0.169 |
| Wupper | MD = 4 N = 227 |
MD = 3 N = 29 |
2092.5 | -3.270 | <.001* | .017* | 0.204 |
| Floods in general | MD = 4 N = 479 |
MD = 3 N = 91 |
14565.0 | -5.129 | <.001* | .010* | 0.215 |
| Heavy rain | MD = 5 N = 479 |
MD = 4 N = 92 |
18264.0 | -2 682 | .003* | .024* | 0.112 |
| Storm | MD = 4 N = 479 |
MD = 4 N = 92 |
21436.5 | -0.422 | .559 | .044 | - |
| Heatwave | MD = 4 N = 479 |
MD = 3 N = 91 |
17264.5 | -3.199 | .001* | .016* | 0.134 |
| Drought | MD = 4 N = 479 |
MD = 3 N = 92 |
17526.0 | -3.107 | .002* | .018* | 0.130 |
| Q5c: My district was affected by heavy rain | |||||||
| Dhünn | MD = 4 N = 223 |
MD = 4 N = 91 |
8031.5 | -2.967 | .003* | .020* | 0.167 |
| Ophover Mühlenbach | MD = 4 N = 216 |
MD = 3 N = 89 |
7913.5 | -2.465 | .014* | .026* | 0.141 |
| Wiembach | MD = 4 N = 182 |
MD = 4 N = 74 |
5863.0 | -1.650 | .099 | .031 | - |
| Wupper | MD = 5 N = 182 |
MD = 4 N = 74 |
6083.5 | -1.240 | .215 | .035 | - |
| Floods in general | MD = 4 N = 405 |
MD = 4 N = 165 |
27818.0 | -3.205 | .001* | .017* | 0.134* |
| Heavy rain | MD = 5 N = 405 |
MD = 4 N = 166 |
22273.5 | -6.532 | <.001* | .013* | 0.273 |
| Storm | MD = 4 N = 405 |
MD = 3 N = 166 |
27033.5 | -3.766 | <.001* | .014* | 0.158 |
| Heatwave | MD = 4 N = 405 |
MD = 3 N = 165 |
26416.5 | -3.991 | <.001* | .013* | 0.167 |
| Drought | MD = 4 N = 403 |
MD = 3 N = 166 |
26026.5 | -4.229 | <.001* | .015* | 0.177 |
| Q5c: My district was affected by heatwaves | |||||||
| Dhünn | MD = 5 N= 59 |
MD = 4 N = 255 |
6603.5 | -1.497 | .134 | .033 | - |
| Ophover Mühlenbach | MD = 4 N = 58 |
MD = 3 N = 247 |
6609.5 | -0.930 | .352 | .038 | - |
| Wiembach | MD = 4 N = 78 |
MD = 4 N = 178 |
6316.0 | -1.168 | .243 | .036 | - |
| Wupper | MD = 5 N = 78 |
MD = 4 N = 178 |
6182.0 | -1.427 | .154 | .033 | - |
| Floods in general | MD = 4 N = 137 |
MD = 4 N = 433 |
26092.0 | -2.170 | .030* | .029 | 0.091 |
| Heavy rain | MD = 5 N = 137 |
MD = 4 N = 434 |
24801.0 | -3.018 | .003* | .019* | 0.126 |
| Storm | MD = 4 N = 137 |
MD = 4 N = 434 |
23777.0 | -3.622 | <.001* | .011* | 0.152 |
| Heatwave | MD = 5 N = 137 |
MD = 3 N = 433 |
15669.0 | -8.471 | <.001* | .010* | 0.355 |
| Drought | MD = 5 N = 137 |
MD = 3 N = 432 |
15221.5 | -8.705 | <.001* | .012* | 0.365 |
| Q5c: My district was affected by storms | |||||||
| Dhünn | MD = 4 N = 114 |
MD = 4 N = 200 |
111290 | -0.359 | .729 | .047 | - |
| Ophover Mühlenbach | MD = 3 N = 110 |
MD = 4 N = 195 |
9818.0 | -1.246 | .213 | .034 | - |
| Wiembach | MD = 4 N = 87 |
MD = 4 N = 169 |
7128.5 | -0.404 | .686 | .044 | - |
| Wupper | MD = 5 N = 87 |
MD = 4 N = 169 |
7181.0 | -0.311 | .756 | .048 | - |
| Floods in general | MD = 4 N = 201 |
MD = 4 N = 369 |
36389.0 | -0.378 | .705 | .047 | - |
| Heavy rain | MD = 5 N = 201 |
MD = 4 N = 370 |
34305.5 | -1.577 | .115 | .032 | - |
| Storm | MD = 4 N = 201 |
MD = 4 N = 370 |
29858.0 | -3.987 | <.001* | .015* | 0.167 |
| Heatwave | MD = 4 N = 201 |
MD = 3 N = 369 |
31877.0 | -2.820 | .005* | .022* | 0.118 |
| Drought | MD = 4 N = 201 |
MD = 3 N = 368 |
33315.0 | -1.988 | .047* | .030 | 0.083 |
1 u = Value of Mann-Whitney U test, z = z-value, p = significance, padj = significant results after the Benjamini-Hochberg correction to reduce false discovery rates, r = effect size, MD = median. * The test is significant.
Multivariate Logistic Regression Models
Table A5.
Hierarchical multivariate models for protection, information and preparedness.
| Block | Δχ2(df, p) | Nagelkerke R2 | Hosmer-Lemeshow X2 (df, p) |
% correct |
|---|---|---|---|---|
| Installation of protection | ||||
| 1 | 7.158 (6, .307) | .024 | 10.891 (8, .208) | 75.9 |
| 2 | 34.222 (2, < .001) | .134 | 2.017 (8, .980) | 76.6 |
| 3 | 1.463 (2, .481) | .139 | 6.974 (8, .539) | 76.8 |
| 4 | 43.104 (12, < .001) | .140 | 9.746 (8, .283) | 76.8 |
| Information about natural hazards | ||||
| 1 | 15.450 (6, .017) | .047 | 4.084 (8, .849) | 75.8 |
| 2 | 7.282 (2, .026) | .069 | 8.832 (8, .357) | 75.6 |
| 3 | 7.689 (2, .021) | .092 | 2.814 (8, .045) | 76.7 |
| 4 | 38.375 (12, < .001) | .115 | 9.551 ( 8, .298) | 77.5 |
| Information flood protection | ||||
| 1 | 6.086 (6, .414) | .017 | 12.182 (8, .143) | 55.5 |
| 2 | 15.447 (2, <.001) | .059 | 13.371 (8, .100) | 56.4 |
| 3 | 5.607 (2, .061) | .073 | 8.139 (8, .420) | 59.1 |
| 4 | 31.793 (12, .001) | .086 | 8.128 (8, .421) | 59.9 |
| Information heavy rain protection | ||||
| 1 | 9.592 (6, .143) | .026 | 6.865 (8, .551) | 57.1 |
| 2 | 10.396 (2, .006) | .054 | 6.377 (8, .605) | 57.5 |
| 3 | 4.871 (2, .088) | .067 | 4.734 (8, .786) | 59.6 |
| 4 | 27.014 (12, .008) | .073 | 13.928 (8, .084) | 59.4 |
| Information evacuation routes | ||||
| 1 | 9.601 (6, .142) | .035 | 8.454 (8, .390) | 85.6 |
| 2 | 5.813 (2, .055) | .056 | 12.423 (8, .133) | 85.6 |
| 3 | 0. 019 (2, .990) | .056 | 6.420 (8, .600) | 85.6 |
| 4 | 18.658 (12, .097) | .068 | 13.324 (8, .101) | 85.6 |
| Preparedness: having emergency bag | ||||
| 1 | 9.182 (6, .164) | .033 | 1.483 (8, .993) | 84.0 |
| 2 | 13.209 (2, .001) | .080 | 5.529 (8, .700) | 84.0 |
| 3 | 0.230 (2, .892) | .081 | 4.047 (8, .853) | 84.0 |
| 4 | 25.789 (12, .011) | .092 | 5.963 (8, .651) | 84.0 |
| Preparedness: having important phone numbers | ||||
| 1 | 22.753 (6, <.001) | .065 | 18.754 (8, .016) | 63.3 |
| 2 | 10.711 (2, .005) | .094 | 11.917 (8, .155) | 64.6 |
| 3 | 2.335 (2, .311) | .100 | 13.546 (8, .094) | 65.7 |
| 4 | 39.527 (12, <.001) | .110 | 9.902 (8, .272) | 67.0 |
| Preparedness: replenishment of medicine cabinet | ||||
| 1 | 5.312 (6, .504) | .015 | 3.948 (8, .862) | 62.4 |
| 2 | 5.772 (2, .056) | .032 | 2.800 (8, .946) | 62.2 |
| 3 | 1.135 (2, .567) | .035 | 5.487 (8, .704) | 62.9 |
| 4 | 16.554 (12, .167) | .048 | 3.955 (8, .861) | 63.3 |
| Preparedness: storing emergency supplies | ||||
| 1 | 9.283 (6, .158) | .027 | 9.806 (8, .279) | 66.4 |
| 2 | 21.007 (2, <.001) | .087 | 6.092 (8, .637) | 66.6 |
| 3 | 0.895 (2, .639) | .089 | 4.956 (8, .762) | 66.0 |
| 4 | 34.270 (12, <.001) | .098 | 11.208 (8, .190) | 65.3 |
| Preparedness: owning battery-operated radio | ||||
| 1 | 24.256 (6, <.001) | .069 | 8.371 (8, .398) | 62.3 |
| 2 | 9.809 (2, .007) | .096 | 3.895 (8, .866) | 62.0 |
| 3 | 2.521 (2, .284) | .102 | 6.762 (8, .563) | 64.0 |
| 4 | 36.740 (12, <.001) | .103 | 8.527 (8, .384) | 64.6 |
| Preparedness: cash at home | ||||
| 1 | 11.902 (6, .064) | .034 | 9.124 (8, .332) | 59.1 |
| 2 | 3.766 (2, .152) | .045 | 11.418 (8, .179) | 58.9 |
| 3 | 2.313 (2, .315) | .052 | 2.069 (8, .979) | 60.0 |
| 4 | 18.371 (12, .105) | .053 | 6.425 (8, .600) | 60.2 |
| Preparedness: warning application installed | ||||
| 1 | 2.666 (6, .849) | .010 | 10.763 (8, .216) | 84.8 |
| 2 | 10.766 (2, .005) | .049 | 2.046 (8, .980) | 84.8 |
| 3 | 0.620 (2, .733) | .052 | 10.689 (8, .220) | 84.8 |
| 4 | 19.242 (12, .083) | .070 | 3.323 (8, .912) | 84.8 |
| Preparedness: having insurance | ||||
| 1 | 19.410 (6, .004) | .061 | 14.063 (8, .080) | 70.3 |
| 2 | 4.424 (2, .190) | .074 | 11.311 (8, .185) | 69.6 |
| 3 | 1.383 (2, .501) | .078 | 10.080 (8, .259) | 69.8 |
| 4 | 29.134 (12, .004) | .090 | 5.047 (8, .753) | 70.1 |
Table A6.
Predictors of protection and information in final multivariate regression block.
| Predictor | B1 | SE | Wald χ2 | p | padj | Exp(B) | 95% CI für OR | ||
|---|---|---|---|---|---|---|---|---|---|
| Lower | Upper | ||||||||
| Protection | |||||||||
| Demographics | District | .647 | .251 | 6.633 | .010* | .008 | 1.909 | 1.167 | 3.122 |
| Age | -.001 | .008 | .011 | .915 | .050 | .999 | .984 | 1.015 | |
| Sex | -.041 | .240 | .029 | .864 | .042 | .960 | .599 | 1.537 | |
| Education Middle school | -.095 | .549 | .030 | .863 | .038 | .910 | .310 | 2.670 | |
| Education High school | .327 | .505 | .418 | .518 | .021 | 1.386 | .515 | 3.732 | |
| Education University | .181 | .491 | .136 | .712 | .029 | 1.198 | .458 | 3.139 | |
| Direct e. | Flood | 1.145 | .270 | 17.918 | <.001* | .004* | 3.141 | 1.849 | 5.337 |
| Heavy rain | .399 | .278 | 2.065 | .151 | .013 | 1.490 | .865 | 2.568 | |
| Indirect e. | Flood | -.172 | .387 | .197 | .657 | .025 | .842 | .394 | 1.799 |
| Heavy rain | .365 | .337 | 1.176 | .278 | .017 | 1.441 | .745 | 2.789 | |
| Perception | Flood in general | .015 | .106 | .019 | .889 | .046 | 1.015 | .825 | 1.249 |
| Heavy rain | .040 | .119 | .111 | .740 | .033 | 1.041 | .823 | 1.315 | |
| Information natural hazards | |||||||||
| Demo-graphics | District | -.474 | .239 | 3.934 | .047* | .010 | .623 | .390 | .994 |
| Age | .021 | .007 | 9.371 | .002* | .002* | 1.021 | 1.008 | 1.035 | |
| Sex | .126 | .229 | .306 | .580 | .034 | 1.135 | .725 | 1.776 | |
| Education Middle school | .463 | .481 | .926 | .336 | .027 | 1.589 | .619 | 4.077 | |
| Education High school | .508 | .442 | 1.323 | .250 | .021 | 1.663 | .699 | 3.953 | |
| Education University | .445 | .428 | 1.083 | .298 | .025 | 1.561 | .675 | 3.611 | |
| Direct e. | Flood | .379 | .270 | 1.969 | .161 | .019 | 1.461 | .860 | 2.480 |
| Heavy rain | .051 | .279 | .034 | .854 | .043 | 1.053 | .609 | 1.818 | |
| Indirect e. | Flood | -.192 | .325 | .350 | .554 | .032 | .825 | .437 | 1.559 |
| Heavy rain | .587 | .280 | 4.379 | .036* | .007 | 1.798 | 1.038 | 3.115 | |
| Perception | Flood in general | .098 | .094 | 1.092 | .296 | .024 | 1.103 | .918 | 1.325 |
| Heavy rain | .176 | .103 | 2.889 | .089 | .015 | 1.192 | .973 | 1.460 | |
| Information flood protection | |||||||||
| Demographics | District | .348 | .198 | 3.083 | .079 | .011 | 1.416 | .960 | 2.087 |
| Age | .014 | .006 | 5.477 | .019* | .003 | 1.014 | 1.002 | 1.027 | |
| Sex | -.020 | .193 | .011 | .916 | .047 | .980 | .671 | 1.431 | |
| Education Middle school | .002 | .422 | .000 | .997 | .050 | 1.002 | .438 | 2.292 | |
| Education High school | .005 | .393 | .000 | .991 | .049 | 1.005 | .465 | 2.168 | |
| Education University | .070 | .381 | .034 | .854 | .044 | 1.072 | .508 | 2.264 | |
| Direct e. | Flood | .830 | .225 | 13.586 | <.001* | .001* | 2.293 | 1.475 | 3.564 |
| Heavy rain | -.064 | .229 | .078 | .780 | .041 | .938 | .599 | 1.468 | |
| Indirect e. | Flood | .242 | .289 | .701 | .402 | .030 | 1.274 | .723 | 2.246 |
| Heavy rain | .583 | .251 | 5.378 | .020* | .004 | 1.791 | 1.094 | 2.931 | |
| Perception | Flood in general | -.016 | .082 | .037 | .847 | .042 | .984 | .838 | 1.157 |
| Heavy rain | -.159 | .093 | 2.919 | .088 | .014 | .853 | .711 | 1.024 | |
| Information heavy rain protection | |||||||||
| Demographics | District | .291 | .196 | 2.209 | .137 | .018 | 1.337 | .912 | 1.962 |
| Age | .013 | .006 | 4.834 | .028* | .006 | 1.013 | 1.001 | 1.025 | |
| Sex | -.217 | .192 | 1.283 | .257 | .022 | .805 | .552 | 1.172 | |
| Education Middle school | -.186 | .425 | .191 | .662 | .038 | .831 | .361 | 1.909 | |
| Education High school | -.344 | .394 | .761 | .383 | .028 | .709 | .328 | 1.534 | |
| Education University | -.330 | .383 | .743 | .389 | .029 | .719 | .339 | 1.523 | |
| Direct e. | Flood | .499 | .223 | 5.011 | .025* | .005 | 1.647 | 1.064 | 2.549 |
| Heavy rain | .222 | .227 | .960 | .327 | .026 | 1.249 | .801 | 1.948 | |
| Indirect e. | Flood | .166 | .283 | .346 | .556 | .033 | 1.181 | .678 | 2.056 |
| Heavy rain | .507 | .247 | 4.198 | .040* | .008 | 1.660 | 1.022 | 2.694 | |
| Perception | Flood in general | -.104 | .081 | 1.640 | .200 | .020 | .901 | .768 | 1.057 |
| Heavy rain | .007 | .092 | .005 | .941 | .048 | 1.007 | .841 | 1.205 | |
| Information evacuation routes | |||||||||
| Demographics | District | .300 | .280 | 1.148 | .284 | .023 | 1.350 | .780 | 2.337 |
| Age | -.001 | .008 | .024 | .876 | .046 | .999 | .982 | 1.015 | |
| Sex | -.096 | .272 | .124 | .725 | .040 | .909 | .534 | 1.548 | |
| Education Middle school | .226 | .515 | .193 | .660 | .036 | 1.254 | .457 | 3.438 | |
| Education High school | -.914 | .531 | 2.959 | .085 | .013 | .401 | .142 | 1.136 | |
| Education University | -.358 | .483 | .549 | .459 | .031 | .699 | .271 | 1.801 | |
| Direct e. | Flood | .628 | .310 | 4.112 | .043* | .009 | 1.874 | 1.021 | 3.440 |
| Heavy rain | .159 | .321 | .244 | .621 | .035 | 1.172 | .625 | 2.197 | |
| Indirect e. | Flood | .152 | .430 | .125 | .724 | .039 | 1.164 | .502 | 2.702 |
| Heavy rain | -.065 | .362 | .032 | .858 | .045 | .937 | .461 | 1.907 | |
| Perception | Flood in general | -.187 | .118 | 2.513 | .113 | .016 | .830 | .659 | 1.045 |
| Heavy rain | .212 | .136 | 2.426 | .119 | .017 | 1.236 | .947 | 1.614 | |
1B = regression coefficient, SE = standard error, p = significance, padj = adjusted significance after Benjamini-Hochberg correction, Exp(B) = Odd’s ratio.
Table A7.
Predictors of preparedness in final multivariate regression block.
| Predictor | B | SE | Wald χ2 | p | padj | Exp(B) | 95% CI für OR | ||
|---|---|---|---|---|---|---|---|---|---|
| Lower | Upper | ||||||||
| Having an emergency bag | |||||||||
| Demographics | District | -.102 | .271 | .143 | .706 | .036 | .903 | .530 | 1.536 |
| Age | -.002 | .008 | .075 | .784 | .040 | .998 | .982 | 1.014 | |
| Sex | .375 | .271 | 1.906 | .167 | .014 | 1.454 | .854 | 2.475 | |
| Education Middle school | -.198 | .495 | .161 | .689 | .034 | .820 | .311 | 2.163 | |
| Education High school | -.788 | .485 | 2.640 | .104 | .011 | .455 | .176 | 1.176 | |
| Education University | -.959 | .471 | 4.146 | .042 | .006 | .383 | .152 | .965 | |
| Direct e. | Flood | .757 | .295 | 6.593 | .010 | .003 | 2.131 | 1.196 | 3.798 |
| Heavy rain | .081 | .318 | .065 | .799 | .041 | 1.084 | .582 | 2.020 | |
| Indirect e. | Flood | .102 | .439 | .054 | .816 | .043 | 1.108 | .469 | 2.618 |
| Heavy rain | -.017 | .345 | .002 | .961 | .047 | .983 | .500 | 1.935 | |
| Perception | Flood in general | .193 | .123 | 2.456 | .117 | .013 | 1.213 | .953 | 1.544 |
| Heavy rain | -.031 | .132 | .055 | .815 | .042 | .970 | .749 | 1.256 | |
| Having important phone numbers | |||||||||
| Demo-graphics | District | .529 | .207 | 6.492 | .011 | .004 | 1.696 | 1.130 | 2.547 |
| Age | .022 | .006 | 11.869 | <.001 | .001* | 1.022 | 1.010 | 1.035 | |
| Sex | -.073 | .204 | .127 | .721 | .037 | .930 | .623 | 1.387 | |
| Education Middle school | -.110 | .466 | .056 | .814 | .042 | .896 | .360 | 2.232 | |
| Education High school | -.349 | .429 | .663 | .416 | .022 | .705 | .304 | 1.635 | |
| Education University | -.122 | .419 | .085 | .771 | .039 | .885 | .389 | 2.012 | |
| Direct e. | Flood | .494 | .239 | 4.281 | .039 | .005 | 1.639 | 1.026 | 2.616 |
| Heavy rain | .138 | .242 | .326 | .568 | .029 | 1.148 | .714 | 1.846 | |
| Indirect e. | Flood | .105 | .294 | .128 | .720 | .036 | 1.111 | .624 | 1.978 |
| Heavy rain | .229 | .257 | .792 | .374 | .019 | 1.257 | .759 | 2.082 | |
| Perception | Flood in general | .012 | .085 | .020 | .888 | .045 | 1.012 | .857 | 1.195 |
| Heavy rain | .148 | .096 | 2.405 | .121 | .013 | 1.160 | .962 | 1.399 | |
| Replenishing medicine cabinet | |||||||||
| Demographics | District | .101 | .203 | .248 | .619 | .031 | 1.106 | .743 | 1.646 |
| Age | .003 | .006 | .232 | .630 | .031 | 1.003 | .991 | 1.015 | |
| Sex | .384 | .199 | 3.726 | .054 | .006 | 1.468 | .994 | 2.166 | |
| Education Middle school | -.199 | .438 | .207 | .650 | .033 | .819 | .347 | 1.934 | |
| Education High school | -.047 | .409 | .013 | .908 | .046 | .954 | .428 | 2.128 | |
| Education University | -.121 | .397 | .093 | .760 | .038 | .886 | .407 | 1.928 | |
| Direct e. | Flood | .235 | .231 | 1.035 | .309 | .017 | 1.265 | .804 | 1.992 |
| Heavy rain | .183 | .237 | .595 | .440 | .024 | 1.200 | .755 | 1.909 | |
| Indirect e. | Flood | .006 | .291 | .000 | .982 | .049 | 1.006 | .569 | 1.780 |
| Heavy rain | .162 | .251 | .415 | .520 | .027 | 1.176 | .719 | 1.923 | |
| Perception | Flood in general | .142 | .084 | 2.899 | .089 | .009 | 1.153 | .979 | 1.358 |
| Heavy rain | .011 | .093 | .014 | .906 | .046 | 1.011 | .843 | 1.213 | |
| Storing emergency supplies | |||||||||
| Demographics | District | -.139 | .213 | .430 | .512 | .027 | .870 | .574 | 1.320 |
| Age | .014 | .007 | 4.822 | .028 | .005 | 1.014 | 1.002 | 1.027 | |
| Sex | .027 | .208 | .017 | .897 | .045 | 1.027 | .684 | 1.543 | |
| Education Middle school | -.011 | .492 | .001 | .982 | .049 | .989 | .377 | 2.593 | |
| Education High school | -.394 | .451 | .765 | .382 | .020 | .674 | .279 | 1.631 | |
| Education University | -.503 | .440 | 1.310 | .252 | .016 | .605 | .255 | 1.431 | |
| Direct e. | Flood | .653 | .249 | 6.888 | .009 | .003 | 1.921 | 1.180 | 3.129 |
| Heavy rain | .439 | .248 | 3.129 | .077 | .009 | 1.551 | .954 | 2.524 | |
| Indirect e. | Flood | .020 | .293 | .005 | .945 | .047 | 1.021 | .574 | 1.813 |
| Heavy rain | .174 | .260 | .447 | .504 | .026 | 1.190 | .714 | 1.983 | |
| Perception | Flood in general | .143 | .085 | 2.800 | .094 | .010 | 1.153 | .976 | 1.363 |
| Heavy rain | -.040 | .098 | .168 | .682 | .034 | .961 | .793 | 1.164 | |
| Having a battery-operated radio | |||||||||
| Demographics | District | -.177 | .203 | .762 | .383 | .021 | .837 | .562 | 1.247 |
| Age | .032 | .007 | 21.842 | <.001 | .001* | 1.032 | 1.019 | 1.046 | |
| Sex | .065 | .200 | .105 | .746 | .038 | 1.067 | .721 | 1.580 | |
| Education Middle school | .297 | .445 | .446 | .504 | .026 | 1.346 | .563 | 3.221 | |
| Education High school | .098 | .415 | .056 | .812 | .041 | 1.103 | .489 | 2.489 | |
| Education University | .297 | .403 | .544 | .461 | .024 | 1.346 | .611 | 2.967 | |
| Direct e. | Flood | .188 | .232 | .655 | .418 | .023 | 1.207 | .765 | 1.903 |
| Heavy rain | .424 | .236 | 3.220 | .073 | .008 | 1.528 | .962 | 2.429 | |
| Indirect e. | Flood | .146 | .304 | .232 | .630 | .032 | 1.158 | .638 | 2.098 |
| Heavy rain | .318 | .262 | 1.473 | .225 | .015 | 1.374 | .822 | 2.297 | |
| Perception | Flood in general | -.015 | .085 | .031 | .861 | .044 | .985 | .833 | 1.165 |
| Heavy rain | .037 | .096 | .152 | .696 | .035 | 1.038 | .860 | 1.253 | |
| Having cash at home | |||||||||
| Demographics | District | .381 | .200 | 3.607 | .058 | .007 | 1.463 | .988 | 2.167 |
| Age | .017 | .006 | 7.284 | .007 | .002 | 1.017 | 1.005 | 1.029 | |
| Sex | -.040 | .198 | .041 | .839 | .043 | .961 | .652 | 1.415 | |
| Education Middle school | -.295 | .439 | .452 | .501 | .025 | .744 | .315 | 1.760 | |
| Education High school | -.187 | .413 | .206 | .650 | .033 | .829 | .369 | 1.862 | |
| Education University | -.006 | .400 | .000 | .989 | .050 | .994 | .454 | 2.176 | |
| Direct e. | Flood | .363 | .228 | 2.524 | .112 | .012 | 1.437 | .919 | 2.249 |
| Heavy rain | -.066 | .232 | .081 | .776 | .039 | .936 | .594 | 1.475 | |
| Indirect e. | Flood | .465 | .292 | 2.540 | .111 | .011 | 1.592 | .899 | 2.822 |
| Heavy rain | -.098 | .251 | .153 | .696 | .035 | .907 | .555 | 1.481 | |
| Perception | Flood in general | -.052 | .084 | .385 | .535 | .028 | .949 | .806 | 1.118 |
| Heavy rain | .026 | .094 | .077 | .782 | .040 | 1.026 | .854 | 1.233 | |
| Installation of warning application | |||||||||
| Demographics | District | -.254 | .278 | .831 | .362 | .019 | .776 | .450 | 1.339 |
| Age | -.004 | .008 | .292 | .589 | .030 | .996 | .979 | 1.012 | |
| Sex | -.273 | .273 | .995 | .318 | .018 | .761 | .445 | 1.301 | |
| Education Middle school | .322 | .549 | .344 | .558 | .029 | 1.380 | .471 | 4.046 | |
| Education High school | .400 | .511 | .613 | .434 | .023 | 1.492 | .548 | 4.059 | |
| Education University | .509 | .500 | 1.037 | .309 | .017 | 1.664 | .624 | 4.436 | |
| Direct e. | Flood | -.150 | .318 | .223 | .637 | .032 | .861 | .462 | 1.605 |
| Heavy rain | .926 | .365 | 6.450 | .011 | .004 | 2.525 | 1.235 | 5.160 | |
| Indirect e. | Flood | -.360 | .412 | .763 | .382 | .021 | .698 | .311 | 1.564 |
| Heavy rain | -.011 | .322 | .001 | .973 | .048 | .989 | .526 | 1.860 | |
| Perception | Flood in general | .114 | .112 | 1.031 | .310 | .018 | 1.121 | .900 | 1.396 |
| Heavy rain | .142 | .121 | 1.370 | .242 | .016 | 1.152 | .909 | 1.461 | |
| Having insurance | |||||||||
| Demographics | District | .321 | .222 | 2.084 | .149 | .014 | 1.379 | .892 | 2.132 |
| Age | .021 | .007 | 8.626 | .003 | .002 | 1.021 | 1.007 | 1.036 | |
| Sex | -.010 | .218 | .002 | .963 | .048 | .990 | .646 | 1.516 | |
| Education Middle school | -.413 | .468 | .778 | .378 | .020 | .662 | .264 | 1.656 | |
| Education High school | .264 | .447 | .348 | .555 | .028 | 1.302 | .542 | 3.127 | |
| Education University | .579 | .438 | 1.743 | .187 | .015 | 1.784 | .755 | 4.212 | |
| Direct e. | Flood | .488 | .253 | 3.710 | .054 | .007 | 1.628 | .991 | 2.674 |
| Heavy rain | .144 | .260 | .306 | .580 | .030 | 1.155 | .694 | 1.923 | |
| Indirect e. | Flood | -.286 | .336 | .727 | .394 | .022 | .751 | .389 | 1.451 |
| Heavy rain | .048 | .277 | .030 | .861 | .044 | 1.050 | .610 | 1.807 | |
| Perception | Flood in general | -.168 | .094 | 3.189 | .074 | .008 | .846 | .704 | 1.016 |
| Heavy rain | .174 | .105 | 2.755 | .097 | .010 | 1.190 | .969 | 1.463 | |
1B = regression coefficient, SE = standard error, p = significance, padj = adjusted significance after Benjamini-Hochberg correction, Exp(B) = Odd’s ratio.
References
- Intergovernmental Panel on Climate Change (IPCC). “Climate Change 2021: The Physical Science Basis.: Contribution of Working Group I to the Sixth Assessment Report of the Intergovernmental Panel on Climate Change,” Cambridge, United Kingdom, New York, USA, doi: 10.1017/9781009157896. 2021. Available online: https://report.ipcc.ch/ar6/wg1/IPCC_AR6_WGI_FullReport.pdf. [CrossRef]
- Sturm, K.; et al. , Hochwasser in Mitteleuropa seit 1500 und ihre Beziehung zur atmosphärischen Zirkulation. Petermanns Geogr. Mitteilungen 2001, vol. 145(no. 6), 14–23. Available online: https://opus.bibliothek.uni-augsburg.de/opus4/frontdoor/deliver/index/docId/50074/file/50074.pdf.
- Rudolf, B.; Rapp, J. Das Jahrhunderthochwasser der Elbe: Synoptische Wetterentwicklung und klimatologische Aspekte; Offenbach, 2003. [Google Scholar]
- Bronstert, et al. Hochwasser und Sturzfluten an Flüssen in Deutschland. In Klimawandel in Deutschland; Springer Spektrum: Berlin, Heidelberg, 2023; pp. 109–130. Available online: https://link.springer.com/chapter/10.1007/978-3-662-66696-8_10.
- Little, S.; Priestley, M. D. K.; Catto, J. L. Future increased risk from extratropical windstorms in northern Europe. Nat. Commun. early access. [CrossRef] [PubMed]
- Eingrüber, N.; Korres, W.; Schneider, K. Microclimatic field measurements to support microclimatological modelling with ENVI-met for an urban study area in Cologne. Adv. Sci. Res. 2022, vol. 19, 81–90. [Google Scholar] [CrossRef]
- Thober, S.; Marx, A.; Boeing, F. Auswirkungen der globalen Erwärmung auf hydrologische und agrarische Dürren und Hochwasser in Deutschland: Ergebnisse aus dem Projekt HOKLIM: Hochaufgelöste Klimaindikatoren bei einer Erderwärmung von 1.5 Grad; Helmholtz-Zentrum für Umweltforschung (UFZ): Leipzig, 2018; Available online: https://www.ufz.de/export/data/2/207531_HOKLIM_Brosch%C3%BCre_final.pdf.
- Tradowsky, J. S.; et al. Attribution of the heavy rainfall events leading to severe flooding in Western Europe during July 2021. Clim. Change 2023, vol. 176(no. 7), 1–38. [Google Scholar] [CrossRef]
- Bosseler, B.; Salomon, M.; Schlüter, M.; Rubinato, M. Living with Urban Flooding: A Continuous Learning Process for Local Municipalities and Lessons Learnt from the 2021 Events in Germany. Water 2021, vol. 13(no. 19), 2769. [Google Scholar] [CrossRef]
- Barendrecht, M. H.; et al. Exploring drought-to-flood interactions and dynamics: A global case review. Wiley Interdiscip. Rev. Water 2024, vol. 11(no. 4), Art. no. e1726. [Google Scholar] [CrossRef]
- Slovic, P. The Perception of Risk. Science 1987, no. 236, 280–285. Available online: https://www.researchgate.net/profile/Paul-Slovic/publication/325954197_The_perception_of_risk/links/5d4dc321a6fdcc370a89c8d8/The-perception-of-risk.pdf?origin=publication_detail. [CrossRef] [PubMed]
- Fischhoff; Bostrom, A.; Quadrel, M. Jacobs. Risk Perception and Communication. Annu. Rev. Public Health 1993, no. 14, 183–203. [Google Scholar] [CrossRef] [PubMed]
- Renn, O. Risk Governance: Coping with Uncertainty in a Complex World, Earthscan Risk in Society Series, 1st ed.; Earthscan: London, 2008. [Google Scholar]
- Bubeck, P.; Botzen, W. J. W.; Aerts, J. C. J. H. A review of risk perceptions and other factors that influence flood mitigation behavior. Risk analysis: an official publication of the Society for Risk Analysis. [CrossRef] [PubMed]
- Wachinger, G.; Renn, O. “Risk Perception and Natural Hazards,” DIALOGIK Non-Profit Institute for Communication and Cooperative Research. 2010. Available online: http://caphaz-net.org/outcomes-results/CapHaz-NetWP3Risk-Perception.pdf.
- Bronfman, N. C.; Cisternas, P. C.; Repetto, P. B.; Castañeda, J. V.; Guic, E. Understanding the Relationship Between Direct Experience and Risk Perception of Natural Hazards. Risk analysis: an official publication of the Society for Risk Analysis. early access. [CrossRef] [PubMed]
- Thieken, H.; Bubeck, P.; Heidenreich, A.; von Keyserlingk, J.; Dillenardt, L.; Otto, A. Performance of the flood warning system in Germany in July 2021 – insights from affected residents. Nat. Hazards Earth Syst. Sci. 2023, vol. 23(no. 2), 973–990. [Google Scholar] [CrossRef]
- Deutscher Wetterdienst (DWD). Stadtklima - Städtische Wärmeinsel. Available online: https://www.dwd.de/DE/forschung/klima_umwelt/klimawirk/stadtpl/projekt_warmeinseln/projekt_waermeinseln_node.html (accessed on 13 May 2024).
- Robine, J.-M.; et al. Death toll exceeded 70,000 in Europe during the summer of 2003. Comptes Rendus. Biol. Early access. [CrossRef] [PubMed]
- Daanen, H.; Jonkhoff, W.; Bosch, P.; ten Broeke, H. The effect of global warming and urban heat islands on mortality, morbidity and productivity in The Netherlands. In International Conference of Environmental Ergononomics; Cotter, J. D., Lucas, S., Mundel, T., Eds.; Queenstown: New Zeeland, 2013; pp. 16–19. [Google Scholar]
- Breakwell, G. M. The Psychology of Risk,, 2nd ed; Cambridge University Press, 2014. [Google Scholar]
- World Health Organization (WHO). Heatwaves. Available online: https://www.who.int/health-topics/heatwaves#tab=tab_1 (accessed on 25 November 2025).
- Heck, J.; Schwenner, L. So ist Deutschland auf die Folgen des Klimawandels vorbereitet. Quarks. 13 Jul 2023. Available online: https://www.quarks.de/umwelt/klimawandel/anpassung-deutschland-klimafolgen/ (accessed on 13 January 2026).
- Gesamtverband der Versicherer (GDV). Wo Unwetter in Deutschland die meisten Schäden angerichtet haben. Available online: https://www.gdv.de/gdv/statistik/datenservice-zum-naturgefahrenreport/sachversicherung-sturm-hagel/wo-unwetter-in-deutschland-die-meisten-schaeden-angerichtet-haben--139200 (accessed on 13 January 2026).
- Zölch, T.; Maderspacher, J.; Wamsler, C.; Pauleit, S. Using green infrastructure for urban climate-proofing: An evaluation of heat mitigation measures at the micro-scale. Urban For. Urban Green. 2016, vol. 20, 305–316. [Google Scholar] [CrossRef]
- Knutzen, F.; et al. Impacts on and damage to European forests from the 2018–2022 heat and drought events. Nat. Hazards Earth Syst. Sci. 2025, vol. 25(no. 1), 77–117. [Google Scholar] [CrossRef]
- Centre for Research on the Epidemiology of Disasters (CRED). “EM-DAT - The international disaster database.”. Available online: https://www.emdat.be/ (accessed on 10 November 2025).
- MunichRe. “Hurricanes, cold waves, tornadoes: Weather disasters in USA dominate natural disaster losses in 2021 | Munich Re.”. Available online: https://www.munichre.com/en/company/media-relations/media-information-and-corporate-news/media-information/2022/natural-disaster-losses-2021.html (accessed on 11 August 2025).
- Junghänel, T.; et al. “Hydro-klimatologische Einordnung der Stark- und Dauerniederschläge in Teilen Deutschlands im Zusammenhang mit dem Tiefdruckgebiet „Bernd” vom 12. bis 19. Juli 2021,” Jul. 2021. Available online: https://www.dwd.de/DE/leistungen/besondereereignisse/niederschlag/20210721_bericht_starkniederschlaege_tief_bernd.pdf?__blob=publicationFile&v=6 (accessed on 26 September 2023).
- Feuerwehr Leverkusen. Jahresbericht 2021: Feuerwehr und Rettungsdienst; 2022.
- Leverkusen, Stadt. Sanierung von Flutschäden. Available online: https://www.leverkusen.de/stadt-entwickeln/planen-bauen/flutschaeden-sanierung (accessed on 23 August 2025).
- Goerlandt, F.; Li, J.; Reniers, G. The Landscape of Risk Perception Research: A Scientometric Analysis. Sustainability 2021, vol. 13(no. 23), 1–26. [Google Scholar] [CrossRef]
- Millet, B.; Carter, A. P.; Broad, K.; Cairo, A.; Evans, S. D.; Majumdar, S. J. Hurricane Risk Communication: Visualization and Behavioral Science Concepts. Weather Clim. Soc. 2020, vol. 12(no. 2), 193–211. [Google Scholar] [CrossRef]
- Slovic, P. (Ed.) The Perception of Risk, 1st ed.; Taylor & Francis: USA, 2000. [Google Scholar]
- Fischhoff, B.; Slovic, P.; Lichtenstein, S.; Read, S.; Combs, B. How safe is safe enough? A psychometric study of attitudes towards technological risks and benefits. Policy Sci. 1978, vol. 9(no. 2), 127–152. Available online: https://link.springer.com/article/10.1007/BF00143739. [CrossRef]
- Renn, O. Risk Perception and Risk Management: A Review: Part 2: Lessons for Risk Management. Risk Abstr. 1990, vol. 7(no. 2), 1–9. [Google Scholar]
- Plapp, T.; Werner, U. Understanding risk perception from natural hazards: Examples from Germany. In RISK21 - Coping with Risks due to Natural Hazards in the 21st Century; Ammann, W. J., Dannenmann, S., Vulliet, L., Eds.; CRC Press, 2006; pp. 101–108. [Google Scholar]
- Wachinger, G.; Renn, O.; Begg, C.; Kuhlicke, C. The risk perception paradox-implications for governance and communication of natural hazards. Risk analysis: an official publication of the Society for Risk Analysis. early access. [CrossRef] [PubMed]
- Mondino, E.; Scolobig, A.; Borga, M.; Di Baldassarre, G. The Role of Experience and Different Sources of Knowledge in Shaping Flood Risk Awareness. Water 2020, vol. 12(no. 8), 2130. Available online: https://www.mdpi.com/2073-4441/12/8/2130. [CrossRef]
- Howe, P. D.; Marlon, J. R.; Wang, X.; Leiserowitz, A. Public perceptions of the health risks of extreme heat across US states, counties, and neighborhoods. Proc. Natl. Acad. Sci. USA. [CrossRef] [PubMed]
- Alberts, A.; Özerol, G. “Effects of drought experience on farmer decision-making and sustainable water management practices in Salland, the Netherlands,”. Sustain Water Resour. Manag. 2025, vol. 11(no. 4), 69. Available online: https://link.springer.com/article/10.1007/s40899-025-01242-3. [CrossRef]
- Wong-Parodi, G.; Garfin, D. R. Hurricane adaptation behaviors in Texas and Florida: exploring the roles of negative personal experience and subjective attribution to climate change. Environ. Res. Lett. [CrossRef] [PubMed]
- Viscusi, W. K.; Zeckhauser, R. J. The relative weights of direct and indirect experiences in the formation of environmental risk beliefs. Risk analysis: an official publication of the Society for Risk Analysis. early access. [CrossRef] [PubMed]
- Grover, H.; Vedlitz, A.; Brody, S.; Atoba, K. O.; Goldsmith, C.; Dvir, R. Indirect experiences and storm risk perceptions: Case study - Texas, United States. Sci. Total Environ. Early Access. [CrossRef] [PubMed]
- Botzen, W. J. W.; Aerts, J. C. J. H.; van den Bergh, J. C. J. M. Dependence of flood risk perceptions on socioeconomic and objective risk factors. Water Resour. Res. 2009, vol. 45(no. 10), Art. no. 2009WR007743. Available online: https://agupubs.onlinelibrary.wiley.com/doi/10.1029/2009WR007743. [CrossRef]
- Koensgen; Hickey, K.; Nehren, U. Change of Risk Perception and Risk Communication in County Cork, Ireland after Former Hurricane Ophelia (2017). IrishGeog 2023, vol. 55(no. 2), 148–180. [Google Scholar] [CrossRef]
- Knuth, D.; Kehl, D.; Hulse, L.; Schmidt, S. Risk perception, experience, and objective risk: a cross-national study with European emergency survivors. Risk analysis: an official publication of the Society for Risk Analysis. early access. [CrossRef] [PubMed]
- Sullivan-Wiley, A.; Short Gianotti, A. G. Risk Perception in a Multi-Hazard Environment. World Dev. 2017, vol. 97, 138–152. [Google Scholar] [CrossRef]
- Tanner, A. Multi-hazard perspectives on risk perception, disaster preparedness, and emergency management; University of British Columbia, 2022. [Google Scholar]
- Houston, D.; Pérez Figueroa, O.; Jong-Levinger, A.; Schubert, J. E.; Sanders, B. F. Spatial Optimism and Cross-Over Effects in the Perceptions of Interconnected Wildfire, Flood, and Mudslide Hazards. Environ. Behav. 2024, vol. 56(1-2), 19–58. [Google Scholar] [CrossRef]
- Weber, C.; Joachim, H.-E.; Frank, K. “Geologie und Archäologie des Leverkusener Raumes,” in Leverkusen: Geschichte einer Stadt am Rhein; Verl. für Regionalgeschichte: Bielefeld, 2005; pp. 19–55. [Google Scholar]
- United Nations Office for Disaster Risk Reduction (UNDRR). “The Sendai Framework Terminology on Disaster Risk Reduction. “Preparedness”“. Available online: https://www.undrr.org/terminology/preparedness (accessed on 4 September 2025).
- Rogers, R. W. A Protection Motivation Theory of Fear Appeals and Attitude Change. J. Psychol. 1975, vol. 91(no. 1), 93–114. [Google Scholar] [CrossRef] [PubMed]
- Grothmann, T.; Reusswig, F. People at Risk of Flooding: Why Some Residents Take Precautionary Action While Others Do Not. Nat. Hazards 2006, vol. 38(no. 1), 101–120. Available online: https://link.springer.com/article/10.1007/s11069-005-8604-6. [CrossRef]
- Netzel, M.; Heldt, S.; Engler, S.; Denecke, M. The importance of public risk perception for the effective management of pluvial floods in urban areas: A case study from Germany. J. Flood Risk Manag. 2021, vol. 14(no. 2), Art. no. e12688. [Google Scholar] [CrossRef]
- Rufat, S.; et al. , Surveying the surveyors to address risk perception and adaptive-behaviour cross-study comparability. Nat. Hazards Earth Syst. Sci. 2022, vol. 22(no. 8), 2655–2672. [Google Scholar] [CrossRef]
- Tröger, D.; Braun, A. C. Industry impacts more than nature” - Risk perception of natural hazards in more-than-human worlds. Int. J. Disaster Risk Reduct. 2024, vol. 110, 104568. Available online: https://www.sciencedirect.com/science/article/pii/S2212420924003303. [CrossRef]
- Renn, Das Risikoparadox: Warum wir uns vor dem Falschen fürchten, In Fischer Kompakt 19811, 3rd ed.; Fischer Taschenbuch: Frankfurt am Main, 2014.
- Zhong, M.; Xiao, L.; Zhang, Q.; Jiang, T. Risk Perception, Risk Communication, and Mitigation Actions of Flash Floods: Results from a Survey in Three Types of Communities. Sustainability 2021, vol. 13(no. 22), 12389. Available online: https://www.mdpi.com/2071-1050/13/22/12389. [CrossRef]
- Rhein, B.; Kreibich, H. Causes of the exceptionally high number of fatalities in the Ahr valley, Germany, during the 2021 flood. EGUsphere 2024, 1–12. Available online: https://egusphere.copernicus.org/preprints/2024/egusphere-2024-2066/. [CrossRef]
- Fekete, A.; Sandholz, S. Here Comes the Flood, but Not Failure? Lessons to Learn after the Heavy Rain and Pluvial Floods in Germany 2021. Water 2021, vol. 13(no. 21), 3016. Available online: https://www.mdpi.com/2073-4441/13/21/3016. [CrossRef]
- Stadt Leverkusen. Leverkusener Demografiebericht 2022: Fakten und Trends zur Bevölkerungsentwicklung; 2022. [Google Scholar]
- Stadt Leverkusen, Die Bevölkerung (Hauptwohnsitzbevölkerung) in Leverkusen nach Altersgruppen. Accessed. Dec 2024. (accessed on 7 April 2025).
- Zepner; Karrasch, P.; Wiemann, F.; Bernard, L. ClimateCharts.net – an interactive climate analysis web platform. Int. J. Digit. Earth 2021, vol. 14(no. 3), 338–356. [Google Scholar] [CrossRef]
- OpenGedata.NRW. Landbedeckung NRW. Available online: https://www.opengeodata.nrw.de/produkte/geobasis/lusat/akt/lb_nrw/ (accessed on 27 November 2025).
- Stadt Leverkusen. “Geoportal der Stadt Leverkusen.”. Available online: https://geoportal.leverkusen.de/application.jsp (accessed on 16 December 2025).
- Gesamtverband der Versicherer (GDV). Zahl der Hitzetage seit den 1950er Jahren fast verdreifacht. Available online: https://www.gdv.de/gdv/medien/medieninformationen/zahl-der-hitzetage-seit-den-1950er-jahren-fast-verdreifacht-71104 (accessed on 27 September 2023).
- Koßmann, M. Stadtklimaprojektionen der Häufigkeit von Temperaturkenntagen als Grundlage für die Anpassung an den Klimawandel in Leverkusen; Offenbach, 2024. [Google Scholar]
- Porst, R. Fragebogen; Springer Fachmedien Wiesbaden: Wiesbaden, 2014. [Google Scholar]
- Anderson, C. C.; et al. “Public Acceptance of Nature-Based Solutions for Natural Hazard Risk Reduction: Survey Findings From Three Study Sites in Europe,” Front. Environ. Sci. 2021, vol. 9. Available online: https://www.scopus.com/inward/record.uri?eid=2-s2.0-85112168447&doi=10.3389%2ffenvs.2021.678938&partnerID=40&md5=10007c3ee0d38e4f1e836064994ff55b.
- Reiter, L. Die Wahrnehmung von alpinen Naturgefahren durch die Bewohner der Gemeinde Trieben (Steiermark): Eine empirische Studie mittels Fragebögen und Interviews. 2017. Available online: https://unipub.uni-graz.at/obvugrhs/download/pdf/2081824?originalFilename=true.
- Bundesamt für Bevölkerungsschutz und Katastrophenhilfe (BBK). “Ratgeber: Vorsorgen für Krisen und Katastrophen.”. Available online: https://www.bbk.bund.de/DE/Warnung-Vorsorge/Vorsorge/Ratgeber-Checkliste/ratgeber-checkliste_node.html (accessed on 22 April 2026).
- Hochwasser Kompetenz Centrum e.V. (HKC). Produkte. Available online: https://www.hkc-online.de/de/Vorsorge/Produkte (accessed on 22 April 2026).
- Cohen, J. A power primer. Psychol. Bull. 1992, vol. 112(no. 1), 155–159. Available online: https://pubmed.ncbi.nlm.nih.gov/19565683/. [CrossRef] [PubMed]
- Field. Discovering statistics using IBM SPSS statistics, 6th ed.; Sage: Los Angeles; London; New Delhi; Singapore; Washington DC; Melbourne, 2024. [Google Scholar]
- Benjamini, Y.; Hochberg, Y. Controlling the False Discovery Rate: A Practical and Powerful Approach to Multiple Testing. J. R. Stat. Soc. Ser. B. Stat. Methodol. 1995, vol. 57(no. 1), 289–300. Available online: https://academic.oup.com/jrsssb/article/57/1/289/7035855?login=true. [CrossRef]
- Belsley, D. A.; Kuh, E.; Welsch, R. E. Regression Diagnostics: Identifying Influential Data and Sources of Collinearity; Accessed; Wiley, 1980; (accessed on 30 July 2026). [Google Scholar]
- Stadt Leverkusen. Die Bevölkerung (Hauptwohnsitzbevölkerung) in Leverkusen nach Nationalität und Geschlecht. Accessed. Dec 2024. (accessed on 7 April 2025).
- Statistisches Bundesamt. Ergebnisse des Zensus 2022 – Bildung und Erwerbstätigkeit. Jun 2024. Available online: https://ergebnisse.zensus2022.de/datenbank/online/statistic/2000S/details (accessed on 7 April 2025).
- Matanó, A.; Berghuijs, W. R.; Mazzoleni, M.; de Ruiter, M. C.; Ward, P. J.; van Loon, A. F. Compound and consecutive drought-flood events at a global scale. Environ. Res. Lett. 2024, vol. 19(no. 6), 64048. Available online: https://iopscience.iop.org/article/10.1088/1748-9326/ad4b46. [CrossRef]
- Pizzorni, M.; Innocenti, A.; Tollin, N. Droughts and floods in a changing climate and implications for multi-hazard urban planning: A review. City Environ. Interact. 2024, vol. 24, 100169. Available online: https://www.sciencedirect.com/science/article/pii/S2590252024000291. [CrossRef]
- Radio Leverkusen. Petition für die Wiembachallee in Leverkusen Opladen. Available online: https://www.radioleverkusen.de/artikel/petition-fuer-die-wiembachallee-in-leverkusen-opladen-2229660.html (accessed on 4 September 2025).
- openPetition. “Wiembachallee erhalten!”. Available online: https://www.openpetition.de/petition/blog/wiembachallee-erhalten#petition-main (accessed on 4 September 2025).
- Bundesamt für Bevölkerungsschutz und Katastrophenhilfe (BBK). “Warnung & Vorsorge - Videos zum Thema Stromausfall.”. Available online: https://www.bbk.bund.de/DE/Warnung-Vorsorge/Sicherheit-durch-Vorsorge/Materialien-Stromausfall/_functions/bildergalerie_videos-stromausfall.html (accessed on 4 September 2025).
- Kirby-Straker, R.; Straker, L. “The Effect of Experiencing Disaster Losses on Risk Perceptions and Preparedness Behaviors,” Natural Hazards Center, Boulder, Colorado, Rep. 8, 2023. Available online: https://hazards.colorado.edu/weather-ready-research/the-effect-of-experiencing-disaster-losses-on-risk-perceptions-and-preparedness-behaviors.
- Sjöberg, L. The Methodology of Risk Perception Research. Qual. Quant. 2000, vol. 34(no. 4), 407–418. [Google Scholar] [CrossRef]
- Stadt Leverkusen. Fünf Jahre nach der Flutkatastrophe; Leverkusen, 2026; Available online: https://www.leverkusen.de/pressemodul/pressemitteilungen/juli/jahre-hochwasser (accessed on 7 August 2026).
- R+V. “Ein Jahr nach der Flut: Furcht vor Naturkatastrophen außergewöhnlich hoch.” . Die Ängste der Deutschen. Available online: https://www.ruv.de/newsroom/themenspezial-die-aengste-der-deutschen/pressemitteilungen/2022-07-11-angste-der-deutschen-zwischenumfrage-umweltaengste (accessed on 7 August 2026).
Figure 2.
Wiembach (a) and Dhünn (b) without flooding and Wiembach (c) and Dhünn(d) with flooding. Pictures a, b, and d taken by authors, picture c taken by Ralf Krieger for Kölner Stadt Anzeiger (KSTA) published 2022.
Figure 2.
Wiembach (a) and Dhünn (b) without flooding and Wiembach (c) and Dhünn(d) with flooding. Pictures a, b, and d taken by authors, picture c taken by Ralf Krieger for Kölner Stadt Anzeiger (KSTA) published 2022.
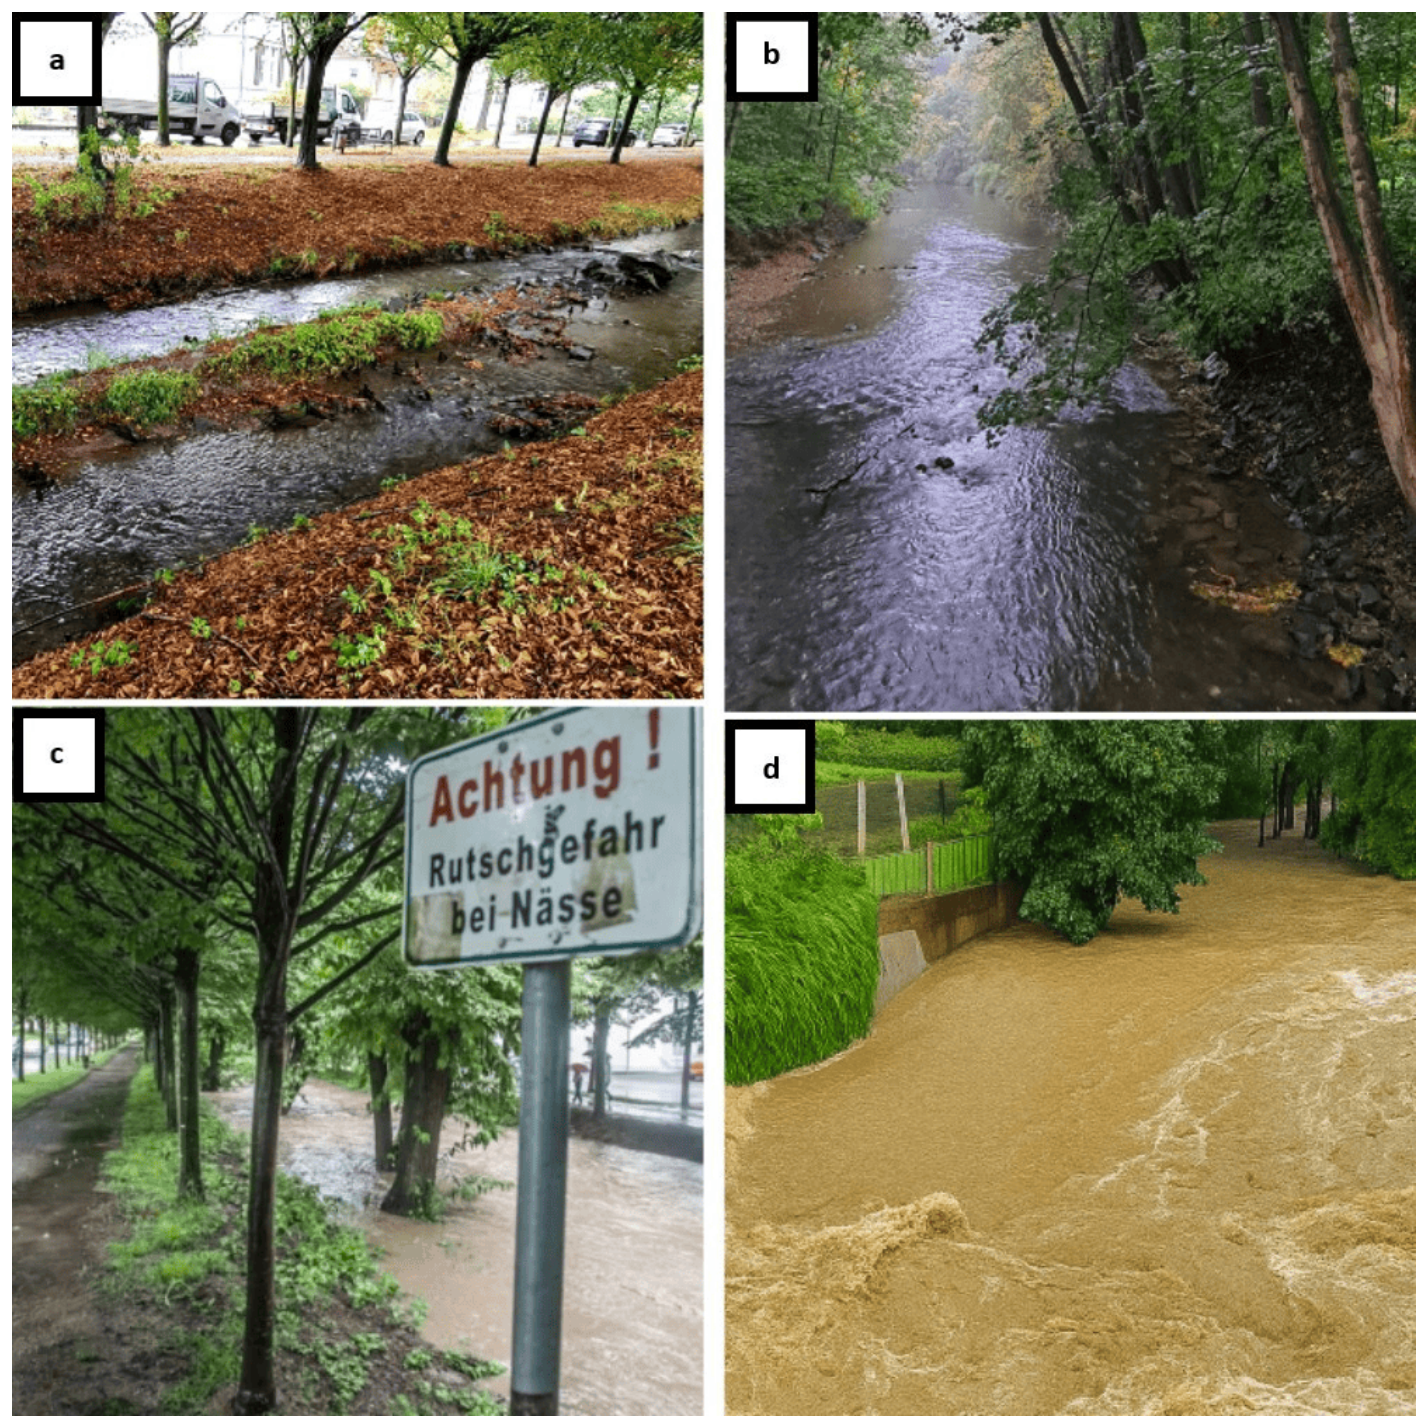
Figure 3.
Flood area Leverkusen for HQextreme and very rare rain event. Source: Stadt Leverkusen [66].
Figure 3.
Flood area Leverkusen for HQextreme and very rare rain event. Source: Stadt Leverkusen [66].
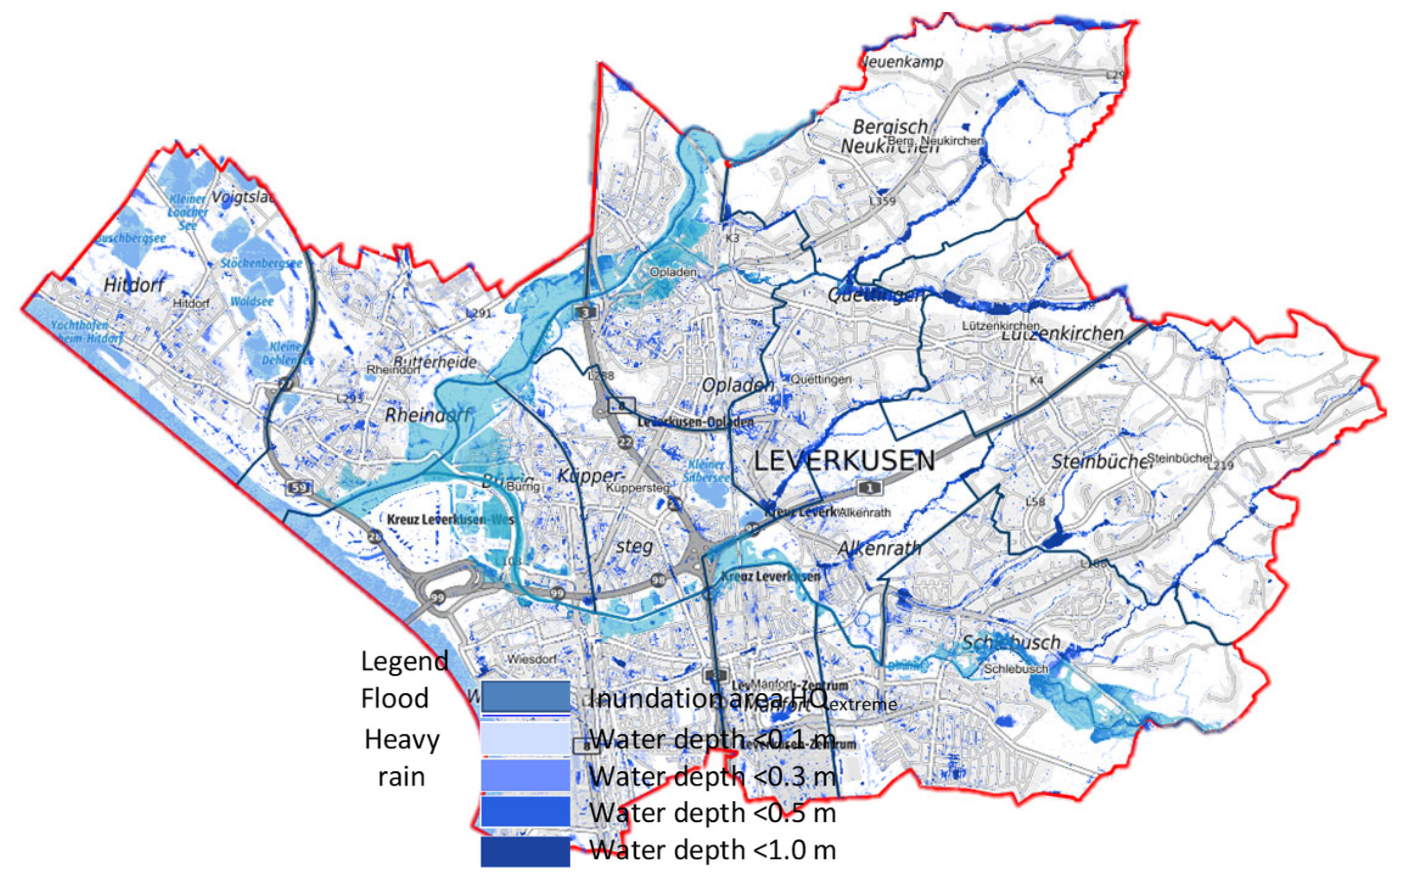
Figure 4.
Methodological flowchart of objectives and methods to answer the research question.
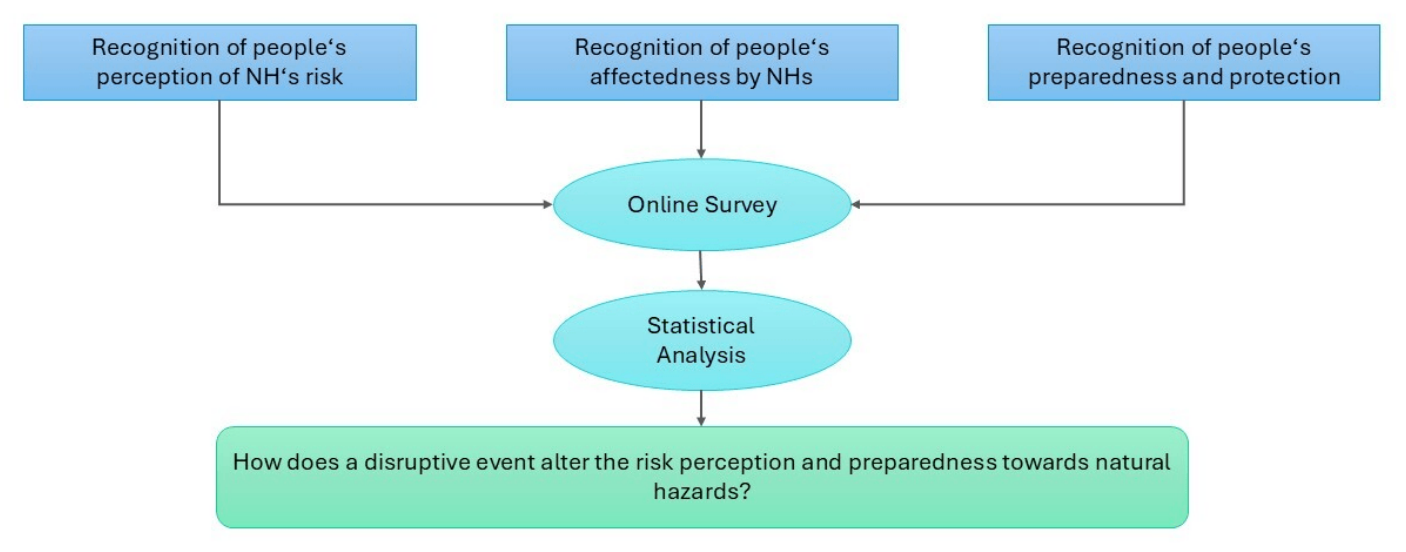
Figure 5.
Severity of impacts by the 2021 flood.
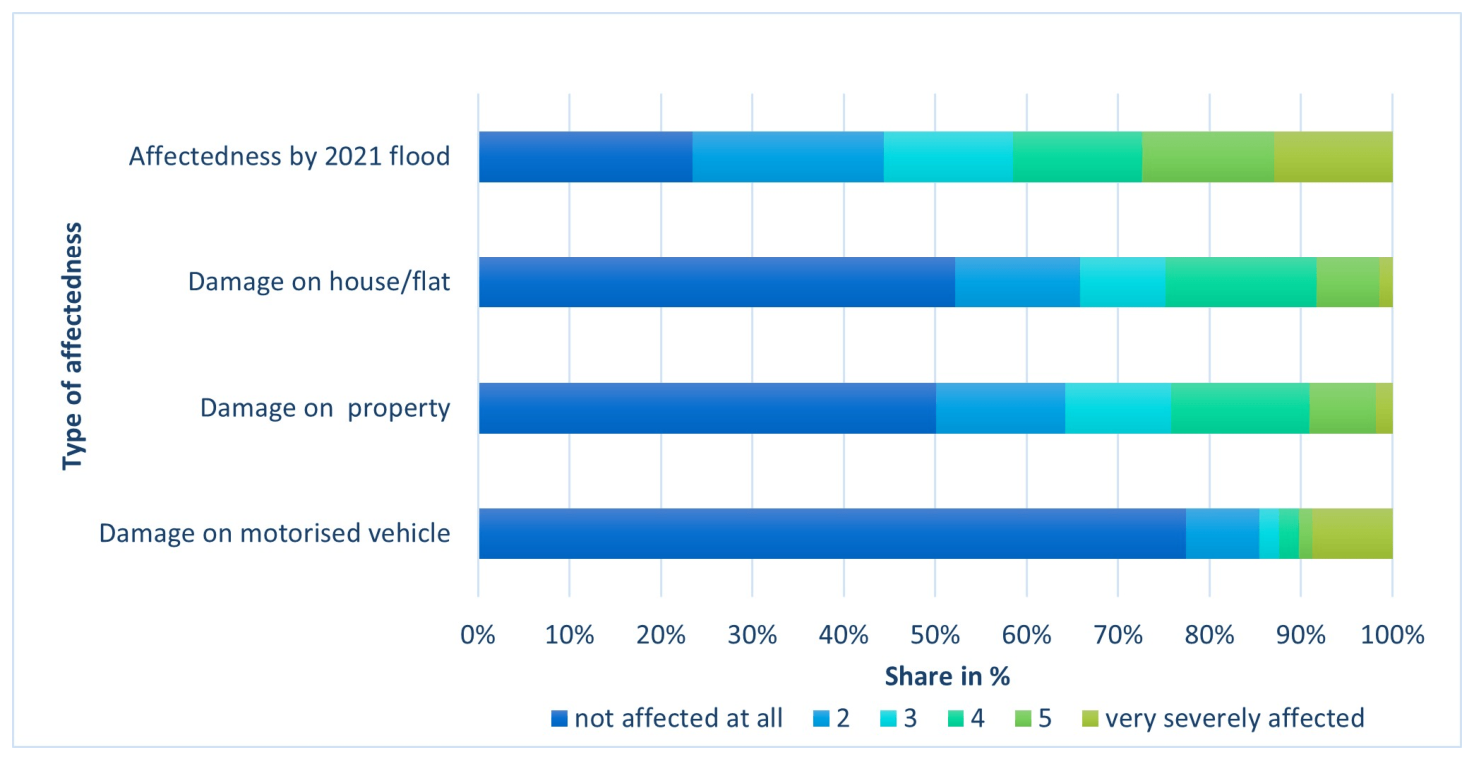
Figure 6.
Change of risk perception of various natural hazards before and after the 2021 flood. Left box plots = risk perception before 2021, right box plots = risk perception after 2021, x = Mean, - = Median.
Figure 6.
Change of risk perception of various natural hazards before and after the 2021 flood. Left box plots = risk perception before 2021, right box plots = risk perception after 2021, x = Mean, - = Median.
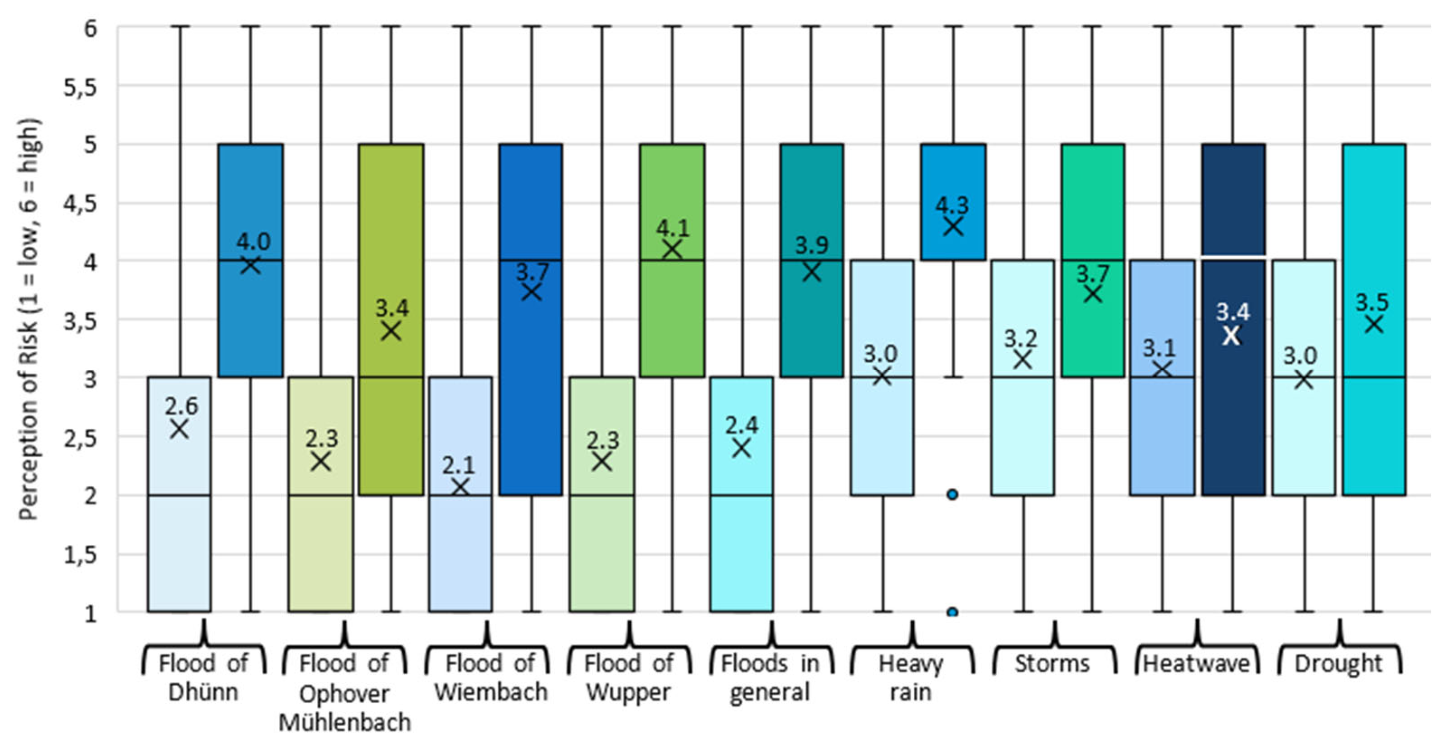
Figure 7.
Visualisation of significant Mann-Whitney-U-test results of direct and indirect affectedness by different hazards, tested with risk perception of different hazards. Colour coding is based on Benjamini-Hochberg adjusted p-values padj.
Figure 7.
Visualisation of significant Mann-Whitney-U-test results of direct and indirect affectedness by different hazards, tested with risk perception of different hazards. Colour coding is based on Benjamini-Hochberg adjusted p-values padj.
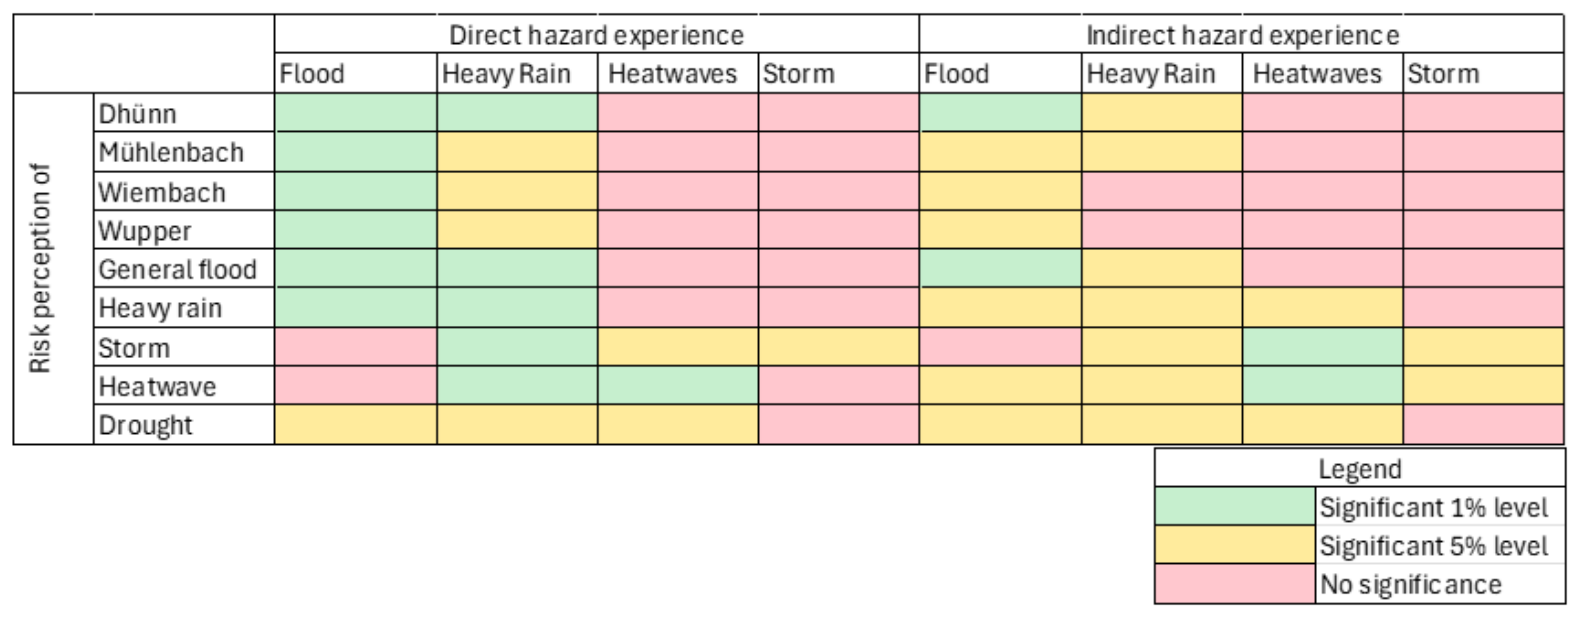
Figure 8.
Change of self-information, protection, and evacuation routes after the 2021 flood, where 1 = “I strongly disagree” and 4 = “I strongly agree”. Left box plot = value before 2021, right box plot = value after 2021, x = mean, - = median.
Figure 8.
Change of self-information, protection, and evacuation routes after the 2021 flood, where 1 = “I strongly disagree” and 4 = “I strongly agree”. Left box plot = value before 2021, right box plot = value after 2021, x = mean, - = median.
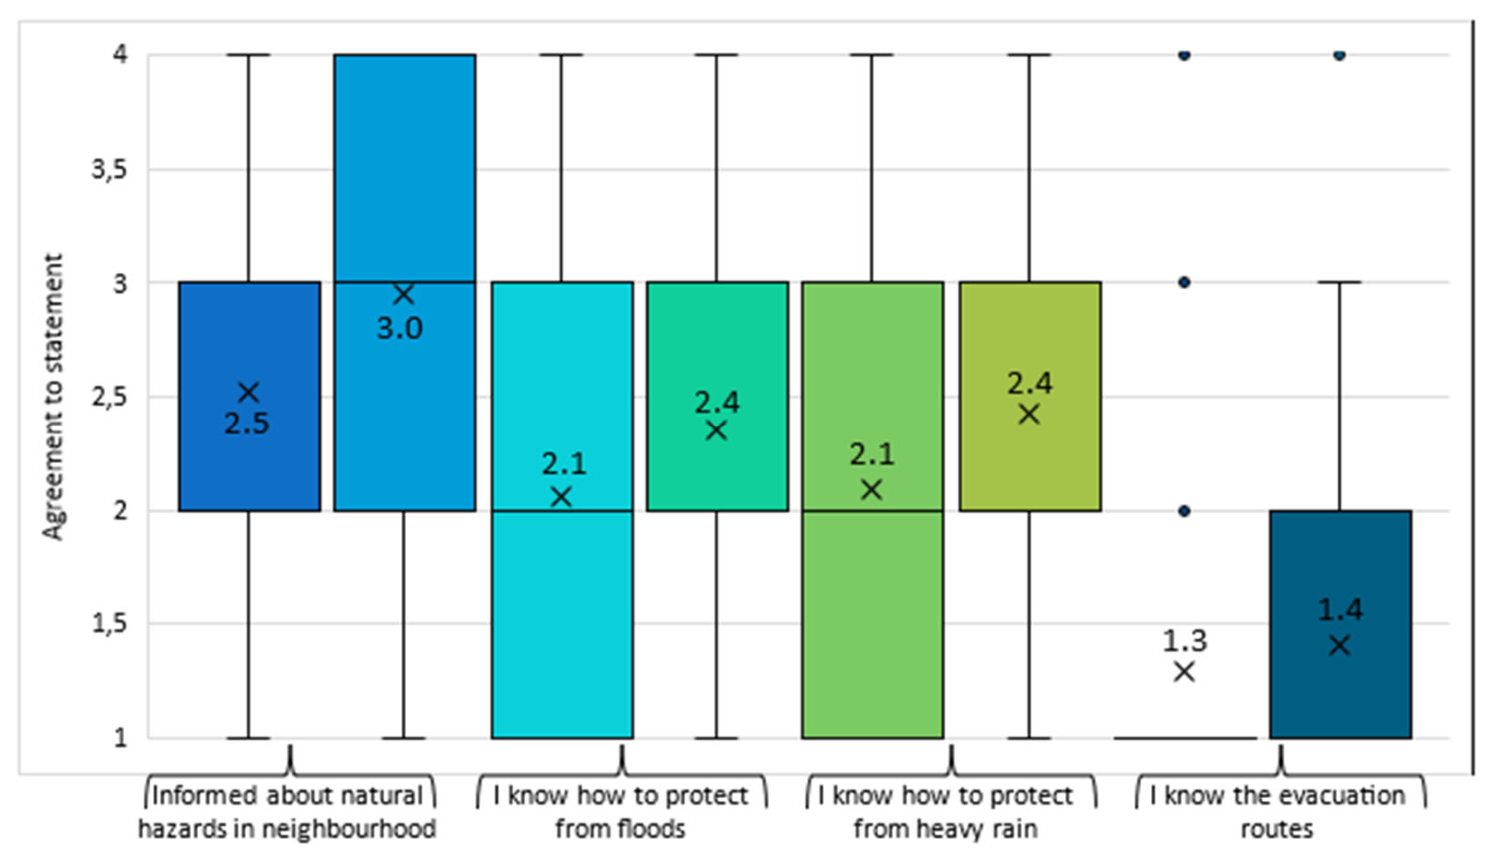
Figure 9.
Protection measures installed before and after the 2021 flood.
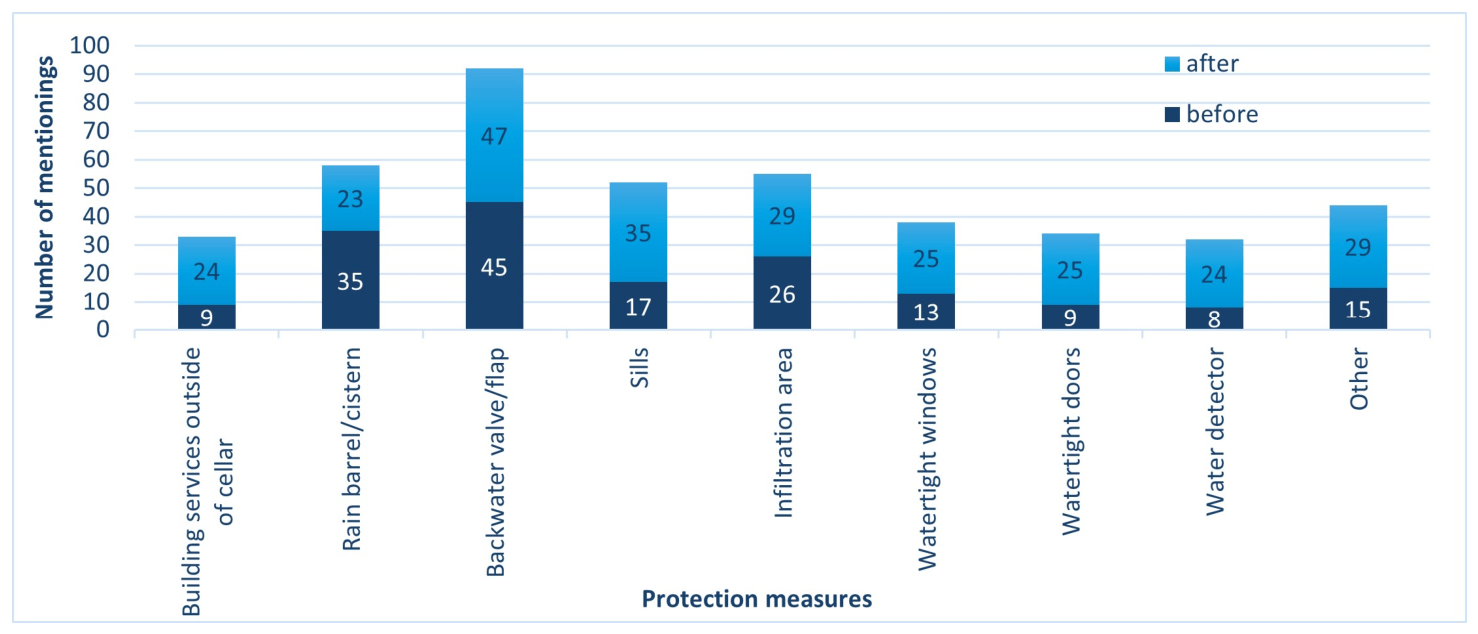
Table 1.
Intuitive biases of risk perception. Source: Renn [13], (p. 103).
Table 1.
Intuitive biases of risk perception. Source: Renn [13], (p. 103).
| Biases | Description |
|---|---|
| Availability | Events that come immediately to people’s minds are rated as more probable than events that are of less personal importance. |
| Anchoring effect | Probabilities are estimated according to the plausibility of contextual links between cause and effect, but not according to knowledge about statistical frequencies or distributions (people will ‘anchor’ the information that is of personal significance to them) |
| Representation | Singular events experienced in person or associated with the properties of an event are regarded as more typical than information based on the frequency of occurrence. |
| Avoidance of cognitive dissonance | Information that challenges perceived probabilities that are already part of a belief system will either be ignored or downplayed. |
Table 2.
Questionnaire content including question number.
| Topic | Content | Question number in questionnaire |
|---|---|---|
| Perception of natural hazards |
|
Q2-4 |
| Affectedness by natural hazards |
|
Q5-9 |
| Preparedness towards natural hazards |
|
Q10-12, Q18-19 |
| Protection measures against flooding |
|
Q13-17 |
| Social aspects and demographics |
|
Q1, Q20-23 |
Table 3.
Overview of assumptions, questions and statistical test.
| Assumption | Questions compared | Test used |
|---|---|---|
|
Q2: How concerned are you about the following natural hazards in your neighbourhood? Q4: How concerned were you about the following natural hazards in your neighbourhood BEFORE the 2021 flood? |
Frequency comparison + Wilcoxon-signed-rank-test |
|
Q6: In your opinion, how badly were you affected by the 2021 flood? Q2: How concerned are you about the following natural hazards in your neighbourhood? |
Spearman correlation |
| Q5b: What are your experiences with natural hazards? - Possessions of mine have already been damaged by… Q2: How concerned are you about the following natural hazards in your neighbourhood? |
Mann-Whitney-U-test | |
|
Q5c: What are your experiences with natural hazards? - My city district was affected by the following natural hazard events… Q2: How concerned are you about the following natural hazards in your neighbourhood? |
Mann-Whitney-U-test |
|
Comparison of results of assumptions 2 and 3 | |
|
Q15: Have you implemented permanent flood protection measures in place for the house/apartment you live in AFTER the 2021 flood? Q5b: What are your experiences with natural hazards? - My city possessions were affected by the following natural hazard events [flood, heavy rain]… Q5c: What are your experiences with natural hazards? - My city district was affected by the following natural hazard events [flood, heavy rain]… Q2: How concerned are you about the following natural hazards in your neighbourhood? (Floods in general, heavy rain) |
Multivariate logistic regression |
|
Q10: How much do you agree with the following statements? Q5b: What are your experiences with natural hazards? - My city possessions were affected by the following natural hazard events [flood, heavy rain]… Q5c: What are your experiences with natural hazards? - My city district was affected by the following natural hazard events [flood, heavy rain]… Q2: How concerned are you about the following natural hazards in your neighbourhood? (Floods in general, heavy rain) |
Multivariate logistic regression |
|
Q18: Which of the following behaviours did/do you implement BEFORE or AFTER the experiences with the 2021 flood? Q5b: What are your experiences with natural hazards? - My city possessions were affected by the following natural hazard events [flood, heavy rain]… Q5c: What are your experiences with natural hazards? - My city district was affected by the following natural hazard events [flood, heavy rain]… Q2: How concerned are you about the following natural hazards in your neighbourhood? (Floods in general, heavy rain) |
Multivariate logistic regression |
|
Comparison of results of multivariate logistic regression analysis of assumptions 5, 6, and 7 | |
Table 4.
Reasons for not installing protection measures after the 2021 flood.
| Category | N | % | |
|---|---|---|---|
| Standardised reasons | Fear of depreciation of the house/flat | 15 | 3.9 |
| Lack of financing options | 48 | 12.5 | |
| I have insurance | 92 | 24.0 | |
| Lack of specialised personnel | 10 | 2.6 | |
| Bad experiences with own flood protection measures | 21 | 5.5 | |
| Other | 197 | 51.4 | |
| Total | 383 | 100 | |
| Open answers to “Other” | Adequate protection in place | 15 | 9.3 |
| Elevated location | 22 | 13.7 | |
| Tenancy | 31 | 19.3 | |
| Not possible due to structural characteristics | 10 | 6.2 | |
| Not affected | 47 | 29.2 | |
| Measures lack efficacy | 11 | 6.8 | |
| Lack of knowledge | 10 | 6.2 | |
| Lack of motivation | 7 | 4.3 | |
| Not considered necessary | 8 | 5.0 | |
| Total | 161 | 100 |
Disclaimer/Publisher’s Note: The statements, opinions and data contained in all publications are solely those of the individual author(s) and contributor(s) and not of MDPI and/or the editor(s). MDPI and/or the editor(s) disclaim responsibility for any injury to people or property resulting from any ideas, methods, instructions or products referred to in the content. |
© 2026 by the authors. Licensee MDPI, Basel, Switzerland. This article is an open access article distributed under the terms and conditions of the Creative Commons Attribution (CC BY) license (http://creativecommons.org/licenses/by/4.0/).
Copyright: This open access article is published under a Creative Commons CC BY 4.0 license, which permit the free download, distribution, and reuse, provided that the author and preprint are cited in any reuse.