

Submitted:
16 August 2026
Posted:
18 August 2026
You are already at the latest version
Abstract
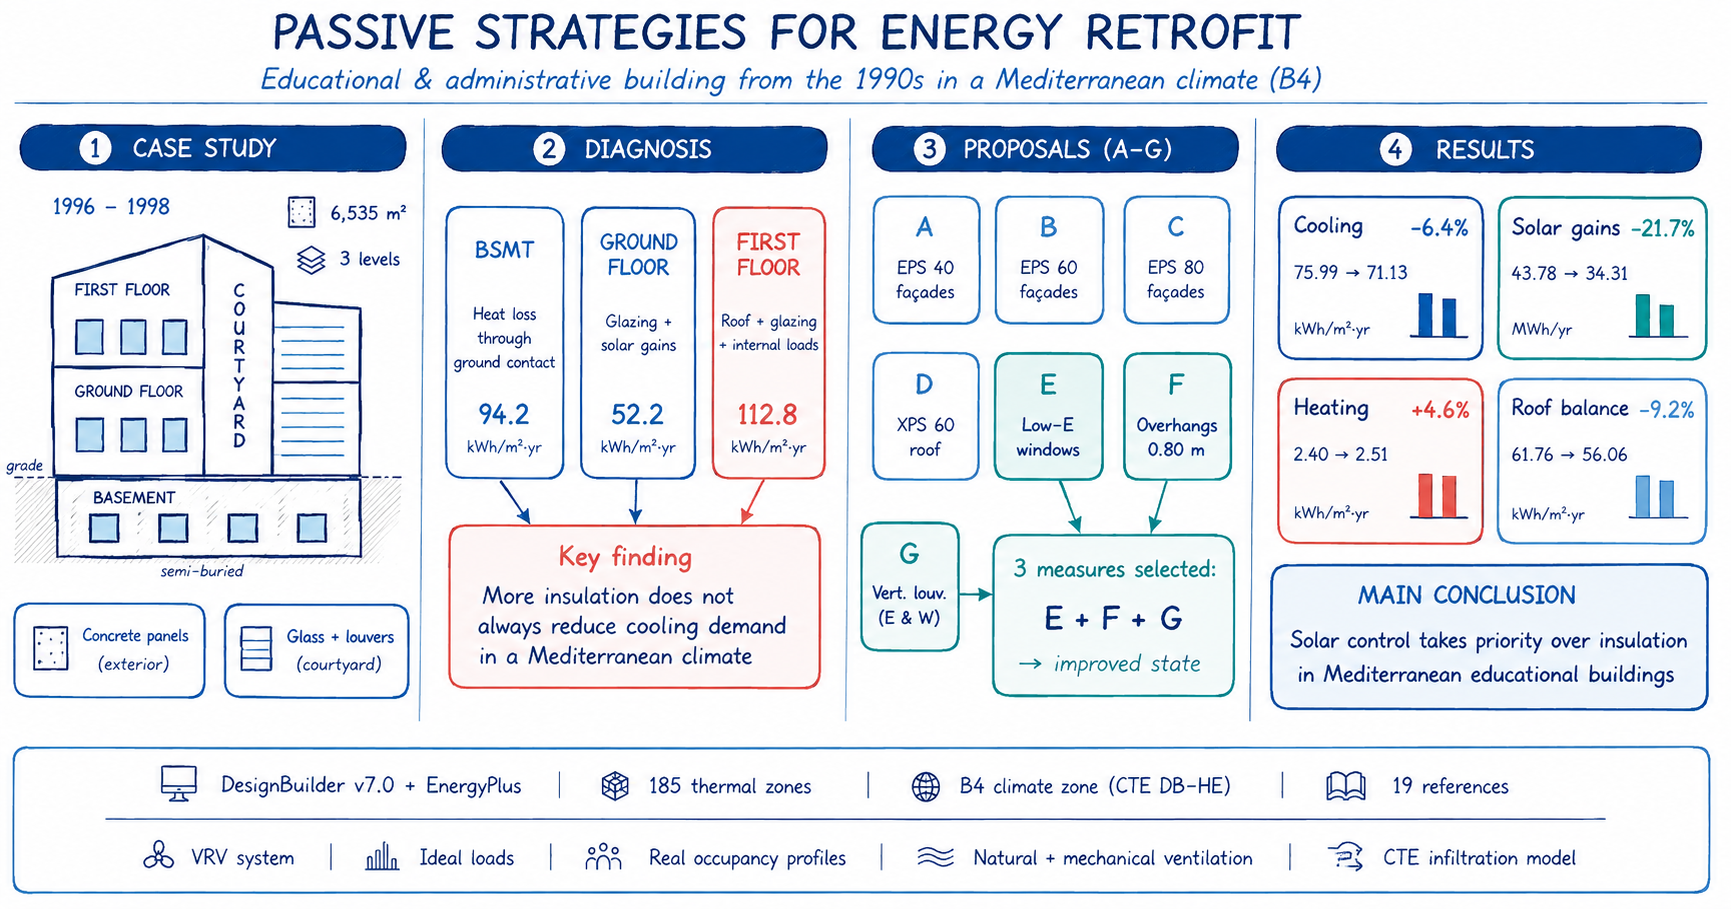
Educational and administrative buildings built across the Mediterranean arc during the 1990s often fall short of current energy standards, and their dense, intermittent occupancy patterns complicate retrofit decisions. This study develops an EnergyPlus-based model in DesignBuilder for a three-level teaching and administrative building that combines heavy precast concrete façades with fully glazed, louvre-shaded courtyard walls, to map its weaknesses and test how far passive measures alone can go. Each floor behaves differently: the semi-buried basement loses heat to the ground, the ground floor through its glazed openings, and the first floor through its roof. Analysis of three representative zones shows that glazed area, shading type, and internal loads matter as much as orientation. Seven envelope and solar-control proposals were tested; adding insulation did not always reduce cooling demand, since in a climate with long, hot summers and high internal gains extra insulation can trap heat as easily as it keeps it out. The best combination—replacing the windows, adding overhangs, and swapping horizontal for vertical louvers on the east and west façades—cut annual cooling demand by 6.4% and solar gains by 21.7% on the first floor, with a negligible heating penalty. In buildings of this type, keeping the sun out matters more than adding insulation everywhere.
Keywords:
energy efficiency
; energy simulation
; passive strategies
; Mediterranean climate
; educational buildings
; DesignBuilder
; energy retrofit
1. Introduction
Buildings have been climbing the policy agenda for years, and the numbers explain why. The latest figures from the United Nations Environment Programme put the construction sector at roughly 32% of global energy use and 34% of CO2 emissions in 2023 [1]. In Europe the problem is heavily concentrated in the existing stock. The European Commission reckons that 85% of the EU’s buildings went up before the year 2000 and that three quarters of them perform badly [2]. Renovation rates sit stubbornly around 1% a year, nowhere near what the climate targets demand.
The regulatory response has been gathering pace. The recast Energy Performance of Buildings Directive—Directive (EU) 2024/1275—sets a course toward a zero-emission building stock by 2050 and pays particular attention to the worst-performing buildings [3]. Spain has translated these goals into its National Integrated Energy and Climate Plan for 2023–2030, which earmarks funds for housing retrofit, public building upgrades, and the roll-out of efficient systems and renewables [4]. In 2026 the Spanish government approved a €200 million support line specifically for energy efficiency work in schools and public education centres, covering insulation, HVAC, lighting, and on-site renewables [5].
Educational and administrative buildings sit apart from housing in ways that matter for energy analysis. A home runs more or less around the clock, with people present at night and on weekends. A university building or an office block follows timetables, academic calendars, and room-by-room occupancy densities that can swing sharply within a single floor. Lecture halls, individual offices, computer labs, and common areas each pump out a different heat profile, so treating the whole building as one thermal zone makes little sense. On top of that, Spanish regulations classify classrooms and offices as IDA 2 indoor air quality, which translates into mandatory minimum outdoor airflows that turn ventilation into a significant energy load by themselves [6].
In a Mediterranean climate, passive strategies earn their place because they cut demand before the mechanical systems even turn on. Suárez and Fragoso [7] looked at social housing in the B4 climate zone and found that orientation, envelope upgrades, natural ventilation, and proper shading were the levers that delivered the biggest drops in both energy use and emissions. Gil Báez [8] showed that natural ventilation alone can keep conditions acceptable in southern Spanish school buildings while drawing next to no energy. Pérez-Carramiñana et al. [9] used DesignBuilder to test envelope and shading measures on a single-family house in Alicante and confirmed that the measures work, though how much depends heavily on how they are combined.
Energy simulation has become the go-to tool for sorting through retrofit options. It lets you compare scenarios, estimate savings, and steer decisions before anyone picks up a tool. But it is only as good as the data you feed it. Galiano-Garrigós et al. [10] compared simulated and measured performance across several university buildings and found meaningful gaps, especially where the geometry was unusual or the shading was tricky to model. Simulation is better understood as a way to rank strategies than as a crystal ball for consumption figures.
The building we examine here makes a useful case study for teasing apart these issues. Designed by the architect Javier García-Solera between 1994 and 1996, it houses both teaching and office functions in a Mediterranean setting [11]. It is arranged as a U around a planted courtyard, sits partly below grade, and marries two very different façade types: heavy precast concrete panels on the outside and fully glazed, louvre-shaded walls on the inside. In a single building you can watch the effects of ground contact, orientation, glazing ratio, solar protection, internal loads, and opaque envelope all play out at once.
Our aim here is straightforward. We model the building as it stands, identify where it leaks most, and then test a set of passive retrofit measures to see what moves the needle. We are especially interested in the interplay between insulation, internal gains, and cooling demand under a Mediterranean sun, and in the case for treating each floor—and each orientation—on its own terms.
2. Materials and Methods
2.1. Case Study Description
The building sits in San Vicente del Raspeig, in the Alicante metropolitan area (38°23′4.7″ N, 0°30′47.33″ W), at an elevation of 90–93 m above sea level. It falls into climate zone B4 under the Spanish Technical Building Code (CTE DB-HE), meaning mild winters and long, hot summers [12].
It is a tertiary-sector building mixing teaching and administrative uses, laid out as a U around a central planted courtyard. Construction ran from 1996 to 1998 to a design by Javier García-Solera Vera [11]. Three levels make up the volume: a semi-buried basement, a ground floor raised slightly above grade, and a first floor. Clear height is 2.90 m throughout; total height above grade comes to about 7.90 m.
Total floor area reaches 6,535 m2 (2,224 m2 in the basement, 2,152 m2 on each of the upper floors), enclosing a volume of 22,494 m3. The envelope covers 7,992 m2, of which 2,733 m2 are in contact with the ground and 5,260 m2 are exposed to outside air.
The building packs in a mix of offices, lecture rooms, computer labs, an assembly hall, archives, bathrooms, circulation areas, and plant rooms. A regular column grid—3.60 m on centre in the transverse direction, variable but symmetrical longitudinally—organises the plan. Corridors run along the centre of each wing, with rooms on either side.
The envelope’s split personality is one of its most interesting features from an energy standpoint. The outer façades are heavy precast concrete panels, largely opaque, with low horizontal window bands (roughly 5% glazing on the north face, 12–16% on the east and west). The courtyard façades, by contrast, are fully glazed and shaded by adjustable horizontal timber louvers. The two sets of façades see very different solar regimes even when they share the same compass direction.
The basement pulls back from the building perimeter on all sides except the courtyard, where the three floors align. The basement slab lies 1.90–2.35 m below grade, depending on the natural slope. A light well along the south façade brings extra daylight and air to that level. Figure 1 shows the main façade, photographed by Miguel Ángel Valero in the year the building opened.
2.2. Construction and Building Services
We drew the envelope data from three sources: the university’s geographic information system (SIGIE), the graphic documentation published in the building’s monograph [11], and our own site visits. From these we produced the plans, elevations, and sections needed for the model.
The opaque envelope consists of precast concrete panels with an intermediate air cavity and an internal lining on the outer façades, while the courtyard façades use a rendered masonry leaf. The roof is a flat, non-trafficable warm deck with screed, waterproofing, thermal insulation, and gravel finish. The basement slab rests directly on the ground.
Five window types appear in the building. Three are aluminium casement windows with double glazing and an air gap: type 1 on the basement outer façades, type 2 on the ground and first floors, and type 3 on the glazed courtyard façade. Type 5 serves the main entrance. Two additional door types (4a and 4b), also aluminium and glazed, complete the set. The courtyard façade carries adjustable timber louvers for external shading.
The building is served by a variable-refrigerant-volume (VRV) system with ducted and cassette indoor units fed from outdoor units on the roof. Ventilation is mechanical in spaces without openable windows; elsewhere natural ventilation is possible. Lighting relies on linear T8 fluorescent luminaires with manual switching by zone.
2.3. Energy Model Development
We built the energy model in DesignBuilder v7.0, which runs on the EnergyPlus engine [16]. The workflow followed the usual sequence: build the 3D geometry, assign materials and constructions, set internal loads and schedules, configure HVAC and lighting, run the simulations, and post-process the output.
The model geometry sticks closely to the real building, including the semi-buried condition, the façade setbacks, the floor-slab overhangs, and the building’s own shading elements—overhangs and louvers. We split the model into 185 thermal zones, each tied to a specific use (office, classroom, corridor, bathroom, etc.), to capture the spread of internal loads that makes this building type so different from a simple residential block.
Materials and build-ups came from the data gathered during the characterisation phase. Where we lacked precise information on internal layer composition, we adopted constructions consistent with the period, drawing on the CTE’s Catalogue of Construction Elements [13] and the TABULA database compiled by the Valencian Institute of Building [14]. Table 1 lists the U-values of the main envelope elements.
Every element exceeds the current CTE limits, which confirms that the envelope needs work to come anywhere near present-day standards.
Occupancy schedules were built from the university’s published room data, the fire-safety code occupancy densities [15], and our own observations. Each space type got its own timetable: offices from 8:00 to 21:00, classrooms in either the morning (8:00–15:00) or afternoon (15:00–21:00) shift. Weekends were treated as unoccupied except for occasional administrative use. The annual calendar blocks out August, Christmas, Easter, and public holidays.
Lighting and equipment loads were estimated from a luminaire inventory and a count of computers and peripherals in each zone. Installed lighting power density runs from 5 to 15 W/m2 depending on the luminaire and the room. For equipment we assumed 80 W per workstation in computer labs and 30 W per desk in offices, plus an allowance for printers, projectors, and ancillary gear.
Ventilation was set to mechanical in rooms without openable windows and to scheduled natural ventilation elsewhere, opening only when the outside temperature drops below the indoor temperature and only during occupied hours. Infiltration was estimated using the simplified method in CTE DB-HE1, which ties it to window air permeability and climate zone.
For HVAC we used an ideal-loads air system. This does not model the plant in detail; it simply calculates the energy required to hold the setpoints. The setpoints were 21 °C for heating and 25 °C for cooling, with a night setback. The ideal-loads approach suits a study that focuses on demand and on comparing passive strategies, but the reader should bear in mind that it says nothing about the actual efficiency of the VRV plant.
The model in DesignBuilder is shown in Figure 2.
2.4. Improvement Proposals
Seven retrofit proposals were defined, all of them passive—they change the envelope or the shading but leave the active systems and energy sources untouched. They are listed below and summarised in Table 2.
Proposals A, B, and C target the opaque façades at three rising insulation levels. Proposal A adds 40 mm of external expanded polystyrene (EPS), bringing the U-value to 0.51 . Proposal B uses 60 mm EPS (U = 0.41). Proposal C uses 80 mm EPS (U = 0.24).
Proposal D tackles the roof with 60 mm of extruded polystyrene (XPS) under the paving, lowering the U-value from 1.23 to 0.37 .
Proposal E replaces the existing windows on the outer façades with thermally broken, low-E, argon-filled units, reducing the U-value from 3.06 to 1.42 and the solar factor (g) from 0.78 to 0.42. On the glazed courtyard façade the glass alone is replaced with the same specification, keeping the existing frames.
Proposal F adds 0.80 m overhangs above the outer-façade windows, sized to take advantage of the existing slab projection and shade the low horizontal openings during the high-sun months.
Proposal G swaps the horizontal louvers on the east and west courtyard façades for adjustable vertical louvers. Horizontal blades work well when the sun is high (south-facing), but struggle when the sun sits low in the morning and afternoon. Vertical blades give better control at shallow sun angles.
Beyond testing each proposal on its own, we defined a combined improved state that bundles the three measures that performed best individually. The joint simulation is necessary because each change alters the zone’s thermal balance and, in doing so, shifts the boundary conditions the other measures operate under. The total saving is not the sum of the parts.
Simulations ran at two scales. First, we assessed the whole building floor by floor, comparing monthly and annual HVAC demand for the current state against each proposal. Second, we picked three representative zones on the first floor for a closer look: an east-facing administrative office with two windows (Adm 04), a west-facing classroom with a fully glazed, louvre-shaded façade (Classroom 03), and a south-facing classroom with a smaller glazed area (Classroom 05). The three zones let us watch how orientation, glazed ratio, shading type, and internal loads interact in spaces with different uses and different boundary conditions.
3. Results
3.1. Current-State Performance
The simulation of the building as it stands shows that the three floors do not behave the same way. Differences in demand, in the elements that dominate the energy balance, and in the seasonal spread of heating and cooling loads all argue for analysing each level separately.
Table 3 gives the annual HVAC demand by floor. Cooling swamps heating on all three levels, as you would expect in a Mediterranean climate with high internal gains. The first floor carries the heaviest cooling load, both in absolute terms and per square metre.
Figure 3 plots these numbers. Cooling dominates across the board, and the first floor stands out clearly as the floor that needs the most attention.
Breaking the annual energy balance down by construction element and by ventilation reveals which parts of the envelope matter most. In the basement, losses through the envelope and ventilation total kWh/(m2yr), most of it through the ground slab and the buried walls. On the ground floor the balance is kWh/(m2yr), with the glazed openings as the dominant pathway—both transmission losses and solar gains play a role. The first floor reaches kWh/(m2yr). Here the roof is the weakest link ( kWh/(m2yr)), followed by the glazing and the walls.
Looking at the gains on the cooling design day confirms the weight of internal loads. In the basement solar gains are small, but people, lights, and equipment still pump heat into the space that the cooling system must remove. On the ground floor and especially the first, solar gains grow, but internal gains remain substantial. The building needs not just to keep outside heat out but also to shed the heat it generates inside during occupied hours.
3.2. Representative Zones
The three zones selected on the first floor show distinct thermal behaviour that helps put the role of orientation in perspective. Adm 04 is an east-facing office with two windows. It catches strong solar radiation in the early morning, which pushes up its cooling demand. Classroom 03 faces west with a fully glazed façade behind horizontal louvers. Radiation hits hard in the late afternoon, when the outside air is already warm; the louvers shave off some of the gain, but the sheer glass area remains the dominant factor. Classroom 05 faces south but has less glazing than Classroom 03, so its summer solar gains are more moderate. Here the roof and the internal loads from teaching activity carry proportionally more weight.
The comparison across the three zones shows that orientation by itself does not explain energy behaviour. An east-facing room with generous glazing can pull in more radiation—and drive more cooling—than a south-facing room with a smaller, better-shaded window. Glass area, shading type, and the internal loads tied to how the space is used all matter at least as much as which way the wall faces.
Across a typical summer week, all three zones show net losses through the envelope even though they receive solar radiation. The result seems counter-intuitive until you consider the thermal inertia of the roof and the high indoor temperatures that internal gains produce. When the room temperature climbs above the outside air, the heat flow reverses and the envelope starts dumping heat instead of taking it in. Figure 6 compares the weekly cooling demand across the three zones.
3.3. Effect of the Improvement Proposals
The seven proposals, tested on the first floor where the problems are most acute, yield results that differ enough to matter.
Proposals A, B, and C—the three levels of façade insulation—behave differently depending on the zone and the season. In zones with a lot of opaque wall, like Adm 04, the thicker insulation cuts winter losses, but the summer improvement is smaller. In Classroom 05, Proposal C barely moves the cooling demand because the glazing and the roof outweigh the walls. A lower U-value does not guarantee a proportional drop in annual demand.
Proposal D, the roof measure, has a moderate effect on cooling demand, most visible in zones directly under the roof such as Classroom 05, where it reduces heat exchange through that element.
Proposal E delivers the biggest cooling reduction across all three zones by attacking solar gain at the point of entry. Replacing the existing windows with units that have a lower U-value and, critically, a much lower solar factor cuts the solar load without blocking daylight altogether.
Proposal F, the overhangs, also trims cooling demand, but its effectiveness is directional. It works best on the south façade, where the sun is high and a horizontal projection intercepts a large share of the direct beam. On east and west façades, where the sun sits lower, the protection it offers is limited.
Proposal G, switching from horizontal to vertical louvers on the east and west façades, improves solar control precisely where it was weakest. Horizontal louvers work well under a high sun (south) but lose effectiveness when the sun is low. Adjustable vertical blades catch more radiation at shallow angles and cut cooling demand during the warm months, although they also trim useful solar gains in winter.
Figure 7 summarises the effect of all seven proposals on cooling and heating demand.
Proposals E, F, and G were therefore selected for the combined improved state—they offered the largest cooling reductions without hurting winter performance in any meaningful way. Table 4 and Figure 8 compare the annual results for the current and improved states on the first floor.
Cooling demand drops by 6.4%, or 4.86 kWh/m2 per year. Solar gains fall by 21.7%, which confirms that the measures are hitting the main source of overheating. Heating rises by just 4.6%—an extra 0.11 kWh/m2 that barely registers in the annual balance.
The combined saving is not the sum of the individual savings. Each measure shifts the zone’s thermal balance and changes the conditions the others work under. For instance, cutting solar gains with low-E glazing lowers the indoor temperature, which in turn reduces the heat flow through the roof and walls—they may now be dumping less heat to the outside. This interaction is exactly why you cannot simply add up single-measure results; the joint simulation is essential.
Figure 9 shows the monthly demand profile for the first floor, where the dominance of cooling over heating is unmistakable.
4. Discussion
The results make clear that a one-size-fits-all solution does not fit this building. The basement, the ground floor, and the first floor are governed by different thermal elements—the ground, the glazing, and the roof, respectively. The differences mirror the geometry (partly buried, two distinct façade types) but also the spread of uses and the internal loads that come with them. The first floor, with the highest concentration of classrooms, couples heavy exposure to solar radiation through the roof and windows with significant internal gains from occupants and teaching equipment. It is the floor that needs the most urgent attention.
The three representative zones show that orientation is not the whole story. West-facing walls do catch more radiation during the hottest part of the day, and south-facing ones enjoy better natural protection in summer. But Adm 04—an east-facing office with two windows—drives cooling demand comparable to, or even higher than, a south-facing classroom with a smaller window. Glazed area, shading type, and the internal loads tied to how each space is used all interact with orientation to set the real thermal behaviour of a room.
One of the more interesting findings concerns the effect of insulation in a Mediterranean climate with high internal gains. Adding insulation did not always shrink the cooling load. The reason is physical: insulation resists heat flow in both directions. It slows heat coming in when it is hotter outside, but it also traps heat generated inside when the indoor temperature rises above the outdoor air. In a classroom with thirty or forty students, computers, projectors, and lights, the indoor temperature can sit above the outside air for many hours a day, even in summer. Under those conditions a better-insulated envelope may actually hinder the dissipation of internal heat and nudge the cooling demand up slightly.
The literature has flagged this pattern before. Stazi et al. [17] noted that winter and summer requirements can pull in opposite directions in a Mediterranean climate, and that what helps in one season may hurt in the other. Ounis et al. [18] tested insulation levels across a hundred European cities and concluded that, while a low U-value does cut heating, pushing insulation too far in warm climates can raise cooling demand by trapping indoor heat. Our results align with those findings and extend them to a tertiary-sector building with teaching and office uses, where internal loads are generally higher than in housing.
The roof’s thermal inertia adds a further twist. The concrete slab and the layers above it delay the transmission of absorbed heat by several hours. Espinosa-Fernández et al. [19] measured time lags of more than 11 hours on conventional roofs in Alicante, and up to 17 hours on high-inertia designs. This means that heat arriving at the roof at midday can reach the inside surface during the night, when the outside air has cooled and the classroom is empty. At that point the heat flow may reverse and the roof can switch from delivering heat to the room to drawing it out. Over a full summer week, integrating all the hourly flows, the roof can show up as a net heat loss even though it has been blasted by sun all day.
This dynamic helps explain why some roof-insulation proposals had only a modest effect on cooling demand. Adding insulation cuts both the inward flow and the outward flow during the hours when the flux reverses. If the reduction in outward flow is comparable to the reduction in inward flow, the net effect on cooling demand can be small.
The measures that went after solar radiation before it crossed the glass—window replacement, overhangs, and the switch from horizontal to vertical louvers on the east and west—outperformed the measures that simply added insulation. Attacking the source of the gain rather than the resistance of the envelope looks like the smarter play in this climate and for this building type. The three together cut solar gains by 21.7%, a number that translates into a meaningful cooling reduction despite a very slight heating penalty.
Several limitations of the study should be acknowledged. The model uses an ideal-loads system; it calculates the demand required to hold the setpoints but says nothing about the real efficiency of the VRV plant. Consumption figures derived by applying a plant efficiency would differ from the demand figures presented here, though the trends and the ranking of proposals would hold. Occupancy, schedules, equipment loads, and infiltration were set from site visits, drawings, regulations, and published data, but they were not measured directly. The model has not been calibrated against metered energy data because disaggregated consumption figures for the building were not available. Finally, the analysis stops at HVAC demand and does not address discomfort hours, the economic cost of the measures, their service life, or their life-cycle environmental impact.
Even with those caveats, the work yields useful pointers about how the building performs and which direction a future retrofit should take. The methodology—detailed characterisation, energy modelling, and systematic comparison of passive strategies—can be transferred to other buildings of the same vintage and the same climate, provided the input data are adapted to each case.
Figure 10 pulls the main findings together.
5. Conclusions
This study set out to map the energy behaviour of a 1990s teaching and office building in a Mediterranean climate, using a DesignBuilder simulation to pinpoint its weaknesses and test a range of passive retrofit measures. Three findings stand out.
First, the three floors do not behave as one. The basement loses most heat to the ground, the ground floor through its glazing, and the first floor through its roof. Any retrofit that ignores these differences will spend money where it buys little.
Second, orientation is not destiny. The glazed area, the type of shading, and the internal loads from occupants, lights, and equipment shape energy demand at least as much as the compass direction. Internal gains, in particular, explain why cooling swamps heating on every floor and why more insulation is not always the answer.
Third, the measures that worked best were the ones that stopped solar radiation before it entered the building: replacing the windows, adding overhangs, and swapping horizontal louvers for vertical ones on the east and west façades. Applied together on the first floor, they cut annual cooling demand by 6.4% and solar gains by 21.7%, with a barely noticeable rise in heating.
For educational buildings in the Mediterranean arc with high internal loads, the retrofit strategy should put solar control and heat removal ahead of across-the-board insulation. The intervention must be tailored to each floor, each façade, and each room’s use.
As next steps, it would be worth calibrating the model against real consumption and indoor-condition measurements, bringing the HVAC plant efficiency into the picture to estimate actual energy use, and extending the analysis to cover discomfort hours, economic cost, and life-cycle environmental impact.
Author Contributions
Conceptualization, E.O.-M. and C.R.-M.; methodology, E.O.-M. and C.R.-M.; software, E.O.-M.; validation, E.O.-M., C.R.-M. and P.S.-G.; formal analysis, E.O.-M.; investigation, E.O.-M.; resources, C.R.-M. and P.S.-G.; data curation, E.O.-M.; writing—original draft preparation, E.O.-M.; writing—review and editing, E.O.-M., C.R.-M. and P.S.-G.; visualization, E.O.-M.; supervision, C.R.-M. and P.S.-G.; project administration, C.R.-M.; funding acquisition, C.R.-M. All authors have read and agreed to the published version of the manuscript.
Funding
This research was funded by the Generalitat Valenciana within the framework of the Grants for Emerging Research Groups, project “AIRES6D: Advances in Air Renewal Techniques in Buildings, 6D Consideration” (grant number CIGE/2024/202).
Institutional Review Board Statement
Not applicable.
Informed Consent Statement
Not applicable.
Data Availability Statement
The original contributions presented in this study are included in the article. Further inquiries can be directed to the corresponding author.
Acknowledgments
The authors wish to express their gratitude to the Technology and Sustainability in Architecture (TSA) and Robotics, Vision and Intelligent Technologies (RoViT) research groups, as well as to the University Institute of Water and Environmental Sciences (IUACA) of the University of Alicante, for their institutional, scientific, and technical support during the development of this work. During the preparation of this manuscript, the authors used generative artificial intelligence tools for language editing and drafting assistance; the authors have reviewed and edited the output and take full responsibility for the content of this publication.
Conflicts of Interest
The authors declare no conflicts of interest. C.R.-M. serves as Guest Editor of this Special Issue and will not be involved in the review or editorial decision-making process for this manuscript. The funders had no role in the design of the study; in the collection, analyses, or interpretation of data; in the writing of the manuscript; or in the decision to publish the results.
Abbreviations
The following abbreviations are used in this manuscript:
| BS | Basement |
| CTE | Technical Building Code |
| DB-HE | Basic Document HE: Energy Saving |
| EPS | Expanded Polystyrene |
| FF | First Floor |
| GF | Ground Floor |
| HVAC | Heating, Ventilation, and Air Conditioning |
| IAQ | Indoor Air Quality |
| IDA | Indoor Air Quality Category |
| SIGIE | University Geographic Information System |
| VRV | Variable Refrigerant Volume |
| XPS | Extruded Polystyrene |
References
- United Nations Environment Programme. Here’s How Buildings Contribute to Climate Change—and What Can Be Done about It. Available online: https://www.unep.org/news-and-stories/story/heres-how-buildings-contribute-climate-change-and-what-can-be-done-about-it (accessed on 1 August 2026).
- European Commission. Energy Efficiency in Buildings. 2020. Available online: https://commission.europa.eu/document/download/65660913-cecb-4f2f-b34c-c9bbf9bed1af_en (accessed on 1 August 2026).
- Directive (EU) 2024/1275 of the European Parliament and of the Council of 24 April 2024 on the Energy Performance of Buildings (Recast). Off. J. Eur. Union. 2024. Available online: https://data.europa.eu/eli/dir/2024/1275/oj (accessed on 1 August 2026).
- Ministry for the Ecological Transition and the Demographic Challenge. National Integrated Energy and Climate Plan: 2023–2030 Update; MITECO: Madrid, Spain, 2024; Available online: https://www.miteco.gob.es/content/dam/miteco/es/energia/files-1/pniec-2023-2030/PNIEC_2024_240924.pdf (accessed on 1 August 2026).
- Ministry for the Ecological Transition and the Demographic Challenge. MITECO Allocates €200 Million for Air Conditioning and Energy Efficiency Improvements in Schools and Other Public Education Centres. Available online: https://www.miteco.gob.es/es/prensa/ultimas-noticias/2026/junio/el-miteco-destina-200-millones-para-climatizar-y-mejorar-la-efic.html (accessed on 1 August 2026).
- Royal Decree 1027/2007, of 20 July, Approving the Regulation on Thermal Installations in Buildings. Boletín Of. Del Estado 2007, 207. Available online: https://www.boe.es/buscar/pdf/2007/BOE-A-2007-15820-consolidado.pdf (accessed on 1 August 2026).
- Suárez, R.; Fragoso, J. Passive Strategies for Energy Optimization of Social Housing in a Mediterranean Climate. Inf. Constr. 2016, 68, e136. [Google Scholar] [CrossRef]
- Gil Báez, M. Improving the Sustainability of Educational Buildings in a Mediterranean Climate: Practical Application of Natural Ventilation System Design and Calculation . Doctoral Thesis, University of Seville, Seville, Spain, 2020. [Google Scholar]
- Pérez-Carramiñana, C.; González-Avilés, Á.; Galiano-Garrigós, A.; Lozoya-Peral, A. Optimization of Architectural Thermal Envelope Parameters in Modern Single-Family House Typologies in Southeastern Spain to Improve Energy Efficiency in a Dry Mediterranean Climate. Sustainability 2022, 14, 3910. [Google Scholar] [CrossRef]
- Galiano-Garrigós, A.; Domenech-Mataix, M.; González-Avilés, Á.; Rizo-Maestre, C. Evaluation of Energy Performance and Comfort: Case-Study of University Buildings with Design Adapted to Local Climate. Sustainability 2021, 13, 7155. [Google Scholar] [CrossRef]
- García-Solera Vera, J.; Pedreño Muñoz, A.; Jaén i Urban, G.; Domingo Gresa, J.; Oliva Meyer, J.; Marcos Alba, C.; et al. Edificio Germán Bernácer: Del Dibujo y de la Obra; University of Alicante Press: San Vicente del Raspeig, Spain, 2015. [Google Scholar]
- Ministry of Housing and Urban Agenda. Technical Building Code. Basic Document HE: Energy Saving; MIVAU: Madrid, Spain, 2022; Available online: https://www.codigotecnico.org/pdf/Documentos/HE/DBHE.pdf (accessed on 1 August 2026).
- Eduardo Torroja Institute for Construction Sciences. Catalogue of Construction Elements of the CTE . IETcc (CSIC) and Ministry of Housing: Madrid, Spain, 2008. Available online: https://www.codigotecnico.org/pdf/Programas/CEC/CAT-EC-v05.0_MAYO08.pdf (accessed on 1 August 2026).
- Valencian Institute of Building. Use of Building Typologies for Energy Performance Assessment of National Building Stock: Existent Experiences in Spain . IVE: Valencia, Spain, 2011. Available online: https://www.episcope.eu/downloads/public/docs/scientific/ES_TABULA_Report_IVE.pdf (accessed on 1 August 2026).
- Ministry of Housing and Urban Agenda. Technical Building Code. Basic Document SI: Fire Safety; MIVAU: Madrid, Spain, 2025; Available online: https://www.codigotecnico.org/pdf/Documentos/SI/DBSI.pdf (accessed on 1 August 2026).
- Crawley, D.B.; Lawrie, L.K.; Pedersen, C.O.; Winkelmann, F.C. EnergyPlus: Energy Simulation Program. ASHRAE J. 2000, 42, 49–56. [Google Scholar]
- Stazi, F.; Bonfigli, C.; Tomassoni, E.; Di Perna, C.; Munafò, P. The Effect of High Thermal Insulation on High Thermal Mass: Is the Dynamic Behaviour of Traditional Envelopes in Mediterranean Climates Still Possible? Energy Build. 2015, 88, 367–383. [Google Scholar] [CrossRef]
- Ounis, S.; Aste, N.; Butera, F.; Del Pero, C.; Leonforte, F.; Adhikari, R. Optimal Balance between Heating, Cooling and Environmental Impacts: A Method for Appropriate Assessment of Building Envelope’s U-Value. Energies 2022, 15, 3570. [Google Scholar] [CrossRef]
- Espinosa-Fernández, A.; Echarri-Iribarren, V.; Sáez, C. Water-Covered Roof versus Inverted Flat Roof on the Mediterranean Coast: A Comparative Study of Thermal and Energy Behavior. Appl. Sci. 2020, 10, 2288. [Google Scholar] [CrossRef]
Figure 1.
Main façade of the case-study building. The precast concrete panels and low horizontal window bands are clearly visible. Photograph: Miguel Ángel Valero.
Figure 1.
Main façade of the case-study building. The precast concrete panels and low horizontal window bands are clearly visible. Photograph: Miguel Ángel Valero.
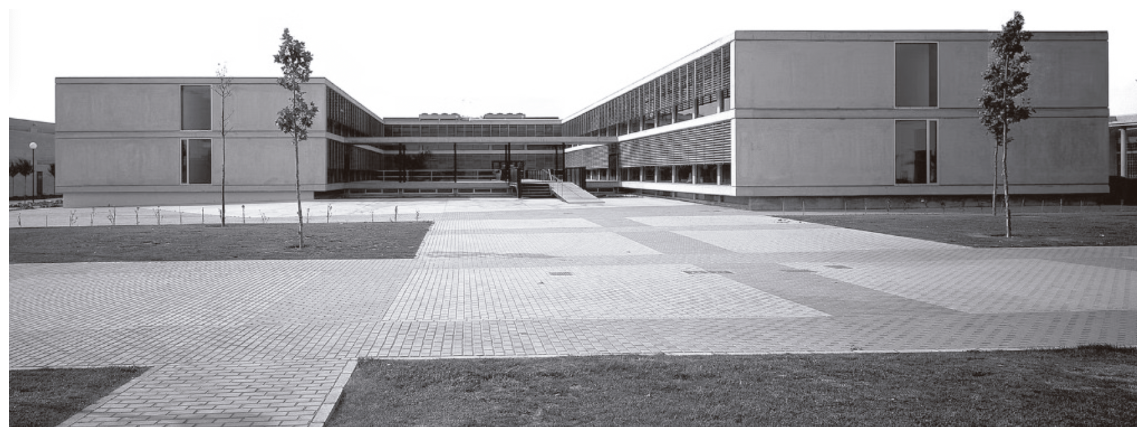
Figure 2.
Graphical representation of the energy model in DesignBuilder v7.0. The three levels, central courtyard, basement setbacks, and shading elements are all visible.
Figure 2.
Graphical representation of the energy model in DesignBuilder v7.0. The three levels, central courtyard, basement setbacks, and shading elements are all visible.
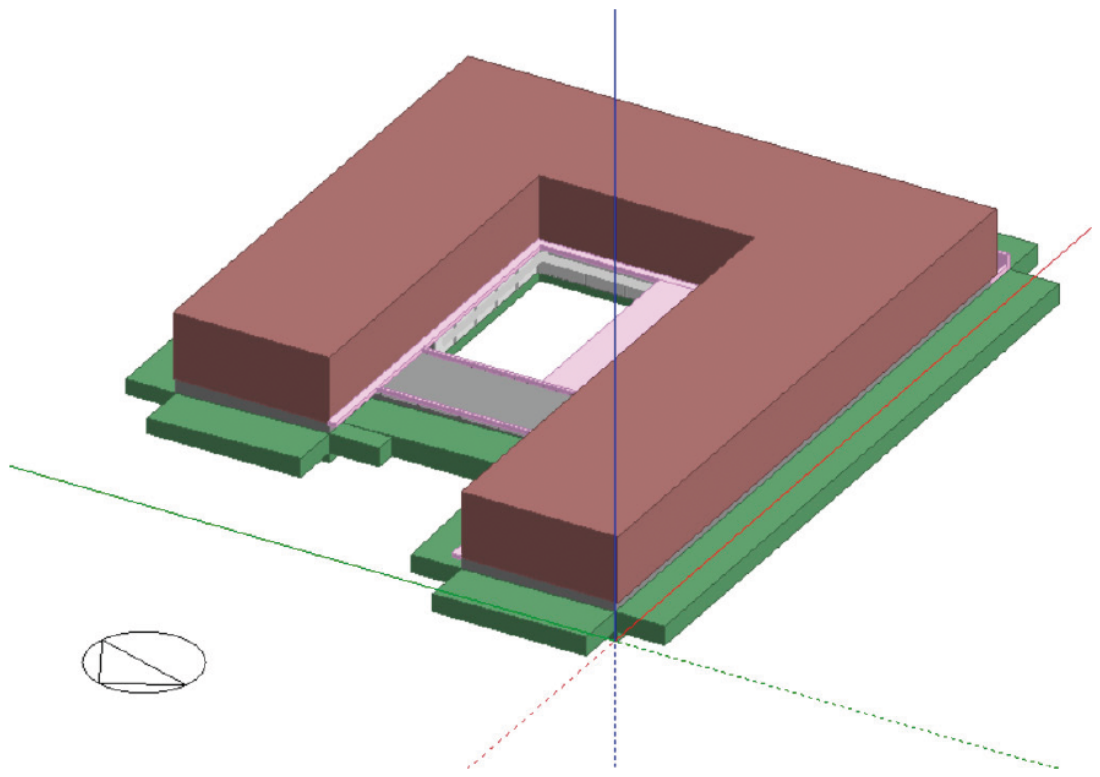
Figure 3.
Annual HVAC demand by floor: heating and cooling in MWh/yr.
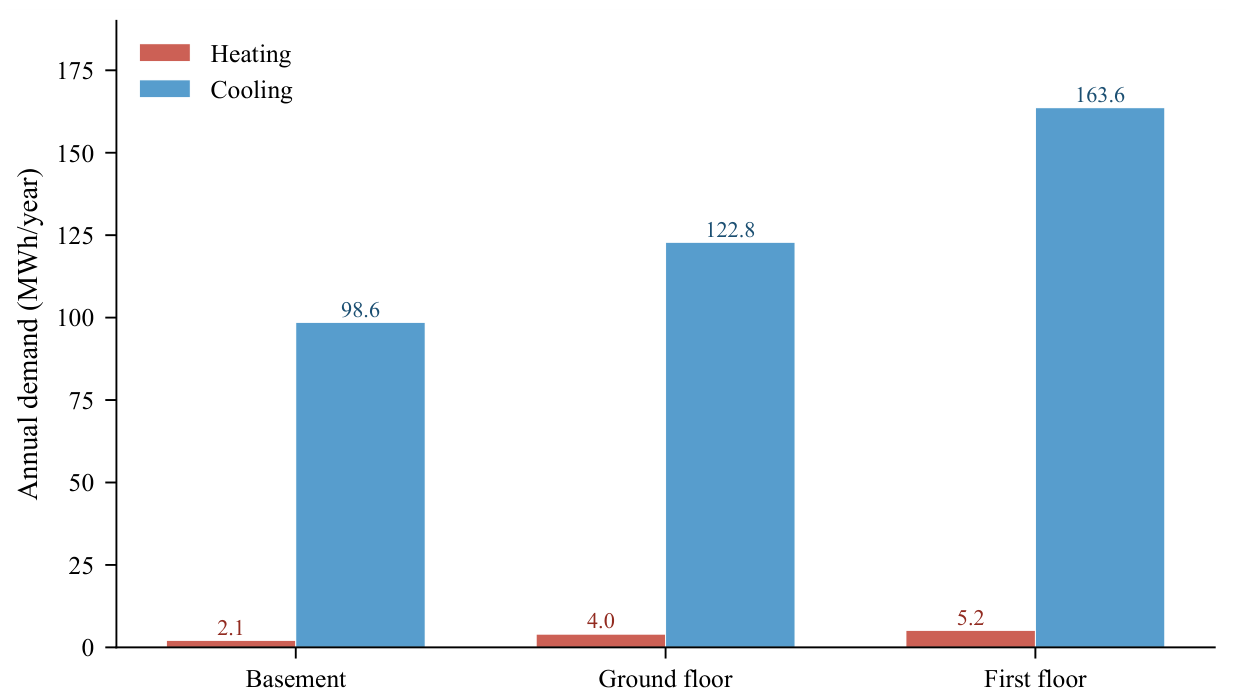
Figure 4.
Annual energy balance by floor (kWh/(m2yr)). Negative values indicate net heat loss through the envelope and ventilation. The first floor shows the worst balance, while the ground floor, with less exposed roof area, shows the smallest losses.
Figure 4.
Annual energy balance by floor (kWh/(m2yr)). Negative values indicate net heat loss through the envelope and ventilation. The first floor shows the worst balance, while the ground floor, with less exposed roof area, shows the smallest losses.
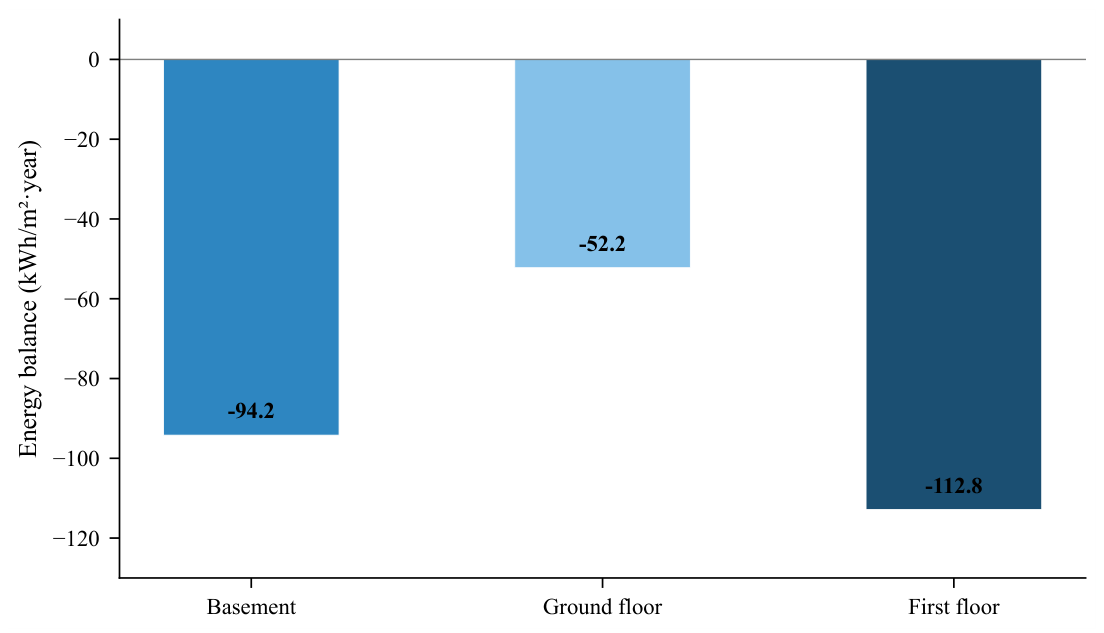
Figure 5.
Breakdown of the annual energy balance by construction element. Ground contact dominates in the basement, glazing on the ground floor, and the roof on the first floor ( kWh/(m2yr)). Ventilation contributes noticeably on all three levels.
Figure 5.
Breakdown of the annual energy balance by construction element. Ground contact dominates in the basement, glazing on the ground floor, and the roof on the first floor ( kWh/(m2yr)). Ventilation contributes noticeably on all three levels.
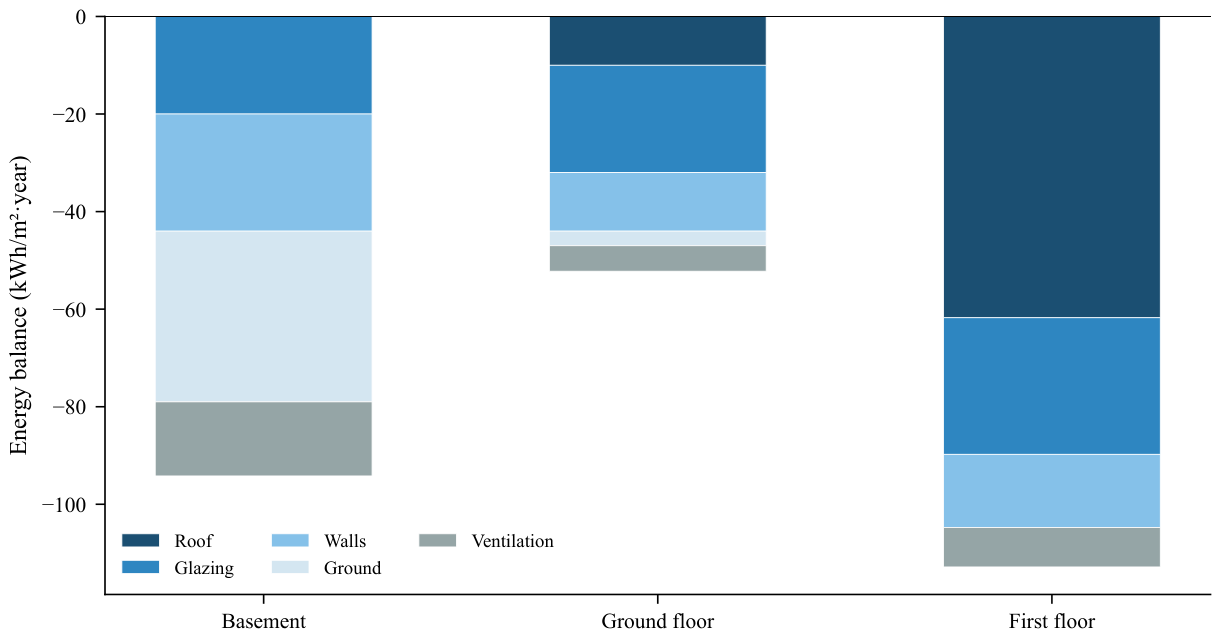
Figure 6.
Typical summer-week cooling demand for the three representative zones on the first floor. Classroom 03 (west, full glazing with louvers) records the highest demand; Classroom 05 (south, smaller glazed area) the lowest.
Figure 6.
Typical summer-week cooling demand for the three representative zones on the first floor. Classroom 03 (west, full glazing with louvers) records the highest demand; Classroom 05 (south, smaller glazed area) the lowest.
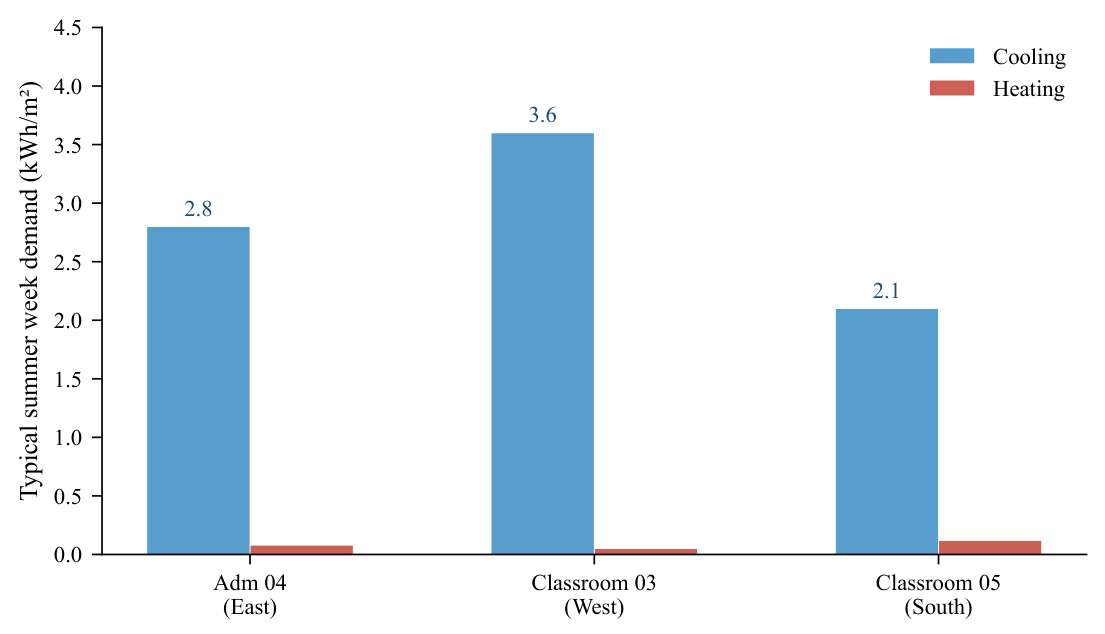
Figure 7.
Effect of the seven retrofit proposals on cooling and heating demand reduction for the first floor. Proposals E (window replacement) and G (vertical louvers) yield the largest cooling reductions; A–C act mainly on heating.
Figure 7.
Effect of the seven retrofit proposals on cooling and heating demand reduction for the first floor. Proposals E (window replacement) and G (vertical louvers) yield the largest cooling reductions; A–C act mainly on heating.
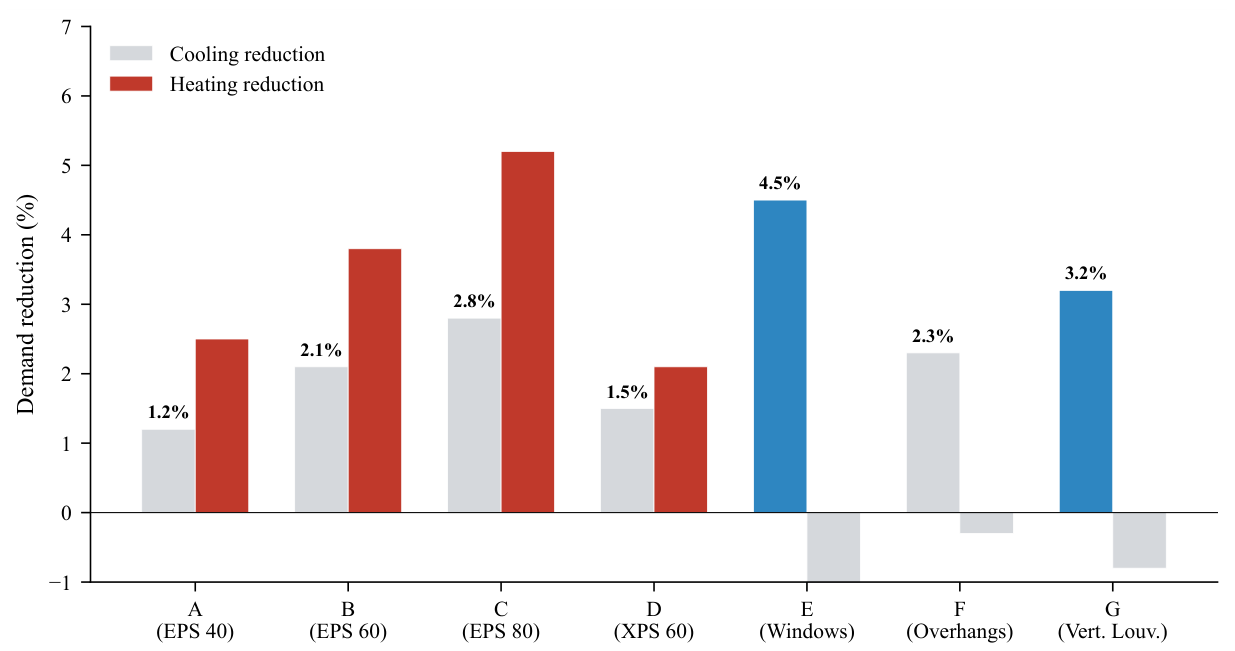
Figure 8.
Comparison of the main energy indicators between the current and improved states on the first floor. The combined measures (E+F+G) cut cooling demand by 6.4% and solar gains by 21.7%, with a minimal heating penalty (+4.6%).
Figure 8.
Comparison of the main energy indicators between the current and improved states on the first floor. The combined measures (E+F+G) cut cooling demand by 6.4% and solar gains by 21.7%, with a minimal heating penalty (+4.6%).
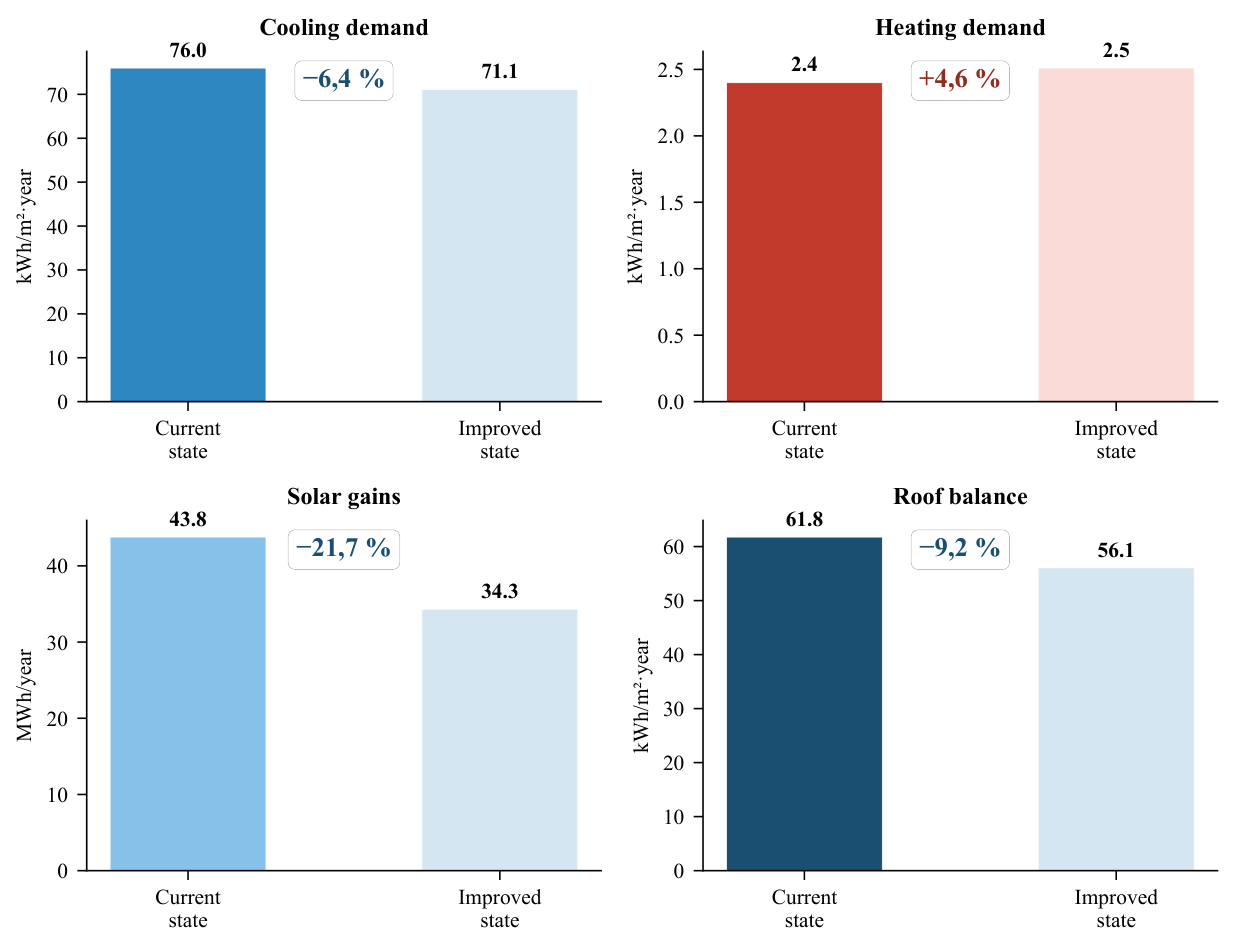
Figure 9.
Monthly HVAC demand profile for the first floor. Cooling is concentrated between May and October, peaking in July (14.8 MWh). Heating appears only from November to March, with a maximum in January (3.5 MWh).
Figure 9.
Monthly HVAC demand profile for the first floor. Cooling is concentrated between May and October, peaking in July (14.8 MWh). Heating appears only from November to March, with a maximum in January (3.5 MWh).
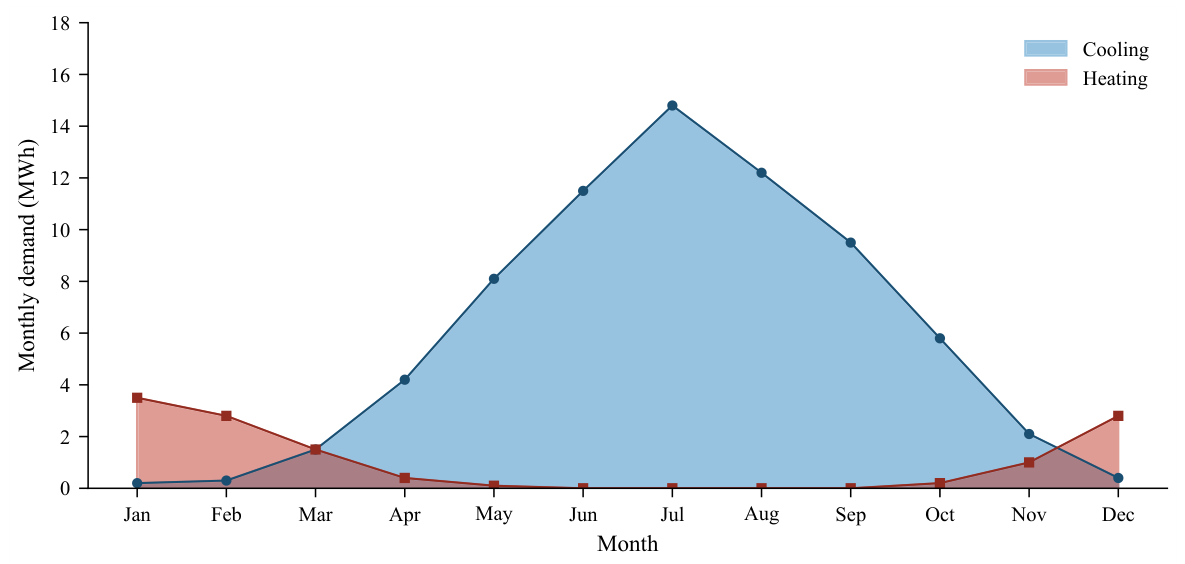
Figure 10.
Graphical summary of the main results of the combined intervention on the first floor. The solar-control strategy (low-E windows, overhangs, and vertical louvers on east and west) prioritises cutting solar gains over blanket insulation upgrades.
Figure 10.
Graphical summary of the main results of the combined intervention on the first floor. The solar-control strategy (low-E windows, overhangs, and vertical louvers on east and west) prioritises cutting solar gains over blanket insulation upgrades.
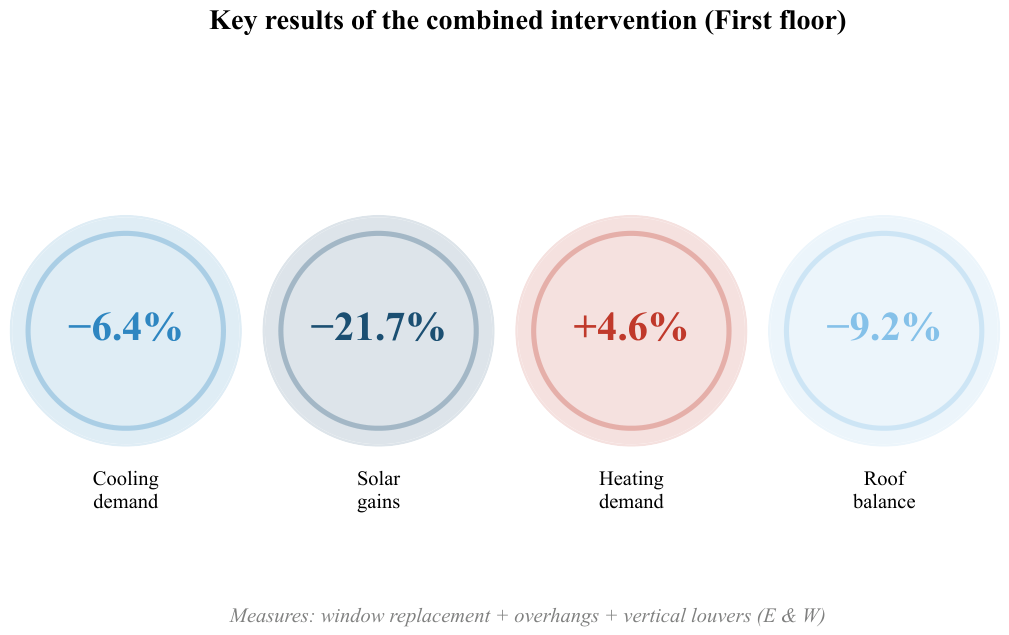

Table 1.
Thermal transmittance of the envelope elements in the current state.
| Element | U (W/(m2K)) | CTE DB-HE1 limit (B4) |
|---|---|---|
| Outer façade wall (BS) | 1.12 | 0.56 |
| Outer façade wall (GF & FF) | 0.97 | 0.56 |
| Courtyard façade wall | 0.61 | 0.56 |
| Roof | 1.23 | 0.44 |
| Ground-floor slab (BS) | 2.15 | 0.69 |
| Windows type 1, 2, & 5 | 3.06 | 2.10 |
| Window type 3 (courtyard façade) | 2.96 | 2.10 |
| Skylights | 5.91 | 2.10 |
BS = basement; GF = ground floor; FF = first floor. CTE limits apply to climate zone B4, section HE1.
Table 2.
Retrofit proposals analysed.
| Proposal | Element | Measure | U final () | g final |
|---|---|---|---|---|
| A | Opaque façades | 40 mm EPS, external | 0.51 | — |
| B | Opaque façades | 60 mm EPS, external | 0.41 | — |
| C | Opaque façades | 80 mm EPS, external | 0.24 | — |
| D | Roof | 60 mm XPS | 0.37 | — |
| E | Windows | Replacement (TB, low-E, Ar) | 1.42 | 0.42 |
| F | Windows | 0.80 m overhangs | n.c. | n.c. |
| G | Louvers | Horiz. → vert. (E&W) | n.c. | n.c. |
n.c. = no change from current state.
Table 3.
Annual HVAC demand by floor, current state.
| Floor | Heating (MWh/yr) | Cooling (MWh/yr) | Cooling (kWh/(m2yr)) |
|---|---|---|---|
| Basement | 2.13 | 98.56 | 44.27 |
| Ground | 4.02 | 122.84 | 57.06 |
| First | 5.17 | 163.64 | 75.99 |
| Total | 11.33 | 385.04 | — |
Cooling per square metre is a floor average; individual zones vary with use and orientation.
Table 4.
Comparison of current and improved states, first floor.
| Indicator | Current state | Improved state | Change |
|---|---|---|---|
| Cooling demand (kWh/(m2yr)) | 75.99 | 71.13 | |
| Heating demand (kWh/(m2yr)) | 2.40 | 2.51 | |
| Solar gains (MWh/yr) | 43.78 | 34.31 | |
| Roof balance (kWh/(m2yr)) |
Disclaimer/Publisher’s Note: The statements, opinions and data contained in all publications are solely those of the individual author(s) and contributor(s) and not of MDPI and/or the editor(s). MDPI and/or the editor(s) disclaim responsibility for any injury to people or property resulting from any ideas, methods, instructions or products referred to in the content. |
© 2026 by the authors. Licensee MDPI, Basel, Switzerland. This article is an open access article distributed under the terms and conditions of the Creative Commons Attribution (CC BY) license (http://creativecommons.org/licenses/by/4.0/).
Copyright: This open access article is published under a Creative Commons CC BY 4.0 license, which permit the free download, distribution, and reuse, provided that the author and preprint are cited in any reuse.