
Submitted:
14 August 2026
Posted:
18 August 2026
You are already at the latest version
Abstract
International quality standards for biocide treated wood were developed in early twentieth century, but none for wood modification, including thermally modified wood (TMW). The Nordic Wood Protection Council (NWPC) offers a regional standard for industrially protected modified wood in the Nordic Countries [1]. Standards for product quality are important components of all mature industries, and ongoing efforts for standard development are currently being made in the wood modification industry [2]. A key component of any quality system is its control parameters, i.e. metrics used for process and product control and product quality improvement. For exterior wood-based products, resistance to fungal attack is the most important quality property. Existing metrics for biocide treated wood are not meaningful for TMW, and different alternative metrics have been discussed in literature. An overlooked aspect in this discussion is variation in product quality, in this case variation in decay resistance. Quality metrics without criteria for acceptable deviations are unfit for purpose, and quality cannot be improved without understanding causes for variation in product quality. Decay resistance of thermally modified wood is widely believed to be related to reduction of wood cell wall moisture capacity. Using a large dataset comprising 9 species, we further explore the presence of decay resistance threshold related to equilibrium moisture content (EMC) and moisture exclusion efficiency (MEE). We also explore the extent and cause of variance in threshold decay resistance. The purpose of the paper is to further develop a scientific basis for using EMC as a technology independent quality parameter in industrial quality management and improvement systems and in the development of international standards.
Keywords:
thermally modified wood
; EMC
; MEE
; quality control
; standard development
; analysis of variance
1. Introduction: EMC and MEE as Criterion for Decay Resistance
Sandberg et. al. [3] notes (2021: 218) how it is important not only for quality control (QC) but also for scientific comparison of thermally modified specimens to be able to quantify the degree of modification achieved. However, for this quantification to be of any use in QC and industrial quality management systems (QMS), it must also be a valid and reliable predictor of decay resistance as well as practical in use.
A significant number of QC parameters, including color, EMC, mass loss, mechanical strength or mass loss, porosity, electron spin resonance (ESR), near infrared (NIR) spectroscopy, nuclear magnetic resonance (NSR), thermal analysis (TA) and X-ray photoelectron spectroscopy (XPS) have been proposed. Many of these studies did not correlate the QC parameter with decay resistance, and none with variation in decay resistance. For reviews of industrial quality control parameters see Sandberg et. al. p. 218 pp [3] and Willems et. al. 20215 [4].
Hill (2006) [5] describes how laboratory decay resistance tests involving different levels of treatment intensity provide data to determine a decay protection threshold, plotting for example weight percentage gain (WPG) (in chemical modification) and mass loss (ML).
Willems et al. (2010) [6] successfully correlated ESR data directly with decay resistance, quantified as maximum median mass loss from basidiomycete exposure, and found separate thresholds for hardwoods and softwoods. These could be used to estimate the durability of thermally modified timber.
With the purpose of establishing a common criterion for decay resistance of modified wood on parameters valid for all modification technologies, Thybring [7] discusses moisture exclusion efficiency (MEE), equilibrium moisture content (EMC) and Anti Swelling Efficiency (ASE). Based on a large literature study, he found that MEE is well correlated with decay resistance of modified wood with around 40% MEE being sufficient for decay resistance. He concluded that MEE appears to provide a threshold for decay resistance unaffected by type of modification.
Many of the suggested QC metrics mentioned further above are not technology independent while others are expensive and impractical for industrial use. EMC and MEE are widely used and well understood parameters, meeting the requirements for a practical predictor of decay resistance and variation:
- Theoretical, causal correlation between modification intensity, EMC, moisture reduction and decay resistance, by means of accessible hydroxyl reduction;
- Extensive empirical research establishing statistical correlation between EMC and mass loss from basidiomycetes exposure;
- Well known and understood metric in the general wood industry;
- Technology independent, and
- Affordable and easy to use in industrial settings.
Measuring sample EMC values is cost efficient and simple. Depending on whether EMC is measured on the sorption or desorption curve, the samples are first dried to zero in a drying chamber and weighed. They are then transferred to a climate chamber calibrated to standard conditions (20oC, 65% RH) and, when at equilibrium, weighed again (sorption curve) or vice-versa (desorption curve) (see, e.g. Hill, p. 31 [5]). Both curves are valid and reliable to use, but it is important to be consistent when first correlating EMC to mass loss from Basidiomycetes exposure during modification process development, and during later manufacturing QC process. Unfortunately, this is sometimes not understood by operators, leading to invalid and misunderstood QC data interpretation. For the same level of modification (i.e. accessible hydroxyl group reduction), EMC measured on the desorption curve will be higher than on the sorption curve.
For QC purposes, Analysis of Variance (ANOVA) plays a critical role. According to familiar Total Quality Management (TQM) principles, production processes inherently display natural variation. Quality process control cannot be established without understanding how process parameters influence process variation. High levels of variation, such as significant differences in decay resistance between different boards in a product sample, are related to poor product quality. Improving quality by reducing high process variation is dependent on understanding the causes of process variation, using techniques such as root cause analysis. It is not possible to improve a process that is not in control and understood, and ANOVA is fundamental to this.
To further develop EMC as a technology independent QC parameter for thermally modified wood, we therefore examine the relationship between modification intensity, EMC and the variation – measured as the standard deviation – in weight loss from basidiomycetes exposure, i.e. if and how the level of variation in decay resistance is influenced by EMC and modification intensity.
2. Materials and Methods
Data on durability performance are from accredited laboratory basidiomycetes decay tests performed by the Danish Technological Institute (DTI) in 2017 and 2025.
The 2017 tests comprised Scots Pine heart wood, Scots Pine sap wood, Radiata Pine, Norwegian Spruce and European Beech. The test was performed according to CEN/TS 15083-1. The 2025 tests comprised Douglas Fir, Western Hemlock, Southern Yellow Pine and Red Oak and were performed according to EN 113-2.
In both cases ageing tests according to both EN 73 (evaporative) and EN 84 (leaching) were performed, and the durability performance, based on maximum median mass loss (ML) according to the standards, was evaluated according to EN 350. The EN 350 standard is presented in Table 1 below.
For basidiomycetes exposure 3 fungi were used: Coniophora puteana, Poria placenta and Trametes versicolor.
Each of the nine species were modified at 3 intensity levels, 170, 180 and 190oC. For each species and intensity level, EMC was measured and durability tests with two ageing procedures with samples sizes of 30, resulting in a total study sample size of 4,860 specimens.
Following the standard, for each test, the specimens with the highest median ML amongst the three fungi to which they were exposed to, determined the durability performance of the test specimens. The mass loss was measured and reported as the median ML in percent, and negative ML (i.e. mass gain) were taken as zero in further calculations.
Modification was carried out at DTI in a lab autoclave enabling the WTT ThermoTreat 2.0pat high pressure thermal modification process in Nitrogen atmosphere (see also Sosins et al. [8]). Low, medium and high intensity modification was performed at 170, 180 and 190 0C, respectively, at pressures 4 bar above boiling point (8,0, 10,0 and 12,5 bar, respectively).
After modification EMC was quantified according to:
where M1 is the oven-dry weight of the specimen after thermal modification and M2 is the weight of the specimen before thermal modification, both at 200C temperature and 65% relative humidity. EMC was determined on the sorption curve, i.e. specimens were first dried down to zero moisture and then moisturized to equilibrium in a climate chamber. This procedure influences moisture behavior so different (representative) samples were used for EMC determination and durability testing.
Moisture Exclusion Efficiency, MEE, was determined according to
where Eu is the EMC of unmodified wood and Em is the EMC of modified wood.
3. Results and Discussion
3.1. Summary Statistics
Table 2 below displays the overall results and summary statistics from the study. The data reflects the expected general relationship between increasing modification intensity, EMC and Mass Loss (ML), such that EMC and ML decrease with increasing intensity. For all species, Durability Class 1 according to Table 1 above, is reached – but at different treatment intensities. In general, the hardwood (Bech, Red Oak) achieve DC 1 at lower intensities than the softwood. SD is the standard deviation in ML. These data were not reported in the first (2017) study, but only in the second (2025) study.
From the summary statistics in table 1 above, at similar EMC values, ML in softwood is higher than in hardwood. A simple t-test comparing EMC values of “hardwood only” and “softwood only” show no significant difference between them at t=1,36 and p=0,09 (one tailed), while the same test for the corresponding ML values confirms a significant difference at t=2,73 and p=0,008 (one tailed). This result replicates the findings of Willems 2010 [6].
This finding does not lend support to the existence of a universal modification intensity at which below fungal attack cannot occur. The decay resistance of modified wood is related to the reduction in maximum moisture capacity of the cell (Thybring 2013 [7]); but if different levels of decay resistance can be related similar moisture capacities (i.e. similar EMCs), then the moisture reduction – decay resistance relationship is more complex.
3.2. Statistical Correlation Between EMC and ML: Modification Threshold Is Complex
Based on the initial observation from the summary statistics, we proceed to examine which statistical model provides most information from the sample data.
Table 3 below presents species dependent examples of the relationship between moisture capacity (EMC) and corresponding moisture capacity reduction (MEE) (equation (2) above) to decay resistance classification (DC) according to EN 350 (see Table 1 further above).
The table makes evident that MEE above at 40% threshold does not necessarily lead to good decay resistance and varies significantly between species. For example, at MEE 42% European Beech achieves DC 1 “very durable” classification, while Norway Spruce achieves DC 4 “slightly durable”; for Southern Yellow Pine, an MEE of 51% leads to DC 3 “moderately durable” performance, requiring a MEE of 55% to achieve a DC 1 “very durable” performance.
To further investigate the nature of the wood moisture capacity (measured as EMC) – decay resistance (measured as ML from fungal attack) relationship we estimated the relationship using simple linear regression with ML as dependent variable and EMC as explanatory variable. Based on the same two variables, the nonlinear model is estimated using a spline regression. The two models are estimated using the SAS version 9.4 standard routines PROC REG and PROC TRANSREG respectively. Figures reported from both models are the F test for model significance, together with its p value, and the R-Square. While the F test and its p value indicate statistical significance, the R-Square indicates practical significance in term of model fit. The higher the R value, the better the model explains (fits) variation in data. These two regressions were performed for all observations (Figure 1a, b hardwood and softwood) and for softwood only (Figure 2a, b).
First we analyzed the total data sample N=54 including both softwood and hardwood. This approach implicitly accepts the conceptual notion suggested in literature that a universal EMC threshold value exists across species. In this scenario, the lower ML values of hardwood for similar EMC values, seen in the summary data as discussed above, are interpreted as noise not providing information.
We apply two different models, a linear and non-linear. The first linear model implicitly rejects (being linear) the notion of a threshold EMC value, while the second non-linear model accepts the notion of a threshold EMC value.
The results in Figure 1a do not reject a linear correlation between EMC and ML, as the variation in the former explains 41.4% of the variation in the latter. Based on the difference in R2 values there is a slight support for the nonlinear spline in Figure1b, indicating a nonlinear correlation of 46.5% in data; however, the difference in R2 is marginal and does not offer clear support for the existence of a universal EMC value at which fungal attack can be prevented, represented by a shift in ML from high to low. This is surprising because a significant body of research claims that such a threshold should exist.
As suggested by the summary statistics, the reason for this may be that a universal EMC threshold does not exist but is more complex, and dependent on other explanatory variables also. In this case, samples containing both softwood and hardwood data are not statistically representative because they belong to different populations and, as a result, cannot be concluded from.
Based on this, in the model below we stratified (separated) softwood and hardwoods and tested the model on the softwood data alone, N=42:
Despite reduced sample size and corresponding reduction in degrees of freedom, the models shown in figure 2 a, b provide high correlation between EMC and ML without loss of statistical significance (P<0.0001). This lends support to the hypothesis that causal correlation between EMC and ML is not universal, but specific to hardwood and softwood, or, more likely based on the data in Table 2, species specific.
Comparing R2 values between Figure 2.a (linear correlation, no threshold value) and Figure 2.b (non-linear correlation with threshold value, variation in data is best explained and predicted by the statistical model in Figure 2.b.
In conclusion, the statistical model of the wood moisture reduction – decay resistance relationship shown in Figure 2.b explains 70.7 percent of decay resistance (ML) variation in softwood species with EMC as the independent variable, at high statistical significance (P<0.0001). Thus EMC is a strong predictor of durability performance when controlled for other independent variables, such as species.
3.3. Analysis of Variance
Critical to quality assurance and quality development is variation in quality, in this case decay resistance.
In table 4 below, some examples from the dataset illustrate the degree of variation, and differences in variation between species. The table presents three species, Southern Yellow Pine (SYP), Douglas Fir (DF) and Western Hemlock (WH), at different modification intensities (Temp). The median ML from fungal attack determines the durability class (DC) after EN 350 (see table 1 further above).
SYP modified at medium intensity (180) obtains a median ML of 4.2, which is durability classification DC 1 “very durable”. However, only 56.7 is DC 1, while the remainder are DC 2 and DC 3. From a quality point of view, the median durability performance is very good but the variation is unacceptable; if deviations above 5% ML, for instance, is considered outside the quality specification (claiming durability class 1 for the product), then almost half of the samples in this batch would have failed. This example illustrates how significant variation in decay resistance can be even at the highest levels of performance (DC 1) and the importance of understanding this variation. Other species, such as Western Hemlock, display much less variation in decay resistance. Table 2 further above reports the standard deviation (SD) in mass loss from fungal decay for four species.

Table 4.
Examples of differences in durability class performance variation.
| Species | Fungi | Temp (oC) |
EMC | Median ML (%) | Std. dev. | % DC 1 | % DC2 | % DC 3 |
|---|---|---|---|---|---|---|---|---|
| SYP | P. Placenta | 180 | 5.42 | 4.2 | 3.8 | 56.7 | 40.0 | 3.3 |
| SYP | P. Placenta | 190 | 4.99 | 0.0 | 1.2 | 96.7 | 3.3 | |
| D. Fir | P. Placenta | 180 | 6.0 | 1.2 | 1.8 | 93.3 | 6.7 | |
| D. Fir | P. Placenta | 190 | 6.0 | 0.0 | 0.29 | 100 | ||
| WH | P. Placenta | 170 | 5.9 | 0.3 | 2.24 | 86.2 | 13.8 | |
| WH | P. Placenta | 180 | 5.7 | 0.0 | 0.8 | 100 | ||
| WH | P. Placenta | 190 | 5.2 | 0.0 | 0.0 | 100 |
To gain further insights into the causes of durability performance variation (SD), we performed a regression analysis with modification intensity (Temperature) and species as explanatory (independent) variables. We also explored the correlation between EMC and variation in decay resistance (SD).
To test for differences between species in variation and effect of temperature simultaneously, we used a multiple regression. The dependent variable was SD, and the explanatory variables were a binary (1-0) indicator for each species (Douglas Fir, Southern Pine, Red Oak; Western Hemlock was used as zero reference and thus omitted) together with temperature as a continuous variable. We report on the regression coefficients together with their P-values for significance.
Table 5 below summarizes the regression analysis model and its results. The overall model explains (R Square) 53 % of total variance in the standard deviation (SD) in ML from fungal attack, with modification temperature and species as independent variables.
Modification intensity (Temp) is negatively related (parameter estimate -0.08) to decay resistance variation (SD) with high significance (P<0.0001). Variation in decay resistance is reduced when modification intensity is increased. In this case modification intensity is modification temperature, but we hypothesize increasing modification time (at constant temperature) or pressure (in pressurized systems) cause similar effects.
We believe that variation in decay resistance is caused by corresponding variations in the wood raw material (assuming homogenous modification process). Species and grades vary greatly in density, heartwood/sapwood composition and, ultimately, hemicelluloses composition. Given the existence of modification thresholds as analyzed above and raw material variation, some samples will reach the threshold for full modification sooner than others. As modification intensity increases, more samples will reach threshold and, in the process, variation in decay resistance is reduced.
Douglas Fir is positively correlated (at 0.49) at the 10% significance level (P 0.08), and Southern Pine positively correlated (at 1.46) with high significance (P<0.0001). This implies that level of variation in DC is related directly to species, with some species, such as Southern Pine, being more heterogeneous than other species such as Western Hemlock and Red Oak.
Taken together, these results suggest that species differ in terms of the variation in their raw material, and that species with high raw material variation may require modification beyond their threshold level for sufficient mean decay resistance threshold, to achieve acceptable levels of variation in quality of modified product.
Loss of mechanical strength and brittleness increase with modification intensity, depending on technology. The additional modification required for high variability species may therefore lead to quality problems related to high modification intensity levels, such as brittleness.
To test for a significant relationship between EMC and SD, we calculated the Pearson correlation coefficient (R) between them, together with the P-value for significance. A significant positive correlation was found. However, when calculating hardwood and softwood observations separately, only the former was significant at the 5 percent level.
Table 6 below summarizes the results from the EMC – standard deviation of ML (SD) statistical correlation model. Similar to the correlation between EMC and durability performance (ML) discussed above in section 3.2, EMC influences SD. Lower EMC leads to lower variation in ML. For the total sample of all 9 species, the EMC explains 34 % (R2) of the variation in ML SD. When the sample is stratified into hardwood and softwood species, the explanatory power increases significantly for hardwood to 59%, while it goes down to 24% for softwood.
Likely this stratification is too broad so that the specific relationship between EMC and ML SD is on the species level, as was the case with the EMC and ML relationship. In the softwood strata, Western Hemlock was included. However, in terms of variation, Western Hemlock displays SD levels comparable to the hardwoods Red Oak and European Beech, so that the hardwood/softwood stratification is not meaningful (representative).
4. Conclusions
Using a large data sample comprising 9 species, this study further examines the statistical relationship between EMC and mass loss from fungal attack (ML) in thermally modified wood (TMW). It also examines the relationship between EMC and variation in ML, necessary to specify, monitor and improve durability quality in an industrial setting.
The study found that there is strong (p < 0.0001) statistical relationship between EMC and ML. The correlation exhibits a threshold for sufficient decay resistance, beyond which there are diminishing increases in durability improvement, as suggested by previous research [6,7].
The exact nature of the correlation and the threshold is different for hardwood and softwood, and very likely species specific, with the threshold – measured as the moisture exclusion efficiency (MEE) - varying between 42 and 55 %, corresponding to an EMC between 7.0 and 5.5.
However, analysis of variance in durability (ML) revealed that for quality purposes, modification to the threshold may be insufficient and additional modification necessary.
Variance in resistance to decay, measured as the standard deviation (SD) in ML, exhibits significant variation. The study found that SD in ML is dependent on species, modification intensity (temperature) and EMC.
Wood is inherently a heterogeneous material, but the degree of heterogeneity varies systematically with species, in terms of density, moisture and hemicelluloses composition. This causes corresponding species-specific levels of variation in the modified product.
Degree of variation in ML correlates strongly with EMC when sample is stratified into hardwood and softwood. We hypothesize that the correlation is species specific because some softwood species, such as Western Hemlock, exhibit properties similar to those of hardwood, and vice versa.
Degree of variation in ML (SD) correlates negatively with modification intensity (temperature) (P<0.0001). If SD at threshold decay resistance is unacceptable for quality, modification intensity beyond the threshold may reduce SD to acceptable quality levels. As an example, Southern Pine reaches durability class 1 threshold at EMC 5.5 with SD 3.8, resulting in almost 50% of the sample being in durability classes 2 and 3. If the Southern Pine is further modified to EMC 5.0, SD is reduced to 1.8.
High degrees of modification are associated with significant mechanical degradation and may be prohibitive for some technologies. In this case, shifting to a species with lower variation in ML is an alternative.
In conclusion, a quality parameter must quantify both the desired quality and the acceptable limits to its variation. For durability performance in TMW, EMC is a technology independent, valid and reliable parameter to establish, monitor and improve decay resistance threshold and variation, when controlled for species. The study could not support earlier research proposing a general threshold, so that QC systems and quality standards should take into account the species specific nature of the decay resistance threshold and variation.
Author Contributions
Statistical analysis: J. Lauridsen. All other work: P. Klaas.
Funding
This research received no external funding.
Data Availability Statement
The raw data set can be required from corresponding author.
Conflicts of Interest
The authors declare no conflicts of interest.
Abbrevations
The following abbrevations are used in this manuscript
| TMW | thermally modified wood |
| NWPC | nordict wood preservation council |
| EMC | equilibrium moisture content |
| MEE | moisture exclusion efficiency |
| ASE | anti swelling efficiency |
| QC | quality control |
| TQM | total quality management |
| QMS | quality management system |
| ESR | electronic spin resonance |
| NIR | near infrared spectroscopy |
| NSR | nuclear magnetic resonance |
| TA | thermal analysis |
| XPS | x-ray photoelectron spectroscopy |
| ANOVA | analysis of variance |
| SD | standard deviation (in mass loss from fungal attack) |
| ML | mass loss |
| DTI | Danish technological institute |
| EN | European norm |
| DC | durability class |
References
- NTR Document no. 1, Part 4; 1. Nordic Wood Preservation Council: Nordic wood protection classes and product requirements for industrially protected wood. Part 4: Modified wood.
- Aro, M.; Barnes, M.; Heyesen, J.; Bartz, K.; Larkin, G.; Mankowski, M.; Arango, R.; Kirker, G.; Presley, G.; Morrell, J.; Taylor, A.; Stirling, R. “Efforts at AWPA to Create a Pathway for Standardization and Incorporation of Thermally Modified Woods”. Proc. 120th Annu. Meet. Am. Wood Prot. Assoc. 2024, 120, 206–208. [Google Scholar]
- Sandberg, D.; Kutnar, A.; Karlson, O.; Jones, D. “Wood modification Technologies”; CRC Press: 6000 Broken Sound Parkway, NW, Suite 300, FL, 2021. [Google Scholar]
- Willems, W.; Lykidis, C.; Altgen, M.; Clauder, L. “Quality control methods for thermally modified wood”. Holzforschung 2015, vol. 69(7), 875–884. [Google Scholar] [CrossRef]
- 5. Hill, C.: “Wood Modification Chemical, Thermal and Other Processes”; John Wiley & Sons Ltd: The Atrium, Southern Gate, Chichester, West Sussex, PO 19 8SQ, England, 2006.
- Willems, W.; Tausch, A.; Militz, H. International Research Group on Wood Protection IRG/WP 10-40508 2010; “Direct estimation of the durability of high-pressure steam modified wood by ESR spectroscopy” in the proceedings IRG Annual Meeting Biarritz, France.
- Thybring, E. “The decay resistance of modified wood influenced by moisture exclusion and swelling reduction”. Int. Biodeterior. Biodegrad. 2013, 82, 87–95. [Google Scholar] [CrossRef]
- Sosins, G.; Grinins, J.; Brazdausks, P.; Zicans, J. “Water-related properties of Wood after Thermal Modification in Closed Process under Pressure in Nitrogen”. Forests 2024, 15, 140. [Google Scholar] [CrossRef]
Figure 1.
a,b: Linear and nonlinear spline curves (Softwood and hardwood together, N=54).
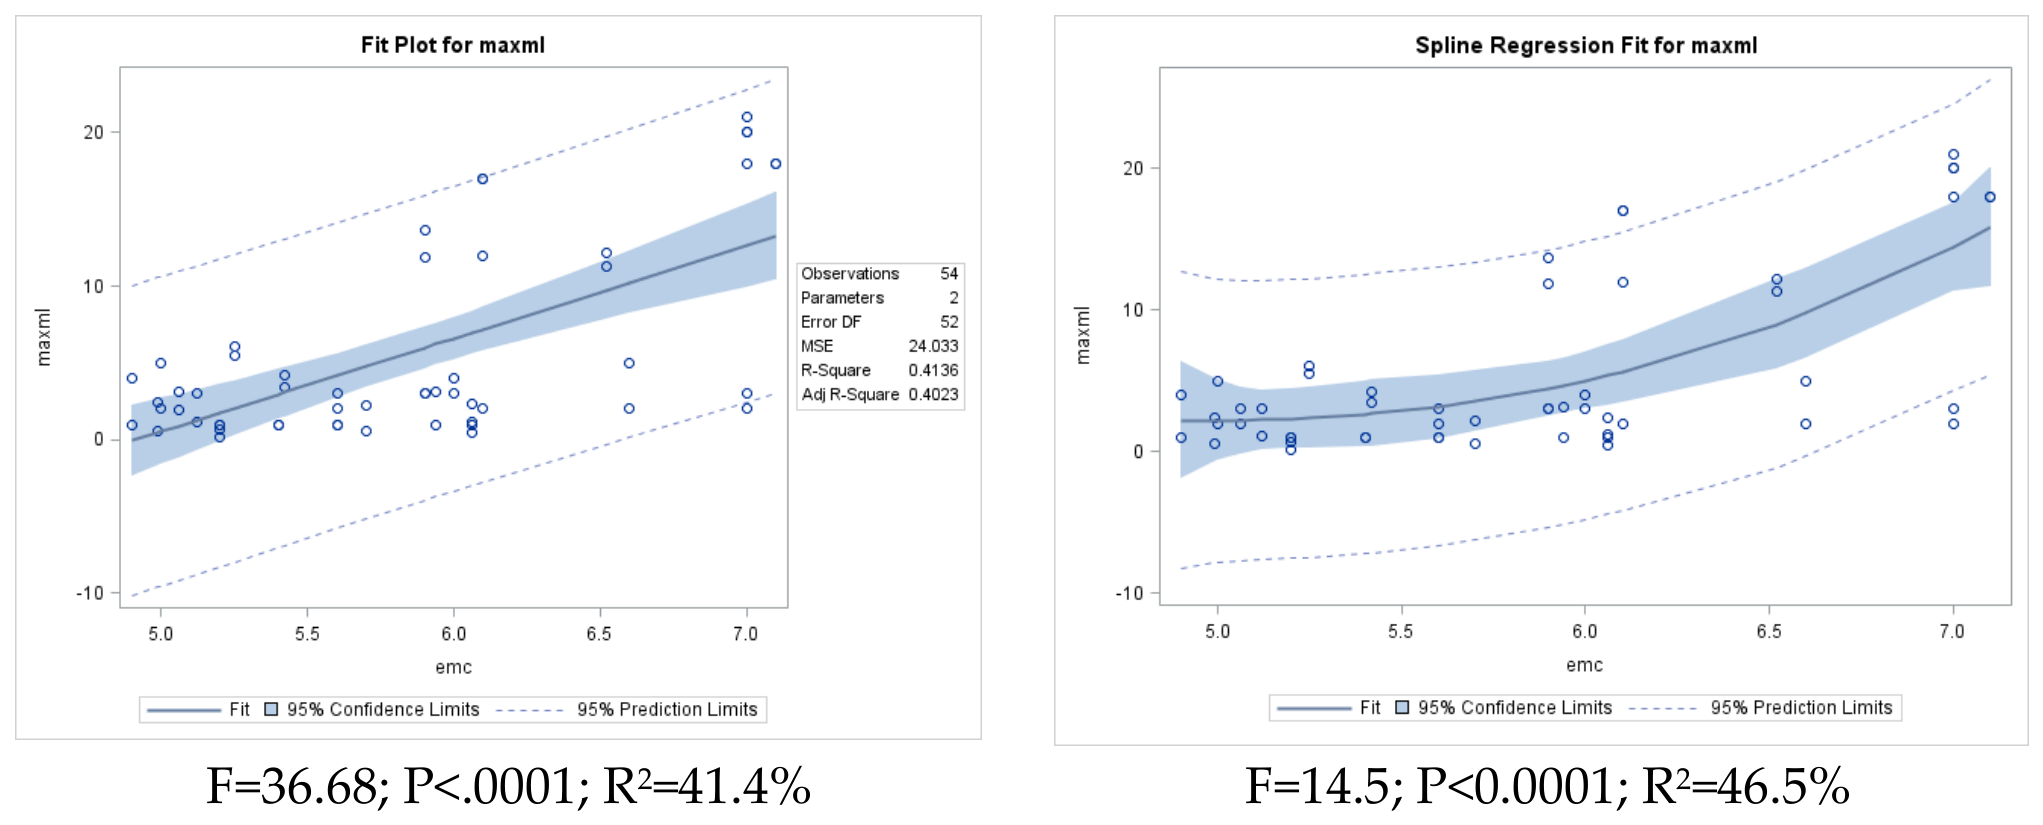
Figure 2.
a,b: Linear and nonlinear spline curves (Softwood only, N=42).
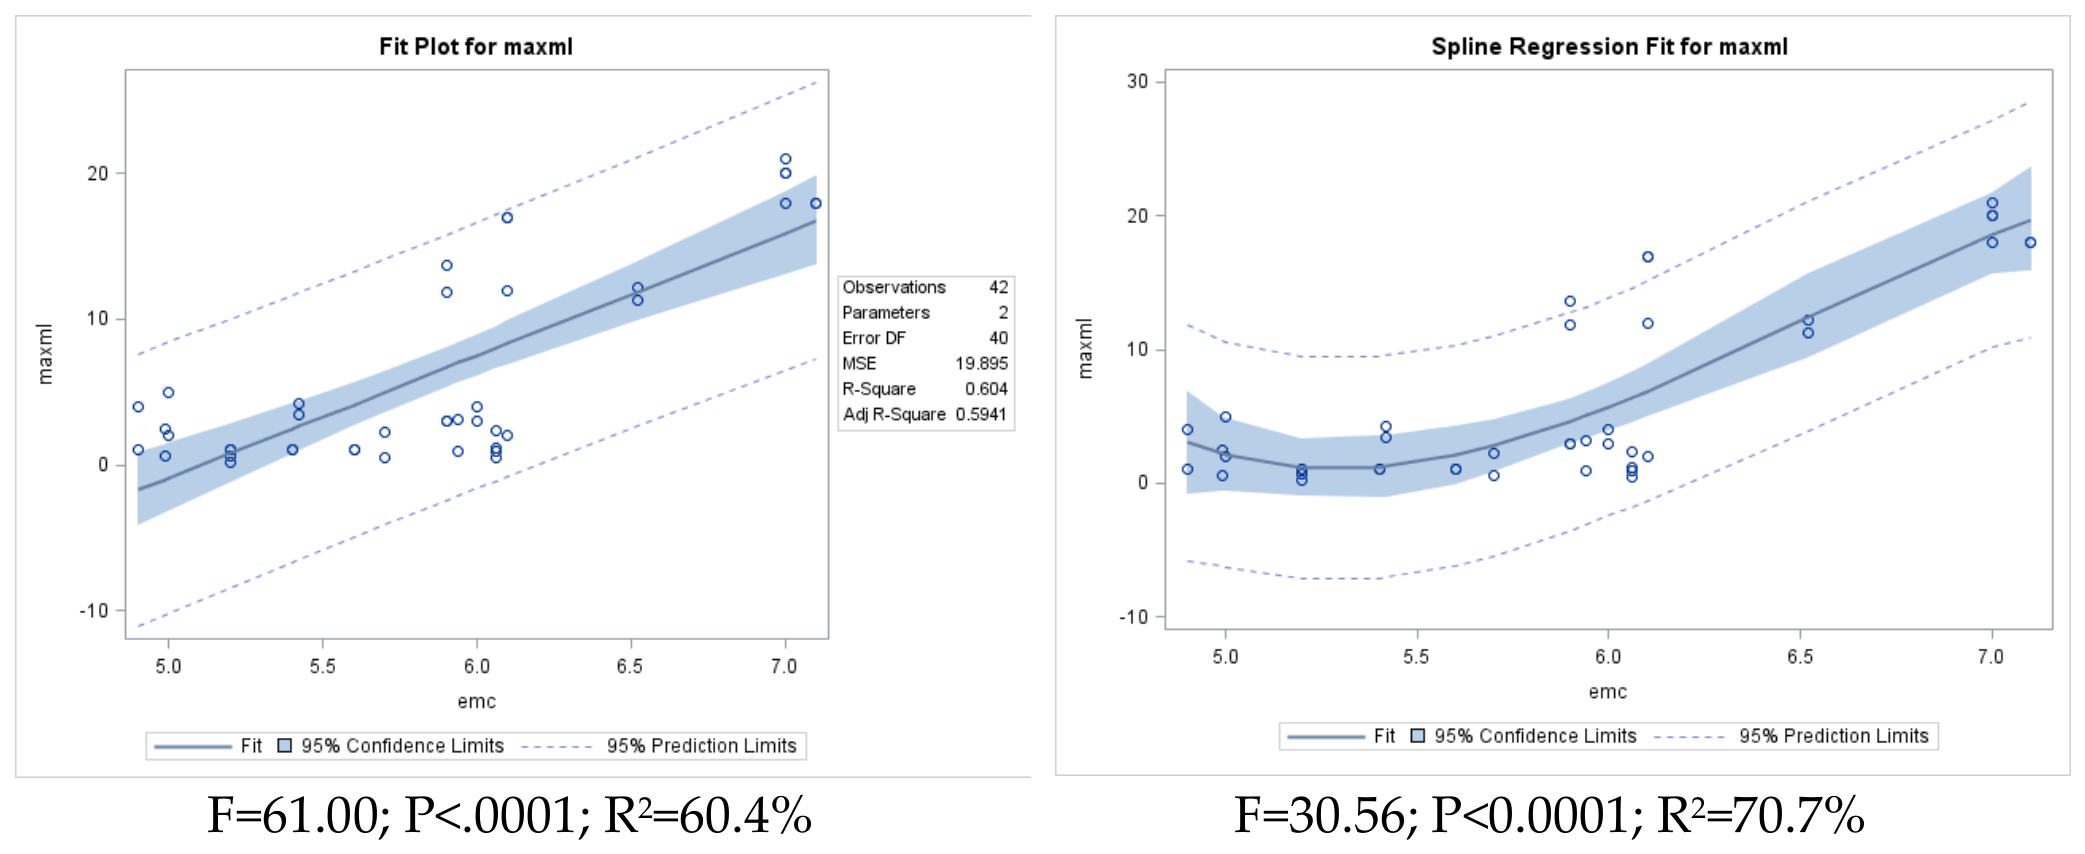
Table 1.
EN 350 Durability Classes (DC) of wood and wood-based materials to attack by decay fungi.
| DC | Description | Mass Loss | Expected service life | Natural durability |
|---|---|---|---|---|
| DC 1 | Very durable | ≤ 5 % | 25+ years | Teak, Ipe |
| DC 2 | Durable | < 5 % - ≤ 10 % | 15-25 years | Oak, Merbau |
| DC 3 | Moderately durable | < 10 % - ≤ 15 % | 10-15 years | Cedar, Larch, D. Fir |
| DC 4 | Slightly durable | < 15 % - ≤ 30 % | 5-10 years | Pine, Spruce, Ash |
| DC 5 | Not durable | < 30 % | 0-5 years | Poplar, Beech |
Table 2.
EMC and mass loss (ML) data from 9 species modified at 3 levels of intensity and using two different ageing procedures.
Table 2.
EMC and mass loss (ML) data from 9 species modified at 3 levels of intensity and using two different ageing procedures.
| EN 84 ageing | Species | Intensity | EMC (%) | ML (%) | SD | |
|---|---|---|---|---|---|---|
| Scots Pine Sap | Low | 7.1 | 18.0 | - | ||
| Medium | 6.1 | 2.0 | - | |||
| High | 5.0 | 5.0 | - | |||
| Beech | Low | 6.6 | 5.0 | - | ||
| Medium | 1.0 | 3.0 | - | |||
| High | 1.6 | 3.0 | - | |||
| Scots Pine Heart | Low | 6.1 | 17.0 | - | ||
| Medium | 5.6 | 1.0 | - | |||
| High | 5.4 | 1.0 | - | |||
| Norway Spruce | Low | 7.0 | 20.0 | - | ||
| Medium | 5.9 | 3.0 | - | |||
| High | 4.9 | 4.0 | - | |||
| Southern Pine | Low | 5.9 | 11.9 | 1.8 | ||
| Medium | 5.4 | 4.2 | 3.8 | |||
| High | 5.0 | 0.6 | 0.4 | |||
| Doughlas Fir | Low | 6.5 | 12.2 | 3.7 | ||
| Medium | 6.1 | 1.2 | 1.8 | |||
| High | 6.1 | 0.5 | 0.4 | |||
| Western Hemlock | Low | 5.9 | 1.0 | 0.7 | ||
| Medium | 5.7 | 0.5 | 0.5 | |||
| High | 5.2 | 0.2 | 0.2 | |||
| Red Oak | Low | 5.3 | 6.1 | 1.6 | ||
| Medium | 5.1 | 3.1 | 0.8 | |||
| High | 5.1 | 3.1 | 0.2 | |||
| Radiata Pine | Low | 7.0 | 21.0 | - | ||
| Medium | 6.0 | 3.0 | - | |||
| High | 5.2 | 1.0 | - | |||
| EN 73 ageing | ||||||
| Scots Pine Sap | Low | 7.1 | 18.0 | - | ||
| Medium | 6.1 | 12.0 | - | |||
| High | 5.0 | 2.0 | - | |||
| Beech | Low | 6.6 | 2.0 | - | ||
| Medium | 7.0 | 2.0 | - | |||
| High | 5.6 | 2.0 | - | |||
| Scots Pine Heart | Low | 6.1 | 17.0 | - | ||
| Medium | 5.6 | 1.0 | - | |||
| High | 5.4 | 1.0 | - | |||
| Norway Spruce | Low | 7.0 | 20.0 | - | ||
| Medium | 5.9 | 3.0 | - | |||
| High | 4.9 | 1.0 | - | |||
| Southern Pine | Low | 5.9 | 13.7 | 3.1 | ||
| Medum | 5.4 | 3.4 | 1.0 | |||
| High | 5.0 | 2.4 | 0.3 | |||
| Douglas Fir | Low | 6.5 | 11.3 | 3.3 | ||
| Medium | 6.1 | 2.4 | 0.5 | |||
| High | 6.1 | 1.0 | 0.3 | |||
| Western Hemlock | Low | 5.9 | 3.1 | 0.7 | ||
| Medium | 5.7 | 2.2 | 0.8 | |||
| High | 5.2 | 0.6 | 0.3 | |||
| Red Oak | Low | 5.3 | 5.5 | 1.2 | ||
| Medium | 5.1 | 2.0 | 0.8 | |||
| High | 5.1 | 1.2 | 0.3 | |||
| Radiata Pine | Low | 7.0 | 18.0 | - | ||
| Medium | 6.0 | 4.0 | - | |||
| High | 5.2 | 1.0 | - | |||
| Summary statistics | Softwood and Beech | |||||
| Overall mean | 5.8 | 5.6 | ||||
| Mean EN 84 | 5.8 | 5.6 | ||||
| Mean EN 73 | 5.8 | 5.7 | ||||
| Hardwood only | 5.8 | 3.1 | ||||
| Softwood only | 5.9 | 6.3 | ||||
Table 3.
Species dependent modification thresholds.
| Species | Aeging | Intensity | ML | EMCu | EMCm | MEE | DC |
|---|---|---|---|---|---|---|---|
| Southern Yellow Pine | EN 73 | 170 oC | 13.7 % | 12.0 | 5.9 | 51 | DC 3 |
| Southern Yellow Pine | EN 73 | 180 oC | 3.4 % | 12.0 | 5.4 | 55 | DC 1 |
| Douglas Fir | EN 73 | 180 oC | 2.4 % | 12.0 | 6.1 | 49 | DC 1 |
| European Beech | EN 73 | 170 oC | 2.0 % | 12.0 | 7.0 | 42 | DC 1 |
| Norway Spruce | EN 73 | 170 oC | 20.0 % | 12.0 | 7.0 | 42 | DC 4 |
Table 5.
Modification Intensity (Temp) and Species influence on variation in decay resistance (standard deviation of ML (SD)).
Table 5.
Modification Intensity (Temp) and Species influence on variation in decay resistance (standard deviation of ML (SD)).
| Regression Analysis Mass Loss Std. Deviation (SD) dependent on modification intensity (Temperature) and Species | |||||
| Number of observations read | 162 | ||||
| Number of observations used (N) | 72 | ||||
| Number of observations with missing values | 90 | ||||
| Analysis of Variance | |||||
| Source | DF | Sum of Sq | Mean Sq | F value | Pr>F |
| Model | 4 | 53.78 | 13.45 | 18.93 | <0.0001 |
| Error | 67 | 47.58 | 0.71 | ||
| Corrected total | 71 | 101.36 | |||
| Root MSE | 0.84 | R-Square | 0.53 | Dependent Mean | 1.05 |
| Coeff. Var | 80.59 | Adj. R-square | 0.50 | ||
| Parameter Estimates | |||||
| Variable | DF | Parameter estimate | Std. Error | T Value | Pr> |t| |
| Intercept | 1 | 14.16 | 2.21 | 6.44 | <0.0001 |
| Temp | 1 | -0.08 | 0.01 | -6.21 | <0.0001 |
| Douglas Fir | 1 | 0.49 | 0.28 | 1.75 | 0.08 |
| Southern Pine | 1 | 1.46 | 0.28 | 5.21 | <0.0001 |
| Red Oak | 1 | -0.04 | 0.28 | -0.14 | 0.89 |
Table 6.
EMC influence on decay resistance variation (standard deviation of ML (SD)).
| All species | Hardwood only | Softwood only | |||
|---|---|---|---|---|---|
| R2 | 0.34 | R2 | 0.59 | R2 | 0.24 |
| P | 0.0033 | P | 0.0097 | P | 0.0753 |
| N | 72 | N | 18 | N | 54 |
Disclaimer/Publisher’s Note: The statements, opinions and data contained in all publications are solely those of the individual author(s) and contributor(s) and not of MDPI and/or the editor(s). MDPI and/or the editor(s) disclaim responsibility for any injury to people or property resulting from any ideas, methods, instructions or products referred to in the content. |
© 2026 by the authors. Licensee MDPI, Basel, Switzerland. This article is an open access article distributed under the terms and conditions of the Creative Commons Attribution (CC BY) license (http://creativecommons.org/licenses/by/4.0/).
Copyright: This open access article is published under a Creative Commons CC BY 4.0 license, which permit the free download, distribution, and reuse, provided that the author and preprint are cited in any reuse.