

Submitted:
15 August 2026
Posted:
18 August 2026
You are already at the latest version
Abstract
This study innovatively integrates the AHP-TOPSIS comprehensive evaluation method the Coefficient of Determination with model construct(CF)-Random Forest(RF) toadual dimensional "value-risk" assessment framework. This enables a systematic integrated evaluation of the value and geological hazard risks asso-ciated with industrial heritage sites from the Third Front Construction. Taking Lizhou District, Guangyuan City as a case study the research first identified through heritage value quantification and geological hazard zoning, sites “high-value” sites. Subsequently on five “high-risk” “high-value” heritage, and eight “low-risk”, four categories of conservation units were delineated based the “value-risk” matrix, proposing differentiated resilience enhancement pathways. This research not only provides a basis for the scientific conservation and adap-tive reuse of Third Front heritage in Lizhou District but also offers an operational theoretical and practical paradigm for the adaptive management of industrial her-itage in similar mountainous regions.
Keywords:
Third Front industrial heritage
; heritage value assessment
; geological hazard risk assessment
; "value-risk" matrix
; resilience enhancement
1. Introduction
1.1. Research Background
Currently, the protection of Third Front industrial heritage nationwide faces common challenges. On the one hand, traditional heritage value assessment systems primarily emphasize historical, cultural, and technical attributes, often failing to effectively account for the persistent and site-specific threats posed by geological hazards. On the other hand, existing conservation practices tend to rely on static restoration and exhibition-oriented approaches, lacking systematic response mechanisms to address dynamic risks in com-plex mountainous environments.
Against this backdrop, the core challenge in conserving Third Front industrial heritage lies not only in articulating its historical and socio-cultural significance, but also in establishing an evaluative framework capable of systematically integrating heritage value with heterogeneous risk conditions. Existing studies often treat heritage value assessment and geological hazard analysis as parallel yet disconnected processes, resulting in conservation strategies that are either value-oriented but risk-insensitive, or risk-driven yet detached from heritage significance. Such fragmentation significantly constrains the practical applicability of assessment outcomes, particularly in mountainous regions where industrial heritage is deeply embedded within dynamic and uncertain hazard systems.
Therefore, developing a coupled “value–risk” evaluation framework becomes essential for translating abstract heritage significance into actionable conservation priorities under conditions of uncertainty and limited resources. By simultaneously revealing both the intrinsic importance of heritage sites and their exposure to geological hazards, such a framework enables differentiated, resilience-oriented decision-making and provides a methodological foundation for adaptive heritage management.
Within this analytical context, Lizhou District in Guangyuan City serves as a highly representative case for empirical investigation. As an important spatial carrier of Third Front industrial heritage, the district exhibits both concentrated historical value and pronounced geological hazard mechanisms typical of the Qinba mountainous region, making it an appropriate testing ground for validating the proposed value–risk evaluation framework.
1.2. Literature Review
(1) Research on Industrial and Third Front Heritage. Academic studies on the Third Front Construction have evolved from early macro-historical analyses towards mi-cro-level heritage conservation and utilisation. Researchers generally acknowledge that Third Front industrial heritage not only embodies unique "institutional value" and in-dustrial civilisational memory[1,2] but also exhibits spatial characteristics of "mac-ro-level dispersion and micro-level concentration"[3]. Regarding the development of evaluation frameworks, existing studies on industrial heritage generally converge on four core value dimensions: historical value, technological value, socio-cultural value, and ecological-economic value[4,5]. These dimensions provide a widely accepted basis for identifying both the intrinsic significance and reuse potential of industrial heritage sites. However, empirical applications indicate that such value-oriented frameworks of-ten operate as parallel indicator systems and seldom incorporate site-specific risk condi-tions, particularly in hazard-prone environments[6,7]. As a result, their capacity to sup-port differentiated and resilience-oriented conservation decision-making remains limited. Concurrently, scholars widely emphasise the typological distinctiveness of in-dustrial heritage, arguing that assessment indicators should reflect sector-specific char-acteristics rather than adopt a uniform evaluative framework[8]. In this context, Third Front industrial heritage—shaped by wartime defence logic and characterised by moun-tainous siting, spatial dispersion, and concealment—has prompt-ed attempts to incorpo-rate indicators such as environmental adaptability and physical integrity into value as-sessment systems[9,10]. However, these approaches remain largely value- or environ-ment-oriented and seldom integrate dynamic hazard risks, limiting their effectiveness in guiding resilience-oriented conservation in mountainous regions[11].
(2) The evolution of disaster risk assessment techniques. Given the prevalence of Third Front heritage sites in mountainous regions with complex geological environments, pre-cise risk assessment is paramount. Traditional risk assessments predominantly employ the Analytic Hierarchy Process (AHP) and information content models, widely applied in macro-regional zoning[12,13]. In recent years, with advances in artificial intelligence, machine learning algorithms such as Random Forest (RF) and Support Vector Machines (SVM) have been introduced to this field, significantly enhancing prediction accuracy for disaster susceptibility, including landslides and debris flows[14,15].The XGBoost model demonstrates notable advantages in disaster prediction within complex moun-tainous terrain due to its robust generalisation capability for non-linear geological data and computational efficiency. Research indicates that this model not only effectively prevents overfitting through the introduction of regularisation terms but also exhibits superior assessment accuracy and robustness compared to traditional SVM and logistic regression models when processing multi-source heterogeneous data such as landslides and floods[16,17] .Concurrently, XGBoost quantifies the feature importance of various disaster-inducing factors, offering enhanced interpretability for elucidating disaster causatio[18,19]. Furthermore, the introduction of the "disaster chain" perspective re-veals the cascading effects between extreme rainfall and geological hazards, providing novel insights for identifying systemic risks to linear or clustered heritage sites[20,21].
(3) Resilience theory applied to heritage conservation. Resilience theory has propelled heritage conservation from static preservation towards dynamic adaptation. Research perspectives have expanded from singular engineering disaster resilience to encompass social and ecosystem resilience, emphasising the adaptive and restorative capacity of heritage sites when confronting external shocks[22,23]. At the practical level, scholars globally have proposed enhancing ecological resilience through low-intervention land-scape design strategies, such as constructing multi-stakeholder actor networks to strengthen social-institutional resilience[24], confirming the positive effects of heritage conservation on enhancing regional overall resilience[25].
In summary, while existing research has yielded substantial outcomes in value extrac-tion, risk assessment techniques, and resilience theory, limitations persist: firstly, frag-mented evaluation perspectives often separate passive disaster risk assessments from proactive heritage value evaluations, lacking integrated decision models that couple "value-risk"; secondly, regional specificity remains inadequate, with limited systematic studies targeting high-risk zones such as northern Sichuan. Consequently, this paper seeks to construct a dual-dimensional evaluation model integrating value and risk, aim-ing to provide more precise resilience enhancement pathways for the protection of Third Front industrial heritage in complex environments.
1.3. The "Risk-Value-Resilience" Logical Framework
Geological hazard risks, heritage value, and systemic resilience do not exist in isolation but form a dynamically evolving closed-loop system. Firstly, risk exerts a "coercive ef-fect" on value. Geological hazards such as landslides and debris flows directly threaten the physical survival and cultural transmission of Third Front industrial heritage through a three-tier transmission pathway: "physical carrier destruction → societal function dis-integration - collective memory dissolution". Secondly, value exerts a "driving effect" on resilience requirements. The heterogeneity of heritage value determines the marginal benefits of conservation investment. High-value heritage sites, often bearing irreplacea-ble historical memory, drive demands for higher-specification resilience defences, whereas ordinary heritage tends towards adaptive maintenance. Finally, resilience en-hancement produces a "feedback effect" on the system. By constructing engineering re-silience, ecological resilience, and social resilience, the physical vulnerability of herit-age sites can be effectively reduced, disrupting risk transmission chains and thereby en-abling the sustainable continuation of heritage value within a dynamic risk environment. Based on this logic, this paper constructs a two-dimensional "value-risk" coupling eval-uation model, aiming to identify the value-risk characteristics of different heritage sites and match them with differentiated resilience enhancement strategies.
2. Methods and Data
2.1. Study Area
Lizhou District in Guangyuan City, designated as a crucial strategic hinterland in north-ern Sichuan during the Third Front Construction period, is located at the transitional zone between the Qinba mountainous region and the Sichuan Basin. This distinctive geographical setting—characterised by complex mountainous terrain and strategic re-moteness—shaped its unique historical mission and endowed the area with abundant Third Front industrial heritage resources.
Since the full launch of the Third Front Construction in 1964, guided by the de-fence-oriented spatial principles of “mountain proximity, dispersion, and concealment,” the state concentrated a series of key projects centred on military industries in Guang-yuan. Leveraging the Baocheng Railway and the Jialing River waterway, the region formed a strategic material transport corridor linking Northwest and Southwest China, thereby establishing a vital support system for the wartime economy and national de-fence security.This historical process endowed Lizhou District with two defining char-acteristics: the embedding of heritage spaces within mountainous terrain and extreme environmental sensitivity. Most industrial relics are distributed along steep river valley slopes in the northern segment of the Longmen Mountain Fault Zone, presenting a unique topographical pattern where factories are embedded within mountain bodies. While this mountain-dependent spatial layout aligned with wartime defense site selec-tion criteria, it also introduced significant geological challenges for subsequent conser-vation and renewal efforts. Additionally, the area features a high proportion of fractured rock formations and highly concentrated spatiotemporal rainfall patterns, making it prone to geological hazards like landslides and debris flows. Over the past decade, the annual incidence rate of geological disasters in the region has shown an upward trend.
Lizhou District is situated at the northern edge of the Sichuan Basin, along the upper reaches of the Jialing River, where Sichuan, Shaanxi, and Gansu provinces converge, forming the north gateway to Sichuan (Figure 1) The terrain slopes from higher eleva-tions in the northwest to lower ones in the southeast, featuring diverse landforms. It ex-periences a subtropical humid monsoon climate with distinct seasons, making it suitable for agriculture and habitation.
2.2. Data Sources
This study employs multi-source data encompassing three major categories: industrial heritage data, geographic environment data, and geological hazard data. All data were unified to the CGCS2000 coordinate system and Gauss-Krüger projection zone. Spatial registration and rasterization were performed in the ArcGIS platform, with a uniform resolution of 30m × 30m.
Industrial heritage data were derived from archival sources such as "Third Front Con-struction and Western Development," "Third Front Construction in Sichuan Province," and "A Brief History of Third Front Construction in Sichuan," supplemented by field surveys, ultimately identifying 24 research samples. Archival materials and acquired heritage attribute data encompass historical evolution and functional uses. Field surveys documented architectural structures, preservation status, and current utilization through surveying and recording. To determine AHP weights, questionnaires were distributed to 20 experts in cultural heritage conservation and geological engineering. Additionally, 150 valid questionnaires were distributed and collected in representative factory-area communities to quantify the heritage's socio-emotional value.
Geographical environment data were used to support the selection of geological hazard risk assessment factors. Detailed data sources and corresponding indicators are summa-rised in Table 1.
Geological hazard data consists of historical disaster points sourced from the Resource Environment Science and Data Center, totaling 272 locations within the study area. These disaster points serve as the positive sample set for subsequent model training.
2.3. Research Methodology
To achieve an integrated evaluation of heritage value and geological hazard risk, this study adopts a multi-method analytical framework combining value assessment, risk modelling, and result coupling. Each method is selected to address a specific analytical objective, while their sequential integration enables a comprehensive and operational evaluation outcome.
Specifically, the heritage value assessment aims to identify the intrinsic significance and reuse potential of Third Front industrial heritage sites, providing the foundational prior-itisation basis. Geological hazard risk assessment focuses on quantifying site-specific hazard exposure and environmental vulnerability. By coupling the outputs of these two analytical modules, the proposed framework facilitates differentiated and resili-ence-oriented conservation decision-making under conditions of uncertainty.
2.3.1. AHP-TOPSIS Comprehensive Evaluation
The Analytic Hierarchy Process (AHP) was employed to determine indicator weights in the heritage value assessment. This method is particularly suitable for evaluating indus-trial heritage, as it allows expert knowledge and qualitative judgement to be systemati-cally transformed into quantitative weights when dealing with multidimensional value systems that include both tangible and intangible attributes [27]. Based on the weights derived from AHP, the Technique for Order Preference by Similarity to Ideal Solution (TOPSIS) was applied to rank heritage sites. TOPSIS evaluates each site by measuring its relative closeness to an ideal solution, thereby enabling direct comparison among sites with heterogeneous value profiles. The combination of AHP and TOPSIS ensures both rational weight determination and objective ranking, producing a comprehensive value index for subsequent value–risk coupling. The core steps are as follows:
First, experts construct a judgement matrix using a 1–9 scale, calculate the weight vector, and verify consistency (CR < 0.1).
Second, the original data matrix of m heritage sites and n indicators is normalised and multiplied by the AHP-derived weights to obtain a weighted normalised matrix.
Third, the positive and negative ideal solutions are determined:
where and denote benefit-oriented and cost-oriented indicators, respectively.
Finally, the Euclidean distances and relative closeness are calculated:
where , and a higher value indicates a higher comprehensive heritage value.
2.3.2. Certainty Factor (CF) Model
The Certainty Factor (CF) model is a statistical method based on conditional probability, widely used to quantify the contribution of individual environmental factors to geological hazard occurrence [28]. Its primary advantage lies in its strong interpretability, as it explicitly reflects the direction and magnitude of each factor’s influence under uncertainty.
In this study, the CF model is used to identify key hazard-inducing factors and to reveal their relative certainty levels. A positive CF value indicates that a factor category increases hazard occurrence probability, while a negative value indicates suppression[29]. Its formula is:
where represents the proportion of disaster area within a factor category, and represents the overall disaster proportion in the study area.
For multi-factor integration, CF values are combined to obtain a composite certainty score :
The CF model thus provides a physically interpretable foundation for subsequent machine learning coupling.
2.3.3. CF-RF Coupled Model
The Random Forest (RF) model is an ensemble learning algorithm that integrates multiple decision trees and exhibits strong resistance to overfitting, making it suitable for modelling complex nonlinear relationships among hazard-influencing factors[30]. However, RF alone may lack explicit geophysical interpretability.
To address this limitation, the CF–RF coupled model integrates the CF-derived composite certainty score S_CFas an additional feature. This strategy enables the RF model to prioritise factors with strong hazard relevance, improving both training efficiency and prediction accuracy [31]. The coupled model is expressed as:
where denotes the number of decision trees and is the prediction function of the t-th tree. This coupling preserves the interpretability of the CF model while leveraging the nonlinear learning capability of RF.
2.3.4. CF-SVM Model
The Support Vector Machine (SVM) is well suited for classification problems with small samples and high-dimensional feature spaces [32]. In this study, CF values are incorporated into the SVM framework to enhance its generalisation capability.
Specifically, the composite CF value is used as a weighting factor to guide support vector selection, allowing the decision boundary to preferentially pass through low-certainty regions while avoiding high-certainty hazard areas [33]. The optimization objective function for this coupled model is as follows:
where is the normalised CF weight of sample i. This coupling enhances the alignment between statistical classification and geological hazard mechanisms.
2.3.5. CF-XGBoost Model
XGBoost is a gradient boosting algorithm known for its efficiency, flexibility, and strong generalisation performance [34] [35]. In the CF–XGBoost coupled model, CF values are introduced as meta-features to guide the boosting process toward hazard-sensitive patterns.The objective function at iteration t is expressed as:
where and are first- and second-order gradients, and is the regularisation term. Through this coupling, XGBoost more effectively captures complex dependencies between geological hazards and environmental factors.
3. Establishing the "Value-Risk" Evaluation Metric System
3.1. Value Evaluation System
3.1.1. Value Evaluation Framework Construction
In constructing the value evaluation indicator system for Guangyuan's Third Front industrial heritage, this study systematically referenced core frameworks and distinctive experiences from domestic and international industrial heritage evaluation research.
Domestically, the Guidelines for Heritage Value Evaluation in China (Trial) provided a reference framework for the preliminary selection of secondary indicators related to historical value, technological value, and socio-cultural value, such as historical representativeness, technological integrity, and social influence.
At the international level, the study incorporated the social value orientation emphasised in the Nizhny Tagil Charter, particularly indicators associated with industrial heritage identity, collective memory, and educational significance. In addition, ecological restoration and landscape integration indicators were informed by practical experiences from Germany’s Ruhr industrial heritage regeneration, including environmental compatibility and post-industrial landscape reuse.
Building upon these established frameworks, and in response to the specific attributes of Guangyuan’s Third Front industrial heritage and the geographical characteristics of the Qinba mountainous region, this study further introduced context-specific indicators. These include strategic concealment, reflecting the defence-oriented siting logic of Third Front construction, and integration with mountainous and aquatic landscapes, capturing the interaction between industrial heritage sites and complex mountain–river environments.. This resulted in a comprehensive system encompassing 4 levels, 8 dimensions, and 19 indicators (Figure 2). This framework retains the universal industrial heritage framework of historical, technological, and reuse value while highlighting the strategic defense significance and regional ecological sensitivity of Third Front heritage through distinctive indicators. It provides a scientific basis for prioritizing the protection of Guangyuan's industrial heritage and selecting revitalization pathways.
Most existing studies encompass four core dimensions: historical value, technological value, socio-cultural value, and ecological-economic value. Scholars generally emphasize heritage uniqueness—e.g., military heritage emphasizes "national defense strategic significance," while railway heritage focuses on "transportation network connectivity."
This study decomposes the heritage value evaluation framework for Third Front industrial heritage into two components based on the nature of value attributes: intrinsic value and reuse value. Elements within each component are further organised by attributes to form a hierarchical indicator system comprising a comprehensive evaluation level, a criteria (factor) level, and an indicator level. Indicators at higher levels serve as reference criteria for determining the relative importance and weighting of indicators at lower levels. [36].
In determining the weightings for indicators across these tiers, this study employs the Analytic Hierarchy Process (AHP), whose core lies in scientifically quantifying the relative importance of each indicator through expert judgement. To ensure the objectivity, representativeness, and professionalism of weighting assignments, a diverse expert advisory panel was meticulously assembled.The panel comprised 20 experts whose professional backgrounds spanned multiple domains closely related to industrial heritage conservation, utilisation, and risk management. Specifically, this included:five from geological engineering and disaster prevention urbanruraland architectural, emphasising spatial adaptability, reuse potential, and revitalisation design; and planning designfour from, focusing on geological safety, environmental risks, and disaster mitigation technologies; three from public policy and project management tourism management and community development, examining cultural-tourism integration potential, socio-emotional value, and community engagement; and from, offering insights on policy feasibility, economic viability, and sustainable management.
This diverse expert composition ensures the value evaluation system both adheres to the ontological requirements of heritage conservation and fully addresses the practical demands of risk management and sustainable development within complex mountainous environments. Experts conducted pairwise comparisons of indicators across levels using a 1-9 rating scale.
Given the reasonable variations in the experts' personal experiences, research specialisations, and perspectives, their initial scores inevitably reflected diverse viewpoints. To synthesise collective wisdom and balance differing professional perspectives, this study employed a geometric mean method to integrate the scoring results from the 20 experts, thereby generating the final group judgement matrix. This approach effectively mitigates the influence of extreme values, ensuring the final weighting reflects multi-disciplinary consensus.Subsequently, the weights for each indicator were calculated through standard AHP procedures and rigorously validated via consistency testing (CR < 0.1). This yielded a weighting scheme that is both scientifically objective and possesses both professional breadth and depth. The final weighting results are presented in Table 2.
3.1.2. Evaluation Results of Third-Line Industrial Heritage Value
Based on the survey findings, scores were assigned to heritage values. Using the TOPSIS method with these scores and assigned weights, the value evaluation results for 24 Third Line Construction industrial heritage sites in Guangyuan City were calculated (Table 3).
Based on the evaluation results, the highest-scoring site is the State-owned Guangming Radio Equipment Factory, while the lowest-scoring is the North Sichuan Electronics Industry Company. The 24 third Front industrial heritage sites were graded by value. According to the comprehensive heritage value assessment, sites with a relative value proximity C-value ≥ 0.65 were classified as Grade 1 (Excellent), those with C-values between 0.55 and 0.65 as Grade 2 (Superior), those with C-value between 0.4 and 0.55 were classified as Grade III (Average), and those with C-value <0.4 were designated as Grade IV (Poor). Higher C-value indicate greater heritage value. Among the 24 sites, 4 are Grade I, 6 are Grade II, 8 are Grade III, and 6 are Grade IV. Overall, Guangyuan City's existing Third Front industrial heritage exhibits relatively high value.
This classification system was established by comprehensively considering the distribution characteristics of heritage value and the practical needs of conservation: Heritage sites with C-value≥0.65 demonstrate significant advantages in historical value, ecological landscape value, and reuse potential, making them highly worthy of preservation and revitalization.
Qualitative cross-validation further supports the rationality of this classification. Sites within the high-value category largely correspond to facilities that have been historically recognised as core Third Front industrial assets, many of which have already been included in local protection lists or have attracted preliminary reuse initiatives. Their spatial settings are typically characterised by relatively intact environments, favourable landscape conditions, and accessibility compatible with adaptive reuse, which is consistent with the evaluation outcomes.
Conversely, heritage sites assigned to lower value categories often exhibit fragmented remains, limited functional integrity, or severe environmental constraints, and have received less attention in existing conservation practices. This correspondence between quantitative scores and observed conservation realities indicates that the proposed indicator system effectively captures both the intrinsic significance and practical conservation potential of Third Front industrial heritage, thereby supporting the scientific validity of the evaluation framework
3.2. Risk Evaluation System
3.2.1. Selection of Evaluation Factors and Preliminary Classification
Based on the study area's geological structure, disaster development characteristics, environmental factors, and human activities, 16 influencing factors were preliminarily selected: slope gradient, slope aspect, slope curvature, terrain undulation, terrain roughness, elevation, distance to watercourses, distance to faults, normalized vegetation index (NVI), distance to roads, and land use type (Figure 3).
3.2.2. R-Boruta Algorithm for Evaluation Factor Optimization
First, Spearman's correlation analysis [37,38] was conducted on the 16 evaluation factors (Figure 4), revealing strong correlations: The correlation coefficient between POI kernel density and distance from roads was -0.8, indicating that areas of intense human activity typically located near roads.Conversely, geological hazard sites are distributed in remote areas, resulting in significant information redundancy between these factors. The correlation coefficient between slope and terrain undulation was 0.83, showing strong collinearity in terrain description. Annual average precipitation and landform type showed a correlation coefficient of 0.76, indicating moderate correlation between hydrology and landform. Engineering geological rock groups and distance from faults had a correlation coefficient of -0.6, consistent with the geological pattern of fractured rock near fault zones.
To mitigate multicollinearity interference affecting model stability and accuracy, an optimization principle was applied: factors with absolute correlation coefficients >0.8 and limited geological significance were excluded, retaining only core factors directly related to disaster mechanisms. Accordingly, POI kernel density and terrain undulation were removed.
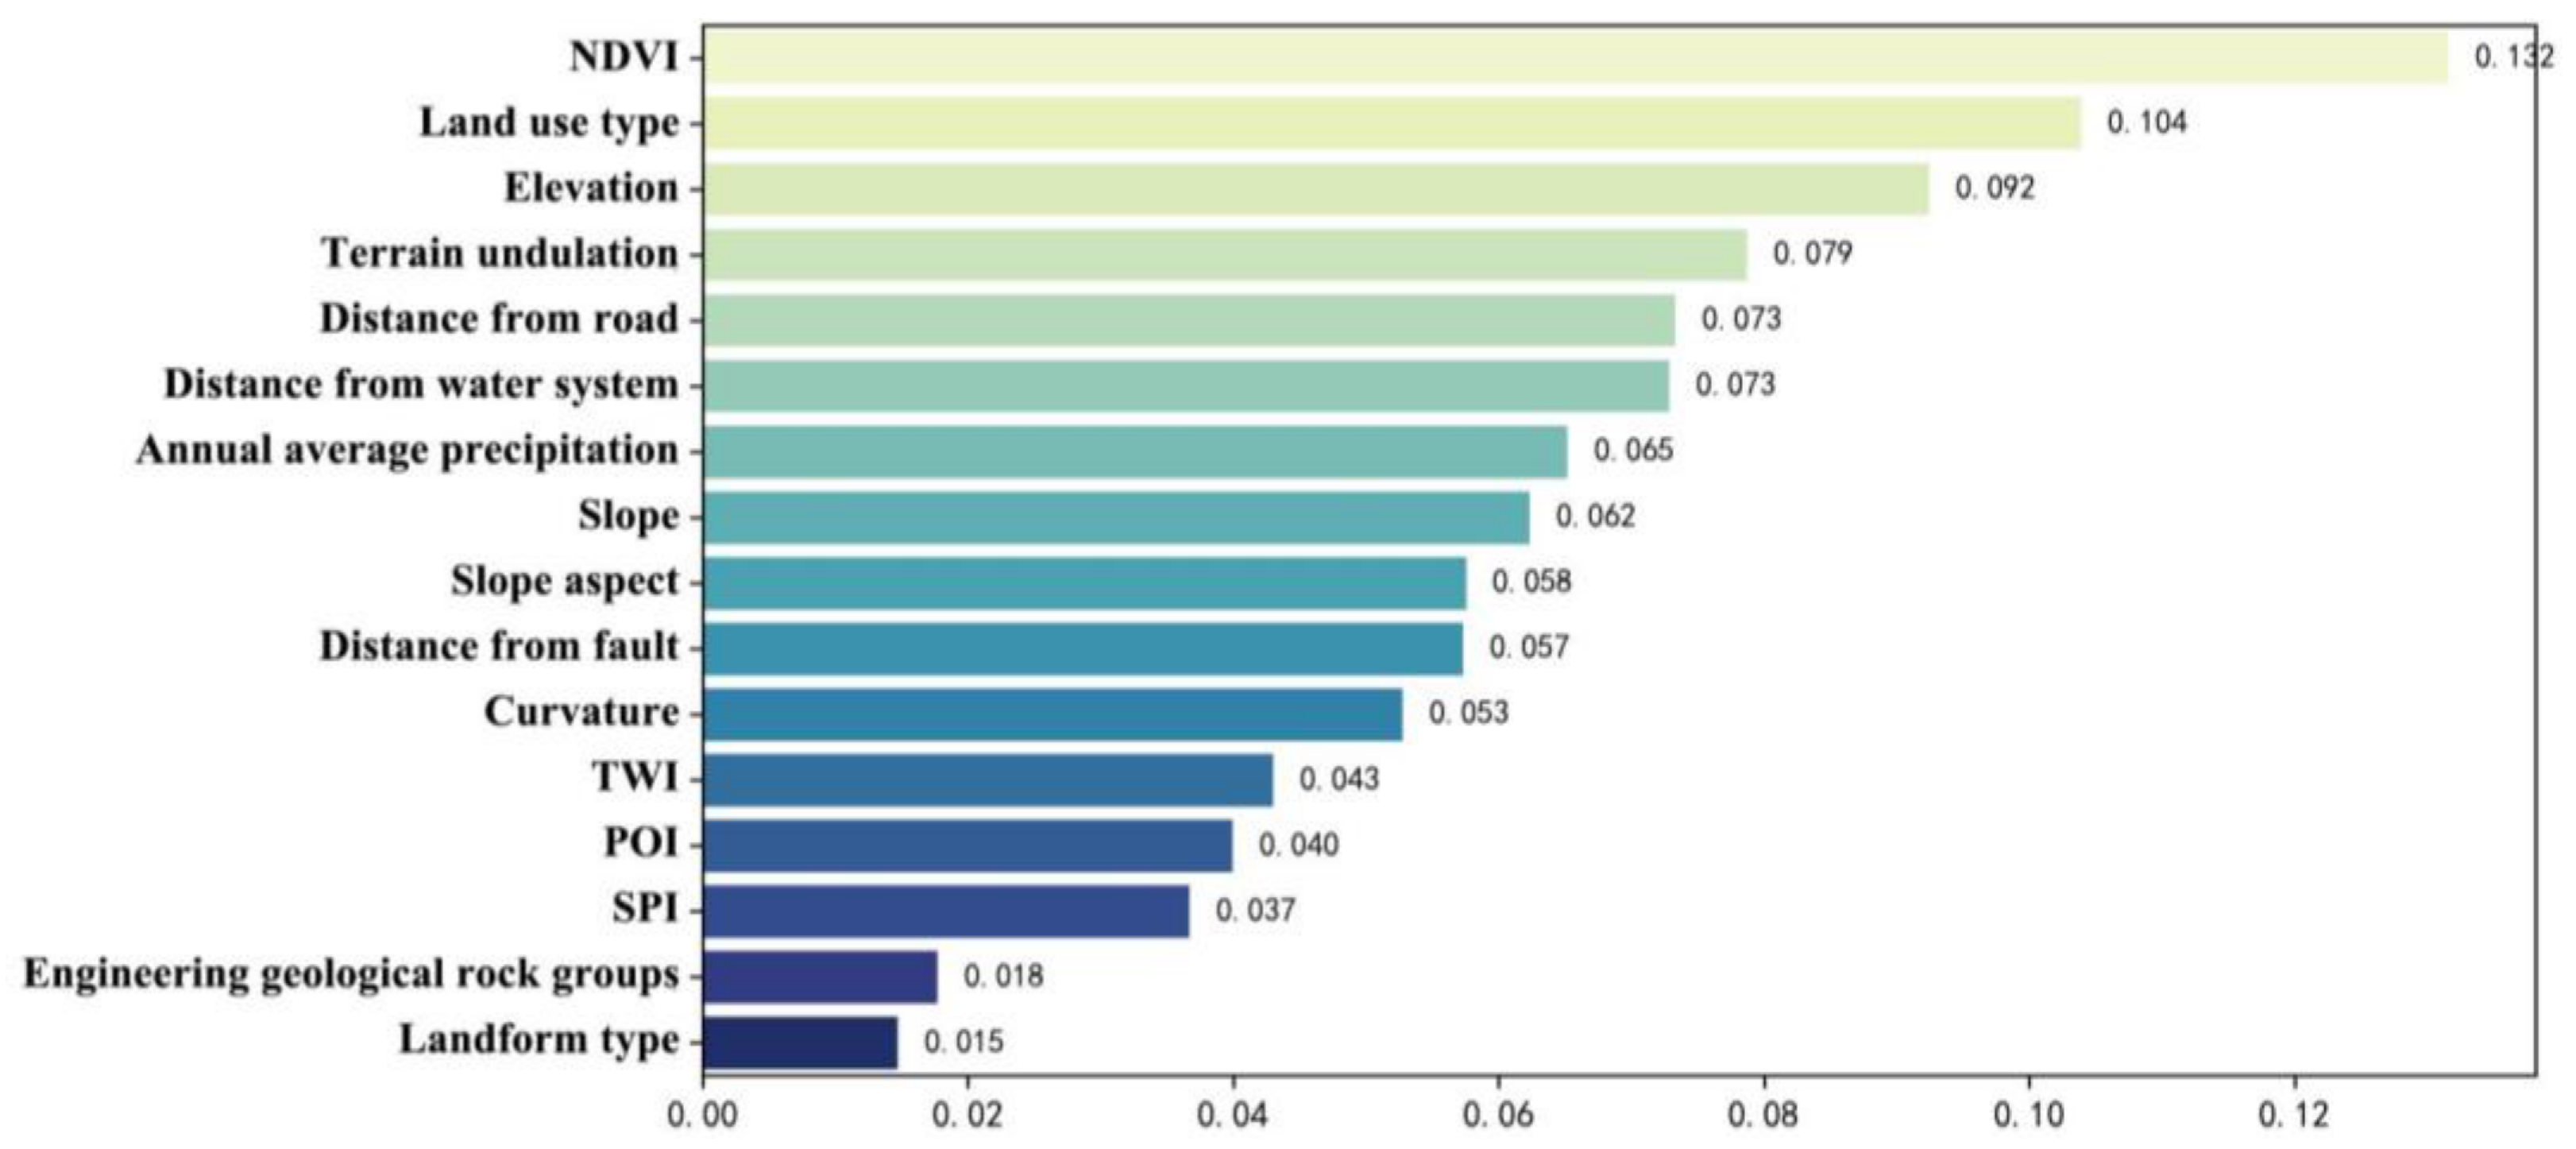
The Boruta algorithm combined [39] with a random forest model screened 16 factors ,100 iterations, comparing feature importance against random noise, retaining factors with importance exceeding noise; parameters included auto-optimized tree count and category weighting [40]. Results indicate that distance to rivers and distance to faults are more important than runoff intensity index and engineering geological rock groups. Consequently, "POI kernel density," "terrain undulation," "landform type," and "engineering geological rock groups" were ultimately excluded, retaining 12 factors for subsequent evaluation.
Figure 5.
Feature importance scores for evaluation factors.
3.2.3. Hazard Assessment and Model Selection Based on Coupled Models
Based on the graded evaluation factors, GIS tools were used to extract data into a disaster point dataset. Combining the number of grids under each factor category and their respective grades, the certainty coefficients for each evaluation factor within the study area were calculated individually (Table 4).
To scientifically evaluate geological hazard risks within the study area and select the optimal model for subsequent heritage risk analysis, this research coupled the deterministic coefficient (CF) model with three machine learning models: Random Forest (RF), Support Vector Machine (SVM), and XGBoost. This resulted in the development of CF-RF, CF-SVM, and CF-XGBoost coupled models (Figure 6). The initial deterministic scores for each evaluation unit, calculated using the CF model, were employed as key feature inputs. These were trained alongside original environmental factors to predict the probability of geological hazard occurrence.
Model accuracy was quantitatively compared using ROC curves and AUC values. Results indicate that all three coupled models demonstrate viable predictive capability, with the CF-RF coupled model exhibiting optimal overall performance. Its AUC value reached 0.8339, surpassing both the CF-SVM and CF-XGBoost models (Figure 6). This demonstrates that the CF-RF model provides more accurate and robust predictions of the spatial distribution of geological hazards within the complex geological environment of Lizhou District, Guangyuan.
The superiority of the CF-RF model in Guangyuan likely stems from its strong adaptability to the study area's distinctive geographical features. Lizhou District lies within the northern segment of the Longmen Mountains Fault Zone, characterised by a landscape dominated by low-to-medium mountains and steep river valley slopes. The heritage distribution pattern of "factories and dwellings embedded within mountain bodies" further accentuates the complexity of topographical conditions. This environment fosters significant nonlinear, high-dimensional interactions between geological hazards and multiple factors, including topography, hydrology, and geological structures. As an ensemble learning algorithm, the Random Forest (RF) model excels at capturing and fitting complex nonlinear relationships by constructing numerous decision trees, while demonstrating robust performance with high-dimensional data and imbalanced samples.When coupled with the CF model—which quantifies the confidence level of geological factors in disaster causation—the resulting CF-RF model not only gains guidance from physically and statistically meaningful prior knowledge but also fully leverages its capability to handle complex spatial patterns. This approach achieved the highest predictive accuracy within the study area.
Consequently, subsequent hazard zoning and heritage risk localisation in this study are based on the evaluation results of the CF-RF coupled model. Employing the natural breakpoint method, the study area is divided into five hazard zones: extremely low, low, medium, high, and extremely high (Figure 7). Spatially, the extremely high and high-risk zones predominantly concentrate in the steep river valley slopes of the northern segment of the Longmen Mountains Fault Zone and the intensely eroded areas along secondary tributaries of the Jialing River. These regions feature rugged topography, fractured rock formations, and intense interaction between human engineering activities and natural forces, exhibiting a high degree of correspondence with the distribution of historical disaster sites. This zoning outcome provides direct evidence for precisely identifying the risk environment surrounding the Third Front industrial heritage sites.
Using GIS software the locations of Third Line industrial heritage sites were overlaid onto hazard susceptibility zones, yielding their distribution within hazard-prone areas (Figure 8). The number of sites within each susceptibility category was tabulated (Table 5). ,heritage Table 6 indicates that the majority (29%) are situated in medium-risk zones, with only one site located in a low-risk area. Overall, the preservation conditions of these heritage sites are generally favourable.
3.3. Construction of the "Value-Risk" Matrix
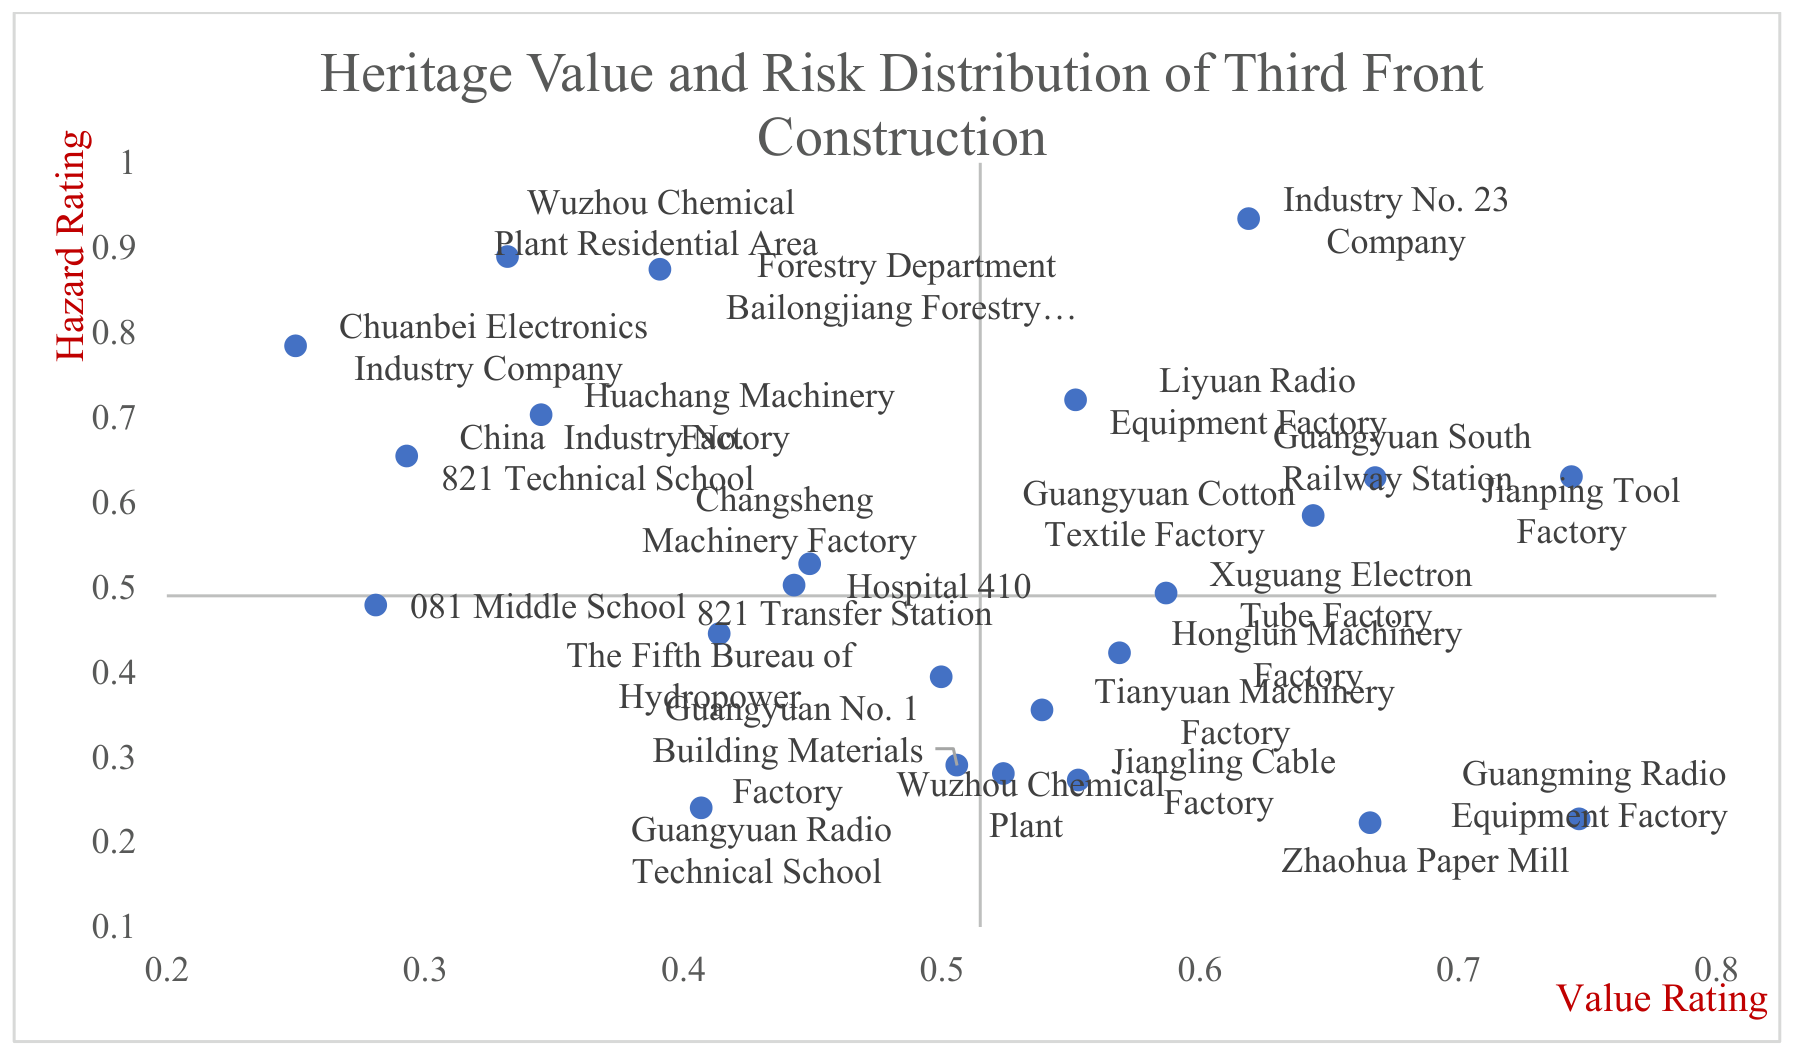
By overlaying the value gradient classification results obtained from the AHP-TOPSIS method with the geological hazard risk assessment results, a "value-risk" (Figure 8). This matrix identifies four heritage protection units: "high value-high risk," "high value-low risk," "low value-high risk," and "low value-low risk," providing spatial decision-making basis for formulating differentiated resilience enhancement strategies.
Figure 9.
Distribution of Sanxian Industrial Heritage in Prone Areas.
4. Results and Enhancement Strategies
4.1. Construction of a Value–Risk Evaluation Framework and Results
This study establishes an integrated “value–risk” evaluation framework for Third Front industrial heritage by coupling heritage value assessment with geological hazard risk analysis. Based on this framework, Third Front industrial heritage sites in Lizhou District were systematically evaluated and classified into distinct typological categories according to their combined value and risk characteristics.
The results reveal a clear spatial differentiation pattern shaped by the historical defence-oriented siting logic of “backing mountains, dispersal, and concealment.” High-value heritage sites are often embedded within complex and hazard-prone mountainous environments, while low-risk sites tend to cluster along major transport corridors such as the Baocheng Railway and the Jialing River or within relatively stable urban terrains. This confirms that historical strategic rationality has simultaneously generated long-term conservation vulnerabilities.
On this basis, the study translates evaluation outcomes into policy-oriented resilience enhancement strategies, providing an operational link between quantitative assessment and differentiated conservation decision-making.
4.2. Policy-Oriented Resilience Strategies Based on Value–Risk Typology
Based on the value–risk matrix, Third Front industrial heritage sites can be broadly categorised into four typological groups: low-risk–high-value, high-risk–high-value, low-risk–low-value, and high-risk–low-value. Rather than treating these categories as rigid technical divisions, they provide a policy-oriented basis for differentiated resilience enhancement strategies.
Low-risk–high-value sites possess strong historical significance and favourable environmental conditions, making them suitable as demonstration projects for integrated conservation and adaptive reuse. Policy efforts should prioritise functional revitalisation through compatible cultural, educational, and creative uses, supported by concealed infrastructure upgrades. Establishing multi-stakeholder governance mechanisms can further enhance long-term social resilience.
High-risk–high-value sites represent core heritage assets with elevated vulnerability due to geological hazards. For this category, resilience enhancement should focus on priority preservation through a combination of targeted engineering mitigation, structural reinforcement of key buildings, and the deployment of monitoring and early-warning systems. Controlled utilisation policies should be adopted to balance safety thresholds with heritage continuity.
Low-risk–low-value sites are more suitable for cost-effective adaptive maintenance strategies. Regular inspection and preventive maintenance, combined with community-oriented functional reuse—such as micro public spaces or storage facilities—can sustain basic heritage functions while minimising long-term management burdens.
High-risk–low-value sites require cautious decision-making guided by cost–benefit considerations. Where conservation benefits are limited and reinforcement costs are high, strategies such as managed decline, minimal safety enclosure, or digital documentation should be adopted, allowing scarce resources to be redirected toward higher-priority heritage assets.
These differentiated strategies reflect not only variations in heritage value and risk exposure but also align with the spatial heterogeneity formed by the historical “core–periphery” structure of Third Front construction. Where appropriate, representative site photos, schematic diagrams, and risk zoning maps can be used to support policy interpretation and implementation.
4.3. Planning Implications and Broader Applicability
The empirical analysis demonstrates that resilience enhancement for Third Front industrial heritage cannot rely on uniform conservation models but must respond to the combined effects of historical value, environmental risk, and spatial context. The value–risk framework proposed in this study offers a transferable analytical tool for identifying priority intervention types in mountainous industrial heritage regions.
First, the results highlight the importance of integrating disaster risk considerations into heritage value evaluation, particularly in regions shaped by defence-oriented industrial layouts. Ignoring risk conditions may lead to conservation strategies that are symbolically significant but operationally fragile.
Second, the study underscores that resilience should be understood as a multi-dimensional concept encompassing physical safety, functional adaptability, and social governance capacity. Strategies such as ecological engineering, dynamic monitoring, and community participation should be selectively combined according to typological conditions rather than applied uniformly.
Finally, although the framework is developed based on the Third Front industrial heritage of Lizhou District, its methodological logic is applicable to other mountainous or hazard-prone industrial heritage contexts. By linking quantitative evaluation with policy-oriented typological strategies, the approach contributes to bridging the gap between heritage assessment and actionable planning decisions.
5. Conclusion
This study proposes an integrated “value–risk” evaluation framework to enhance the resilience-oriented conservation of Third Front industrial heritage in mountainous and hazard-prone regions. By coupling heritage value assessment with geological hazard risk analysis, the framework overcomes the limitations of conventional value-only approaches and provides an operational basis for differentiated conservation decision-making.
Applied to Lizhou District in Guangyuan City, the results reveal a clear spatial differentiation pattern shaped by the historical defence-oriented siting logic of Third Front construction. While many high-value heritage sites are embedded within complex and risk-sensitive environments, low-risk sites tend to concentrate along transport corridors and relatively stable urban terrains. This confirms that historical strategic rationality has generated long-term conservation vulnerabilities that must be addressed through resilience-oriented management.
Based on the value–risk typology, this study further translates evaluation outcomes into policy-oriented resilience enhancement strategies, ranging from priority preservation and controlled utilisation to cost-effective adaptive maintenance and managed decline. These strategies emphasise the integration of physical safety, functional adaptability, and social governance capacity, demonstrating that resilience is a multi-dimensional attribute rather than a purely technical condition.
Although the empirical analysis focuses on Third Front industrial heritage in Lizhou District, the proposed framework has broader applicability to other industrial heritage contexts characterised by complex terrain and environmental uncertainty. By linking quantitative evaluation with actionable policy guidance, this study contributes to bridging the gap between heritage assessment and sustainable management practice.
Supplementary Materials
The following supporting information can be downloaded at the website of this paper posted on Preprints.org.
Author Contributions
Conceptualization, X.H. and M.X.; methodology, X.H., M.X. and S.W.; software, X.H., H.Y. and J.Y.; validation, Y.M. and K.X.; formal analysis, X.H. and J.Y.; investigation, X.H., M.X., H.Y., X.D. and J.Y.; resources, M.X. and S.W.; data curation, X.H. and H.Y.; writing—original draft preparation, X.H., M.X. and S.W.; writing—review and editing, M.X. and S.W.; visualization, X.H., X.D. and J.Y.; supervision, M.X.; project administration, Y.M. and K.X.; funding acquisition, M.X., Y.M. and K.X.. All authors have read and agreed to the published version of the manuscript.
Funding
This research was funded by the Humanities and Social Science Fund of Ministry of Education of China (No. 23XJAZH008); High-quality Graduate Teaching Reform Project of Sichuan Province (No. YJGXM25-C057); Fundamental Research Funds for the Central Universities, Southwest Minzu University (No. RQD2022031); National Social Science Foundation of China by Associations (No. 25SGC133); Humanities and Social Science Fund of Ministry of Education of China (No. 25YJC760118).
Institutional Review Board Statement
Not applicable.
Informed Consent Statement
Not applicable.
Data Availability Statement
The original contributions presented in this study are included in the article. Further inquiries can be directed to the corresponding authors.
Acknowledgments
The authors would like to thank the anonymous reviewers for their constructive comments. Gratitude is also extended to financial support throughout the research process. The tutors promptly identified shortcomings in the research and imparted invaluable methodologies and techniques. Under their guidance, the author has broadened their horizons, accumulated extensive knowledge, and achieved continuous growth on the path of scientific inquiry. Simultaneously, heartfelt gratitude is extended to the junior colleagues within the research group for their solidarity and collaboration. With their assistance, multiple industrial heritage site surveys were successfully completed, ultimately enabling the research to be concluded more effectively and leaving behind a splendid conference experience.
Conflicts of Interest
The authors declare no conflicts of interest. The funders had no role in the design of the study; in the collection, analyses, or interpretation of data; in the writing of the manuscript; or in the decision to publish the results.
Abbreviations
The following abbreviations are used in this manuscript:
| AHP | Analytic Hierarchy Process |
| TOPSIS | Technique for Order Preference by Similarity to Ideal Solution |
| CF | Certainty Factor |
| RF | Random Forest |
| SVM | Support Vector Machine |
| XGBoost | eXtreme Gradient Boosting |
| TWI | Topographic Wetness Index |
| SPI | runoff intensity index |
| POI | Point of Interest |
| NDVI | Normalized Difference Vegetation Index |
References
- Xu, S.L. The significance of Third Front Construction industrial heritage: Institution-al value cognition from a political economy perspective. Southeast Cult. 2020, 6, 6–11. [Google Scholar]
- Shi, D.; Zhao, J.B. The historical significance of the Third Front Construction from the perspective of industrial civilization. Stud. Contemp. Chin. His-Tory 2025, 32, 18–26. [Google Scholar]
- Li, Q.G.; Guo, S.Z.; Xu, Z.M. Spatio-temporal pattern characteristics of modern in-dustrial heritage in China: Evidence from national key cultural relic protection units. South. Archit. 2022, 44, 44–54. [Google Scholar]
- Pardo Abad, C.J. Valuation of Industrial Heritage in Terms of Sustainability: Some Cases of Tourist Reference in Spain. Sustainability 2020, 12, 9216. [Google Scholar] [CrossRef]
- NTagilCharter.
- Nocca, F.; Bosone, M.; Orabona, M. Multicriteria Evaluation Framework for Indus-trial Heritage Adaptive Reuse: The Role of the ‘Intrinsic Value. Land 2024, 13, 1266. [Google Scholar] [CrossRef]
- Fatorić, S.; Seekamp, E. Are Cultural Heritage and Resources Threatened by Climate Change? A Systematic Literature Review. Clim. Change 2017, 142, 227–254. [Google Scholar] [CrossRef]
- Yu, L.; Aoki, N.; Xu, S.B. Industrial heritage value assessment in the United King-dom, the United States, and Canada. Archit. J. 2016, 1, 1–4. [Google Scholar]
- Du, F.L.; Chen, Y.; Jiang, L.X.; Song, B.; She, S.C. Value evaluation of industrial heritage reuse from an environmental adaptation perspective: A case study of Third Front industrial heritage in Chongqing. Huazhong Archit. 2025, 43, 97–102. [Google Scholar] [CrossRef]
- Chen, X. Research on the value evaluation system and holistic conservation of built heritage from the Third Front Construction. Master’s Thesis, Huazhong University of Science and Technology, Wuhan, China; p. 202.
- Tan, G.Y.; Xu, L.Q.; Huang, Z.H. Value judgement of Third Front Construction heritage in Hubei Province under the orientation of adaptive reuse. Architect 2025, 25, 25–34. [Google Scholar]
- Wu, M. Geological hazard risk assessment based on AHP and comprehensive index methods: A case study of Luojiang District, Quanzhou City. Energy Envi-Ronment 2025, 107–111. [Google Scholar]
- Fang, Y.Q.; Gao, L.M.; Zhu, L.Y.; Dou, L.B.; Li, N.; Chen, X.M.; Han, L.; Gui, S.Y. Geological hazard risk assessment of Linyi City, Shandong Province based on GIS and the information value model. Shandong Land Resour. 2025, 41, 60–65. [Google Scholar]
- Liu, J.C. County-level geological hazard risk assessment based on machine learning methods. Eng. Constr. Des. 2025, 214–217. [Google Scholar] [CrossRef]
- Jin, C.L.; Guo, R.; Gong, L.; Lu, H.W.; Yuan, P.F. Flood risk assessment for railway bridges and culverts based on RF feature selection and SSA-SVM. J. Saf. Environ. 2025. [Google Scholar] [CrossRef]
- Liu, M.Y.; Wu, W.; Wang, H.; Luo, W.E.; Wu, J.J.; Guo, X.D. Training set size prevails over similarity: A comparative study of machine learning models for landslide prediction triggered by the Jishishan earthquake. Earth Sci. Fron-Tiers 2025, 32, 466–483. [Google Scholar] [CrossRef]
- Tong, J.P.; Zhang, H.Y.; Liu, H.; Huang, J.; Hao, Y. Urban waterlogging risk assessment and influencing factor analysis in core cities of the Yangtze River Delta based on XGBoost. Water Resour. Hydropower Eng. 2021, 52, 1–11. [Google Scholar] [CrossRef]
- Lin, S.; Liu, B.B.; Yan, X.; Sun, N.; Guo, G.Z. Big data-driven disaster risk assessment of major flood processes at the county scale. J. Catastrophology 2022, 37, 166–172. [Google Scholar]
- Wang, D.Y.; Zhang, L.D.; Wu, Q.; Guo, H.X.; Ke, X.L.; Lü, X.B. Flood disaster risk assessment based on machine learning algorithms: A case study of Yichang City. Resour. Environ. Yangtze Basin 2023, 32, 1710–1723. [Google Scholar]
- Wu, J.H.; Zhang, F.W.; Li, X.G.; Ma, T.Y.; Zhao, Y.; Qu, J.K. Mechanisms and risk resilience of rainstorm-induced landslide–debris flow disaster chains in low mountain and hilly areas of eastern Liaoning. Eng. Sci. Tech-Nology 2025. [Google Scholar]
- Jiao, L.D.; Cai, Z.P.; Huo, X.S.; Wang, H. Multi-level disaster chain risk as-sessment of urban rail transit spatial systems under rainstorm flooding. J. Railw. Sci. Eng. 2025. [Google Scholar] [CrossRef]
- Yao, J.T.; Yao, B.Y.; Fu, Y.H.; Wu, J.B. Urban disaster resilience: Thematic evolution and a systematic review of international discourse. Acta Ecol. Sin. 2025. [Google Scholar] [CrossRef]
- Ripp, M.; Daniel, S. Flexibility in cultural heritage management: Enhancing sustainable and resilient adaptive capacity in dynamic change processes. Land-Scape Archit. Front. 2023, 11, 120–131. [Google Scholar]
- Han, J.; Tan, L.; Chen, X.Y.; Wang, L.L. Reconstructing resilience: Path crea-tion in the conservation and regeneration of Singapore’s railway heritage. World Archit. 2025, 37–42. [Google Scholar] [CrossRef]
- Lu, Y.; Chen, H.; Jia, H.K.; Zhang, F. Spatiotemporal evolution and effects of important agricultural heritage system conservation on agricultural resilience. Econ. Geogr. 2024, 44, 194–204. [Google Scholar] [CrossRef]
- Yang, J.; Huang, X. The 30 m Annual Land Cover Dataset and Its Dynamics in China from 1990 to 2019. Earth Syst. Sci. Data 2021, 13, 3907–3925. [Google Scholar] [CrossRef]
- Chen, D.W.; Liu, W.F. Research on optimization of open-pit coal mining schemes based on AHP-TOPSIS model. Opencast Min. Technol. 2024, 39, 1–5. [Google Scholar] [CrossRef]
- Shortliffe, E.H.; Buchanan, B.G. A Model of Inexact Reasoning in Medicine. Math. Biosci. 1975, 23, 351–379. [Google Scholar] [CrossRef]
- Li, X.; Xue, G.C.; Liu, C.Z.; Ma, B.; Yang, Y.P.; Yang, F.; Wang, X.L.; Li, J.Y. A study on geological hazard susceptibility assessment in Changjiang County, Hainan Province based on IV, CF, LRIV, and LRCF models. China Earthq. Eng. J. 2025, 47, 319–330, 341. [Google Scholar] [CrossRef]
- Belgiu, M.; Drăguţ, L. Random Forest in Remote Sensing: A Review of Appli-cations and Future Directions. ISPRS J. Photogramm. Remote Sens. 2016, 114, 24–31. [Google Scholar] [CrossRef]
- Xian, L.M.; Ji, M.; Liu, F.J.; Li, Q. Geological hazard susceptibility assessment in the Taishan area based on coupling of CF and optimized RF models. Bull. Soil Water Conserv. 2024, 44, 134–143. [Google Scholar] [CrossRef]
- Liu, R.; Li, L.; Pirasteh, S.; Lai, Z.; Yang, X.; Shahabi, H. The Performance Quality of LR, SVM, and RF for Earthquake-Induced Landslides Susceptibility Mapping Incorporating Remote Sensing Imagery. Arab. J. Geosci. 2021, 14, 259. [Google Scholar] [CrossRef]
- Xing, Z.; Meng, X.J.; Yuan, J.J.; Zhang, D.; Liu, L.; Chen, Y.M. Landslide hazard assessment using SVM-GBDT model with supported information. Sci. Technol. Eng. 2025, 25, 2712–2720. [Google Scholar] [CrossRef]
- Chen, X.; Wang, X.; Zhang, D.; Chen, L.; Wang, J.; Chang, Z.; Qin, D.; Lv, H. Advanced Modeling of Seepage Dynamics and Control Strategies in Thick Coal Seams under High-Confined Aquifer Conditions: A Case Study. Alex. Eng. J. 2025, 111, 415–431. [Google Scholar] [CrossRef]
- Qiu, Y.; Zhou, J.; Khandelwal, M.; Yang, H.; Yang, P.; Li, C. Performance Evaluation of Hybrid WOA-XGBoost, GWO-XGBoost and BO-XGBoost Mod-els to Predict Blast-Induced Ground Vibration. Eng. Comput. 2022, 38, 4145–4162. [Google Scholar] [CrossRef]
- Yu, H.H. A study on the conservation of industrial heritage in the Chongqing metropolitan area based on value assessment. Master’s Thesis, Chongqing Uni-versity, Chongqing, China, 2018. [Google Scholar]
- Zhou, Y.; Li, S. BP Neural Network Modeling with Sensitivity Analysis on Mono-tonicity Based Spearman Coefficient. Chemom. Intell. Lab. Syst. 2020, 200, 103977. [Google Scholar] [CrossRef]
- El-Hashash, E.F.; Shiekh, R.H.A. A Comparison of the Pearson, Spearman Rank and Kendall Tau Correlation Coefficients Using Quantitative Variables. Asian J. Probab. Stat. 2022, 20, 36–48. [Google Scholar] [CrossRef]
- Gao, P.L.; Ren, D.L.; Li, C.H.; Feng, Z.Q.; Miao, H.Y.; Qiao, L.; Wang, J.W.; Yang, Y.L.; Zhang, L.M.; Li, G.H. Soil organic matter spatial distribution prediction based on Boruta algorithm and GA optimized mixed land statistical model. Ge-Ophys. Geochem. Explor. 2024, 48, 747–758. [Google Scholar] [CrossRef]
- ing, F.; Wang, Z.Y.; Li, Z.J.; Gao, Z.H.; Si, Y.L. An improved multi-factor land-slide susceptibility assessment method for XGBoost. Sci. Surv. Mapp. 2025, 50, 114–123. [Google Scholar] [CrossRef]
Figure 1.
Location of the Study Area and Distribution of Geological Hazard Sites.
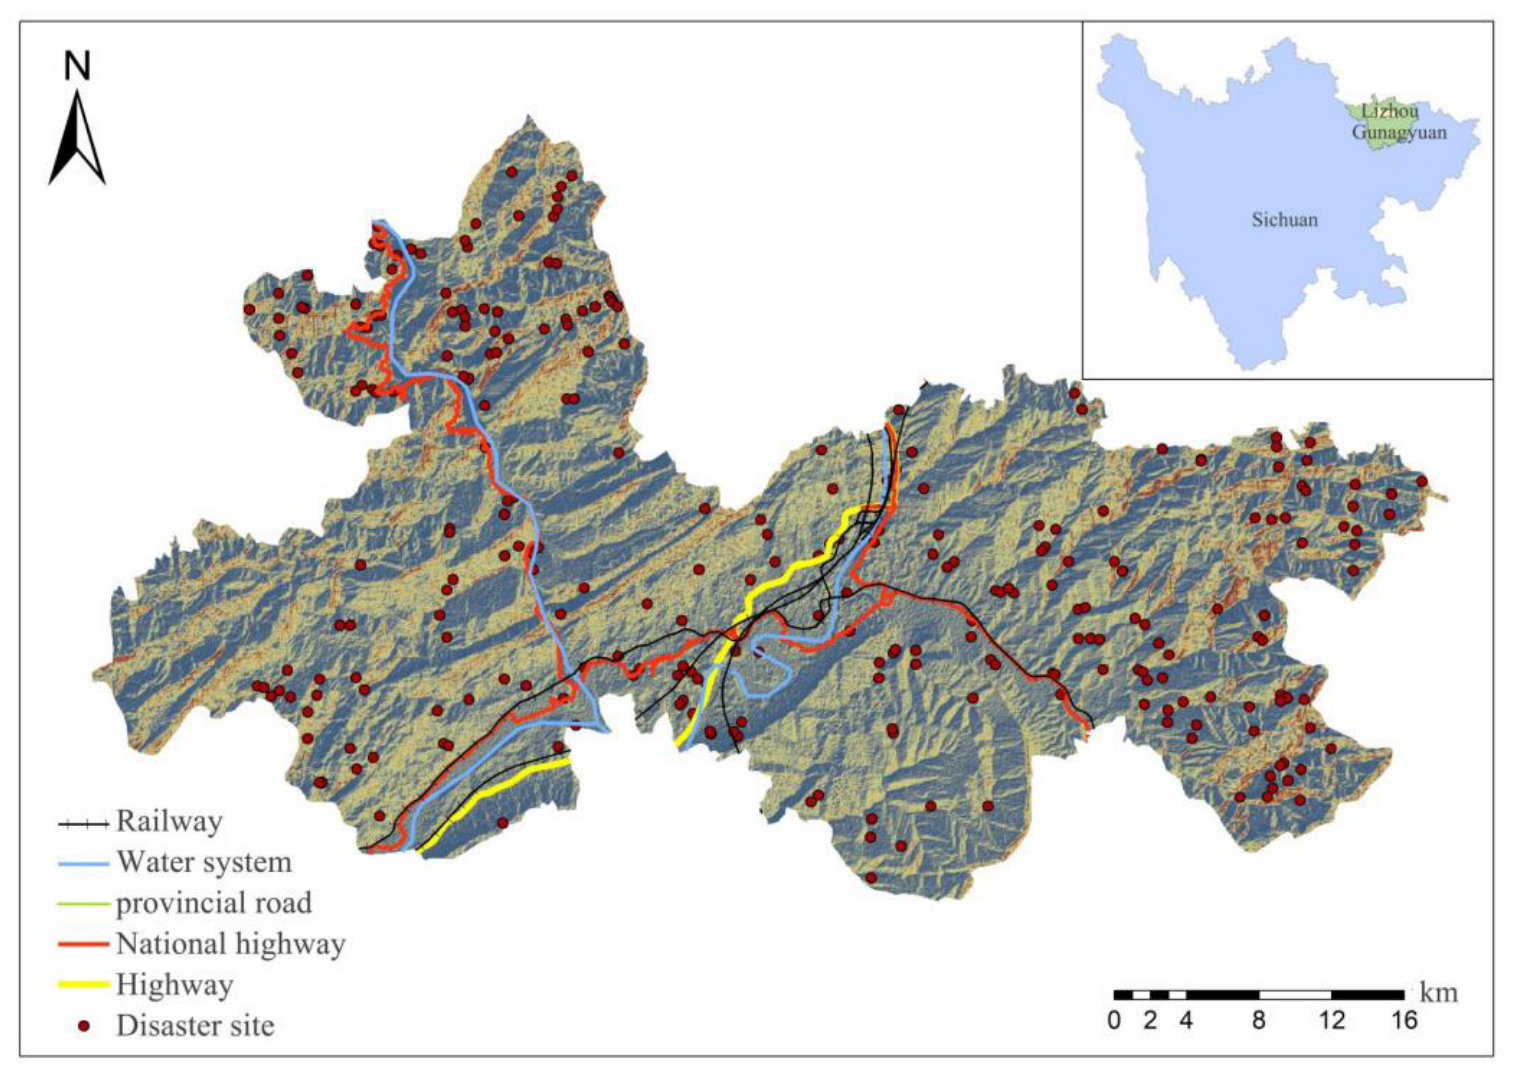
Figure 2.
Value System Diagram of Guangyuan's Third Front industrial heritage.
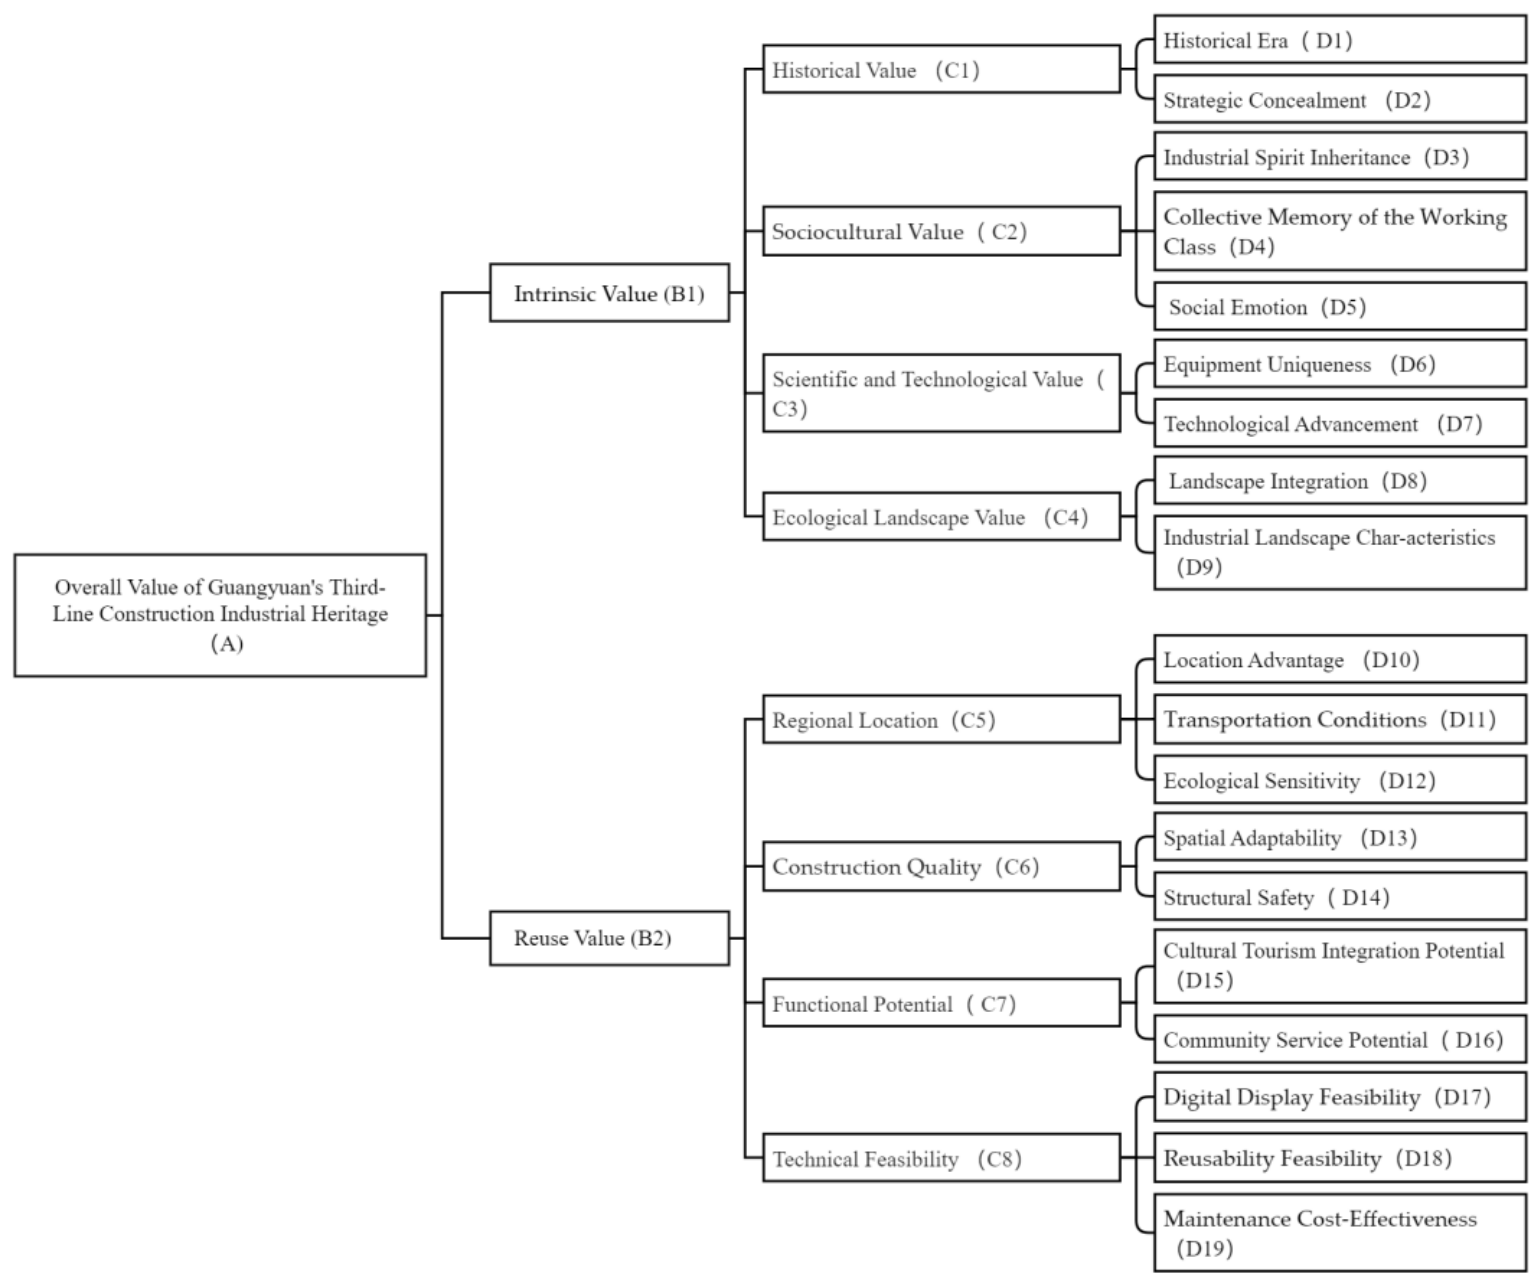
Figure 3.
Evaluation Factor Grading (a) Elevation; (b)Slope;(c) Slope aspect;(d) Land use type;(e) Curvature;(f) Terrain undulation;(g) Engineering geological rock groups;(h) Distance from road ;(i)POI;(j)SPI;(k)NDVI;(l) Distance from fault;(m) Landform type;(n)TWI;(o) Annual average precipitation;(p) Distance from water system.
Figure 3.
Evaluation Factor Grading (a) Elevation; (b)Slope;(c) Slope aspect;(d) Land use type;(e) Curvature;(f) Terrain undulation;(g) Engineering geological rock groups;(h) Distance from road ;(i)POI;(j)SPI;(k)NDVI;(l) Distance from fault;(m) Landform type;(n)TWI;(o) Annual average precipitation;(p) Distance from water system.
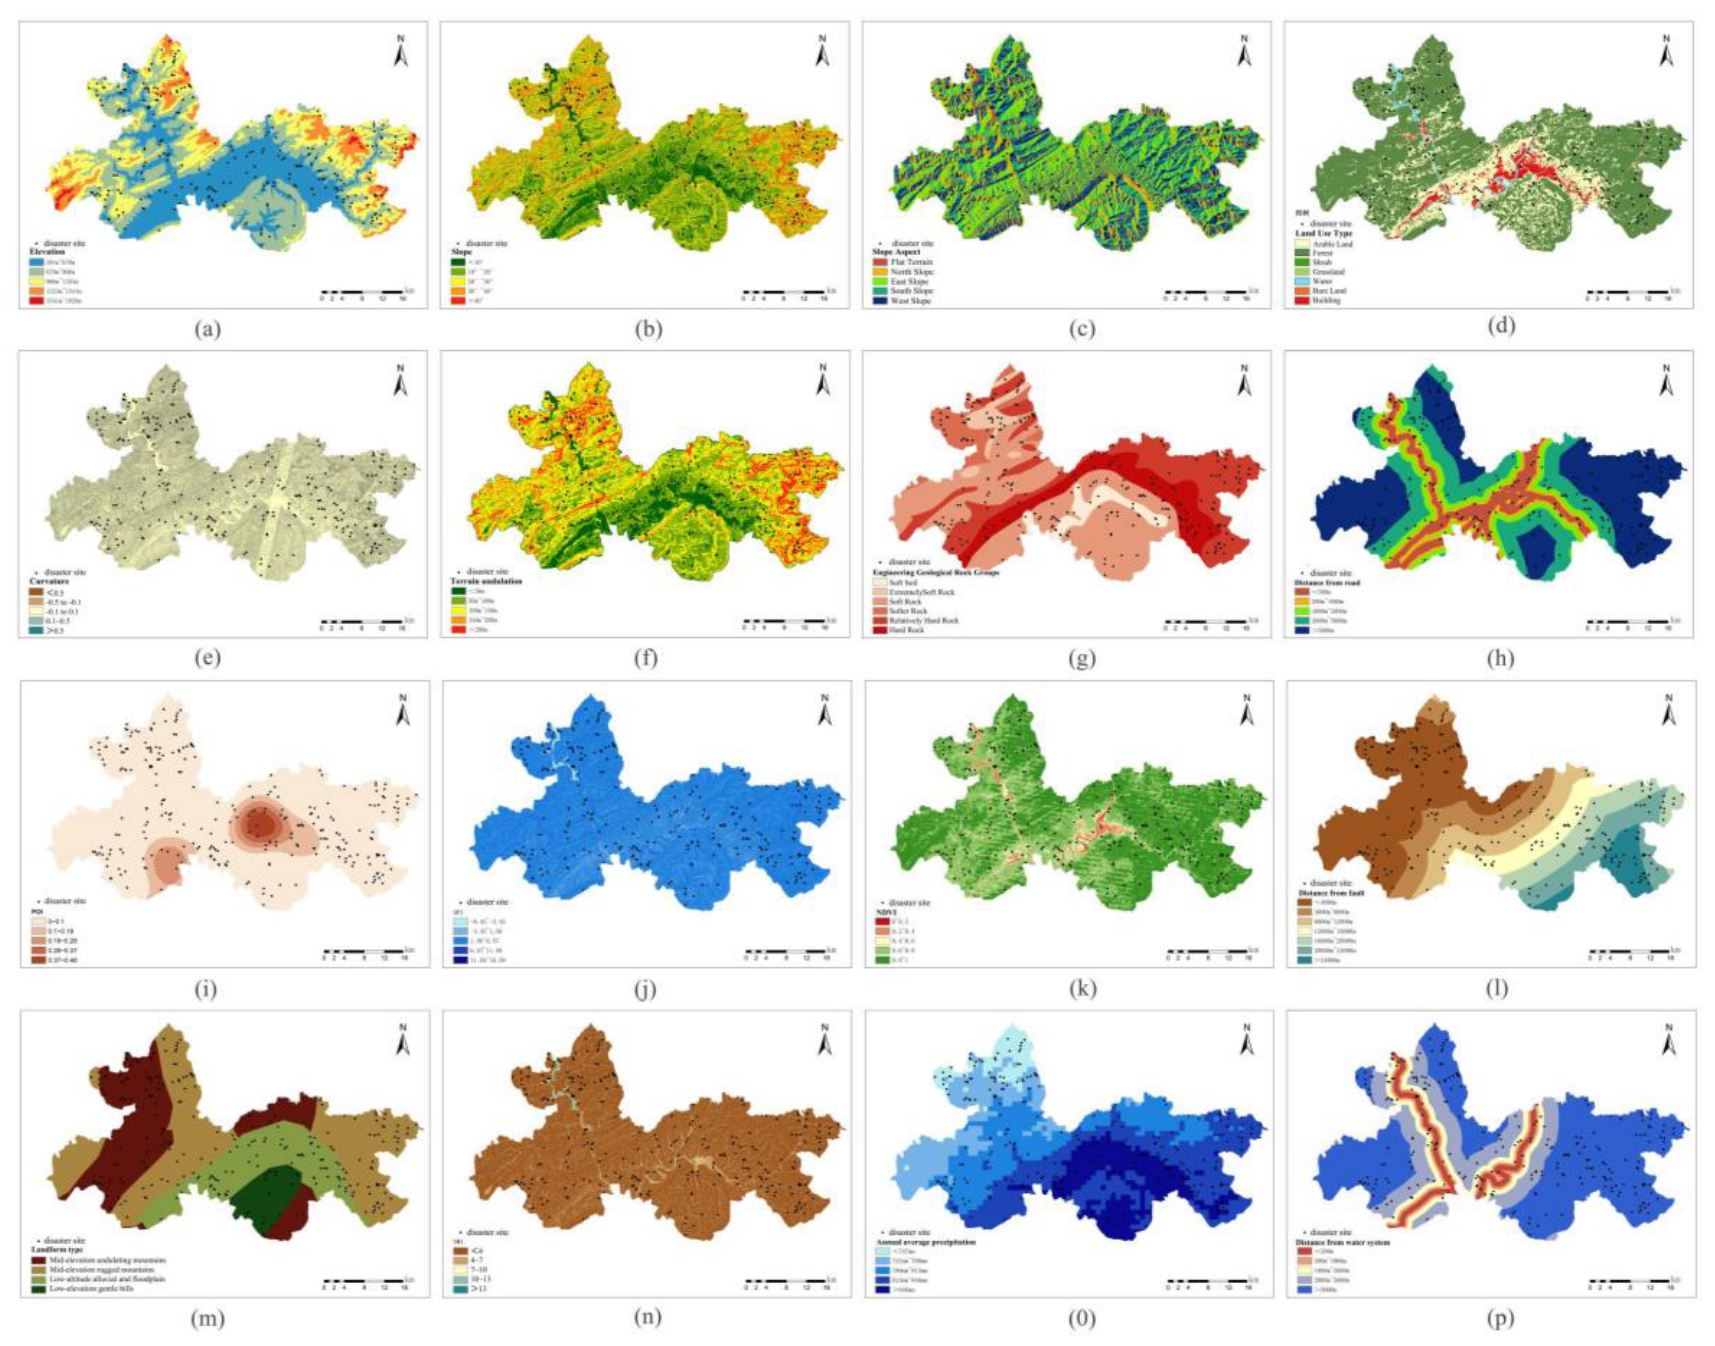
Figure 4.
Correlation Analysis Diagram.
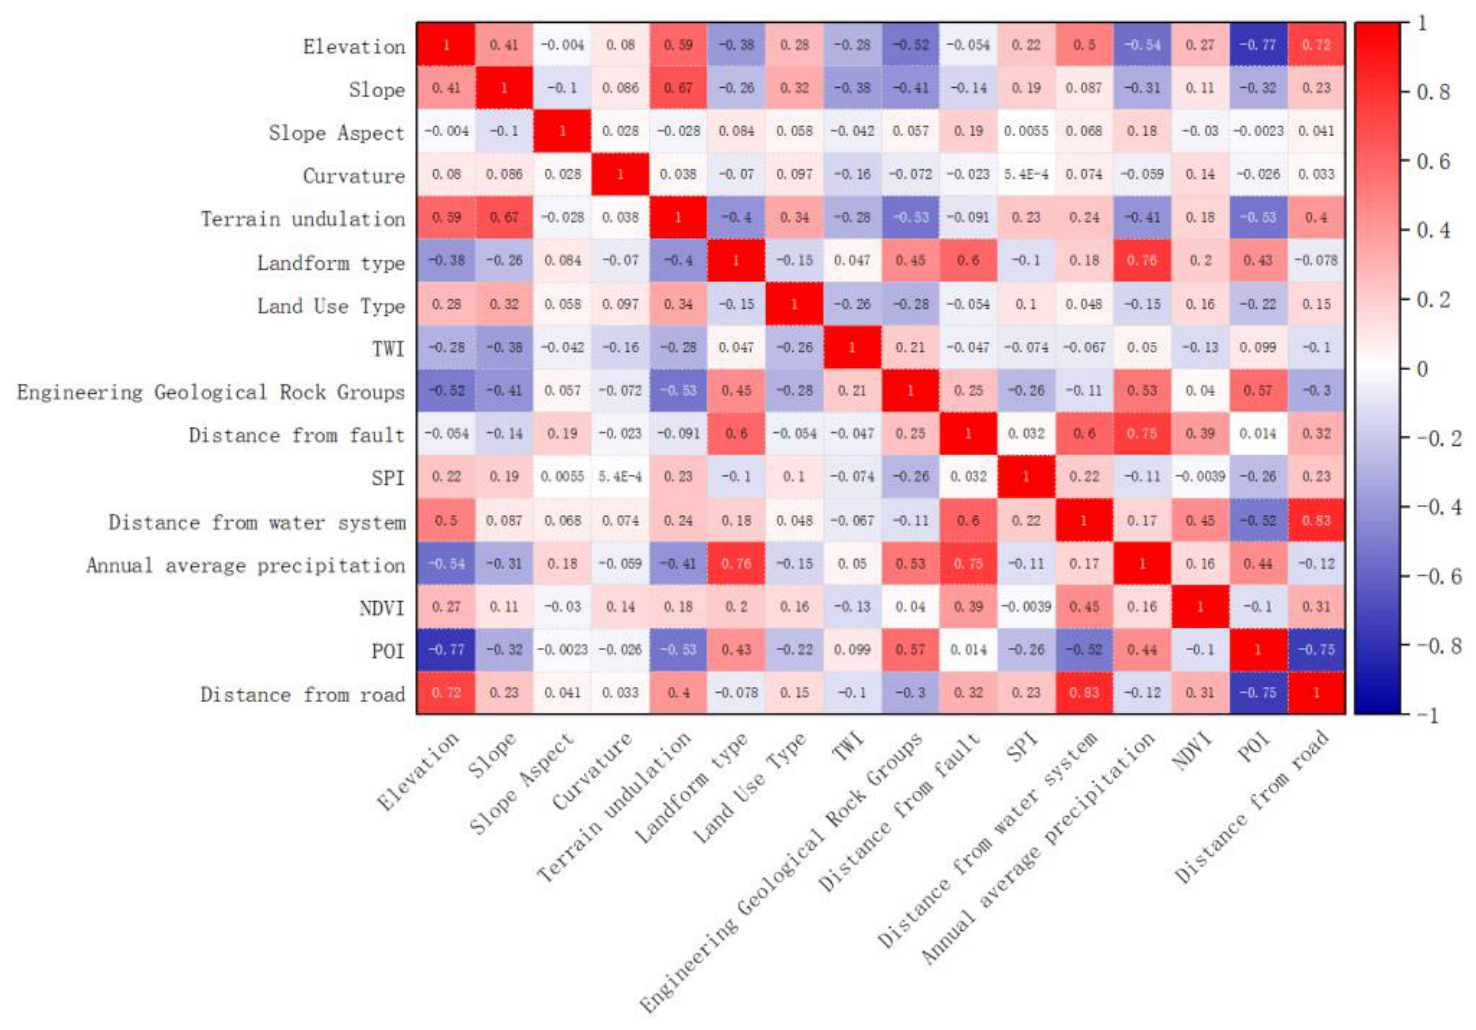
Figure 6.
Hazard assessment results for the study area(a)CF Model;(b)CF-RF Model;(c)CF-SVM Model;(d)CF-XGBoost Model.
Figure 6.
Hazard assessment results for the study area(a)CF Model;(b)CF-RF Model;(c)CF-SVM Model;(d)CF-XGBoost Model.
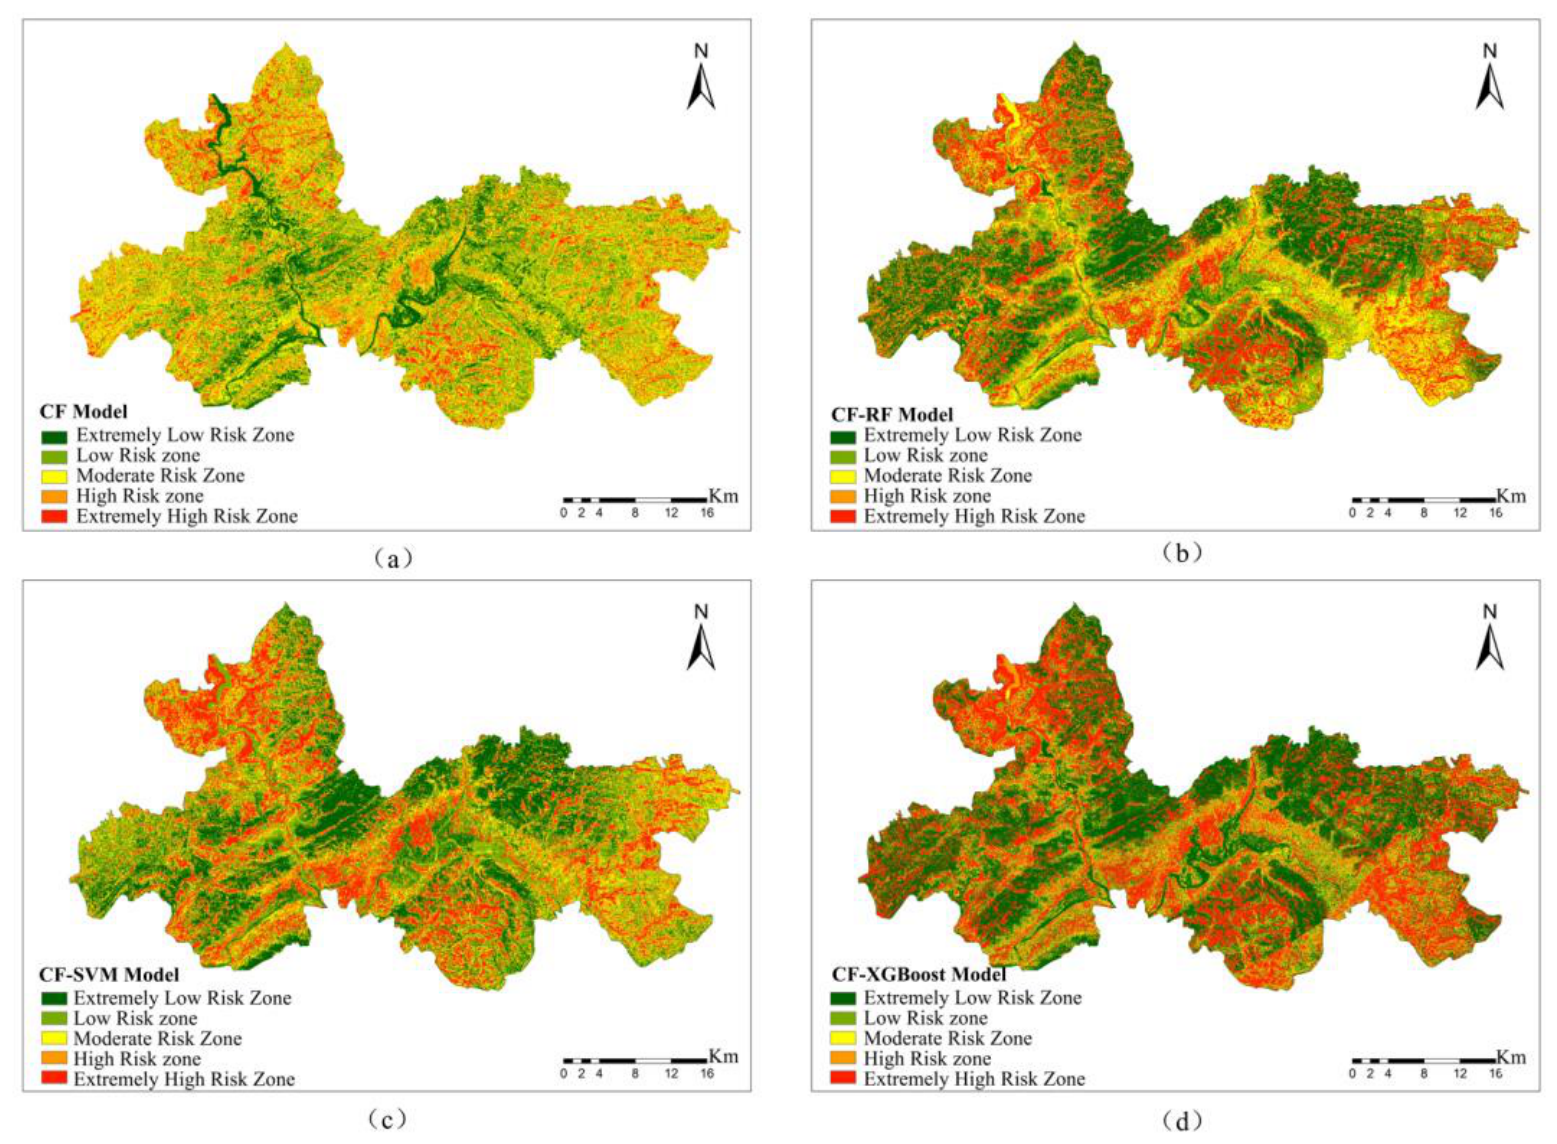
Figure 7.
Comparison of Model ROC Curves.
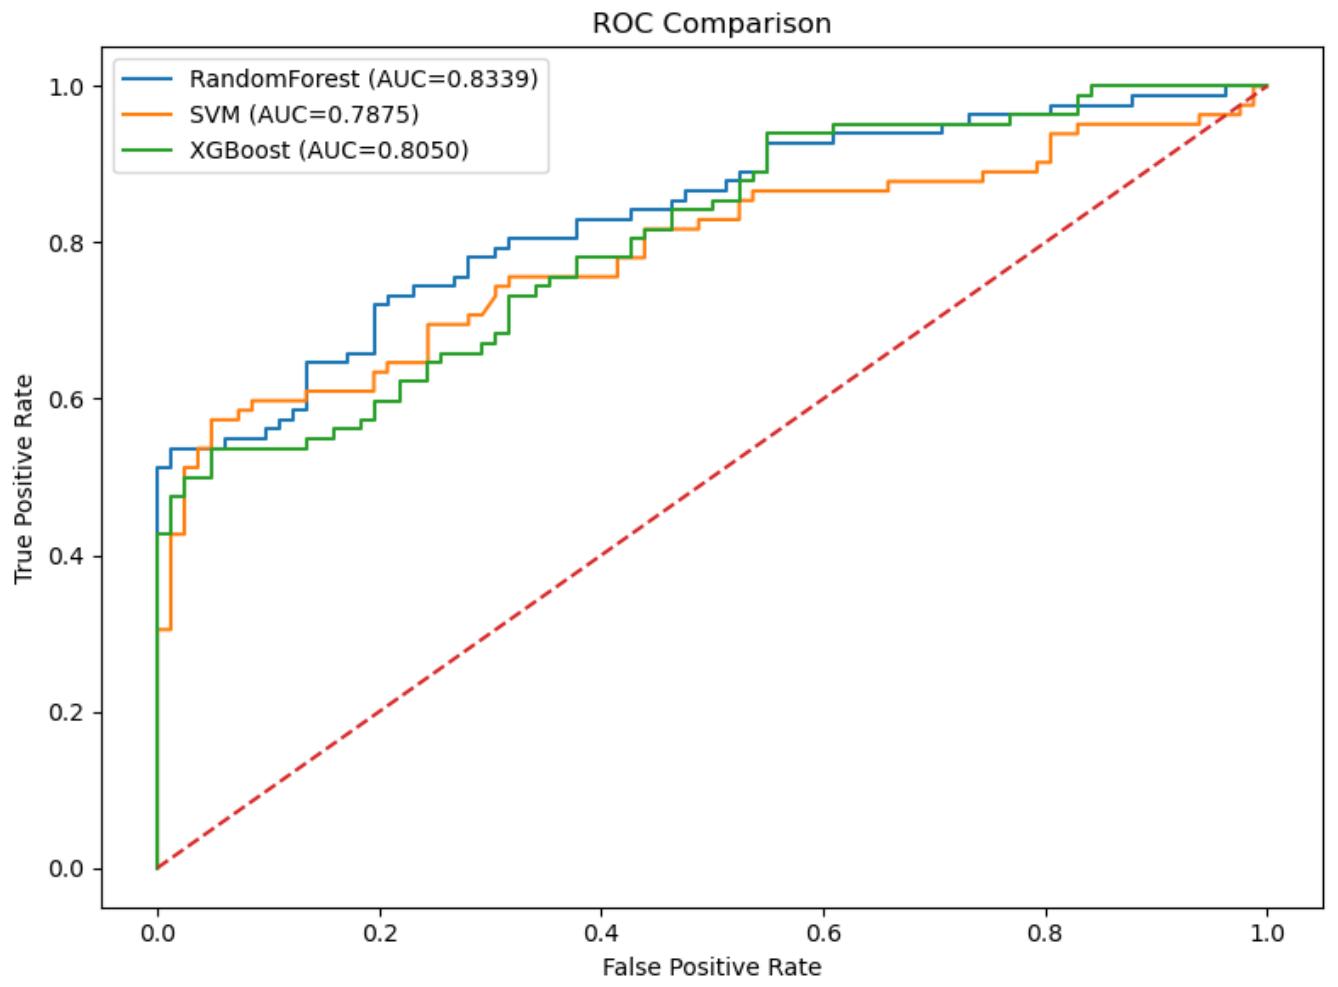
Figure 8.
Distribution of Third Front Industrial Heritage Sites in Vulnerability Zones.
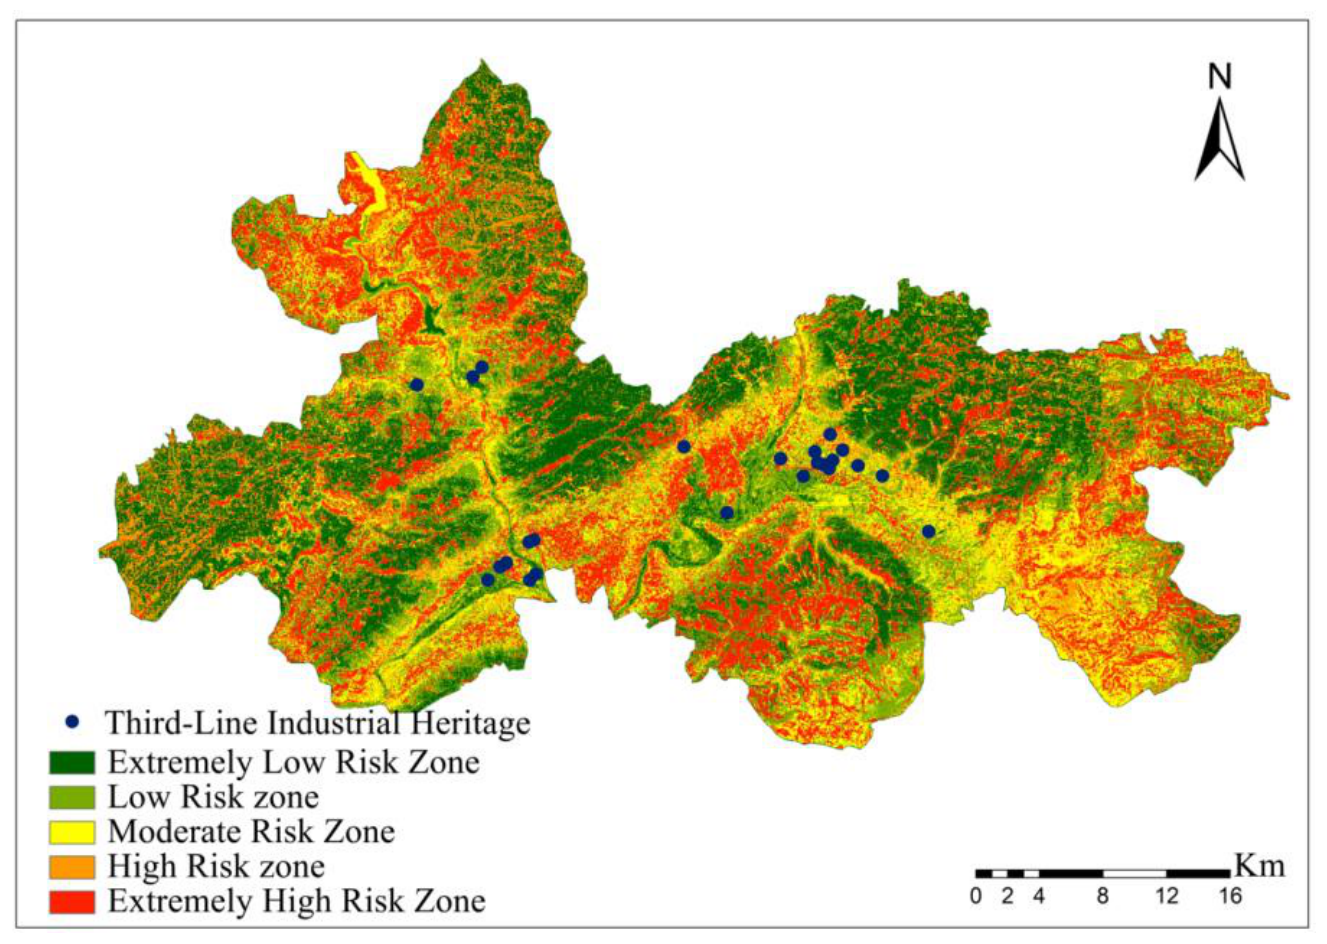

Table 1.
Data Sources for Disaster Risk Assessment in the Study Area.
| Factor Type | Evaluation Factor | Data Source |
|---|---|---|
| Topography and Landforms | Elevation | NASA 30m resolution DEM |
| Slope | DEM Extraction and Generation | |
| Slope Aspect | DEM Extraction and Generation | |
| Curvature | DEM extraction and generation | |
| Terrain Undulation | DEM extraction and generation | |
| Landform Type | China 1:4 million Digital Landform Dataset | |
| Land Use Type | Wuhan University [26] | |
| Topographic Wetness Index (TWI) | DEM Extraction and Generation | |
| Geological Structure | Engineering Geological Formations | China Geological Archives 1:200,000 Geological Map |
| Distance from Fault | China Geological Archives 1:200,000 Geological Map | |
| Hydrological Conditions | Streamflow Potential Index (SPI) | DEM Extraction and Generation |
| Distance to Rivers | OpenStreetMap (OSM) Open Data Platform | |
| Meteorological Conditions | Annual Average Precipitation | National Earth System Science Data Center |
| Human Activity | Normalized Difference Vegetation Index | Chinese Academy of Sciences Resource and Environmental Science Data Center |
| POI Kernel Density | Bigemap Mapping Software | |
| Distance from Road | OpenStreetMap (OSM) Open Data Platform |
Table 2.
Factor Weight Distribution Table.
| Objective Level | Criterion Layer (Combined Weight) | Composite Indicator Layer (Combined Weight) |
Single Indicator Layer (Combination Weight) |
Indicator Attributes |
|---|---|---|---|---|
| Overall Value of Guangyuan's Third Front Construction Industrial Heritage (A) | Intrinsic Value (B1) (0.35) |
Historical Value (C1) (0.055) |
Historical Era (D1) (0.017) |
Positive |
| Strategic Concealment (D2) (0.035) |
Positive | |||
| Sociocultural Value (C2) (0.051) |
Industrial Spirit Inheritance (D3) (0.014) |
Positive | ||
| Collective Memory of the Working Class (D4) (0.020) |
Positive | |||
| Social Emotion (D5) (0.017) |
Positive | |||
| Scientific and Technological Values (C3) (0.096) |
Equipment Uniqueness (D6) (0.030) |
Positive | ||
| Technological Advancement (D7) (0.066) |
Positive | |||
| Ecological Landscape Value (C4) (0.148) |
Landscape Integration (D8) (0.085) |
Positive | ||
| Industrial Landscape Characteristics (D9) (0.063) |
Positive | |||
| Reuse Value (B2) (0.65) |
Regional Location (C5) (0.159) |
Location Advantage (D10) (0.057) |
Positive | |
| Transportation Conditions (D11) (0.069) |
Positive | |||
| Ecological Sensitivity (D12) (0.033) |
Negative | |||
| Construction Quality (C6) (0.171) |
Spatial Adaptability (D13) (0.069) |
Positive | ||
| Structural Safety (D14) (0.102) |
Positive | |||
| Functional Potential (C7) (0.126) |
Cultural Tourism Integration Potential (D15) (0.058) |
Positive | ||
| Community Service Potential (D16) (0.068) |
Positive | |||
| Technical Feasibility (C8) (0.194) |
Digital Display Feasibility (D17) (0.050) |
Positive | ||
| Reusability Feasibility (D18) (0.081) |
Positive | |||
| Maintenance Cost-Effectiveness (D19) (0.063) |
Negative |
Table 3.
Heritage Value Evaluation Results.
| Heritage Name | Positive Ideal Solution Distance D | Negative Ideal Solution Distance D- | Relative Closeness (C) | Ranking Result | Current photos |
|---|---|---|---|---|---|
| Xuguang Electron Tube Factory | 3.996 | 5.678 | 0.587 | 7 | 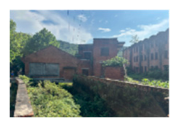 |
| Chuanbei Electronics Industry Company | 8.286 | 0 | 0 | 24 |  |
| Changsheng Machinery Factory | 5.797 | 4.725 | 0.449 | 15 | 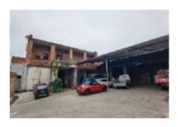 |
| Huachang Machinery Factory | 6.455 | 3.404 | 0.345 | 20 | 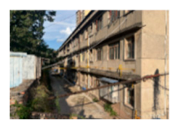 |
| Liyuan Radio Equipment Factory | 5.218 | 6.436 | 0.552 | 10 |  |
| Tianyuan Machinery Factory | 4.07 | 4.753 | 0.539 | 11 | 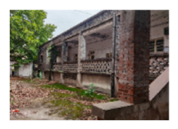 |
| Guangming Radio Equipment Factory | 2.411 | 7.106 | 0.747 | 1 |  |
| Jianping Tool Factory | 2.443 | 7.09 | 0.744 | 2 | 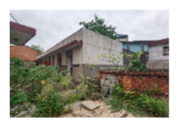 |
| Honglun Machinery Factory | 4.14 | 5.467 | 0.569 | 8 | 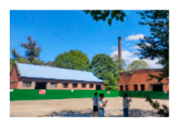 |
| Guangyuan Radio Technical School | 5.855 | 4.012 | 0.407 | 18 | 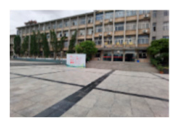 |
| Wuzhou Chemical Plant | 4.238 | 4.668 | 0.524 | 12 | 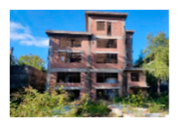 |
| Industry No. 23 Company | 3.492 | 5.683 | 0.619 | 6 | 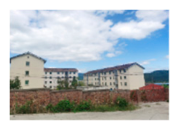 |
| Jiangling Cable Factory | 3.905 | 4.827 | 0.553 | 9 | 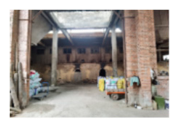 |
| Wuzhou Chemical Plant Residential Area | 6.18 | 3.065 | 0.332 | 21 | 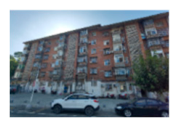 |
| Guangyuan No. 1 Building Materia ls Factory |
4.503 | 4.616 | 0.506 | 13 |  |
| Zhaohua Paper Mill | 3.175 | 6.333 | 0.666 | 4 | 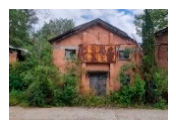 |
| Forestry Department Bailongjiang Forestry Administration | 5.623 | 3.605 | 0.391 | 19 |  |
| Guangyuan Cotton Textile Factory | 3.189 | 5.76 | 0.644 | 5 | 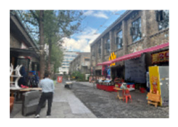 |
| The Fifth Bureau of Hydropower | 5.321 | 5.33 | 0.5 | 14 |  |
| Guangyuan South Railway Station | 3.406 | 6.85 | 0.668 | 3 |  |
| 081 Middle School | 6.949 | 2.721 | 0.281 | 23 |  |
| Hospital 410 | 5.263 | 4.187 | 0.443 | 16 | 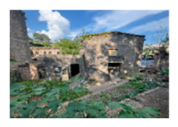 |
| Industry No. 821 Technical School | 6.506 | 2.698 | 0.293 | 22 | 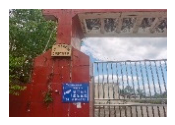 |
| 821 Transfer Station | 5.473 | 3.873 | 0.414 | 17 | 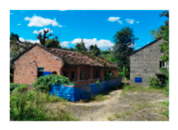 |
Table 4.
Heritage Value Evaluation Results.
| Evaluation Factor | Factor Grading | Number of Hazard Points | Frequency Ratio | CF |
|---|---|---|---|---|
| Elevation | 391m–678m | 104 | 0.38 | 0.38 |
| 678m–966m | 62 | 0.23 | -0.06 | |
| 966m–1253m | 58 | 0.21 | -0.12 | |
| 1253m~1541m | 44 | 0.16 | -0.04 | |
| 1541m~1828m | 4 | 0.01 | -0.86 | |
| Slope | <10° | 5 | 0.02 | -0.92 |
| 10°–20° | 53 | 0.19 | -0.48 | |
| 20°–30° | 67 | 0.25 | -0.11 | |
| 30°–40° | 70 | 0.26 | 0.56 | |
| >40° | 77 | 0.28 | 0.99 | |
| Slope Aspect | Flat Terrain | 2 | 0.01 | 0.09 |
| North Slope | 75 | 0.28 | 0.14 | |
| East Slope | 50 | 0.18 | -0.20 | |
| South Slope | 84 | 0.31 | 0.13 | |
| West Slope | 61 | 0.22 | -0.13 | |
| Curvature | <-0.5 | 15 | 0.06 | 0.20 |
| -0.5 – -0.1 | 73 | 0.27 | 0.20 | |
| -0.1 – 0.1 | 121 | 0.44 | -0.05 | |
| 0.1–0.5 | 51 | 0.19 | -0.14 | |
| >0.5 | 12 | 0.04 | -0.15 | |
| Land Use Type | Arable Land | 152 | 0.56 | 0.65 |
| Forest | 108 | 0.40 | -0.46 | |
| Shrub | 0 | 0.00 | -1.00 | |
| Grassland | 0 | 0.00 | -1.00 | |
| Water | 1 | 0.00 | -0.79 | |
| Bare Land | 0 | 0.00 | -1.00 | |
| Building | 11 | 0.04 | -0.14 | |
| Topographic Wetness Index | <4 | 102 | 0.38 | -0.17 |
| 4~7 | 101 | 0.37 | 0.12 | |
| 7–10 | 48 | 0.18 | 0.17 | |
| 10–13 | 16 | 0.06 | 0.01 | |
| >13 | 5 | 0.02 | 0.17 | |
| Distance From Fault | <4000m | 100 | 0.37 | 0.03 |
| 4000m–8000m | 34 | 0.13 | -0.13 | |
| 8000m–12000m | 26 | 0.10 | -0.23 | |
| 12,000m–16,000m | 26 | 0.10 | 0.08 | |
| 16,000m–20,000m | 33 | 0.12 | 0.09 | |
| 20,000m–24,000m | 31 | 0.11 | 0.01 | |
| >24,000m | 22 | 0.08 | 0.23 | |
| Stream Power Index | < -1 | 3 | 0.01 | 0.51 |
| -1 – -0.5 | 102 | 0.38 | 0.03 | |
| -0.5 – 0.5 | 96 | 0.35 | -0.10 | |
| 0.5–1 | 53 | 0.19 | -0.01 | |
| >1 | 18 | 0.07 | 0.35 | |
| Distance From Water System | <500m | 20 | 0.07 | 0.30 |
| 200m–1000m | 17 | 0.06 | 0.29 | |
| 1000m–2000m | 27 | 0.10 | 0.14 | |
| 2000m–5000m | 57 | 0.21 | -0.09 | |
| >5000m | 151 | 0.56 | -0.06 | |
| Annual Average Precipitation | <766mm | 58 | 0.21 | 0.03 |
| 766 mm–796 mm | 41 | 0.15 | -0.37 | |
| 796mm–823mm | 37 | 0.14 | -0.47 | |
| 823mm–848mm | 75 | 0.28 | -0.11 | |
| >848mm | 65 | 0.24 | 0.10 | |
| Normalized Difference Vegetation Index | 0–0.2 | 7 | 0.03 | -0.37 |
| 0.2–0.4 | 43 | 0.16 | 0.47 | |
| 0.4–0.6 | 114 | 0.42 | 0.52 | |
| 0.6–0.8 | 72 | 0.26 | -0.35 | |
| 0.8–1 | 36 | 0.13 | -0.50 | |
| Distance From Road | <500m | 52 | 0.19 | 0.41 |
| 200m–1000m | 20 | 0.07 | 0.04 | |
| 1000m–2000m | 19 | 0.07 | -0.38 | |
| 2000m–5000m | 70 | 0.26 | -0.05 | |
| >5000m | 111 | 0.41 | -0.06 |
Table 5.
Hazard Zone Area and Disaster Point Density in the Study Area.
| Training Model | Single CF Model | CF-RF Model | CF-SVM Model | CF-XGBoost Model | ||||
|---|---|---|---|---|---|---|---|---|
| Area Proportion | Disaster Point Density (per km²) | Area Proportion | Disaster Point Density (per km²) | Area Proportion | Disaster Point Density (per km²) | Area proportion | Disaster Point Density (per km²) | |
| Extremely Low Risk Zone | 0.10 | 0.07 | 0.23 | 0.01 | 0.23 | 0.06 | 0.34 | 0.04 |
| Low Risk Zone | 0.29 | 0.12 | 0.23 | 0.03 | 0.24 | 0.10 | 0.15 | 0.04 |
| Moderate Risk Zone | 0.32 | 0.15 | 0.18 | 0.10 | 0.17 | 0.16 | 0.10 | 0.04 |
| High Risk Zone | 0.20 | 0.23 | 0.12 | 0.38 | 0.17 | 0.18 | 0.10 | 0.10 |
| Extremely High Risk Zone | 0.08 | 0.46 | 0.23 | 0.45 | 0.19 | 0.50 | 0.31 | 0.78 |
Table 6.
Distribution of Third Front Industrial Heritage Sites within Hazard Zones.
| Hazard Level | Number of Third-Line Industrial Heritage Sites | Percentage of Total Heritage Sites |
|---|---|---|
| Extremely Low Risk | 1 | 0.04 |
| Low Risk | 6 | 0.25 |
| Moderate Risk | 7 | 0.29 |
| High Risk | 6 | 0.25 |
| Extremely High Risk | 4 | 0.17 |
Disclaimer/Publisher’s Note: The statements, opinions and data contained in all publications are solely those of the individual author(s) and contributor(s) and not of MDPI and/or the editor(s). MDPI and/or the editor(s) disclaim responsibility for any injury to people or property resulting from any ideas, methods, instructions or products referred to in the content. |
© 2026 by the authors. Licensee MDPI, Basel, Switzerland. This article is an open access article distributed under the terms and conditions of the Creative Commons Attribution (CC BY) license (http://creativecommons.org/licenses/by/4.0/).
Copyright: This open access article is published under a Creative Commons CC BY 4.0 license, which permit the free download, distribution, and reuse, provided that the author and preprint are cited in any reuse.