

Submitted:
14 August 2026
Posted:
17 August 2026
You are already at the latest version
Abstract
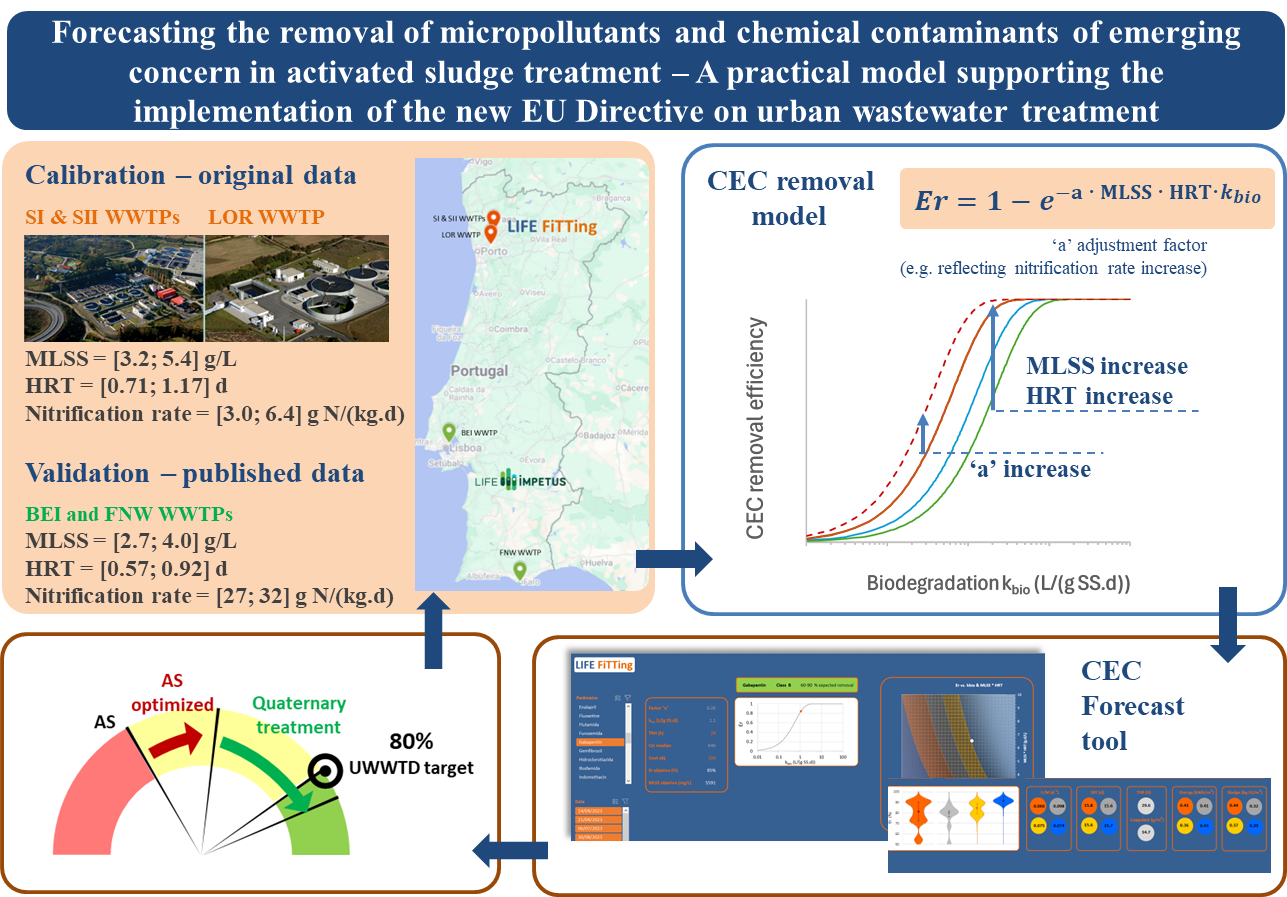
A practical model to forecast the removal of micropollutants and other chemical Contaminants of Emerging Concern (CECs) in Activated Sludge (AS) systems was developed. Full-scale campaigns were carried out in three AS-WWTPs to evaluate the influence of the Mixed Liquor Suspended Solids (MLSS), Hydraulic Retention Time (HRT), and nitrification conditions. The previously observed sigmoidal correlation between CEC removal and biodegradation rate (kbio) was validated and a pseudo-first-order kinetic model was adapted to include, in addition to MLSS, HRT, kbio, a lumped-correction factor ‘a’. The transferability of the approach was further assessed using data from two WWTPs analysed in a previous study. The “a” value ranged from 0.19 (oxidation ditch at a nitrification rate of 5.8 g N-NH4/(kg VSS·d)) to 0.61 (A2O with 27 g N-NH4/(kg VSS·d)), suggesting a potential influence of reactor configuration and nitrification activity. This model allows WWTP managers optimizing AS performance and assessing its combination with advanced treatments needed to comply with the 80% removal efficiency for micropollutant indicators set by the revised Urban Wastewater Treatment Directive. Increasing MLSS from 2 to 5 g/L, increases AS removal from 23% to 45% and thus decreases ozone dose from 20 to 12 g/m3.
Keywords:
activated sludge
; biodegradation kinetics
; organic micropollutants
; process optimization
; treatment conditions
; urban wastewater treatment
1. Introduction
A higher exigence for urban wastewater treatment towards the control of chemical contaminants of emerging concern (CECs) is expected, namely in Europe, driven by the revision of the Urban Wastewater Treatment Directive (UWWTD, Directive (EU) 2024/3019 [1]), and a synergic optimisation between secondary, tertiary, and quaternary treatments should be pursuit for the sake of overall treatment efficiency. The revised UWWTD requires a minimum 80% removal efficiency for micropollutant-indicators for large plants (150 thousand population equivalent (p.e.) and above) and for smaller ones (10 thousand p.e. and above) in risk areas for micropollutants. Furthermore, since the removal efficiency is highly dependent on operational conditions [2,3,4], there is a pressing need for decision-support tools that can assist in daily operations. In this context, the EU-funded LIFE Fitting project developed and demonstrated, at full scale, in three large urban wastewater treatment plants (WWTPs), an innovative set of tools (PLAN-DO toolbox, TRL 7) for strategic planning and smart monitoring and operation of WWTPs. This includes the “CEC ForecastTool”, designed to forecast CECs’ removal as a function of key operating conditions in secondary/tertiary treatment of urban wastewaters by activated sludge (AS) systems and in downstream quaternary treatments, so far, ozonation [5].
The AS forecasting approach builds on a previous study conducted in two Portuguese WWTPs [4], which established a framework to predict chemical CEC control in urban AS-WWTPs based on a four-class CEC classification (A to D; from highly removed to recalcitrant) according with CEC biodegradation constant (kbio) and adsorption onto sludge constant (Kd). This classification was particularly sensitive to kbio. A sigmoid relationship between removal efficiency and kbio was identified, with a turning point at 1 L/(gSS.d), separating classes C and B (respectively, below and above that point), which represents a refinement of the classification scheme proposed by Joss et al. [6]. That study also showed that Food/Microorganisms ratios (F/M) below 0.08 d-1 (typical of extended aeration AS-systems) were associated with lower concentrations of CECs in the 0.1-10 L/(gSS.d) range (classes B and C) at the plant outlet and that, under the more favourable nitrification conditions, the CEC load released from the plant was further reduced by 23-61% [4].
Building on these findings, full-scale field campaigns were conducted, within the LIFE Fitting project, in three other WWTPs with stronger industrial input (from the textile industry). The campaigns covered different AS-reactors operated under different controlled conditions of F/M (by varying MLSS – the mixed-liquor suspended solids concentration) and HRT (the hydraulic retention time) using treatment lines in parallel to ensure a sound benchmarking. Dedicated nitrification campaigns were also conducted in one WWTP, two parallel lines.
Regarding CEC modelling, pseudo-first-order biodegradation kinetic models have been widely reported in the literature [6,7,8]. However, the CEC kbio values they use are typically derived under controlled laboratory conditions, so the models are rarely translated into simplified models suitable for full-scale application. Although several studies have investigated the influence of operational and biological factors, such as sludge retention time, nitrification conditions, organic loading, and microbial activity, on micropollutant removal [9,10,11,12,13,14,15,16], the translation of these findings into simplified and operational full-scale predictive tools remains limited.
In parallel, mechanistic models such as SimpleTreat 4.0 [17] have been developed to describe the fate of micropollutants in WWTPs; however, their complexity, calibration demand and extensive data requirements – including compound-specific properties, detailed process configuration data (e.g., reactor volumes, hydraulic and sludge retention times, and phase distributions), operational conditions (e.g., MLSS, temperature, flow rates, and aeration characteristics), and mass transfer parameters governing air–water and solid–water exchange – limit their practical use as decision-support tools. These inputs are often derived from a combination of literature values, default assumptions, and site-specific data, resulting in a high data demand for model implementation. This limitation is particularly relevant in the context of the revised UWWTD, where WWTP managers require practical tools capable of assessing optimization strategies of the implemented biological treatment and the need for downstream advanced treatment processes.
To address these limitations, the present study proposes a simplified and practical modelling framework that retains the pseudo-first-order kinetic approach while enabling straightforward calibration for full-scale systems. The model integrates key operational parameters (MLSS and HRT) into a reduced-form expression that can be readily applied by WWTP managers. Furthermore, the model introduces an empirical adjustment factor that allows laboratory-determined kbio values to be adapted to site-specific full-scale conditions, thereby bridging the gap between experimental biodegradation data and practical plant-scale applications.
The original contribution of this work is therefore not the derivation of a new biodegradation mechanism, but the operational translation of literature-based biodegradation kinetics into a calibrated full-scale forecasting framework requiring only routinely available WWTP parameters.
In this context, the present study aims to (i) validate the previously observed sigmoid correlation between CEC removal efficiency and biodegradation rate constant for an expanded number and type of chemical CECs studied and AS-WWTPs studied, (ii) evaluate the influence of key operational parameters of AS-systems, namely MLSS, HRT, and nitrification, on CEC removal, (iii) develop and validate, using seven full-scale AS reactors from three full-scale WWTPs, a simplified predictive model of CEC removal in different variants of AS-system and integrate it in the CEC ForecastTool, and (iv) demonstrate its applicability as a practical decision-support tool by assessing the transferability of the modelling approach using data from two additional previously studied WWTPs.
2. Simplified Model Proposed
For modelling chemical CEC removal in AS-systems, the established pseudo-first-order biodegradation kinetic model for plug-flow reactors [6,7,8] was used as the theoretical basis. In this formulation, the concentration decrease of a given CEC is described by Equation (1):
where C is the CEC concentration, MLSS is the mixed liquor suspended solids concentration, and kbio is the compound-specific biodegradation rate constant.
Assuming constant MLSS and plug-flow behaviour, integration of Equation (1) over the hydraulic retention time, HRT, gives:
where C0 and C are the influent and effluent CEC concentrations, respectively. Since removal efficiency is defined as , the ideal literature-based removal expression becomes:
However, literature kbio values are commonly obtained under controlled experimental conditions and may not directly represent full-scale AS behaviour. In addition, as previously mentioned, full-scale reactors may deviate from ideal conditions depending on operational and biological factors, such as sludge retention time, nitrification conditions, organic loading, and microbial activity. To account for this non-ideal behaviour while retaining a simple operational formulation, a dimensionless lumped correction factor, a, was introduced, resulting in:
where Er is dimensionless, the factor ‘a’ is dimensionless, MLSS is in g/L, HRT is in days, and kbio is in L/(g SS.d), and was taken from literature values. The factor ‘a’ is reactor-specific but not compound-specific and was introduced to translate literature-based biodegradation kinetics to full-scale observed performance. Thus, ‘a’ does not replace kbio, but scales the ideal kinetic prediction to account for full-scale reactor-specific behaviour.
In this study, kbio values were fixed from literature and were not fitted to the experimental dataset. For each reactor, a single value of factor ‘a’ was calibrated using the median observed removal efficiencies of the quantified CECs for which literature kbio values were available. Removal efficiencies limited by effluent concentrations below the limit of quantification (LOQ), as well as compounds without available kbio values, were excluded from model calibration. The calibration was performed by minimizing the difference between observed and predicted CEC removal efficiencies across compounds using Equation (4).
The proposed model is therefore not intended to replace detailed mechanistic fate models or to introduce a new biodegradation mechanism. Rather, it provides a simplified and operation-oriented forecasting framework that combines literature-derived biodegradation information with routinely available full-scale operational parameters. Its contribution lies in adapting, calibrating, validating, and testing the robustness of this reduced-form kinetic expression for practical full-scale WWTP assessment and decision support.
3. Materials and Methods
3.1. WWTPs Used as Case-Studies
Three urban WWTPs were studied, namely Serzedelo I (SI), Serzedelo II (SII), and Lordelo (LOR) (as illustrated in Supplementary material, Figure S1). The plants are located in the Ave River basin, in northern Portugal, integrated in the SIDVA system and operated by TRATAVE until July 2025.
SI and SII share a common wastewater inflow. SI has a nominal treatment capacity of 15,120 m3/d and 100,800 population equivalents (p.e.), while SII has a capacity of 25,577 m3/d and 170,513 p.e.. LOR has a treatment capacity of 28,063 m3/d and 187,087 p.e.. The plants discharge into rivers characterized by extended periods of low dilution rations (below 1/20 and even below 1/10), particularly SI (Selho river), followed by LOR (Vizela river) and SII (Ave river). During the project campaigns, from October 2023 to October 2024, SI operated at a median daily flowrate of 11,616 m3/d, SII at 28,088 m3/d and LOR at 21,394 m3/d.
The influent to SI and SII receives strong contributions from hospital and textile industry effluents, with industrial discharges accounting for approximately 23% of the total flow. In contrast, LOR exhibits a higher industrial input, with textile effluents representing about 51% of the total flow. Overall, the influents exhibited medium-high concentration of organic matter (BOD5, COD, TOC), nutrients (particularly, total nitrogen, N-t) and colour (Table S1 in Supplementary material), compared with typical untreated domestic wastewater in the U.S. [18]. These plants present higher concentrations of organic matter and colour than those reported for the two Portuguese WWTPs previously mentioned [4,19].
The WWTPs employ different AS-reactor configurations under extended aeration, each comprising several treatment lines operating in parallel (Figure S1):
- SI WWTP: Four treatment lines in parallel, each with a plug-flow reactor with mechanical aerators (turbines) followed by a settler; coagulant is added for colour control;
- SII WWTP: Two treatment lines in parallel, each with a pre-anoxic selector, an oxidation ditch with fine-bubble air diffusers followed by a settler, also with coagulant dosing for colour control;
- LOR WWTP: Two treatment lines in parallel, each with a covered AS-reactor with liquid oxygen injection, followed by a settler, after which the secondary effluent goes through sand filtration and ozonation.
This study focused exclusively on the biological treatment by AS-systems. The earlier studied WWTPs integrated a A2O (anaerobic/anoxic/oxic) system and an oxidation ditch [4].
3.2. Strategies and Campaigns in the WWTPs
Within the LIFE Fitting project (July 2023 – June 2025), full-scale field campaigns were carried out in the three WWTPs to (i) test feasible modifications of key operating conditions in secondary/tertiary treatment by AS, namely F/M ratio (in SI, SII, LOR) and nitrification conditions (in SII); (ii) compare parallel and distinct AS-reactor configurations; and (iii) obtain the data required to develop, demonstrate, and validate the CEC ForecastTool and the CEC forecast model behind it.
The F/M campaigns involved adjusting waste sludge flow rates to vary the MLSS concentration in parallel AS lines, as follows:
- SI: Three MLSS concentration levels within the 3000–5000 mg/L range (target) were tested simultaneously in three AS-lines, in 8 campaigns from October 2023 to July 2024. The actual values tested are shown in Figure S2 and varied in the 2520–5750 mg/L range with median values of 5125, 2975, and 4280 mg/L, corresponding to median F/M ratios of 0.06 d⁻¹, 0.10 d⁻¹, and 0.08 d⁻¹, respectively, in each line (Figure S1).
- SII: Conducted concurrently with the SI campaigns, two AS-lines were operated in the 8 campaigns, from October 2023 to July 2024, with high MLSS concentration (target ~5000 mg/L, actual values in the 4200–6300 mg/L range, with median values of 4960 and 5480 mg/L (Figure S3)), corresponding to median F/M ratios of 0.08 d⁻¹ and 0.07 d⁻¹, respectively (Figure S1). Median HRT was 28 h in SI and 23 h in SII.
- LOR: Sequential MLSS variations (3500–4500 mg/L) were implemented between two operational periods under similar HRT — median values of 4500 mg/L and 17 h (5 campaigns from October 2023–March 2024) and 3440 mg/L and 19 h (3 campaigns April–July 2024) (Figure S4), corresponding to median F/M ratios of 0.10 d⁻¹ and 0.14 d⁻¹, respectively (Figure S1).
Regarding nitrification, in addition to natural variations in nitrification conditions across the F/M campaigns and among WWTPs, two dedicated nitrification trials were conducted in SII. Different ammonia setpoints were imposed in parallel lines by adjusting blower operating times/frequencies, resulting in (Figure S1):
- SII, line 1: 80–86% N–NH₄⁺ removal and 88–89% N-t removal, specific nitrification rate (SNR) of 4.5-6.4 g N–NH₄⁺/(kg VSS·d);
- SII, line 2: 43–56% N–NH₄⁺ and 58–69% N-t removal, SNR 3.0-3.2 g N–NH₄⁺/(kg VSS·d).
3.3. Water Quality Parameters and Analytical Methods
The wastewater samples were analysed for:
- 57 chemical CECs: anastrozole (ANAS), acetaminophen (APAP), atenolol (ATN), azathioprine (AZA), buprenorphine (BUP), butorphanol (BUT), bezafibrate (BZF), caffeine (CAF), clarithromycin (CAM), capecitabine (CAPE), carbamazepine (CBZ), clofibric acid (CFA), chloramphenicol (CHL), citalopram (CITA), cyclophosphamide (CP), ciprofloxacin (CPFX), cyclobenzaprine (CYC), diclofenac (DCF), diazepam (DZP), enalapril (ENL), flutamide (FL), fluoxetine (FLX), furosemide (FR), gabapentin (GBP), gemfibrozil (GEM), hydrochlorothiazide (HCTZ), ifosfamide (IFO), indomethacin (IND), iohexol (IOH), iomeprol (IOM), iopamidol (IOPA), iopromide (IOPR), irbesartan (IRB), ketoprofen (KEP), lincomycin (LCM), loperamide (LP), mycophenolate de mofetil (MFF), metoprolol (MTPL), metronidazole (MTZ), naproxen (NPX), oxazepam (OXA), piroxicam (PIR), propranolol (PPNL), paclitaxel (PTX), salbutamol (SAL), sertraline (SER), sulfamethoxazole (SMX), sulfamethazine (SMZ), sotalol (SOT), terbutaline (TBL), thebaine (TEB), trimethoprim (TMP), tramadol (TRA), valsartan (VAL), venlafaxine (VEN), warfarin (WAR), zolpidem (ZOL);
- Effluent organic matter (EfOM), in terms of total organic carbon (TOC) and dissolved organic carbon (DOC), turbidity, UV transmittance at 254 nm (T254), electrical conductivity (EC), and alkalinity;
- total suspended solids (TSS), chemical oxygen demand (COD), 5-day biochemical oxygen demand (BOD5), total and ammonium nitrogen (N-t, N–NH₄⁺), and total phosphorus (P-t).
The chemical CECs were analysed in 48-h composite water samples, by external/commercial laboratories, using liquid chromatography coupled to tandem mass spectrometry with direct injection or after sample pre-concentration by solid-phase extraction (LC-MS/MS, US EPA Method 1694:2007). The remaining parameters were analysed using standard methods of analysis (SMEWW 2012) with the equipment and materials described in Viegas et al. [5].
In addition, MLSS was determined in each reactor, as TSS concentration measured in AS mixed liquor. The wastewater daily flowrate values (Q) were collected and processed for computing the 48-h average values of HRT (computed as V/Q, where V is the AS-reactor volume), F/M (computed as influent BOD5 ⋅ Q/(0.8 MLSS ⋅ V)), and SNR (computed as (N-NH4+in – N-NH4+out) ⋅ Q/(0.8 MLSS ⋅ V).
3.4. Data Processing and Statistical Methods
The removal efficiency (Er) was calculated as 1 – Cout/Cin (-), where Cin and Cout are the influent and effluent concentrations, to assess the performance of each WWTP reactor. The WWTP reliability was assessed using the Niku’s reliability-based method, as explained in Silva and Rosa [20]. Medians (P50) and 25th (P25) and 75th (P75) percentiles (or P5 and P95) were computed. Statistical differences between reactors were assessed using the one-way analysis of variance ANOVA, when the assumption of homogeneity of variances was met, or the Welch’s F-test when it was not.
Principal Component Analysis (PCA) was applied to identify patterns in CEC removal among reactors. The analysis was performed using SOLO (Eigenvector Research, Inc.) and is detailed in text S1 in Supplementary material. To assess the goodness-of-fit of the models, the coefficient of determination (R²) and the Normalized Root Mean Square Error (NRMSE, equation S2), were calculated.
To assess predictive reliability and potential overfitting of the simplified model, a leave-one-CEC-out cross-validation (LOOCV) procedure was performed for each reactor, whereby one compound was excluded at a time, the parameter ‘a’ was recalibrated using the remaining 12 CECs, and the removal of the excluded compound was predicted. Model performance was then evaluated using R2 and NRMSE.
A deterministic sensitivity analysis was conducted to assess the influence of uncertainty in literature-derived kbio values on model predictions. For each reactor, all kbio values were multiplied by fixed perturbation factors of 0.5, 0.75, 1.25, 1.5 and 2.0, while keeping the calibrated reactor-specific factor ‘a’ unchanged. Model performance was then recalculated using R² and NRMSE. For the aggregated analysis, metric variations were first calculated separately for each reactor relative to the baseline condition and then summarized across reactors as mean ± standard deviation.
3. Results and Discussion
4.1. Characterisation of WWTP Performance Towards Bulk Parameters and CECs
The plants’ performance towards bulk parameters of water quality was assessed in terms of compliance with the discharge consents and reliability, and in terms of removal efficiencies of COD, BOD5, TSS, DOC, turbidity, colour, P-t, N-NH4+, N-t, alkalinity, EC, A254, and A436 (Figure 1).
As previously found for earlier periods analysed [20], in 2023 and 2024 (during the project campaigns) the three plants were compliant and reliable. For the parameters included in the discharge consents (BOD₅, COD, and TSS), the median removal efficiencies (Figure 1) exceeded 92% in all cases, except for COD in LOR, and exhibited low variability (narrow P25–P75 ranges). Median DOC removals ranged between 69% and 86%, while turbidity removal was consistently high, with median values of 91–98%.
Although total phosphorus (P-t) is not included in discharge consents, its median removal ranged from 40% in LOR to 74% in SII. Regarding colour-scan (350-700 nm), median removal efficiencies in the secondary treatment of SI and SII (with coagulant addition) ranged from 49% to 61%, whereas lower median removals were observed at LOR (25–36%), as expected, since there is no coagulant addition and colour removal is ensured by downstream ozonation.
As shown in Figure 1, the WWTPs generally operated under nitrifying conditions, achieving substantial N-NH4+ removal, with median efficiencies of 77–82% in SI (range of the three parallel lines studied) and 69–75% in SII. In LOR, nitrification was consistently lower than in SI and SII, particularly during the first operational period, and more variable, i.e. 38–70% median N-NH4+ removal. Consistent with previous findings [4], reductions in alkalinity were associated with nitrification conditions (Figure 1).
Regarding the chemical CEC occurrence in the studied WWTP influents, around 40% of the chemical CECs analysed (22 CECs out of 57) were quantified in the influents of SI/SII and LOR WWTPs during the F/M and N-campaigns herein reported (9 samples; Figure S5). Caffeine and the analgesics and/or anti-inflammatories acetaminophen (also known as paracetamol), ibuprofen, and naproxen were among the most abundant compounds in the raw wastewater samples, usually exhibiting median concentrations in the tens of µg/L. Diclofenac, another anti-inflammatory drug, was also detected, particularly in SI/SII, at concentrations in the µg/L range. Iopromide, an X-ray contrast agent, was present at elevated levels in both treatment plants, ranging from a few µg/L in LOR to several tens of µg/L in SI/SII. Other highly quantified compounds included the psychiatric drug gabapentin, the antibiotic ciprofloxacin, and various antihypertensives, such as valsartan, furosemide, irbesartan, and hydrochlorothiazide. Restricting the analysis to the UWWTD-micropollutant indicator substances, those with influent concentrations ≥ 1 µg/L were irbesartan, diclofenac, and hydrochlorothiazide for SI/SII. Some of the indicator substances were never or not always quantified in the influents of the WWTPs studied, e.g. metoprolol and clarithromycin.
Overall, the dominant chemical CECs observed in this study followed the trends reported in other European countries and WWTPs in Portugal [19,21], such as Beirolas (BEI) and Faro Noroeste (FNW) (Figure 2). The lower median influent concentrations observed in this study (in SI/II and LOR) compared to BEI and FNW, which are predominantly non-industrial WWTPs, are consistent with the substantial input from the textile industry in SI/SII (23% average of total flowrate) and particularly in LOR (51% average of total flowrate). This highlights that industrial inputs can significantly alter influent CEC profiles, reduce apparent concentrations and potentially influence biodegradation.
The input from hospital wastewater in SI/SII also contributed to statistically significant differences in the concentration of specific chemical CECs between SI/SII and LOR, namely the X-ray contrast agent iopromide (IOPR) (Figure S5).
With respect to CEC removal in AS-treatment, looking at the 22 CECs quantified in the influents, the removal efficiencies (Figure 3) show AS treatment highly removed the biodegradable compounds, like the analgesic paracetamol (≥ 99 % median removal), the anti-inflammatory naproxen (≥ 93 %), and caffeine (≥ 93 %), whereas some CEC were recalcitrant (< 20 %), especially those listed in the revised UWWTD (e.g. the antiepileptic carbamazepine, the anti-inflammatory diclofenac, and the anti-depressant venlafaxine). Others, such as antibiotics (e.g. ciprofloxacin), psychiatric drugs (e.g. the antiepileptic gabapentin), and contrast agents (e.g. iopromide), had intermediate or variable removal, and these should be the optimisation target. It should be noted that the calculated removal efficiencies for compounds (e.g., sulfamethoxazole, erythromycin, azithromycin, ibuprofen) with effluent concentrations below the limit of quantification (LOQ) are likely underestimated.
Some CECs (tramadol, hydrochlorothiazide, irbesartan, diclofenac, carbamazepine, citalopram, oxazepam, and venlafaxine) exhibited negative removals (Figure 3) and these observations are consistent with findings reported in other studies [4,22,23,24]. Kumar et al. [25] highlighted that negative efficiencies are influenced by factors such as conjugation–deconjugation (enzymatic deconjugation of conjugated metabolites and retransformation of the metabolites into the parent compound), types of WWTPs, transformations, leaching, operational parameters, sampling schemes, and nature of substance.
Twelve chemical CECs (marked with * in Figure 3) showed statistically significant differences between WWTPs, namely, diclofenac and carbamazepine (both listed in the UWWTD), as well as ciprofloxacin, sulfamethoxazole, furosemide, valsartan, ketoprofen, gabapentin, oxazepam, sertraline, iopromide, and caffeine. The main differences were found between the three WWTPs, while no significant variation has occurred with F/M variation within each plant, likely because all AS-reactors were operating at very low F/M values.
A principal component (PC) analysis model was built from the removal profiles (22 CECs) across the seven reactors (Figure 4). The first two PCs explained 72.2% of the total variance (PC1: 47.1%; PC2: 25.1%) and already provided a stable grouping of reactors. Leave-one-out cross-validation indicated no improvement beyond two PCs (RMSECV = 1.8 for 1–2 PCs), whereas adding further PCs increased RMSECV, suggesting overfitting for this limited dataset. No outliers were flagged by Hotelling’s T² or Q-residual diagnostics. The PCA analysis (Figure 4) clearly highlights the operational distinctions among the different WWTPs. The three SI reactors (SI DEC1, SI DEC2, and SI DEC3) cluster closely within the same region of the PCA space, indicating a high degree of similarity in their performance. The two SII reactors (SII DEC1 and SII DEC2) form a separate group, reflecting a distinct behaviour relative to SI plant. The LOR reactors are positioned in other regions of the PCA plot, further emphasizing their divergence from both SI and SII. Complementary clustering analyses yielded similar groupings, supporting the robustness of the PCA results, as shown in Figure S6.
The differences between WWTPs found for some CECs were primarily attributed to different nitrification performance expressed by the removal efficiencies (Er) of N-NH4+ (and N-t) (Figure S7 for iopromide), and indirectly by the alkalinity reduction (nitrification reduces alkalinity), with higher values generally correlating with improved performance on CEC removal, as earlier found [4].
The enhanced removal of some chemical CECs under effective nitrification conditions has been previously reported in the literature [9,10,11,12,13,14,15,16] and was further confirmed through dedicated nitrification campaigns conducted at SII (Figure S8). The 30-37 percentual points’ improvement in N-NH4+ removal (from 43-56% to 80-86%) (Figure S8 top) (associated with 20-30 percentual points’ improvement in N-t removal, from 58-69% in line 2 to 88-89% in line 1), allowed higher removal of chemical CECs, mainly for hydrochlorothiazide, valsartan, naproxen, gabapentin, oxazepam, iopromide, and caffeine (Figure S8 down).
These removals are related with the SNR, as shown in Figure 5 and found in other studies [16,26]. Lee et al. [16] also identified that valsartan was biodegraded predominantly by nitrifiers, whereas caffeine and naproxen were biodegraded predominantly by heterotrophs, with nitrifying activity having a greater effect on kbio than heterotrophic activity, and that high NH4+ concentrations reduced the kbio of nitrifier-degraded CECs, possibly due to competitive inhibition. In turn, Gonzalez-Gil et al. [13] identified that the nitrifying sludge presented a higher capacity to biotransform naproxen and identified iopromide and sulfamethoxazole as being dependent on nitrifying activity. Shin et al. [27] also demonstrated that caffeine, naproxen, and iopromide exhibited different values of kbio depending on the redox conditions, highlighting the importance of operational parameters in CEC biodegradation. While biological indicators, such as microbial community composition or sludge activity (e.g., nitrification rate or oxygen uptake rate), are known to influence micropollutant biodegradation, usually they are not explicitly included in predictive models. Instead, their effects are generally reflected indirectly through variations in kbio values reported in the literature.
Based on these experimental findings, a simplified modelling approach was then applied to quantify the role of operational parameters in CEC removal.
4.2. Application and Validation of the Simplified Model for CEC Removal
For data modelling, the CEC removal efficiencies limited by the LOQ were not considered, nor were those of parameters for which no kbio values were available in the literature (Table S2). Consequently, the analyses were carried out with 13 CECs. The results (Figure 6) showed that the removal efficiencies of these 13 CECs closely followed the previously observed sigmoidal Er-kbio trend reported by Silva et al. [4] for other two urban WWTPs.
The first approach involved modelling the removal efficiencies using the kinetic approach presented in Section 2 and determining the factor ‘a’ for each AS reactor, since some observed differences could not be explained solely by MLSS and HRT. The factor ‘a’ varied between 0.19 and 0.41 in SI, SII and LOR, as shown in Table 1.
To further assess the statistical robustness of the calibrated reactor-specific factors and evaluate predictive reliability beyond the calibration metrics, a leave-one-CEC-out cross-validation (LOOCV) was performed for each reactor. In each fold, one CEC was excluded, ‘a’ was recalibrated using the remaining 12 CECs, and the removal of the excluded compound was predicted. Model performance was then evaluated using R2 and NRMSE. The cross-validation results were very close to the calibration metrics, with R2CV ranging from 0.84 to 0.94 and NRMSECV from 9.9% to 15.3% across the nine reactors. These results indicate that the fitted reactor-specific ‘a’ values retained predictive capability for compounds not included in the calibration step and that the model did not show evidence of significant overfitting.
The ‘a’ values obtained (0.19-0.41) suggest that this factor may account for the active biomass fraction (i.e., the portion of the measurable MLSS biologically active for CEC removal) and/or for the possible overestimation of literature-based kbio values. Indeed, kbio values reported in the literature (Table S2) vary substantially depending on: (i) whether the CECs are biodegraded mainly by nitrifiers—where kbio increases with nitrifying activity—or by heterotrophs—where kbio remains relatively stable despite variations in organic matter concentration or heterotrophic activity [16]; (ii) the temperature [28]; and (iii) the type of activated sludge treatment [29,30].
To further interpret factor ‘a’ variability across reactors, the individual values of ‘a’ obtained for each reactor were compared in relation to their operating conditions. For each reactor, higher F/M ratios were associated with higher ‘a’ values. This suggests that parameters other than MLSS and HRT, such as microbial community composition or temperature, may also influence the overall biodegradation kinetics.
Under controlled conditions within the same WWTP, comparing parallel treatment lines with the same influent characteristics, a clear association between nitrification activity (e.g., SNR) and removal efficiency could be observed (Figure 5). However, when extending the analysis across different WWTPs, this relationship becomes less consistent, as multiple factors influence CEC removal. Given the complexity and limited availability of measurements related to microbial community composition and activity in full-scale systems, the simplified model therefore assumed their effects were incorporated into factor ’a’, ensuring that the model remains simple and applicable using standard operational data. The subsequent step consisted of aggregating all datasets to determine whether a single ‘a’ value fits all AS-reactors and conditions tested, thereby enabling the model to be generalized across the different treatment lines. When all reactors were considered together (median campaign values; 91 data points), ‘a’ was determined to be 0.26, with a R² of 0.89 and a NRMSE of 12%, confirming a strong correlation between the model and the observed data (Figure 7).
A sensitivity analysis using the ‘a’ factor of 0.26 (Figure 8 left) further highlights the impact of MLSS and HRT variations on CEC removal. For instance, for sulfamethoxazole (SMX), with a kbio of 0.4 L/(gSS·d)), the expected removal efficiency is 30% at HRT of 28 h and MLSS concentration of 3 g/L, improving to 45% when MLSS is raised to 5 g/L under the same HRT conditions (Figure 8 left). This analysis and Figure 8 (right) underscore the critical role of optimizing MLSS and HRT to enhance the removal of compounds of lower biodegradability [24,26,31,32]. The operational optimization must be evaluated within plant-specific technical and economic constraints. In the studied WWTPs, different responses were observed. In SI and LOR, increasing MLSS allowed improving treatment performance without increasing aeration energy demand (data not shown), indicating potential for energy savings. In contrast, in SII, the nitrification promotion slightly increased energy consumption, highlighting the trade-offs associated with higher biological activity. These results illustrate that optimization strategies must be site-specific and balanced against operational costs.
The transferability of the modelling approach was further assessed using data from two Portuguese WWTPs analysed in the previously mentioned study [19,21] (Table 1). When applying the same adjustment factor (a = 0.26), the model did not adequately capture site-specific behaviour (R2 = 0.71 and NRMSE = 19.6% in BEI, Figure S9 left top; R2 = 0.83 and NRMSE = 14.1% in FNW, Figure S9 left bottom). After calibrating the adjustment factor for each system (‘a’ = 0.61 for BEI and ‘a’ = 0.44 for FNW), an improved model fit was obtained (R2 = 0.95 and NRMSE = 8.3% in BEI, Figure S9 right top; R2 = 0.90 and NRMSE = 10.6% in FNW, Figure S9 right bottom), thereby confirming the transferability of the model structure to independent full-scale systems when a simple site-specific calibration of ‘a’ is performed. The higher values of the adjustment factor observed for these WWTPs (Table 1) are likely associated with influent characteristics, nitrification conditions, and reactor configuration (A2O in BEI WWTP and oxidation ditch in FNW WWTP), as previously discussed. As so, these results show that while a global ‘a’ value of 0.26 provides a reasonable first approximation, site-specific calibration improves model accuracy and it is needed when: (i) influent characteristics differ (e.g., industrial contributions), (ii) treatment configurations vary (e.g., A2O vs. conventional activated sludge), or (iii) biological activity differs (e.g., nitrification performance). The model structure itself is transferable; however, the parameter “a” acts as a lumped correction factor capturing site-specific conditions. Therefore, the model can be applied across systems, provided that a limited calibration step is performed, which remains significantly simpler than full mechanistic model calibration.
A deterministic sensitivity analysis was conducted to assess the influence of uncertainty in literature-derived kbio values on model predictions for the 5 WWTPs. The analysis showed a consistent U-shaped response of model performance to perturbations in literature-derived kbio values across the nine reactors (Figure S10). Model performance remained relatively stable for moderate deviations from the baseline values (±25%), whereas larger perturbations led to a progressive increase in prediction error and greater variability between reactors. The response was slightly asymmetric, with stronger deterioration when decreasing kbio, consistent with the exponential structure of the model. Overall, although compound-specific uncertainty in kbio remains a relevant limitation, the results indicate that the forecasting model is moderately robust to uncertainty in literature-derived biodegradation kinetics.
Despite the robustness of the results in 5 full scale WWTPs, further testing under different environmental conditions, reactor configurations, and wastewater compositions is planned to strengthen its general applicability.
4.3. CEC ForecastTool
The algorithm derived from this analysis constitutes the core of the CEC ForecastTool (Figure S11), an innovative modelling and decision-support platform intended for WWTP operation planning rather than real-time control. It is based on steady-state assumptions and average operational conditions, and the extension to transient conditions (e.g., shock loads or temperature fluctuations) would require additional modelling complexity.
This tool was designed to support scenario analysis and plant optimization, enabling WWTP process engineers/managers to forecast micropollutant removal under site-specific conditions, identify critical and recalcitrant compounds, and simulate operational changes to improve performance and resource efficiency. By inputting key operational parameters—such as HRT, MLSS, and the target removal efficiency—the user can forecast the removal of individual micropollutants, identify recalcitrant CECs or those with intermediate and variable removal requiring additional measures, and calculate the necessary MLSS to achieve specific treatment goals. The tool also allows simulation of operational changes to assess their impact on contaminant removal (Figure 8, left and right), providing actionable guidance to enhance resource efficiency while ensuring compliance with the revised UWWTD requirements.
Optimizing the biological process therefore represents a practical and cost-effective strategy to enhance CEC removal and to minimize the operational costs on subsequent quaternary treatments. Actually, even with optimized conditions, conventional biological treatment alone is most likely insufficient to achieve the 80% removal target established in the revised UWWTD. As so, beyond the optimization of biological treatment, the ForecastTool also integrates ozonation algorithms [5] and is being further developed to incorporate additional advanced treatment modules.
The ForecastTool integrates biological treatment optimization with ozonation modelling in a sequential manner, where the predicted biological removal defines the influent conditions for the ozonation step. In particular, the biological process influences the effluent organic matter composition, which in turn affects ozone demand and micropollutant removal efficiency. While these interactions are partially captured through empirical relationships within the tool, the ozonation module is based on a recently developed phenomenological model that implicitly considers the impact of wastewater matrix characteristics on micropollutant oxidation [5]. This approach allows a more realistic representation of the dependence of ozone performance on effluent quality.
For example, AS operating conditions optimisation can increase the average removal in biological treatment of the six selected CECs from 23% to 58%, which translates into a substantial reduction in the ozone dose required to reach the 80% overall removal target, from 19.8 mg/L to 6.8 mg/L (Figure 9).
This flexibility allows users to assess combined or sequential processes—such as oxidation, adsorption, or membrane filtration—as recommended in the literature [21,33,34,35]. Such integrated approaches are essential to achieve the target for micropollutants established in the revised UWWTD, while supporting the design of cost-effective and energy-efficient treatment trains.
5. Conclusions
This study evaluated the removal of CEC in full-scale AS WWTPs and confirmed the strong influence of site-specific factors—particularly nitrification conditions, MLSS, and HRT. A simplified model and operation-oriented framework based on pseudo-first-order kinetics was developed, integrating MLSS, HRT and a lumped correction factor to adapt literature-derived biodegradation constants to full-scale conditions. The model showed a good fit to the observed data across five WWTPs, although calibration of factor ‘a’ remained site-dependent, reflecting local operational and influent conditions.
The model was implemented in the CEC ForecastTool, supporting the assessment of cost-effective strategies to meet forthcoming UWWTD requirements for micropollutant control. For instance, MLSS optimization allowed a reduction of 13 mg/L of the ozone dose required to achieve the 80% target removal. By providing a quantitative, user-friendly interface for predicting CEC removal and assessing compliance with the new UWWTD, the tool bridges the gap between research and practical implementation in wastewater management.
Overall, the results of this study advance the understanding of CEC behaviour in activated sludge systems, confirm the robustness of simplified kinetic approaches for full-scale forecasting, and deliver an operational framework that supports both regulatory compliance and sustainable optimization of UWWTPs. Future developments will focus on expanding the model validation to a wider range of WWTPs, incorporating uncertainty analysis, and integrating additional treatment technologies to further enhance its applicability as a decision-support tool.
Supplementary Materials
The following supporting information can be downloaded at the website of this paper posted on Preprints.org.
Funding
This work was supported by the European Union LIFE Programme under Grant Agreement 101114188 - LIFE22-ENV-PT-LIFE Fitting (https://lifefitting.lnec.pt/). The publication reflects only the authors' views, and the European Union is not liable for any use that may be made of the information contained herein.
Abbreviations
The following abbreviations are used in this manuscript:
| A2O | anaerobic/anoxic/oxic |
| AS | activated sludge |
| BOD5 | 5-day biochemical oxygen demand |
| CECs | contaminants of emerging concern |
| COD | chemical oxygen demand |
| DOC | dissolved organic carbon |
| EC | electrical conductivity |
| Er | Removal efficiency |
| F/M | Food/Microorganisms ratio |
| HRT | hydraulic retention time |
| kbio | biodegradation constant |
| Kd | adsorption onto sludge constant |
| LOQ | limit of quantification |
| MLSS | mixed-liquor suspended solids |
| N–NH₄⁺ | ammonium nitrogen |
| N-t | total nitrogen |
| PCA | Principal Component Analysis |
| P-t | total phosphorus |
| SNR | specific nitrification rate |
| TOC | total organic carbon |
| UWWTD | Urban Wastewater Treatment Directive |
| WWTPs | wastewater treatment plants |
References
- European Parliament and Council. (2024) Directive EU) 2024/3019 of the European Parliament and of the Council on urban wastewater treatment recast). Official Journal of the European Union.
- Clara, M.; Kreuzinger, N.; Strenn, B.; Gans, O.; Kroiss, H. The solids retention time—a suitable design parameter to evaluate the capacity of wastewater treatment plants to remove micropollutants. Water Res. 2005, 39(1), 97–106. [Google Scholar] [CrossRef] [PubMed]
- Erguder, T.H.; Demirer, G.N. Chapter 7. Biological treatment of micropollutants, in: J. Virkutyte, Rajender S. Varma, V. Jegatheesan Eds.), Treatment of Micropollutants in Water and Wastewater, IWA Publishing, London, 2010. UK ISBN: 9781843393160).
- Silva, C.; Almeida, C.M.M.; Rodrigues, J.A.; Silva, S.; Coelho, M.R.; Martins, A.; Lourinho, R.; Cardoso, E.; Cardoso, V. V.; Benoliel, M. J.; Mesquita, E.; Ribeiro, R.; Rosa, M.J. Improving the control of pharmaceutical compounds in activated sludge wastewater treatment plants: key operating conditions and monitoring parameters. J. Water Process Eng. 2023, 54, 103985. [Google Scholar] [CrossRef]
- Viegas, R.M.C.; Silva, C.; Campinas, M.; Paíga, P.; Delerue-Matos, C.; Costa, C.; Rosa, M.J. A novel phenomenological model for streamlined prediction and online monitoring of organic micropollutant removal in full-scale wastewater ozonation. Desalination 2026, 628, 120060. [Google Scholar] [CrossRef]
- Joss, A.; Zabczynski, S.; Göbel, A.; Hoffmann, B.; Löffler, D.; McArdell, C.S.; Ternes, T.; Thomsen, A.; Siegrist, H. Biological degradation of pharmaceuticals in municipal wastewater treatment: proposing a classification scheme. Water Res. 2006, 40(8), 1686–1696. [Google Scholar] [CrossRef] [PubMed]
- Pomies, M.; Choubert, J.-M.; Wisniewski, C. Coquery Modelling of micropollutant in biological wastewater treatments: A review. Sci. Total Environ. 2013, 443, 733–748. [Google Scholar] [CrossRef]
- Li, R.; Kadrispahic, H.; Jørgensen, M. K.; Brøndum Berg, S.; Thornberg, D.; Mielczarek, A. T.; Bester, K. Removal of micropollutants in a ceramic membrane bioreactor for the post-treatment of municipal wastewater. Chem. Eng. J. 2022, 427, 131458. [Google Scholar] [CrossRef]
- Fernandez-Fontaina, E.; Gomes, I.B.; Aga, D.S.; Omil, F.; Lema, J.M.; Carballa, M. Biotransformation of pharmaceuticals under nitrification, nitratation and heterotrophic conditions. Sci. Total Environ. 2016, 541, 1439–1447. [Google Scholar] [CrossRef] [PubMed]
- Margot, J.; Lochmatter, S.; Barry, D.A.; Holliger, C. Role of ammonia-oxidizing bacteria in micropollutant removal from wastewater with aerobic granular sludge. Water Sci. Technol. 2016, 73(3), 564–575. [Google Scholar] [CrossRef] [PubMed]
- He, Y.; Langenhoff, A.A.M.; Comans, R.N.J.; Sutton, N.B.; Rijnaarts, H.H.M. Effects of dissolved organic matter and nitrification on biodegradation of pharmaceuticals in aerobic enrichment cultures. Sci. Total Environ. 2018, 630, 1335–1342. [Google Scholar] [CrossRef] [PubMed]
- Di Marcantonio, C.; Bains, A.; Chiavola, A.; Singhal, N. Effect of oxic/anoxic conditions on the removal of organic micropollutants in the activated sludge process. Environ. Technol. Innov. 2020, 20, 101161. [Google Scholar] [CrossRef]
- Gonzalez-Gil, L.; Fernandez-Fontaina, E.; Singh, R.R.; Lema, J.M.; Carballa, M.; Aga, D.S. Feeding composition and sludge retention time both affect (co-) metabolic biotransformation of pharmaceutical compounds in activated sludge systems. J. Environ. Chem. Eng. 2021, 9, 105123. [Google Scholar] [CrossRef]
- Yan, R.; Wang, Y.Y.; Li, J.; Wang, X.; Wang, Y.Y. Determination of the lower limits of antibiotic biodegradation and the fate of antibiotic resistant genes in activated sludge: Both nitrifying bacteria and heterotrophic bacteria matter. J. Hazard. Mater. 2022, 425, 127764. [Google Scholar] [CrossRef] [PubMed]
- Di Marcantonio, C.; Chiavola, A.; Gioia, V.; Leoni, S.; Cecchini, G.; Frugis, A.; Ceci, C.; Spizzirri, M.; Boni, M.R. A step forward on site-specific environmental risk assessment and insight into the main influencing factors of CECs removal from wastewater. J. Environ. Manag. 2023, 325, 116541. [Google Scholar] [CrossRef]
- Lee, S.; Heo, S.; Lee, J.; Son, H.; Wang, J.; Kim, Y. M. Aerobic biodegradation of micropollutants by nitrifiers and heterotrophs: Changes in biodegradation rate constant depending on levels of growth substrates and microbial activities. Bioresour. Technol. 2025, 425. [Google Scholar] [CrossRef]
- Lautz, L.S.; Struijs, J.; Nolte, T.M.; Breure, A.M.; van der Grinten, E.; van de Meent, D.; van Zelm, R. Evaluation of SimpleTreat 4.0: Simulations of pharmaceutical removal in wastewater treatment plant facilities. Chemosphere 2017, 168, 870–876. [Google Scholar] [CrossRef]
- Metcalf & Eddy (2014) Wastewater engineering: Treatment and resource recovery (5th ed.). McGraw-Hill Professional, New York.
- Silva, C.; Almeida, C. M. M.; Rodrigues, J. A.; Silva, S.; Coelho, M. R.; Martins, A.; Alves, R.; Cardoso, E.; Cardoso, V. V.; Benoliel, M. J.; Rosa, M. J. Occurrence and seasonality of pharmaceutical compounds in urban wastewaters in two Portuguese regions. Urban Water J. 2021, 18(6), 465–478. [Google Scholar] [CrossRef]
- Silva, C.; Rosa, M.J. A treatment reliability-based method for supporting infrastructure asset management of wastewater treatment plants. Water 2022, 14, 1106. [Google Scholar] [CrossRef]
- Rosa, M. J.; Campinas, M.; Silva, C.; Mesquita, E.; Viegas, R. M. C. Controlling organic micropollutants in urban (waste)water treatment by activated carbon adsorption and membrane technology. Chapter 8 In Clean Technologies Toward the Development of a Sustainable Environment and Future. Pradeep Verma and Maulin P Shah (Eds.). IWA Publishing, London, 2023. pp. 141-176. ISBN: 9781789063776 paperback).
- Wiest, L.; Gosset, A.; Fildier, A.; Libert, C.; Hervé, M.; Sibeud, E.; Giroud, B.; Vulliet, E.; Bastide, T.; Polomé, P.; Perrodin, Y. Occurrence and removal of emerging pollutants in urban sewage treatment plants using LC-QToF-MS suspect screening and quantification. Sci. Total Environ. 2021, 774, 145779. [Google Scholar] [CrossRef]
- Burzio, C.; Ekholm, J.; Modin, O.; Falås, P.; Svahn, O.; Persson, F.; van Erp, T.; Gustavsson, D.J.I.; Wil´en, B.M. Removal of organic micropollutants from municipal wastewater by aerobic granular sludge and conventional activated sludge. J. Hazard. Mater. 2022, 438, 129528. [Google Scholar] [CrossRef]
- Ofrydopoulou, A.; Nannou, C.; Evgenidou, E.; Christodoulou, A.; Lambropoulou, D. Assessment of a wide array of organic micropollutants of emerging concern in wastewater treatment plants in Greece: occurrence, removals, mass loading and potential risks. Sci. Total Environ. 2022, 802, 149860. [Google Scholar] [CrossRef]
- Kumar, M.; Ngasepam, J.; Dhangar, K.; Mahlknecht, J.; Manna, S. Critical review on negative emerging contaminant removal efficiency of wastewater treatment systems: Concept, consistency and consequences. Bioresour. Technol. 2022, 352, 127054. [Google Scholar] [CrossRef]
- Fernandez-Fontaina, E.; Omil, F.; Lema, J.M.; Carballa, M. Influence of nitrifying conditions on the biodegradation and sorption of emerging micropollutants. Water Res. 2012, 46, 5434–5444. [Google Scholar] [CrossRef]
- Shin, J.; Lee, S.; Lee, J.; Son, H.; Lee, Y.; Mo Kim, Y. Impact of anaerobic zone on biodegradation of micropollutants: Comparison of micropollutants’ removal efficiencies in lab-scale anaerobic bioreactor and in full-scale anaerobic zone. Chem. Eng. J. 2024, 481, 148356. [Google Scholar] [CrossRef]
- Chae, S.H.; Lim, S.J.; Seid, M.G.; Ejerssa, W.W.; Son, A.; Son, H.; Choi, S.; Lee, W.; Lee, Y.; Hong, S.W. Predicting micropollutant fate during wastewater treatment using refined classical kinetic model based on quantitative monitoring in multi-metropolitan regions of South Korea. Water Res. 2023, 245, 120627. [Google Scholar] [CrossRef] [PubMed]
- Son, D.-J.; Kim, C.-S.; Park, J.-W.; Lee, J.-H.; Lee, S.-H.; Shin, S.-K.; Jeong, D.-H. Fate evaluation of pharmaceuticals in solid and liquid phases at biological process of full-scale municipal wastewater treatment plants. J. Water Process Eng. 2022, 46, 102538. [Google Scholar] [CrossRef]
- Choi, S.; Lee, W.; Son, H.; Lee, W.; Choi, Y.; Yeom, H.; Seo, C.; Lee, H.; Lee, Y.; Lim, S.J.; Chae, S.H.; Park, H.K.; Hong, S.W.; Kim, Y.M.; Lee, Y. Occurrence, removal, and prioritization of organic micropollutants in four full-scale wastewater treatment plants in Korea. Chemosphere 2024, 361, 142460. [Google Scholar] [CrossRef] [PubMed]
- Kennes-Veiga, D.M.; Gonzalez-Gil, L.; Carballa, M.; Lema, J.M. The organic loading rate affects organic micropollutants’ cometabolic biotransformation kinetics under heterotrophic conditions in activated sludge. Water Res. 2021, 189, 116587. [Google Scholar] [CrossRef] [PubMed]
- Feng, Z.; Schmitt, H.; van Loosdrecht, M.C.M.; Sutton, N.B. Removal of organic micropollutants under dry and wet weather conditions in a full-scale aerobic granular sludge plant. Water Res. 2025, 285, 124108. [Google Scholar] [CrossRef] [PubMed]
- Ben, W.; Zhu, B.; Yuan, X.; Zhang, Y.; Yang, M.; Qiang, Z. Occurrence, removal and risk of organic micropollutants in wastewater treatment plants across China: Comparison of wastewater treatment processes. Water Res. 2018, 130, 38–46. [Google Scholar] [CrossRef] [PubMed]
- Choi, S.; Yoom, H.; Son, H.; Seo, C.; Kim, K.; Lee, Y.; Kim, Y.M. Removal efficiency of organic micropollutants in successive wastewater treatment steps in a full-scale wastewater treatment plant: Bench-scale application of tertiary treatment processes to improve removal of organic micropollutants persisting after secondary treatment. Chemosphere 2022, 288, 132629. [Google Scholar] [CrossRef] [PubMed]
- Ghazal, H.; Koumaki, E.; Hoslett, J.; Malamis, S.; Katsou, E.; Barcelo, D.; Jouhara, H. Insights into current physical, chemical and hybrid technologies used for the treatment of wastewater contaminated with pharmaceuticals. J. Clean. Prod. 2022, 361, 132079. [Google Scholar] [CrossRef]
- Blair, B.; Nikolaus, A.; Hedman, C.; Klaper, R.; Grundl, T. Evaluating the degradation, sorption, and negative mass balances of pharmaceuticals and personal care products during wastewater treatment. Chemosphere 2015, 134, 395–401. [Google Scholar] [CrossRef] [PubMed]
- Tran, N. H.; Reinhard, M.; Yew-Hoong Gin, K. Occurrence and fate of emerging contaminants in municipal wastewater treatment plants from different geographical regions-a review. Water Res. 2018, 133, 182–207. [Google Scholar] [CrossRef] [PubMed]
- Jones, O.A.H.; Voulvoulis, N.; Lester, J.N. Aquatic environmental assessment of the top 25 English prescription pharmaceuticals. Water Res. 2002, 36(20), 5013–5022. [Google Scholar] [CrossRef] [PubMed]
- Pomies, M.; Choubert, J.-M.; Wisniewski, C.; Coquery, M. Modelling of micropollutant in biological wastewater treatments: A review. Sci. Total Environ. 2013, 443, 733–748. [Google Scholar] [CrossRef]
- Falås, P.; Longrée, P.; la Cour Jansen, J.; Siegrist, H.; Hollender, J.; Joss, A. Micropollutant removal by attached and suspended growth in a hybrid biofilm activated sludge process. Water Res. 2013, 47(13), 4498–4506. [Google Scholar] [CrossRef] [PubMed]
- Kern, S.; Baumgartner, R.; Helbling, D.E.; Hollender, J.; Singer, H.; Loos, M.J.; Schwarzenbach, R.P.; Fenner, K. A tiered procedure for assessing the formation of biotransformation products of pharmaceuticals and biocides during activated sludge treatment. J. Environ. Monit. 2010, 12, 2100–2111. [Google Scholar] [CrossRef] [PubMed]
- Helbling, D.E.; Hollender, J.; Kohler, H.-P.E.; Fenner, K. Structure-based interpretation of biotransformation pathways of amide-containing compounds in sludge-seeded bioreactors. Environ. Sci. Technol. 2010, 44, 6628–6635. [Google Scholar] [CrossRef] [PubMed]
Figure 1.
Removal efficiencies in AS-lines of SI, SII, and LOR operated under different controlled conditions of F/M and HRT: 3 parallel lines in SI with F/M 0.06, 0.10, and 0.08 d-1 and HRT 28 h; 2 parallel lines in SII with F/M 0.07 and 0.08 d-1 and HRT 23 h; 1 line and F/M 0.10 d-1 and HRT 17 h and 0.14 d-1 and 19 h sequentially studied in LOR (the bars represent the overall medians; error bars represent P25–P50–P75).
Figure 1.
Removal efficiencies in AS-lines of SI, SII, and LOR operated under different controlled conditions of F/M and HRT: 3 parallel lines in SI with F/M 0.06, 0.10, and 0.08 d-1 and HRT 28 h; 2 parallel lines in SII with F/M 0.07 and 0.08 d-1 and HRT 23 h; 1 line and F/M 0.10 d-1 and HRT 17 h and 0.14 d-1 and 19 h sequentially studied in LOR (the bars represent the overall medians; error bars represent P25–P50–P75).
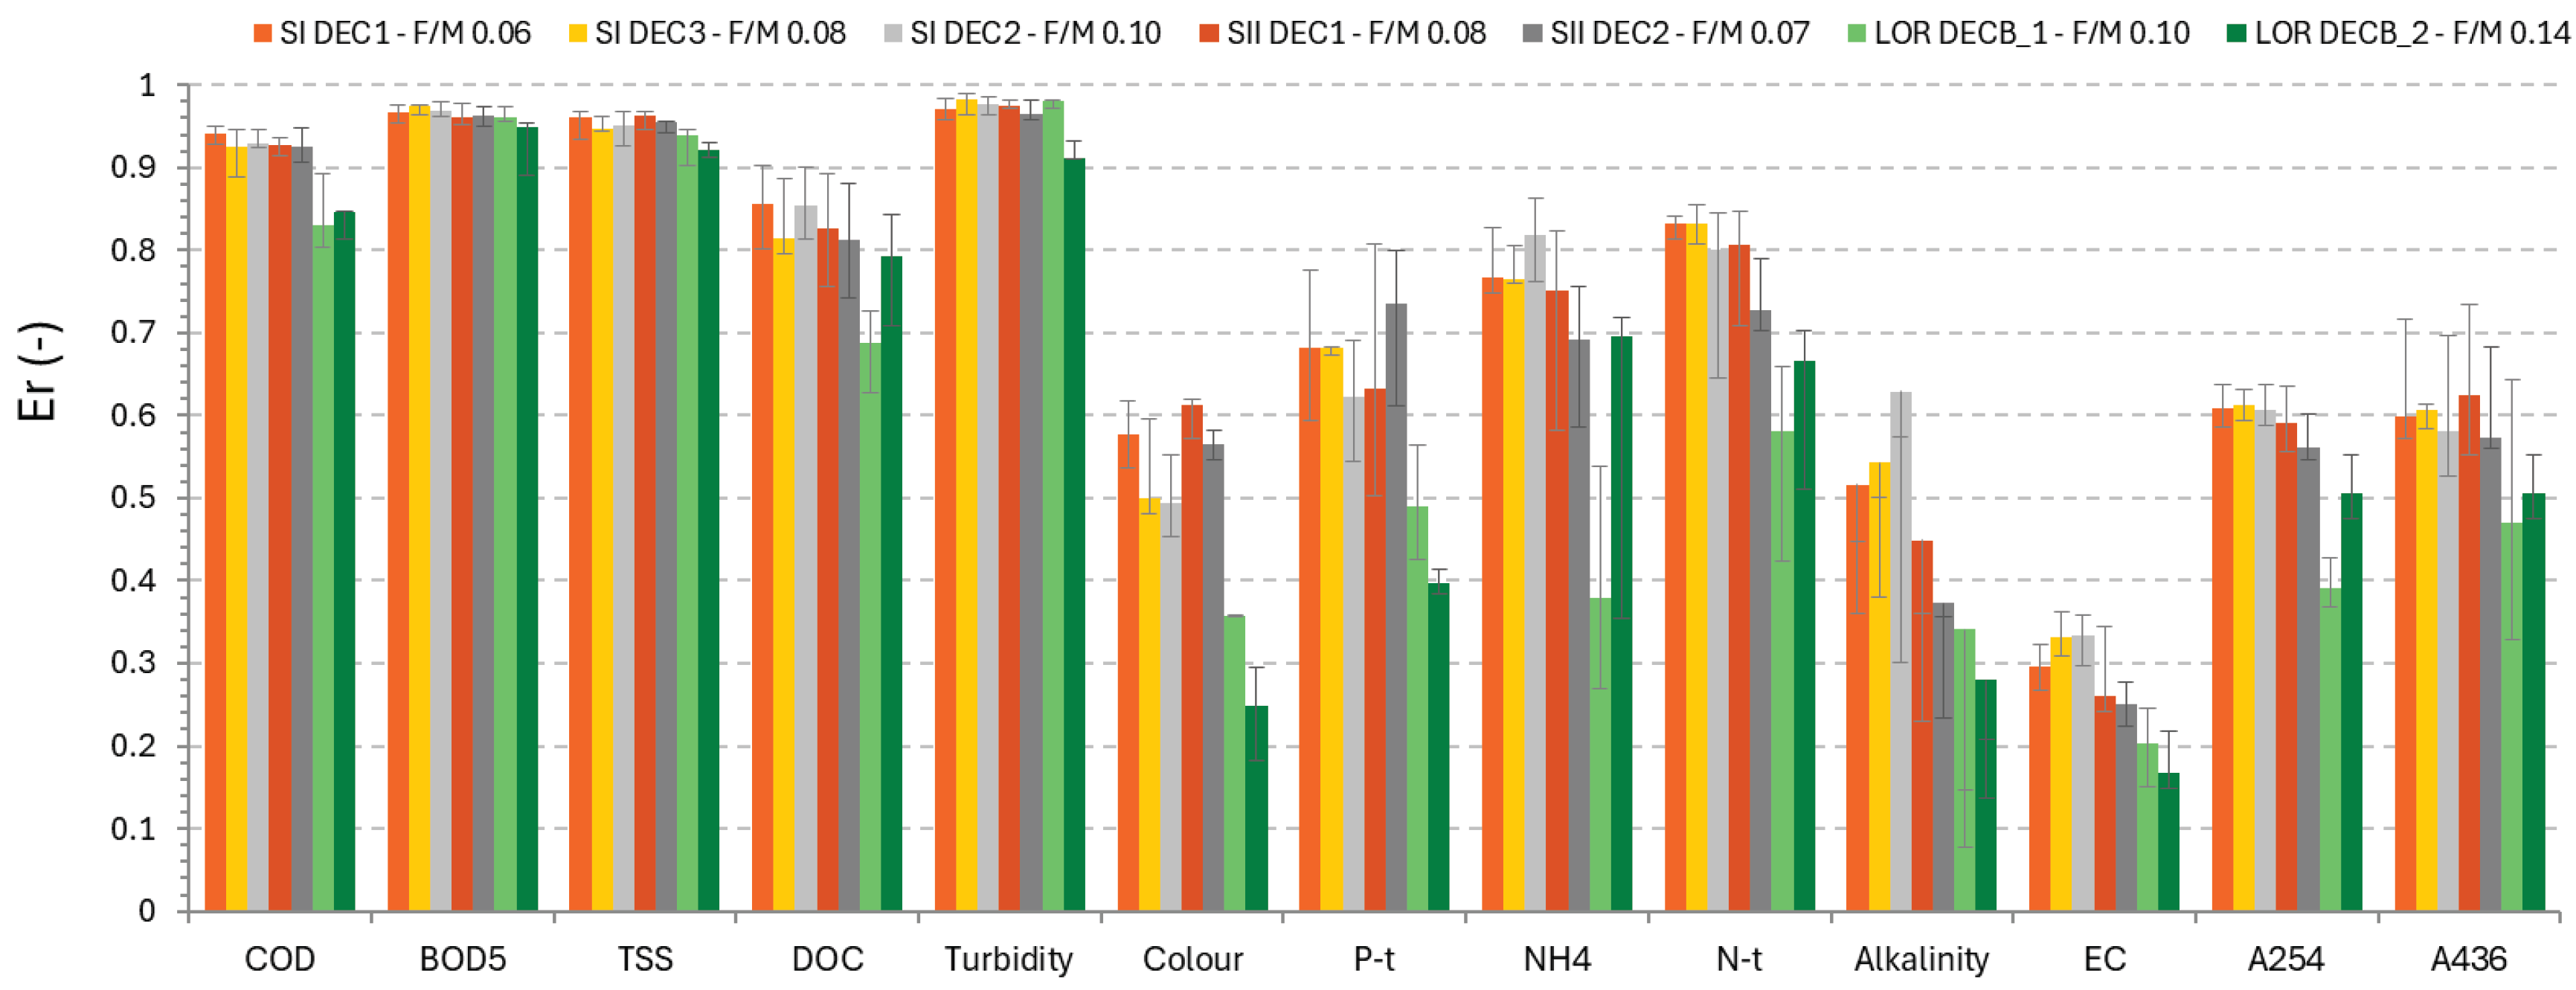
Figure 2.
Influent concentrations (median, P5 and P95) of 11 chemical CECs monitored in SI/SII and LOR WWTPs in LIFE Fitting and their comparison with other two Portuguese urban WWTPs, BEI and FNW WWTPs [19].
Figure 2.
Influent concentrations (median, P5 and P95) of 11 chemical CECs monitored in SI/SII and LOR WWTPs in LIFE Fitting and their comparison with other two Portuguese urban WWTPs, BEI and FNW WWTPs [19].
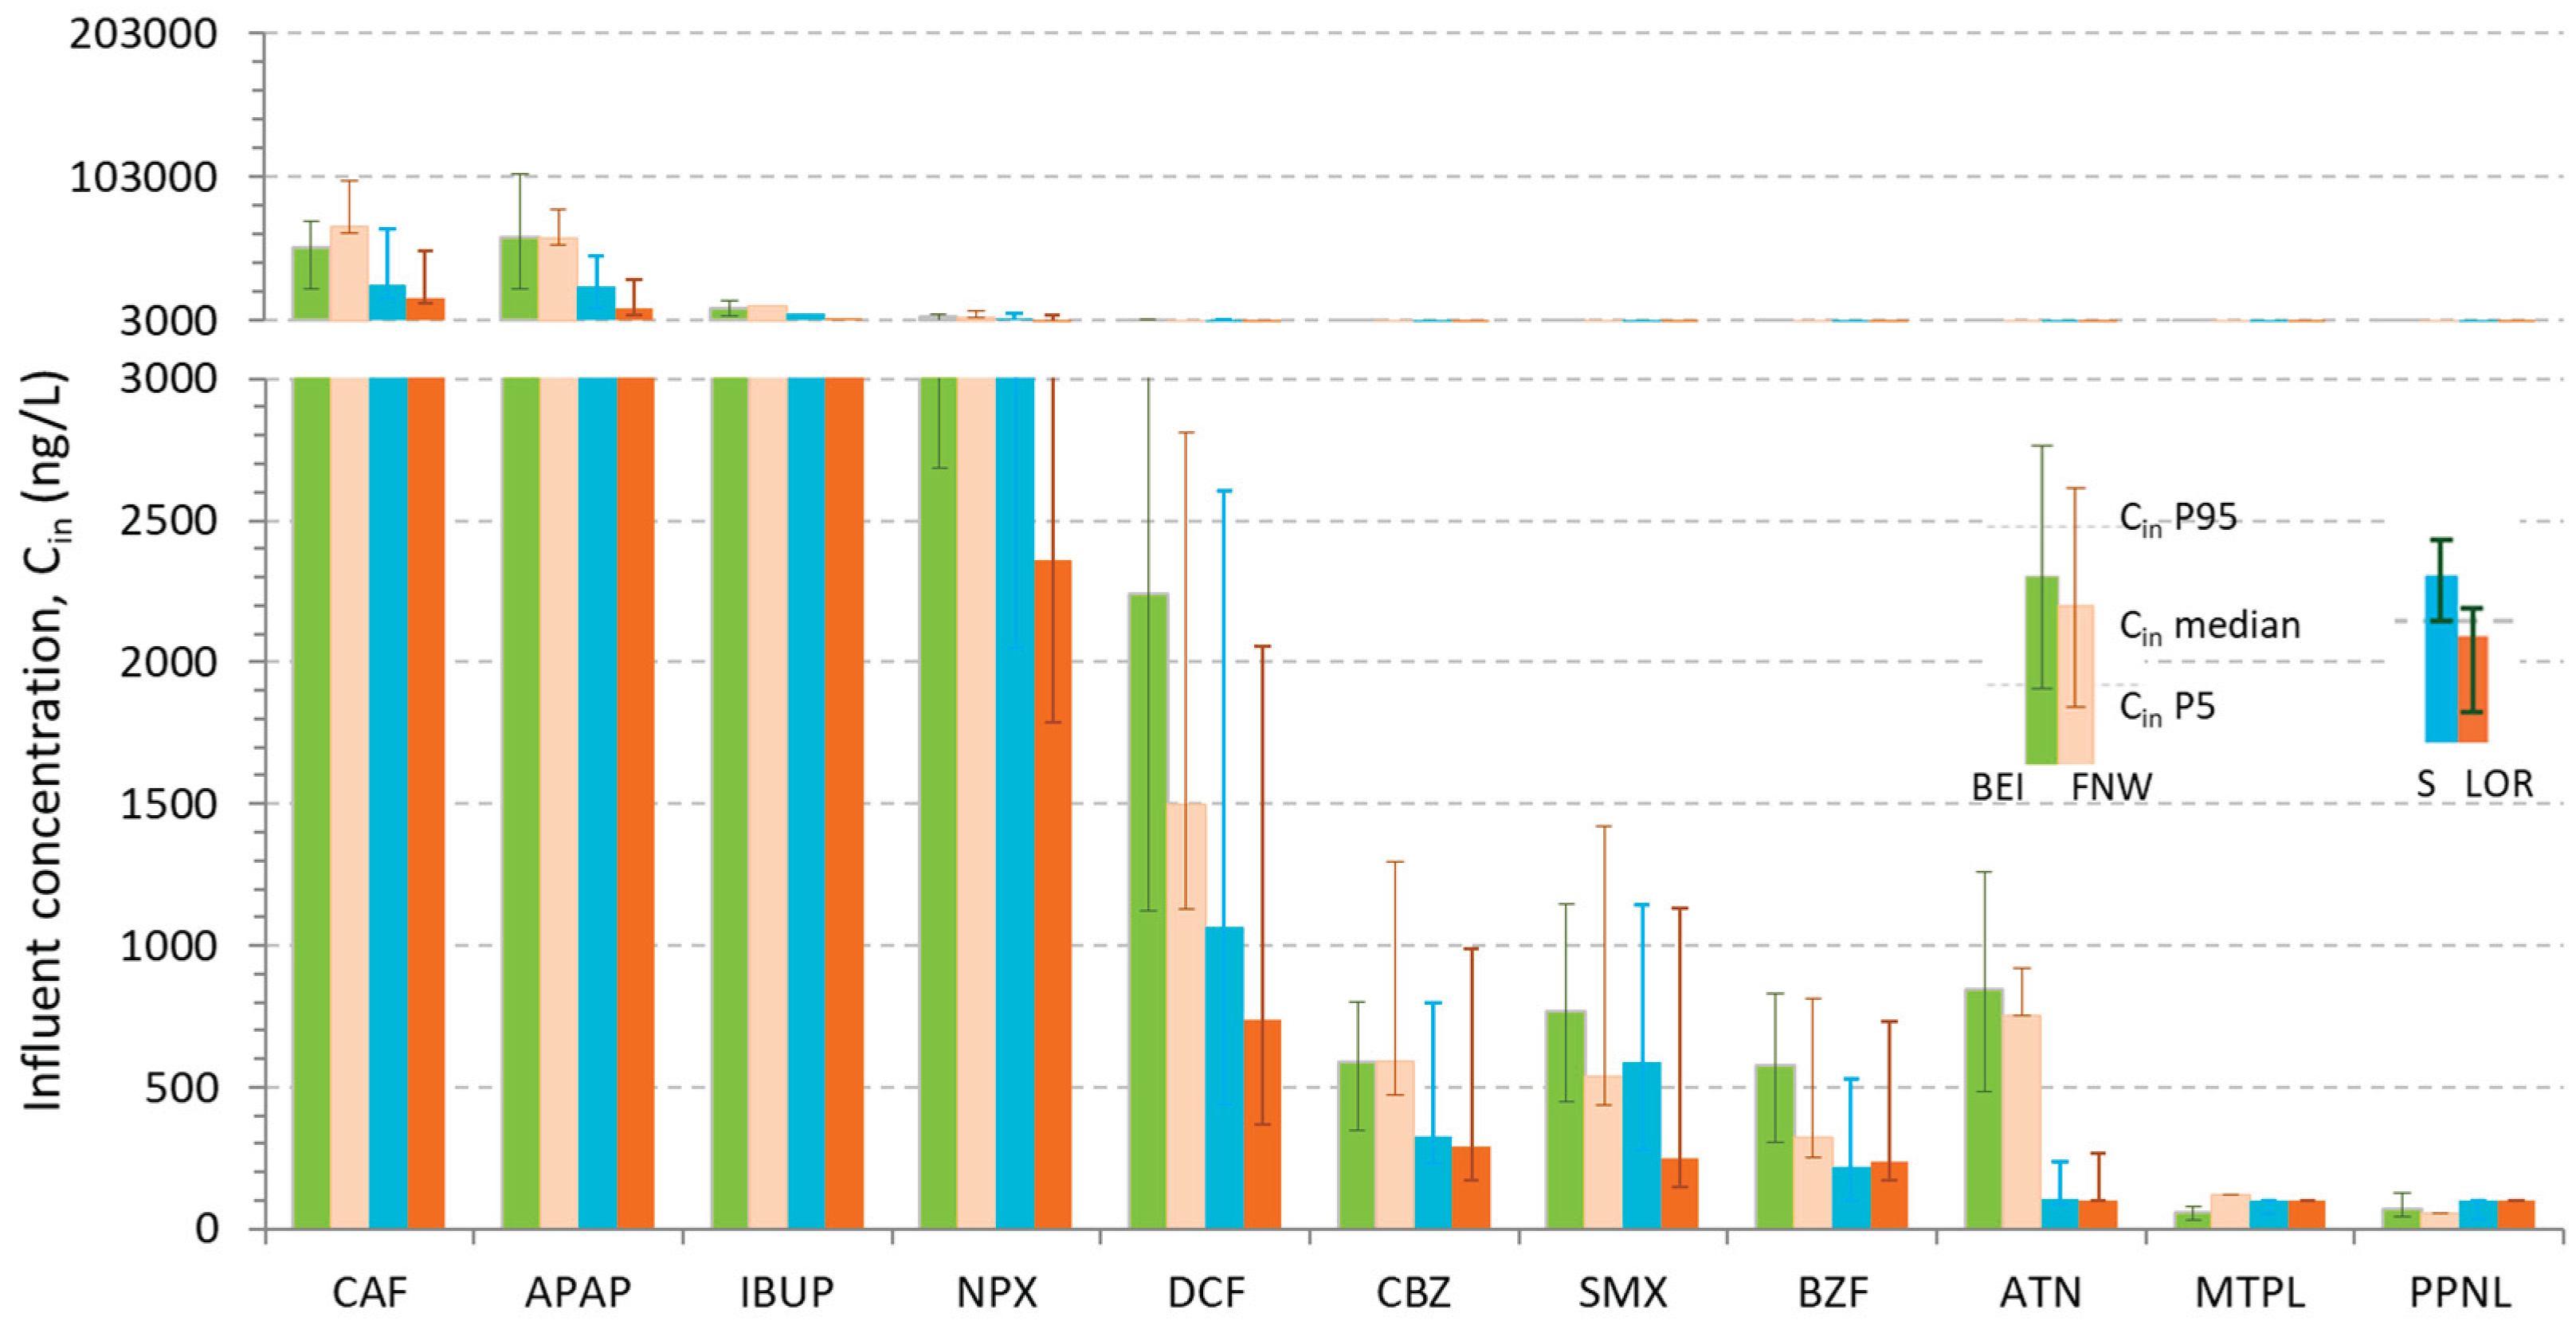
Figure 3.
Chemical CEC removal in AS-lines of SI, SII, and LOR operated under different controlled conditions of F/M and HRT: 3 parallel lines in SI with F/M 0.06, 0.10, and 0.08 d-1 and HRT 28 h; 2 parallel lines in SII with F/M 0.07 and 0.08 d-1 and HRT 23 h; 1 line and F/M 0.10 d-1 and HRT 17 h and 0.14 d-1 and 19 h sequentially studied in LOR (the bars represent the overall medians; error bars represent P25–P50–P75; micropollutants listed in UWWTD inside blue boxes).
Figure 3.
Chemical CEC removal in AS-lines of SI, SII, and LOR operated under different controlled conditions of F/M and HRT: 3 parallel lines in SI with F/M 0.06, 0.10, and 0.08 d-1 and HRT 28 h; 2 parallel lines in SII with F/M 0.07 and 0.08 d-1 and HRT 23 h; 1 line and F/M 0.10 d-1 and HRT 17 h and 0.14 d-1 and 19 h sequentially studied in LOR (the bars represent the overall medians; error bars represent P25–P50–P75; micropollutants listed in UWWTD inside blue boxes).
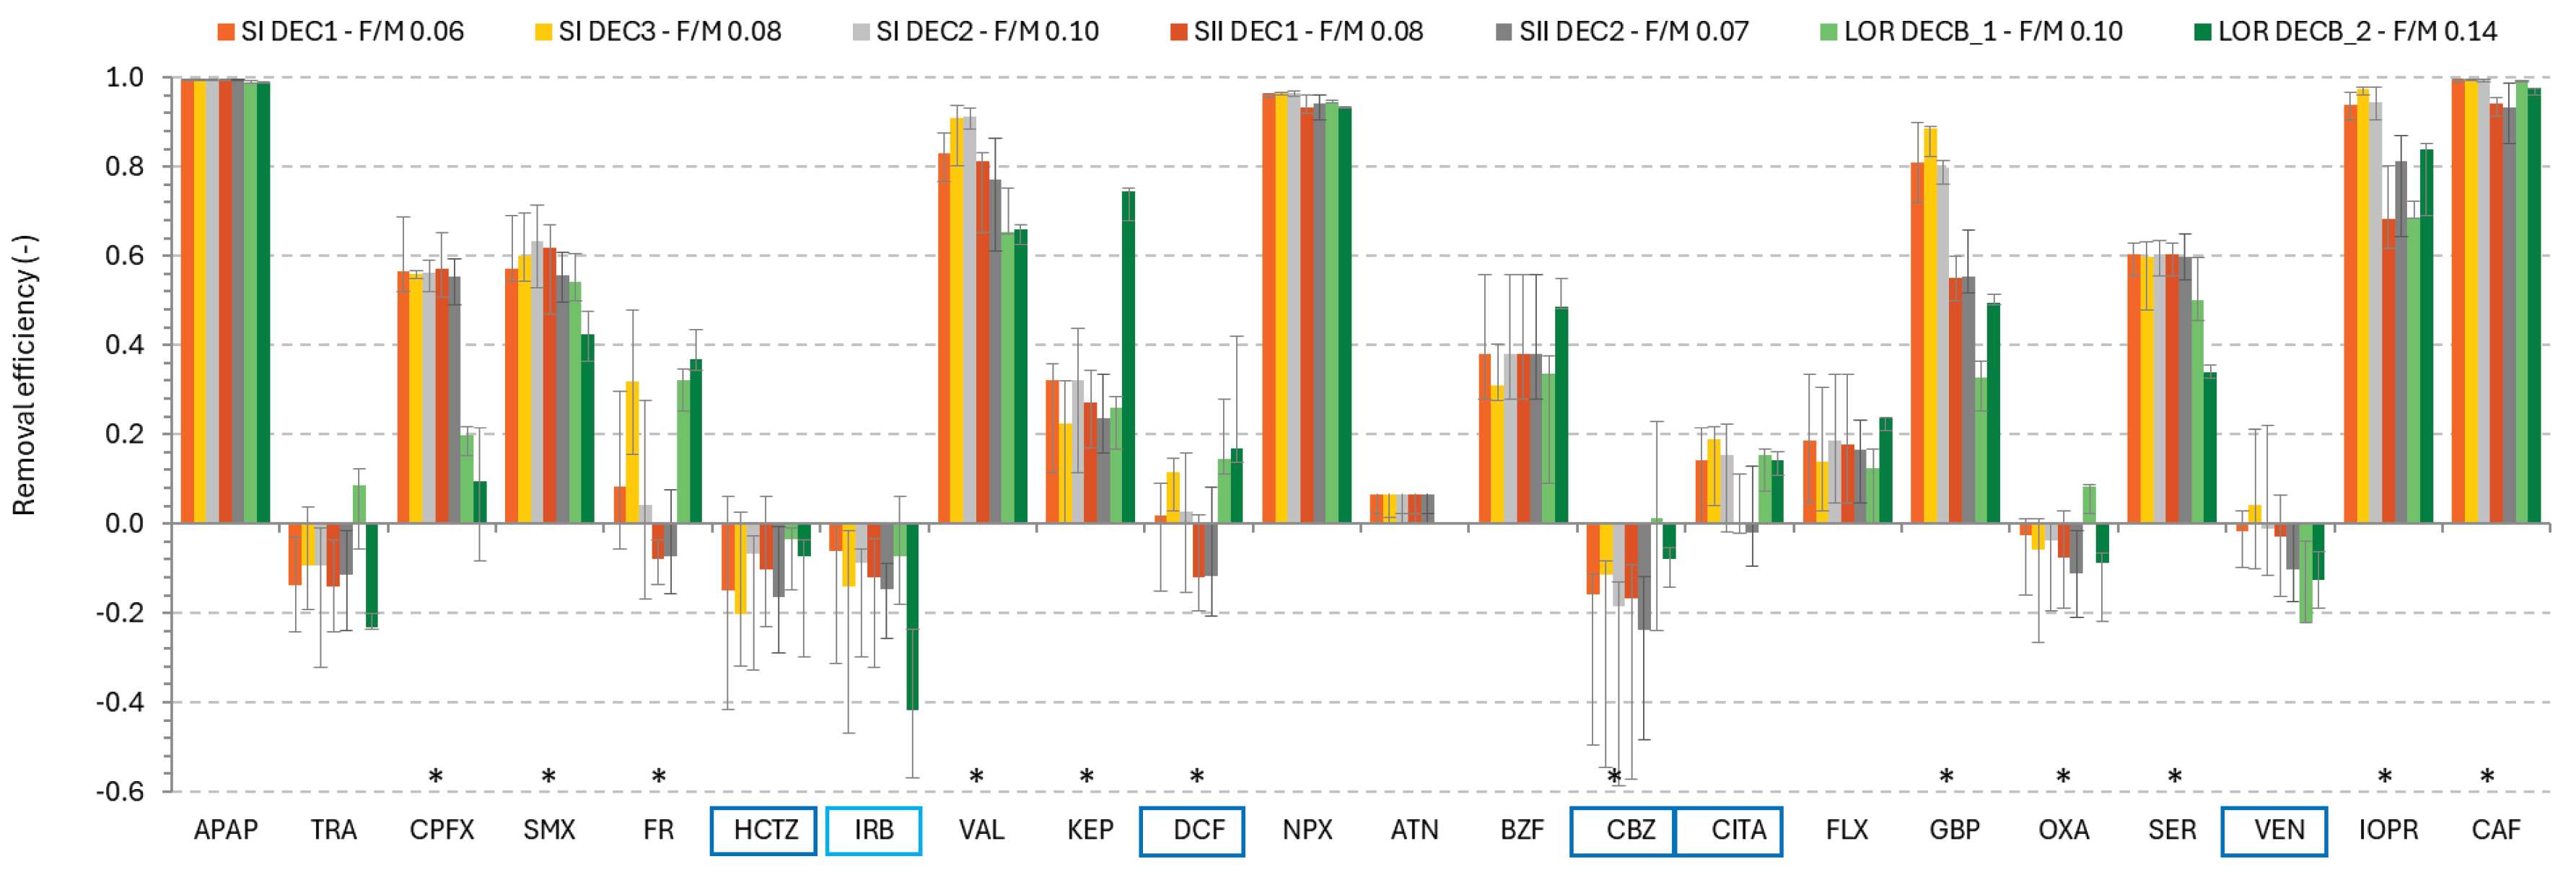
Figure 4.
PCA analyses in different reactors of SI, SII, and LOR.
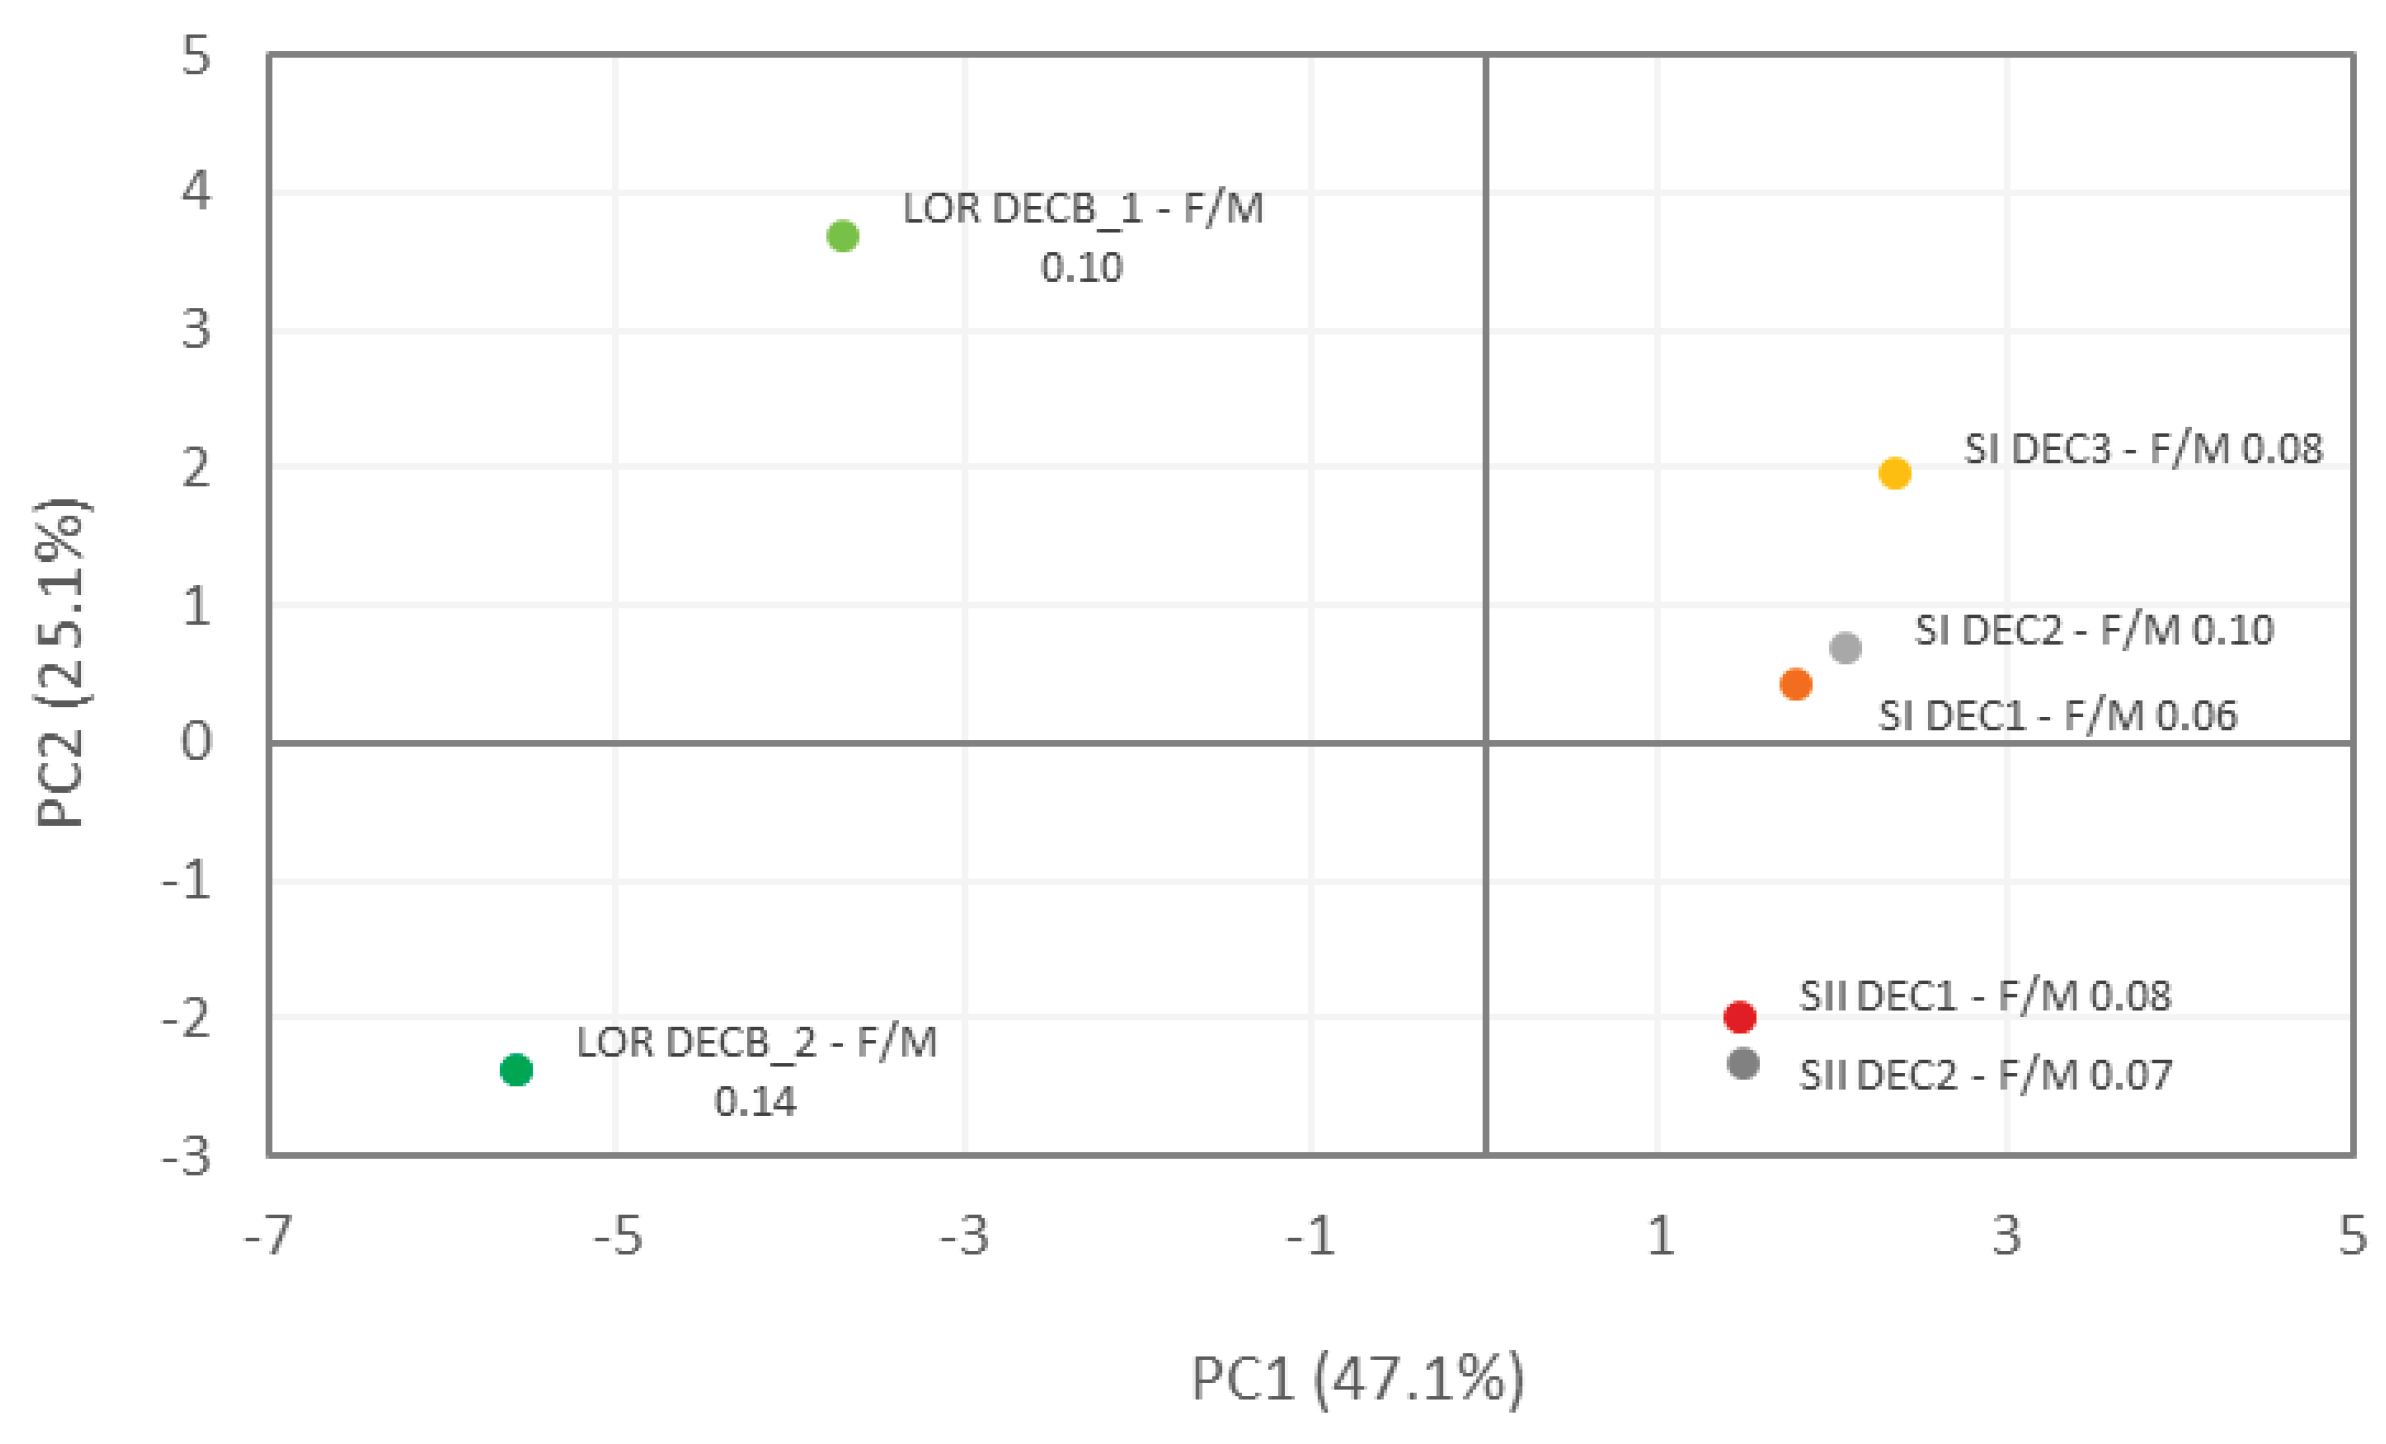
Figure 5.
Removal of five chemical CECs vs. SNR in the nitrification campaigns conducted in two parallel AS-lines of SII.
Figure 5.
Removal of five chemical CECs vs. SNR in the nitrification campaigns conducted in two parallel AS-lines of SII.
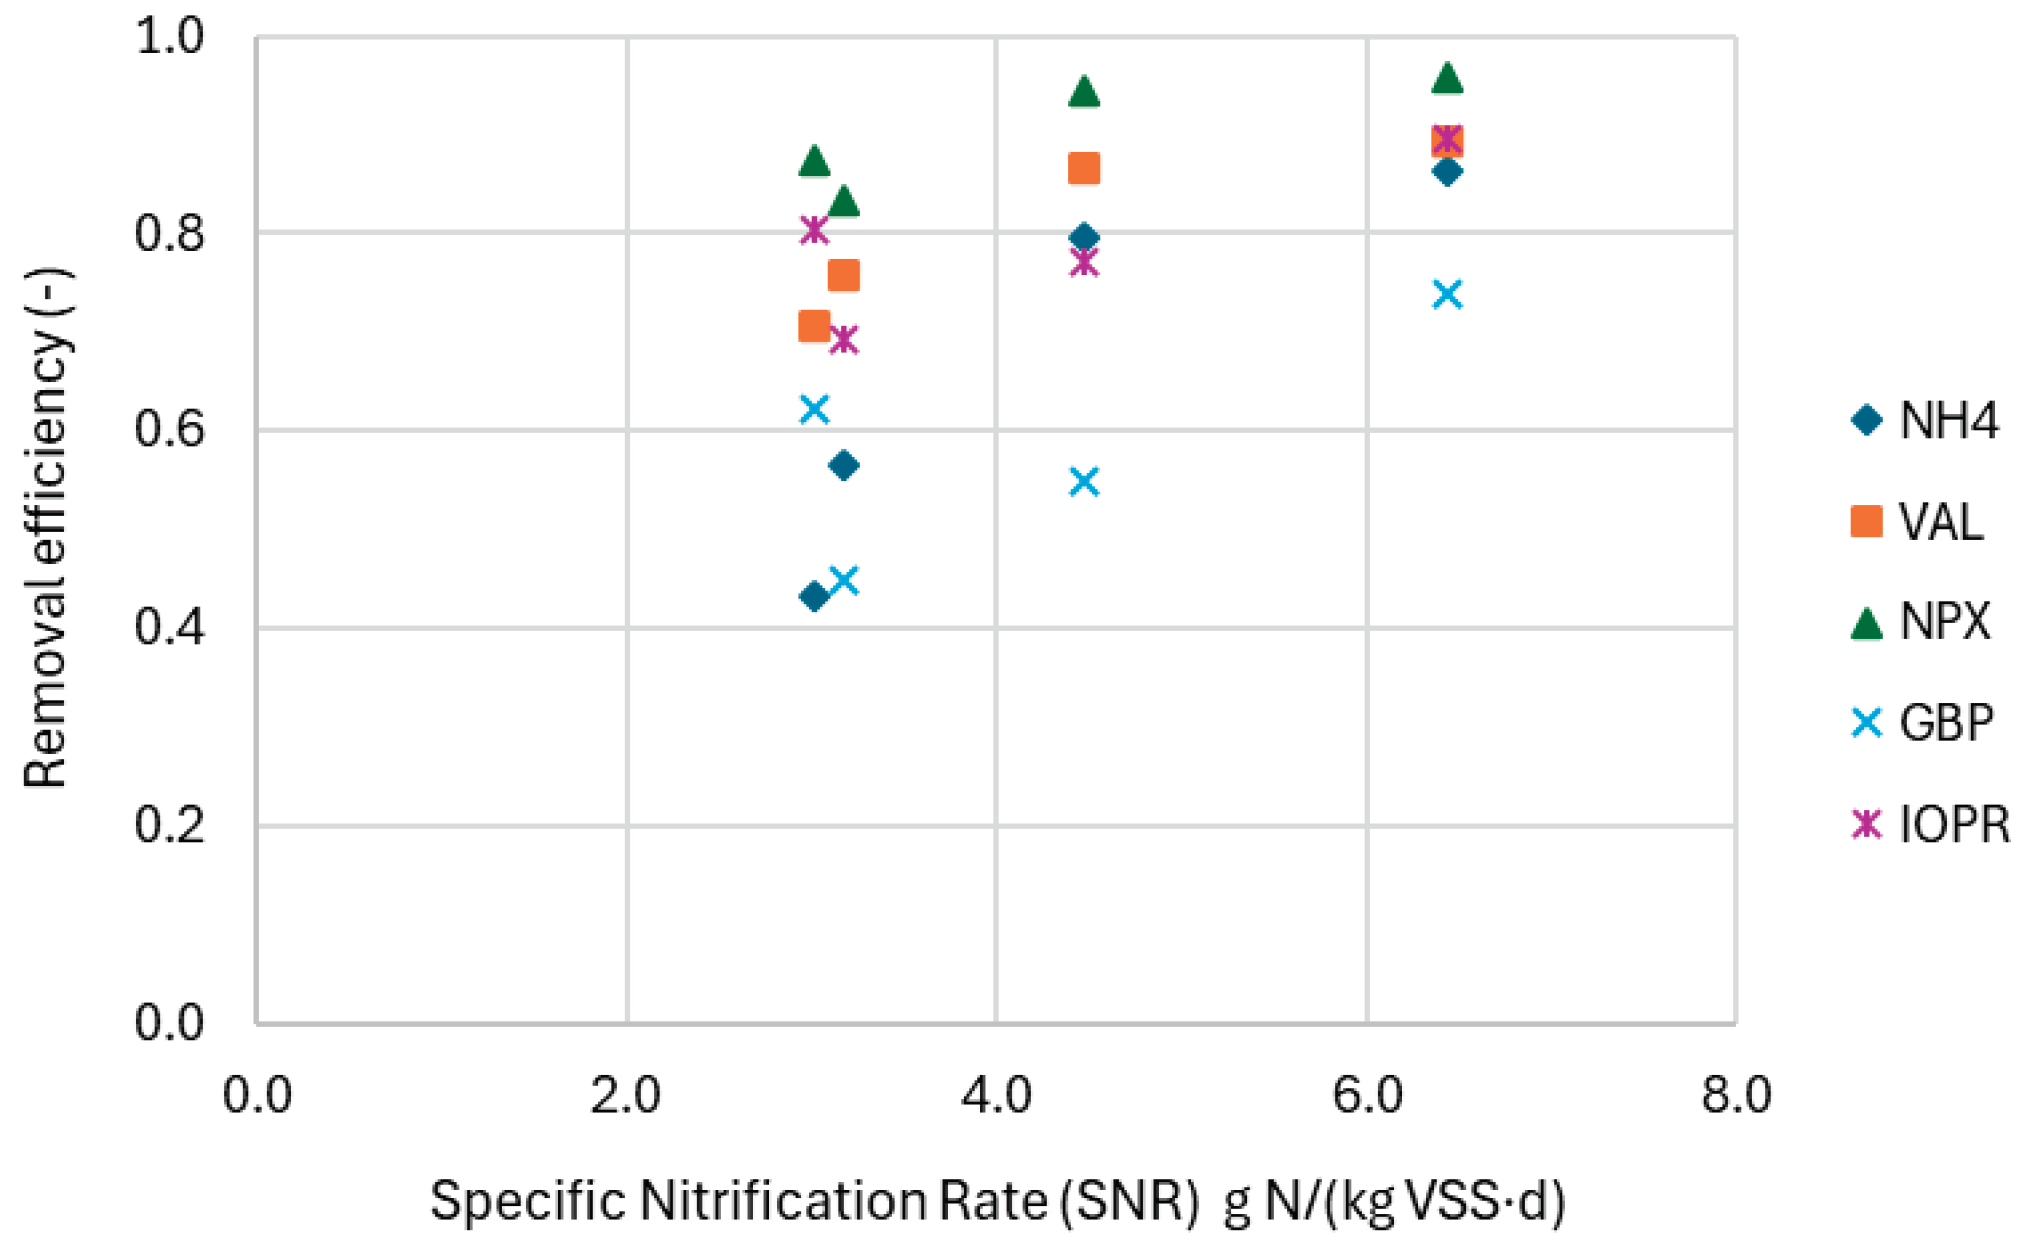
Figure 6.
Median CEC removal in each treatment line as a function of kbio (the grey curve was computed with the data reported by Silva et al. [4], for comparison with earlier studies).
Figure 6.
Median CEC removal in each treatment line as a function of kbio (the grey curve was computed with the data reported by Silva et al. [4], for comparison with earlier studies).
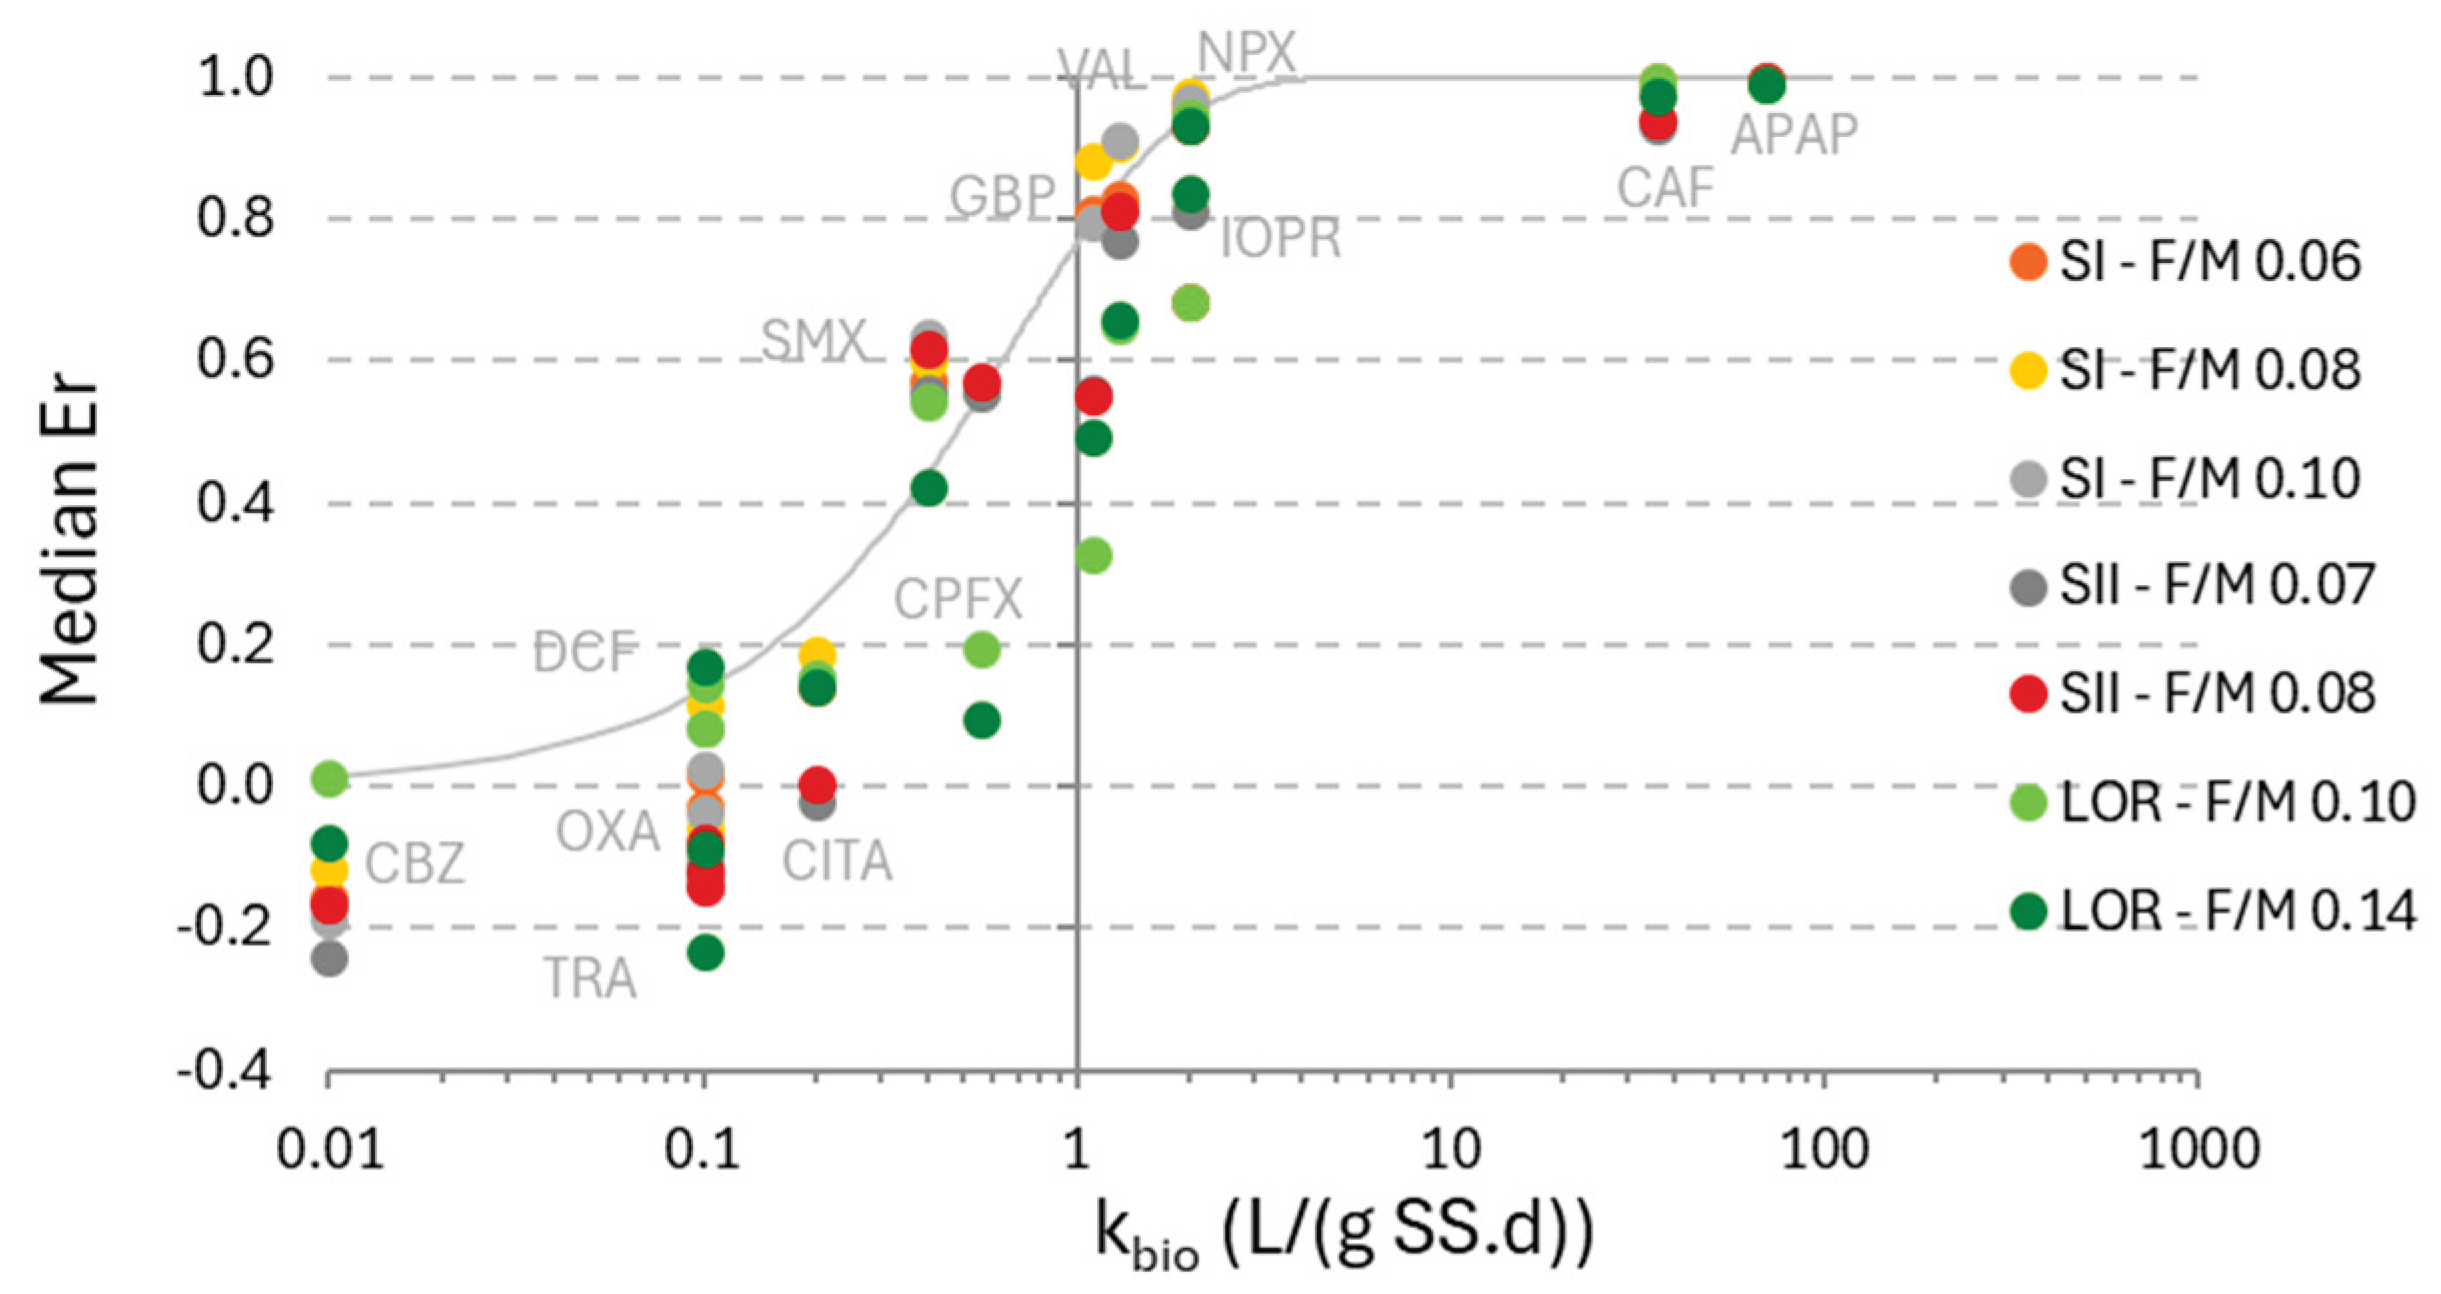
Figure 7.
The sigmoid functions of each treatment line derived with median values of CEC removal, MLSS and HRT (all data points in grey) (left); predicted removals vs. measured removals (the line represents y = x) (right).
Figure 7.
The sigmoid functions of each treatment line derived with median values of CEC removal, MLSS and HRT (all data points in grey) (left); predicted removals vs. measured removals (the line represents y = x) (right).
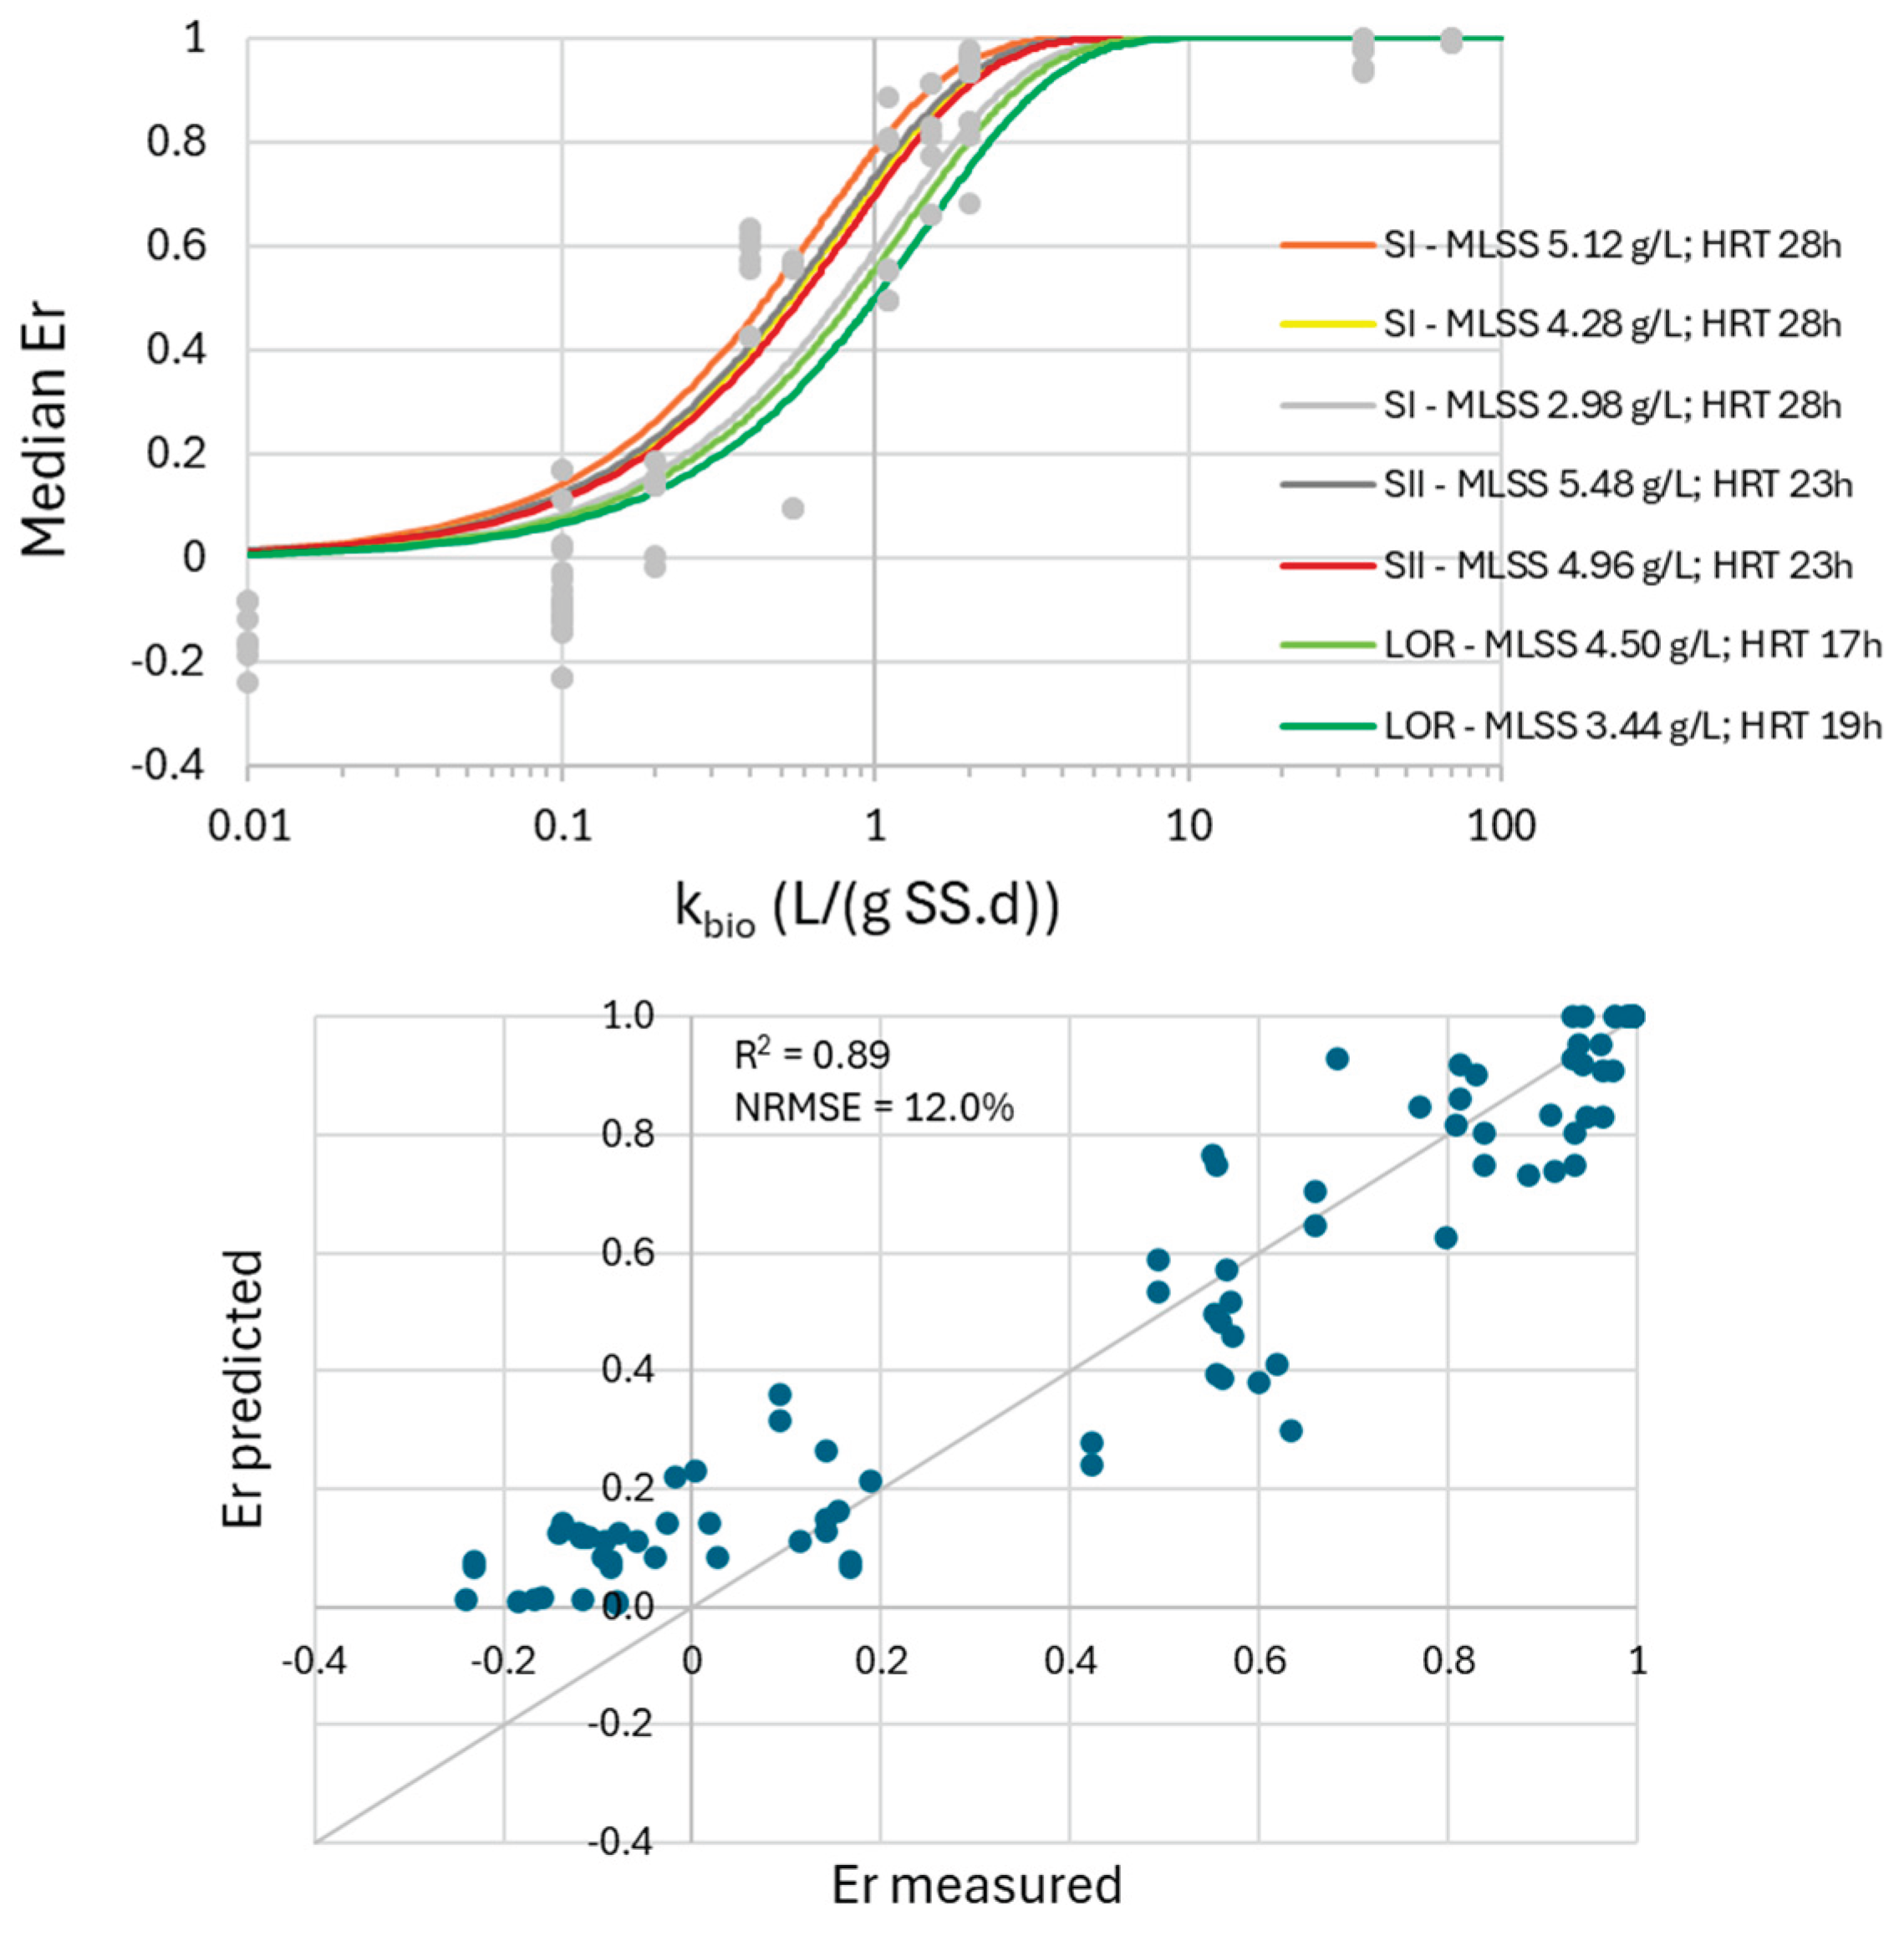
Figure 8.
CEC median removal derived for different operational conditions vs. kbio, varying MLSS from 3 to 5 g/L and HRT of 14 and 28 hours (left) and vs. kbio and MLSS∙HRT (right).
Figure 8.
CEC median removal derived for different operational conditions vs. kbio, varying MLSS from 3 to 5 g/L and HRT of 14 and 28 hours (left) and vs. kbio and MLSS∙HRT (right).
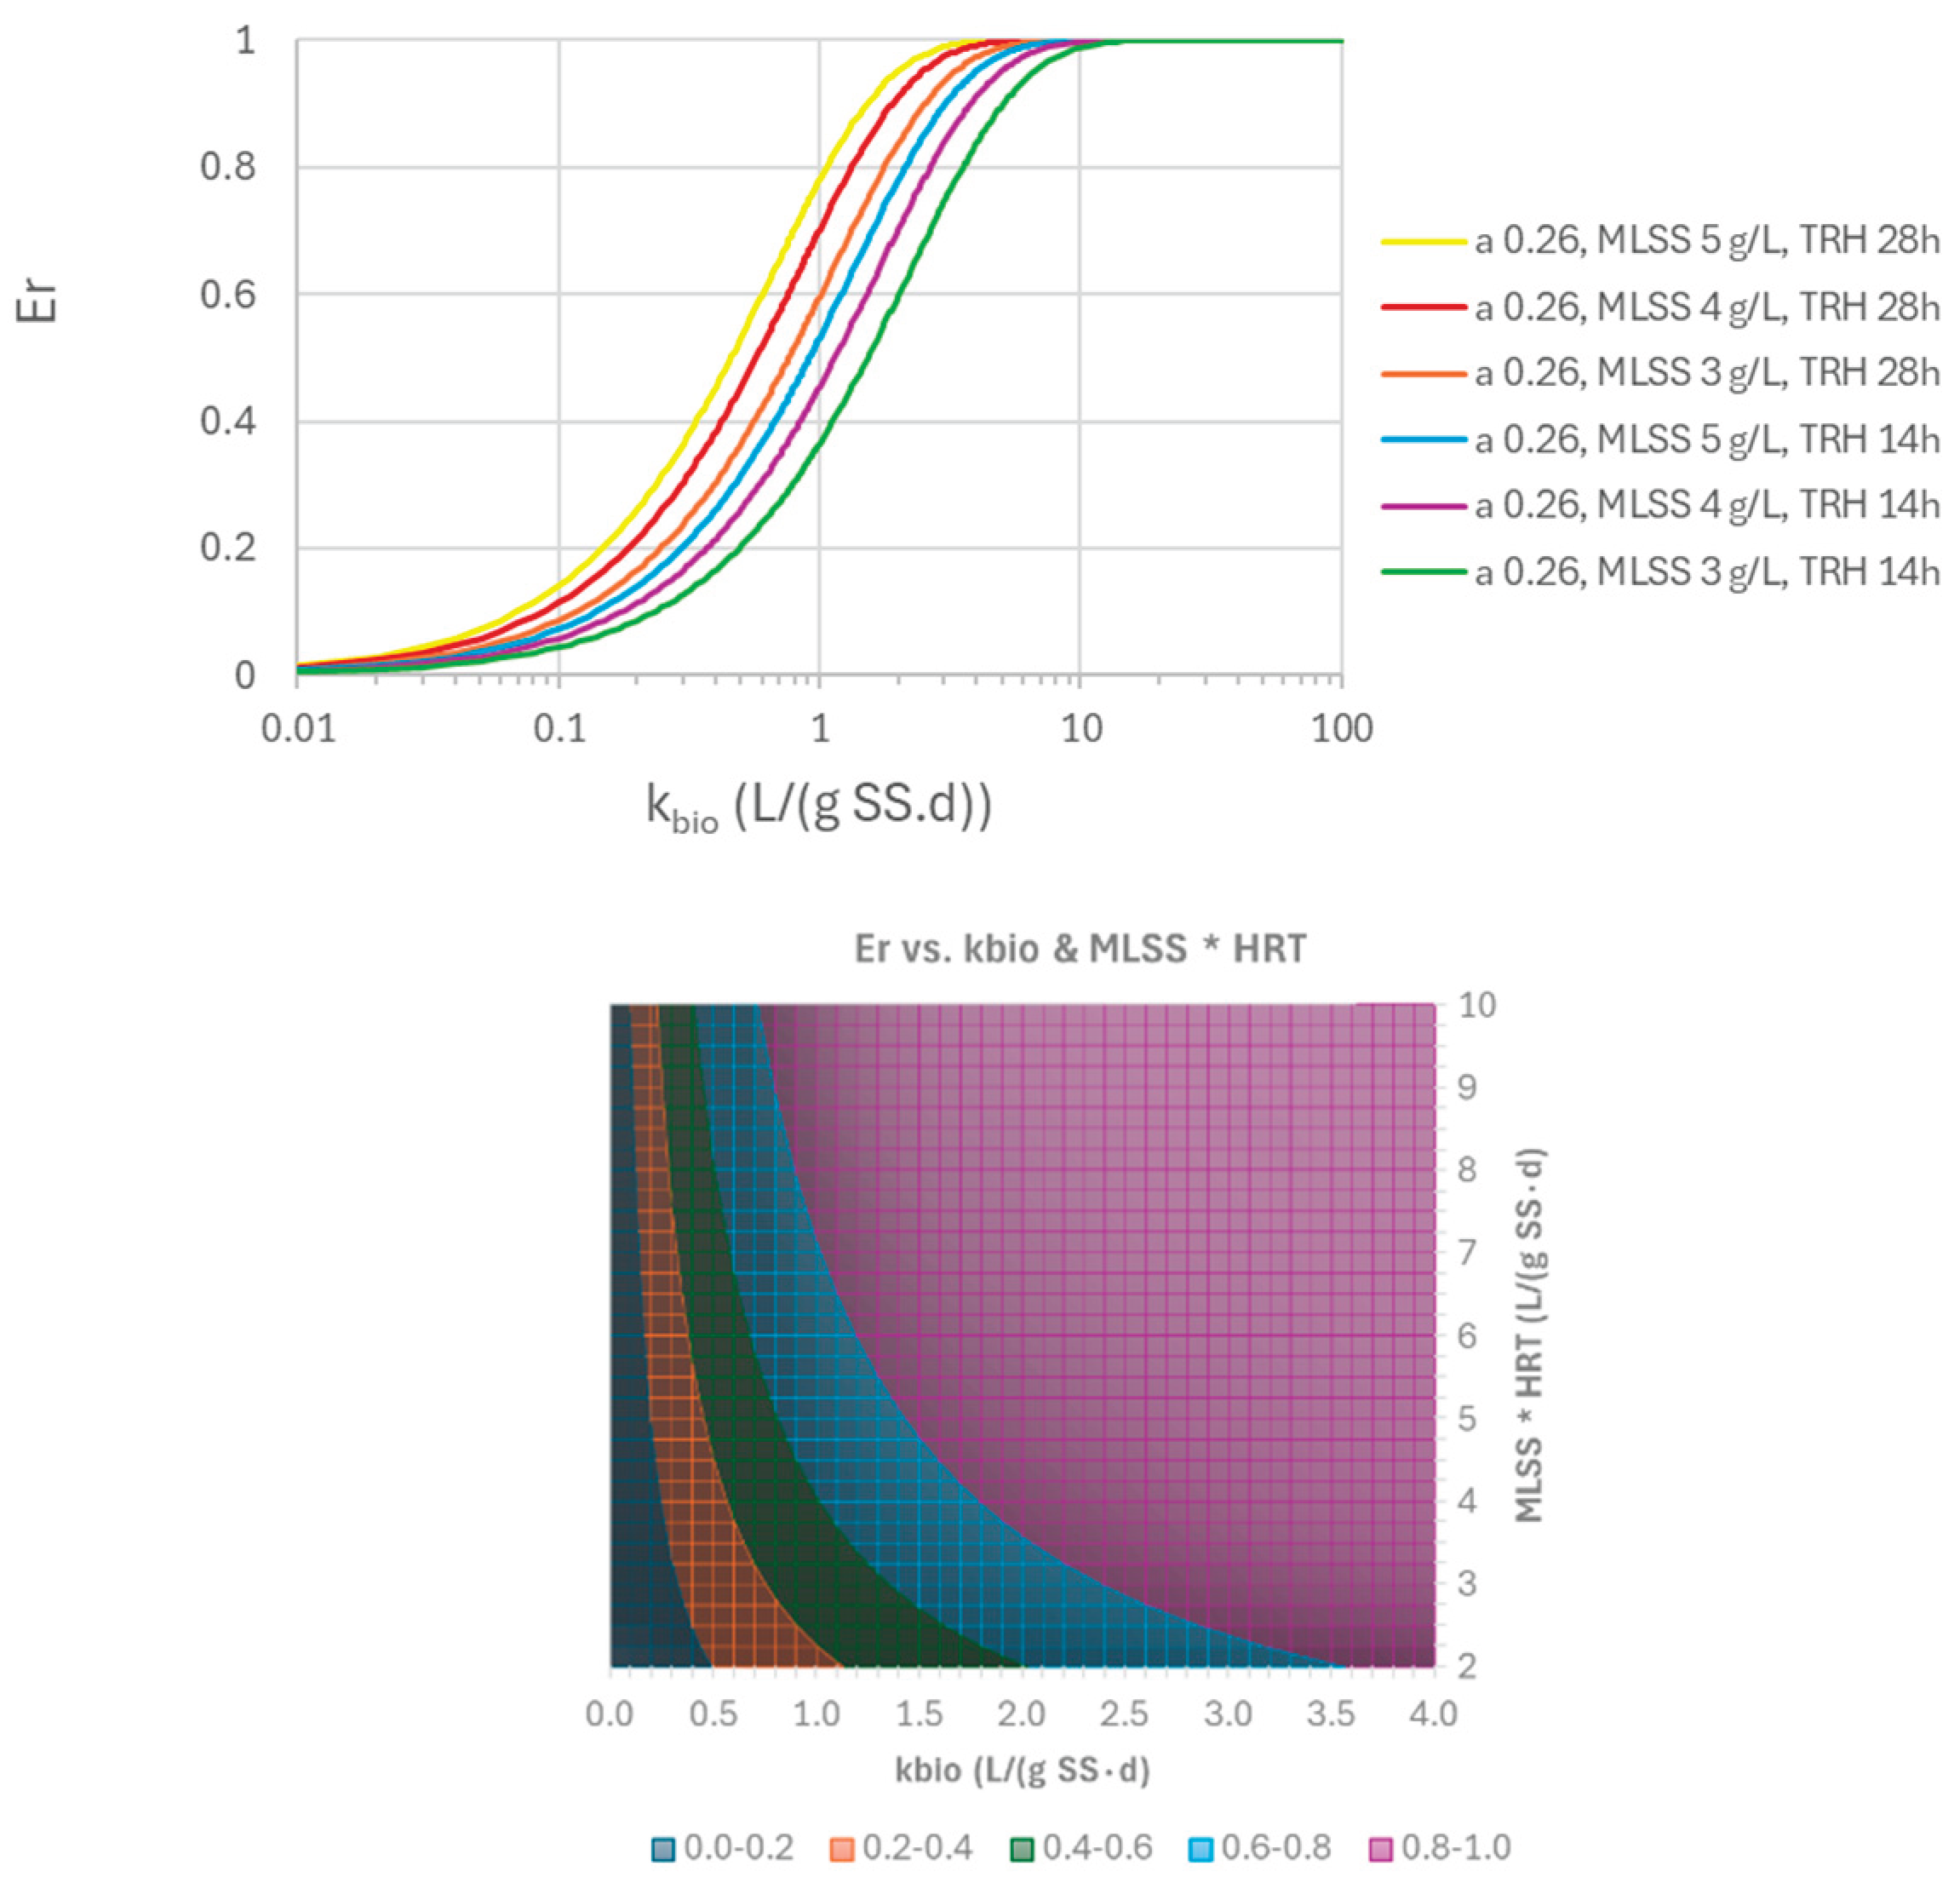
Figure 9.
AS-Ozonation synergy to achieve 80% overall removal of six CECs in the new EU UWWTD (Citalopram, Clarithromycin, Diclofenac, Metoprolol, Benzotriazole, 4/5-Methylbenzotriazole).
Figure 9.
AS-Ozonation synergy to achieve 80% overall removal of six CECs in the new EU UWWTD (Citalopram, Clarithromycin, Diclofenac, Metoprolol, Benzotriazole, 4/5-Methylbenzotriazole).
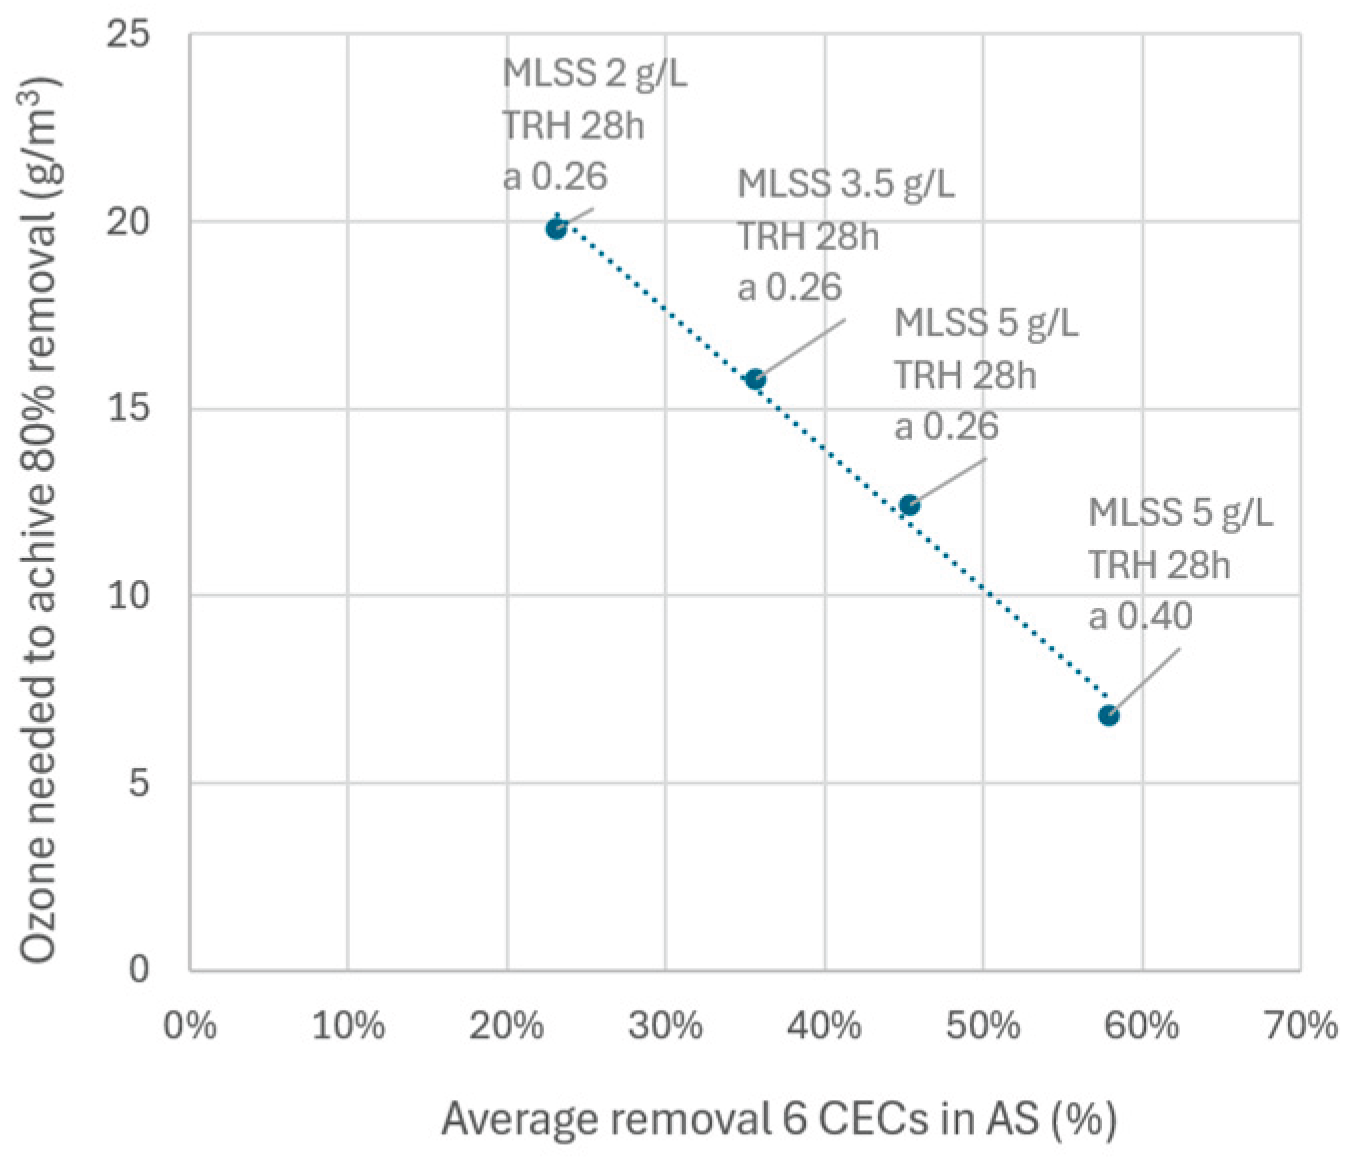

Table 1.
The empirical adjustment factor ‘a’ for the different WWTPs and reactors.
| WWTP | AS-reactor Influent key characteristics (median) |
MLSS (g/L) | HRT (d) | SNR (g N-NH4 /(kg VSS·d) | ‘a’ |
| SI | Extended-aeration plug-flow reactors with mechanical aerators (3 in parallel) COD = 785 mg/L EC = 1.8 mS/cm N-t = 50.5 mg N/L T = 22.1 ℃ |
5.12 | 1.2 | 4.0 | 0.22 (R2 = 0.93; NRMSE = 10.0%; R2CV = 0.93; NRMSECV = 10.5%) |
| 4.28 | 1.2 | 4.7 | 0.30 (R2 = 0.94; NRMSE = 9.5%; R2CV = 0.94; NRMSECV = 10.1%) |
||
| 2.98 | 1.2 | 4.6 | 0.41 (R2 = 0.93; NRMSE 10.0%; R2CV = 0.92; NRMSECV = 10.6%) |
||
| SII | Oxidation ditches with air diffusers (2 in parallel) COD = 785 mg/L EC = 1.8 mS/cm N-t = 50.5 mg N/L T = 22.1 ℃ |
5.48 | 1.0 | 5.8 | 0.19 (R2 = 0.88; NRMSE 12.9%; R2CV = 0.87; NRMSECV = 13.5%) |
| 4.96 | 1.0 | 4.9 | 0.21 (R2 = 0.86; NRMSE 14.2%; R2CV = 0.84; NRMSECV = 15.3%) |
||
| LOR | AS reactors with liquid oxygen injection COD = 930 mg O2/L EC = 2.6 mS/cm N-t = 51 mg N/L T = 24.5 ℃ |
4.50 | 0.7 | 3.9 | 0.23 (R2 = 0.88; NRMSE 12.5%; R2CV = 0.84; NRMSECV = 14.5%) |
| 3.44 | 0.8 | 6.9 | 0.27 (R2 = 0.89; NRMSE 11.5%; R2CV = 0.87; NRMSECV = 12.3%) |
||
| BEI | A2O COD = 600 mg O2/L EC = 1.5 mS/cm N-t = 75 mg N/L T = 18.2 ℃ |
4.00 | 0.6 | 27 | 0.61 (R2 = 0.95; NRMSE = 8.3%; R2CV = 0.93; NRMSECV = 9.9%) |
| FN | Oxidation ditch COD = 640 mg O2/L EC = 1.3 mS/cm N-t = 66 mg N/L T = 20.7 ℃ |
2.7 | 0.9 | 32 | 0.44 (R2 = 0.90; NRMSE = 10.6%; R2CV = 0.88; NRMSECV = 11.7%) |
Disclaimer/Publisher’s Note: The statements, opinions and data contained in all publications are solely those of the individual author(s) and contributor(s) and not of MDPI and/or the editor(s). MDPI and/or the editor(s) disclaim responsibility for any injury to people or property resulting from any ideas, methods, instructions or products referred to in the content. |
© 2026 by the authors. Licensee MDPI, Basel, Switzerland. This article is an open access article distributed under the terms and conditions of the Creative Commons Attribution (CC BY) license (http://creativecommons.org/licenses/by/4.0/).
Copyright: This open access article is published under a Creative Commons CC BY 4.0 license, which permit the free download, distribution, and reuse, provided that the author and preprint are cited in any reuse.