

Submitted:
15 August 2026
Posted:
17 August 2026
You are already at the latest version
Abstract
The Thai-Malay Peninsula, a biodiversity hotspot at the boundary between the Indian and Pacific Oceans, possesses a complex geological history that has shaped the diversity and distribution of benthic marine flora in this region. Yet, phylogeographic understanding of macroalgae along the Andaman Sea coast remains limited. Here, we investigated population genetics and demographic history of the ecologically and economically important red seaweed Halymenia durvillei along the Andaman coast of Thailand. Mitochondrial cox1 and chloroplast rbcL sequences from 333 specimens across 20 sites revealed low genetic diversity (11 and 4 haplotypes, respectively) and a lack of pronounced population structure. A single dominant haplotype per marker was restricted to Phuket Island and Phang Nga. Analysis of variance (AMOVA) revealed no significant genetic differentiation between the Myanmar Shelf and the Malacca Strait Shelf, with most of the variation (90.28%–98.63%) partitioned within populations. However, gene-flow estimates revealed significantly asymmetric migration among populations, with most sites functioning as both sources and sinks of migrants, broadly consistent with the dispersal mediated by ocean currents during the northeast monsoon season. Bayesian Skyline Plot analysis revealed a sharp demographic contraction during the early middle Miocene, followed by a progressive expansion since the early Pleistocene. The presence of endemic haplotypes in the northern Malacca Strait (Tankhen Bay, Phuket) suggests this area likely served as a marine refugium during glacial maximal low stands. In brief, phylogeographic homogeneity of H. durvillei along the Andaman Sea reflects the combined effects of glacial bottlenecks during glacial sea-level fluctuations and postglacial recolonization driven by ocean circulations. These results provide a phylogeographic baseline for conservation prioritization, highlighting populations with unique genetic diversity as candidates for in-situ protection and integration into protected area networks under climate warming.
Keywords:
Halymenia durvillei
; Andaman sea
; phylogeographic history
; Phuket province
; sea-level fluctuations
1. Introduction
Southeast Asia, located at the crossroads of the Pacific and Indian Oceans, is characterized by numerous islands and complex geographical features. Despite covering only about 4% of the world’s land area, this region has been recognized as one of the most important marine biodiversity hotspot globally [1]. Central to this biodiversity richness is the well-known “Coral Triangle”, often referred as the “Amazon of the ocean”, which hosts about 76% of the world’s reef-building corals and 37% of coral reef fish species [2]. The combination of biodiversity-rich ecosystems, dynamic climatological processes, and a unique geological history has made Southeast Asia an ideal model region for marine phylogeographic studies over the past decades [3,4,5,6,7,8].
The Thai-Malay Peninsula (TMP) is one of the key regions for biodiversity monitoring and management in Southeast Asia [9]. Geographically, this peninsula extends from north to south, with the northeastern coast bordering the Gulf of Thailand and the southern part connected to the southern South China Sea. On the western side, the northern section is adjacent to the Andaman Sea while the southern section links with the Strait of Malacca (Figure 1). The hydrological and ecological environments of the Pacific and Indian Oceans converge along the peninsula, forming a typical land–sea interaction landscape that supports diverse habitats (e.g. tropical coral reefs, seaweed beds, and mangroves) and has attracted growing research interest [3,8,10]. However, marine phylogeographic studies in this region have primarily focused on reef-building corals and coral reef fishes (e.g. [11,12,13]), mangroves (e.g. [5,6]) and arthropods (e.g. [7]). In contrast, limited phylogeographic efforts have been devoted to macroalgae across the TMP. Available studies include the brown alga Padina boryana Thivy [14], the green alga Halimeda J.V.Lamouroux [15,16], and the red algae Bostrychia tenella (J.V.Lamouroux) J.Agardh/B. binderi Harvey 1849 [17,18] and Gracilaria salicornia (C.Agardh) E.Y.Dawson [19]. Notably, these studies have reported dissimilar and even contrasting genetic structuring patterns, underscoring the need of additional phylogeographic evidence from co-occurring macroalgae. Such evidence would help fill knowledge gaps in understanding the patterns and processes underlying speciation and biogeography, while also informing conservation and management prioritization of foundation species in benthic communities.
Figure 1.
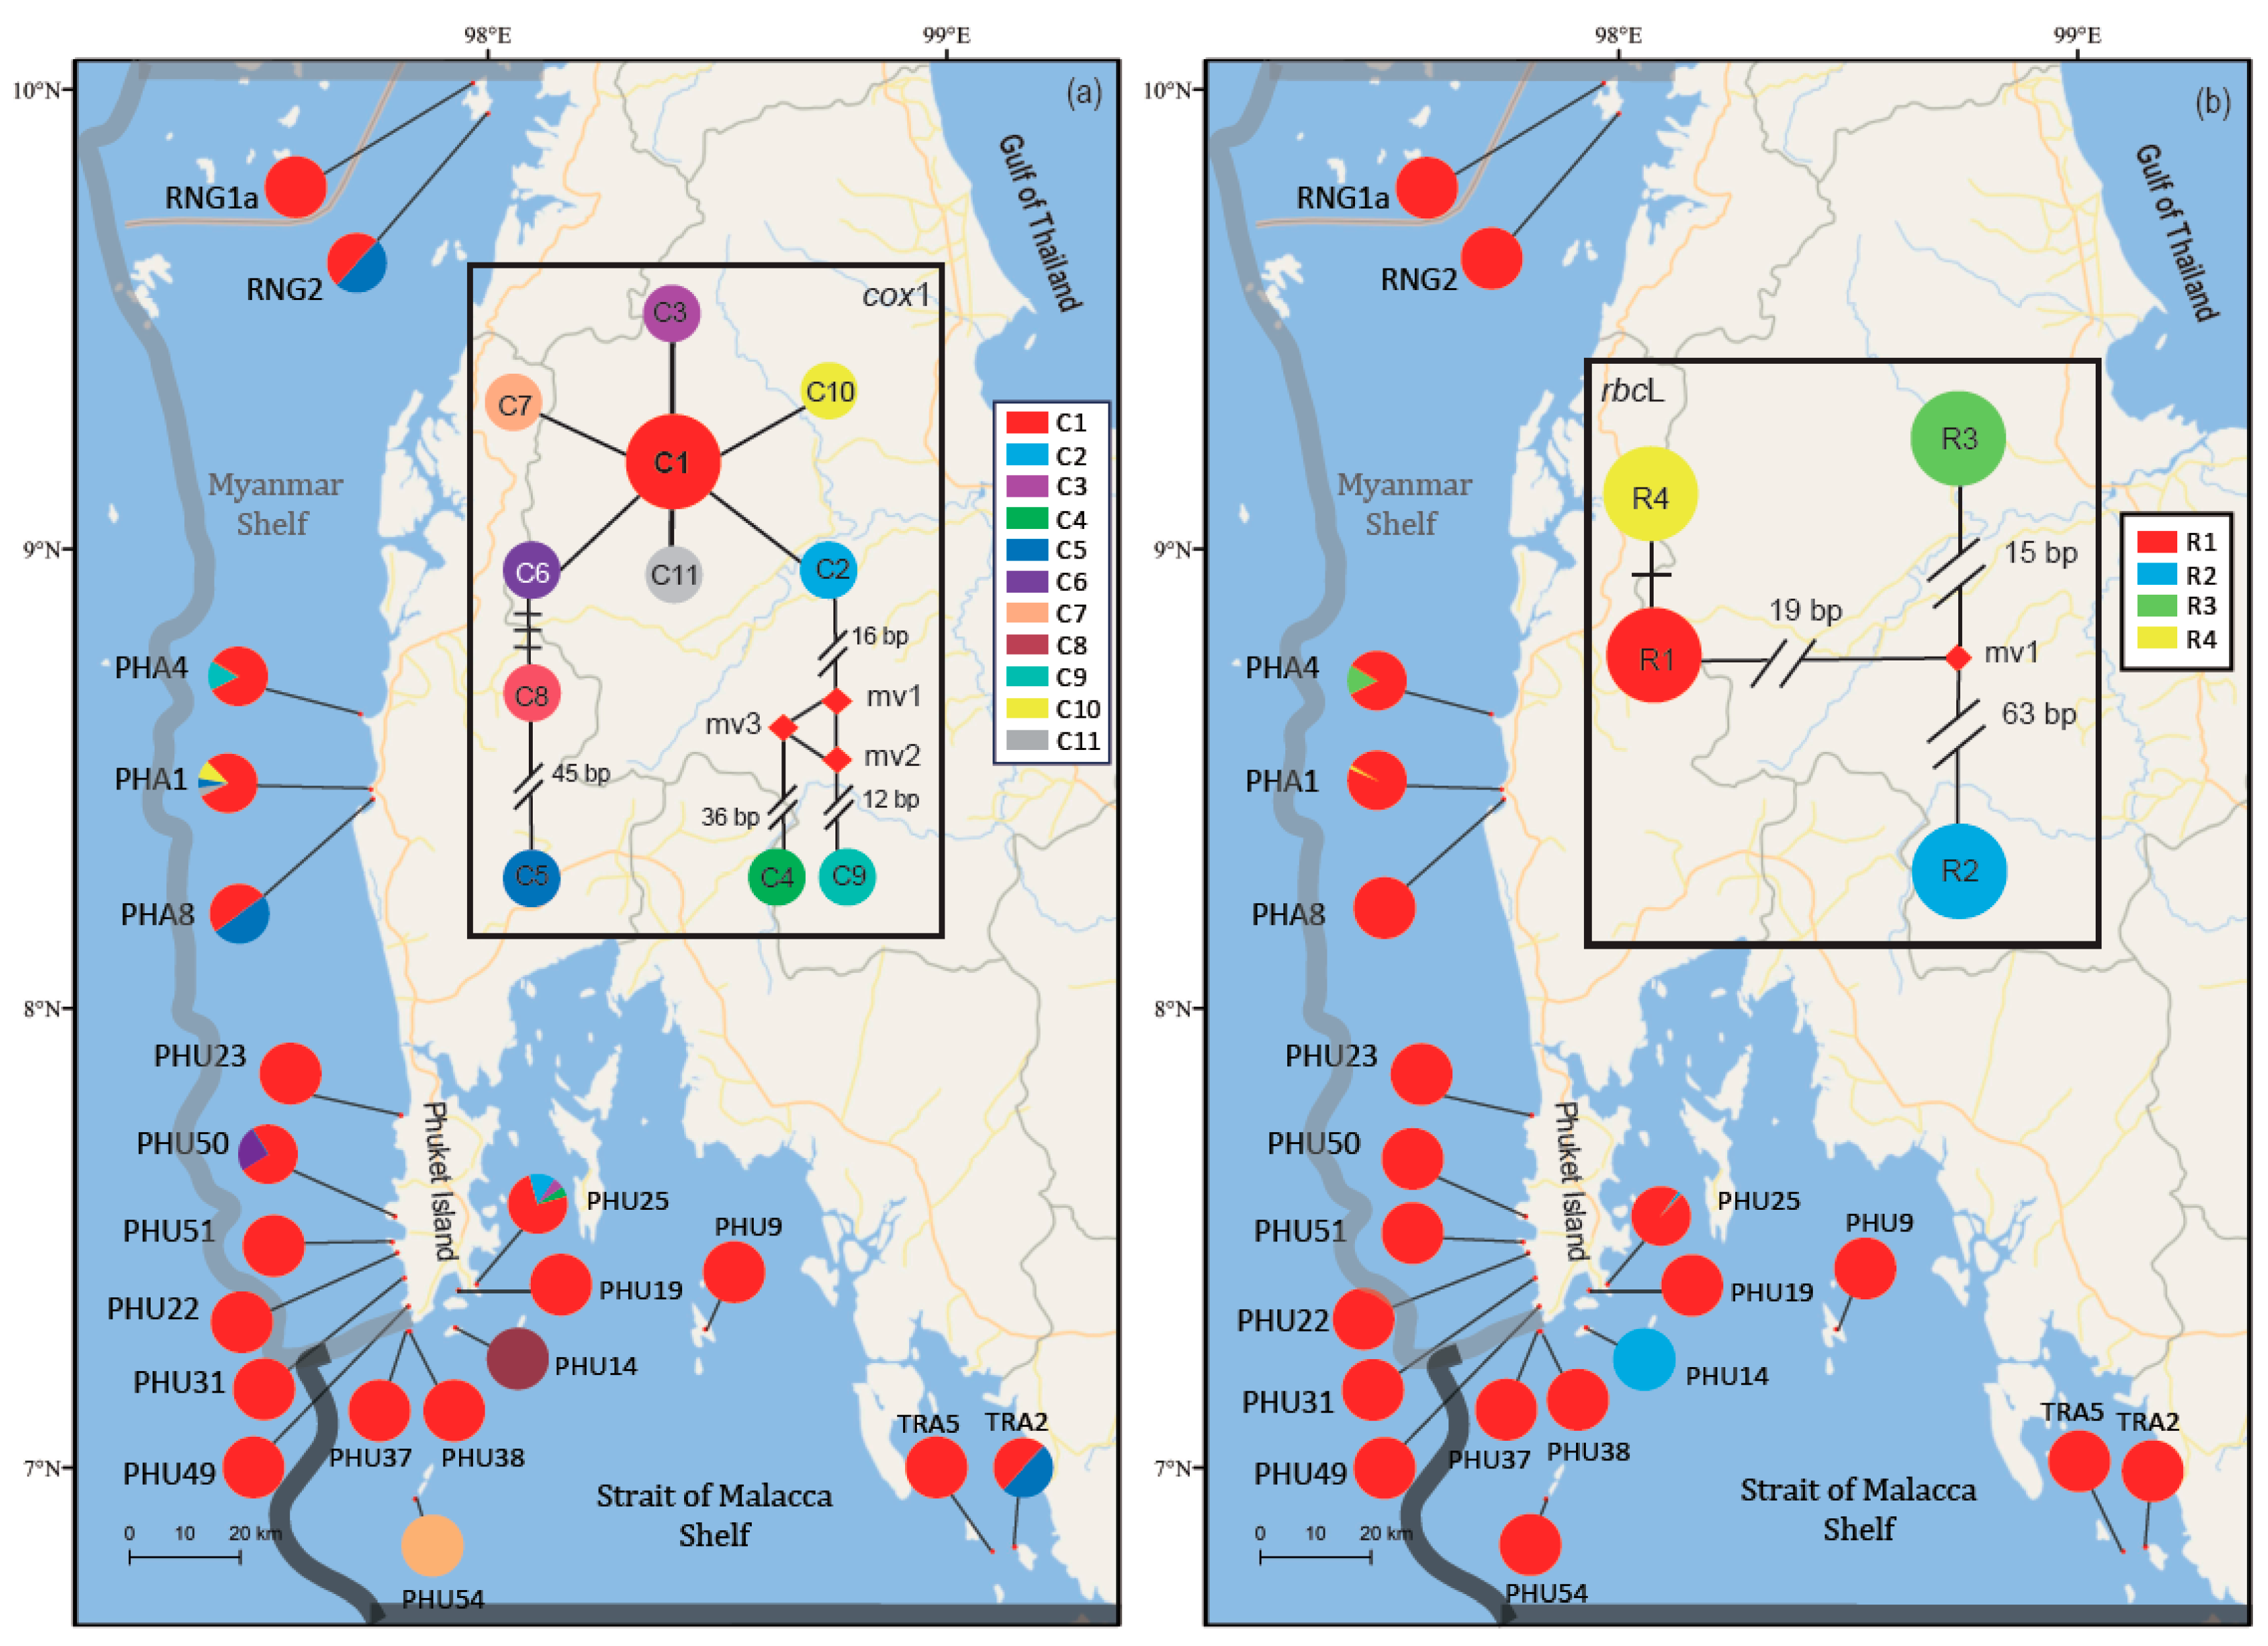
Sampling distribution and haplotype networks of Halymenia durvillei along the Andaman coast of Thailand, constructed based on mitochondrial cox1 (a) and chloroplast rbcL (b) sequences, respectively. The circle size is proportional to the occurrence frequency of haplotype, and numbers along the branches indicate the number of mutational steps. “mv” denotes a hypothetical unsampled or ancestral haplotype. Sampling sites are divided into two marine ecoregions, the Myanmar Shelf and the Strait of Malacca Shelf, and all site codes are the same as in Table 1.
Figure 1.
Sampling distribution and haplotype networks of Halymenia durvillei along the Andaman coast of Thailand, constructed based on mitochondrial cox1 (a) and chloroplast rbcL (b) sequences, respectively. The circle size is proportional to the occurrence frequency of haplotype, and numbers along the branches indicate the number of mutational steps. “mv” denotes a hypothetical unsampled or ancestral haplotype. Sampling sites are divided into two marine ecoregions, the Myanmar Shelf and the Strait of Malacca Shelf, and all site codes are the same as in Table 1.
It is noteworthy that the Andaman Sea, located along the west coast of Thailand, is a marginal sea at the boundary between the Indian and Pacific Oceans, characterized by a unique ecological background and geological history. The basin was formed during the late Eocene to Oligocene as a result of crustal extension related to the collision between the Indian and Eurasian plates [20]. During the late Miocene (c. 10–11 Mya), the trench-arc-basin system began to form and gradually stabilized throughout the Pliocene and Pleistocene [21]. Continued tectonic activity during the Quaternary further shaped the regional landscape and sedimentary environment [22]. During the transition from the late Pleistocene to the Holocene, dramatic sea level fluctuations strongly influenced land connections, species diversity and biogeographic patterns [1]. These dynamic tectonic and eustatic processes divided the Andaman Sea into the northern Myanmar Shelf and the southern Malacca Strait Shelf Provinces ([23], Figure 1). Geologically and geographically, the Myanmar Shelf features a wide and fragmented coastline dominated by muddy sand and mangrove/seagrass habitats. In contrast, the Malacca Strait has a narrow and steep continental shelf, with coarse sand, gravel coral reefs and rocky habitats [24]. Such long-term geomorphological, hydrodynamic, and ecological differences between these two marine ecoregions are likely to have shaped the phylogeographic patterns of benthic organisms, including sessile macroalgae.
The red algal genus Halymenia C. Agardh belongs to the family Halymeniaceae and contains at least 85 valid species recognized worldwide [25], with a typical triphasic life history (i.e. gametophyte, carposporophyte, and tetrasporophyte). Halymenia is particularly common in tropical and subtropical marine waters [26], and several species within the genus (e.g. H. durvillei Bory 1828) possess significant economic value due to extractable carrageenan and phycoerythrin [27,28]. Traditional taxonomy of Halymenia relied primarily on morphological features of vegetative organs (Tan et al. 2018). However, these characteristics can be strongly influenced by environmental conditions, leading to morphological convergence among different species and hence taxonomic confusion [29]. In recent years, integrating molecular and morphological evidence has shown particular promise for species identification and phylogenetic reconstruction in Halymenia [29,30]. Halymenia durvillei is a representative species of the genus in the Indo-Pacific, with distribution range extending from Southeast Asia to the eastern coast of Africa, Japan, Australia, and some Pacific islands [25,29]. This species typically grows on coral reefs or rocky substrates and can withstand strong wave action, showing both ecological significance and economic potential as a benthic foundation species.
In this study, we explored the phylogeographic patterns of H. durvillei along the Andaman coast of Thailand using mitochondrial cytochrome c oxidase subunit I (mtDNA cox1) and chloroplast ribulose-1,5-bisphosphate carboxylase/oxygenase large subunit (cpDNA rbcL). Specifically, we aimed to address the following questions: (i) Does H. durvillei exhibit detectable intraspecific lineage differentiation and population genetic structuring between the northern and southern Andaman Sea? (ii) Have ocean currents controlled by the Indochinese monsoon system [23] and sea-level fluctuations during the late Quaternary ice ages contributed to the phylogeographic history of H. durvillei? Answers to these questions not only advance our understanding of the origin and diversification of seaweed in Southeast Asia, but also provide practical guidelines for conservation decision-making of benthic seaweeds under climate change.
2. Materials and Methods
2.1. Collection, DNA Extraction, Amplification, and Sequencing
From 2018 to 2024, H. durvillei samples were collected from 20 sites along the coast of the Andaman Sea in Thailand (Table 1, Figure 1). For the site PHA1 (Lam Kean beach, Phangnga), samples were collected in five years (2019, 2021, 2022, 2023, 2024). For another site PHU25 (Tankhen Bay, Phuket), samples were also collected in six different periods (2018–2024, Table 1). Most populations were located from the eastern and western sides of Phuket Island, corresponding to the Myanmar and the Malacca Strait shelfs (Figure 1). At each site, 3–5 cm of fresh thalli free of epiphytes were cut from each individual. After collection, all samples were cleaned, dried, and preserved using silica gel. Total genomic DNA was extracted using the FastPure Plant DNA Extraction Mini Kit (Vazyme Biotech Co., Ltd., Nanjing, China) following the manufacturer’s instructions.
MtDNA cox1 and cpDNA rbcL have proven effective for distinguishing species and revealing phylogenetic relationships in Halymenia [29,30,31]. Accordingly, these two markers were selected to analyze phylogeographic diversity and population genetic structure of H. durvillei. Two primer sets, cox1-F (5′-GGAACACTTTAYTTAATTTTTGG-3′) and cox1-R (5′-TGRTATARAATTGGATCWCC-3′) [32], rbcL1-F (5′-AGAATGAACGCTATGAG-3′) and rbcL1-R (5′-GCTGTTTGTAGAGGACC-3′) (designed in this study), were used to amplify cox1 and rbcL, respectively. Polymerase chain reaction (PCR) amplification was carried out in a 50 μL reaction volume following Nguyen et al. (2023). PCR programs for amplifying cox1 and rbcL each consisted of an initial denaturation at 94 °C for 1 min, annealing at 50 °C for 1.5 min and extension at 72 °C for 1.5 min, followed by 35 cycles of denaturation at 94 °C for 1 min, annealing at 50 °C for 1.5 min, and extension at 72 °C for 1 min. A final extension was performed at 72 °C for 5 min. PCR products were checked using 1% agarose gel electrophoresis. After purification, amplification products were sent to Sangon Biotech (Shanghai, China) for bidirectional sequencing using the same primers described for the amplification.
2.2. Genetic Diversity and Population Structure
The obtained cox1 and rbcL sequences were manually trimmed using BioEdit 7.1.9.0 [33] and edited and aligned using MEGA 11 [34]. MtDNA cox1 and cpDNA rbcL haplotypes were identified using DnaSP 5.10 [35]. Genetic diversity indices, including the number of haplotypes (Nh), haplotype diversity (h), and nucleotide diversity (π), were calculated using Arlequin 3.5 [36]. Haplotype networks for cox1 and rbcL were constructed using Network 10.2.0.0 [37] to illustrate their evolutionary relationships.
Analysis of molecular variance (AMOVA) was conducted to partition the levels of genetic variation among groups, among populations within groups, and within populations. To minimize the bias caused by uneven sampling sizes, the eight populations with only one individual (PHU22, PHU23, PHU37, PHU14, PHU54, PHU19, PHU49, and PHU9) were excluded from the analyses. Two grouping criteria were applied for AMOVA partitioning. Criterion 1: sampling sites were divided into five groups according to geographic proximity – Group 1 (RNG1a and RNG2), Group 2 (PHA1, PHA4 and PHA8), Group 3 (TRA2 and TRA5), Group 4 (PHU31, PHU38, PHU50 and PHU51), and Group 5 (PHU25). Criterion 2: sampling sites were divided into two groups according to the marine ecoregion classification of the Myanmar Shelf and the Malacca Strait Shelf Provinces (Figure 1) – Group 1 (RNG1a, RNG2, PHA1, PHA4, PHA8, PHU51, PHU50 and PHU31), and Group 2 (TRA5, TRA2, PHU38 and PHU25).
The program Structure v2.3.4 [38] was used to infer potential genetic clustering of H. durvillei populations. To avoid potential bias caused by uneven population sizes among sampling sites, the eight populations with only one individual (PHU22, PHU23, PHU37, PHU14, PHU54, PHU19, PHU49, and PHU9) were removed from the clustering analysis. Genetic clustering was performed based on the identified cox1 and rbcL haplotypes. The number of clusters (K) was set from 1 to 5, with five independent runs for each K value. The Markov chain Monte Carlo (MCMC) simulation was run for 5×10⁶ iterations, with the first 5×10⁵ iterations discarded as burn-in. LnP(K) and ΔK [39] were computed using the online tool StructureSelector (https://lmme.ac.cn/StructureSelector/) to identify the optimal K value and generate clustering diagrams.
2.3. Gene Flow and Population Demographic History
Since mtDNA cox1 contained relatively richer phylogeographic information compared with cpDNA rbcL (see Results below), the cox1 dataset was used to estimate gene flow among populations using Migrate-n v5.0.4 [40]. To minimize the bias caused by uneven sample sizes, the eight populations with only one individual (PHU22, PHU23, PHU37, PHU14, PHU54, PHU19, PHU49, and PHU9) were removed from the analysis. The relatively stable genetic composition detected among a few consecutive years (see Table 1) allowed us to choose PHA1-2022 and PHU25-2023-07 that harboured the maximum number of cox1 haplotypes (see Table 1) as population representatives for estimation of migrants. We also specifically estimated potential ocean-driven migrants among adjacent sampling sites during the northeast monsoon season (November-April). The effective population size (θ = xNeμ, where Ne represents the effective population size, μ is the mutation rate per generation, and x equals 1 for organellar data) and the migration rate (M = m/μ, where m denotes the migration rate per generation) were substituted into the formula (Nm =θM/x) to calculate the effective number of migrants. The MCMC was run following the method described by [8].
Bayesian skyline plot (BSP) analysis was performed using BEAST v1.10.4 [41] to evaluate historical changes in effective population size of H. durvillei. The best-fit evolutionary model (GTR+F+G4) was selected using ModelFinder implemented in PhyloSuite v1.2.3 [42] based on the Akaike Information Criterion (AIC). The divergence time of Halymenia within the family Halymeniaceae (c. 170 million years ago (Mya)) was inferred from phylogenetic dating of red algal lineages [43] and then used as a calibration reference. A strict molecular clock was applied and the tree prior was set to the coalescent Bayesian skyline. The MCMC analysis was run for a total of 1×10⁷ generations, with the first 1×10⁶ generations discarded as burn-in. Sampling was performed every 1000 generations. The convergence was assessed in Tracer v1.7.2 [44]. When the effective sample size (ESS) values were greater than 200, the results were considered to have reached convergence.
3. Results
3.1. Population Genetic Diversity
A total of 333 mtDNA cox1 sequences were obtained from 20 sampling sites. After alignment and editing, the final cox1 dataset comprised 580 bp with 90 variable sites, yielding 11 haplotypes (C1–C11, GenBank accession numbers PZ816517–PZ816527) (Table 1). Haplotype C1 was the most abundant and geographically widespread across the Andaman coast of Thailand (Figure 1a). Six haplotypes (C6–C11) were private, with C6-C8 restricted to Phuket Island, while three haplotypes C9–C11 were endemic to Phangnga (Pakarang Cape: PHA4). Haplotypes C2–C4 were only found in the Tankhen Bay, Phuket (PHU25) and the Lam Kaen beach, Phangnga (PHA1), and C6–C8 also solely occurred in Nakalay beach, Racha Noi (southeast coast Bay) and Koh He (South), Phuket, respectively, while C9 was only found in Pakarang Cape, Phangnga (PHA4) (Figure 1a, Table 1).
For cpDNA rbcL, 333 sequences (1242 bp after alignment) contained 98 variable sites and resolved four haplotypes (R1–R4, GenBank accession numbers PZ816513–PZ816516) in total. Among them, R1 was the most abundant haplotype, occurring in 19 sites (Figure 1b). Haplotype R2 was found at Lam Kean beach, Phangnga (PHA1-2022), Koh He (South), Phuket (PHU14) and Tankhen Bay, Phuket (PHU25), while R3 and R4 were private to Phangnga (Pakarang Cape: PHA4 and Lam Kaen beach: PHA1-2024, respectively) (Figure 1b). Haplotype network revealed cox1 haplotypes separated by 1–45 bp and rbcL haplotypes by 1–63 bp (Figure 1). Excluding singleton sites (e.g. PHU23, PHU51), the highest cox1 haplotype (h=0.6667) and nucleotide (π=0.056322×10⁻²) diversity occurred in the population RNG2 from Koh Kham, Koh Phayam, Ranong, followed by the populations PHU25-2018 and PHU25-2023-07 from Tankhen Bay, Phuket. In comparison, rbcL revealed the highest haplotype (h=0.5000) and nucleotide (π=0.033011×10⁻²) diversity in PHU25-2018 (Table 1). In the Myanmar Shelf, the site PHA1 harboured high numbers of haplotypes (C1–C4, C10–C11). In the Strait of Malacca Shelf, the site PHU25 from Tankhen Bay, Phuket exhibited relatively rich haplotype (C1–C4) diversity (Table 1).
3.2. Population Genetic Structure
AMOVA for both cox1 and rbcL indicated no significant genetic variation among groups. Instead, most genetic variation (90.28%–98.63%) resided within populations, with 3.23%–12.57% occurring among populations within groups (Table 2). Bayesian Structure analysis (optimal K=2) partitioned H. durvillei populations into two genetic clusters (K=2, Figure 2a–2b). The cox1-based analysis revealed low admixture in populations from Koh Phayam, Ranong (RNG2), Phangnga (i.e. PHA1, PHA4, PHA8), and Tankhen Bay, Phuket (PHU25), suggesting limited gene flow rather than genetic recombination or introgression (Figure 2c–2d).
3.3. Gene Flow and Population Demographic History
MtDNA cox1-derived migration analysis revealed clear asymmetric gene flows among 12 populations along the Andaman coast of Thailand (Figure 3a). Most populations (RNG1a, RNG2, PHA4, PHU50, PHU51, PHU38, and TRA5) served as both sources and sinks, with bidirectional genetic migrations. In the Myanmar Shelf, the highest effective number of migrants (Nm=89.14) was detected from PHU31 to PHU51, far exceeding the reverse direction (Nm=0.27). Similarly, effective migrants from PHU31 in the Myanmar Shelf to PHU38 in the Strait of Malacca Shelf (Nm=64.57) were nearly 250 times higher than the reverse (Nm=0.2591). In contrast, the populations PHA1, PHU31, PHU25, and TRA2 mainly acted as sources rather than sinks of migration, with very limited migrants received (Figure 3a). Genetic exchange of numbers of migrants and directions among adjacent populations during the northeast monsoon season (Figure 3b) were broadly similar to the patterns detected in Figure 3a.
4. Discussion
4.1. Population Genetic Diversity Along the Andaman Sea
Both mtDNA cox1 and cpDNA rbcL revealed no genetic structuring and low population differentiation in H. durvillei along the Andaman coast of Thailand (Figure 1, Table 1). Such an intraspecific genetic diversity is notably lower than that of its congener H. malaysiana from Malaysia and the Philippines (cox1: h=0.574±0.085; rbcL: h=0.551±0.090) and nucleotide diversity (cox1: π=0.00395±0.00085; rbcL: π=0.00165±0.00027) [29]. However, the observed genetic diversity aligns with patterns reported for other macroalgae in the Indo-Western Pacific [8,16,45]. For example, the red seaweed Gracilaria salicornia harboured low-to-moderate haplotype (h=0.356–0.760) and nucleotide diversity (π=0.00081–0.00261) across the TMP, despite its populations in the Andaman Sea having higher genetic diversity than those in the Gulf of Thailand [19]. Similar population differentiation patterns were also reported in the red macroalgal congeners Bostrychia tenella [17] and B. binderi [18]. In this region, low population genetic diversity has also been documented in the brown macroalga Sargassum plagiophyllum C.Agardh (cox1: h=0.000–0.489, π=0.00000–0.00090) [8] and the green macroalga H. macroloba (tufA: h=0.000–0.343, π=0.000–0.041) [16]. The exception is S. polycystum, which exhibits moderate genetic diversity (cox1: h=0.000–0.583, π=0.000–0.156; cox3: h=0.000–0.655, π=0.000–0.329; cox1+cox3: h=0.314–0.739, π=0.033–0.182) [8], likely due to its broader distribution across the TMP. These series of phylogeographic evidence, together with gene-flow patterns observed in other macroalgae [8,45], imply that ocean-circulation mediated migration interacted with physical barriers such as the biogeographic break north to Phuket province [17], likely played a dominant role in shaping phylogeographic homogeneity along the Andaman Sea.
4.2. Glacial Refugium and Demographic History
Marine glacial refugia, characterized by high genetic diversity and endemism [46,47], are critical for species survival during sea-level fluctuations. During the glacial maximum, extensive exposure of the continental shelf around the Andaman Sea due to around 130-meter of sea-level decline resulted in the compression and fragmentation of large coastal habitats [48]. Such a tectonic re-configuration led to marine species with narrow habitat preferences to be isolated in scattered refugia [4]. In this study, BSP analysis revealed a relatively stable effective population size from 125 Mya to 15 Mya, followed by a sharp demographic contraction from 15 Mya to c. 2 Mya and a progressive expansion during the early Pleistocene (Figure 4). Such a dynamic demography history is consistent with the classic “glacial contraction–interglacial expansion” refugium model [4,8,47]. The presence of endemic cox1 haplotypes (C2–C4) in the population PHU25 (Tankhen Bay) suggests that isolated habitats in the northern Malacca Strait [5,8,49] served as a marine refugium for H. durvillei during the maximum ice extent [6]. Postglacial expansion of H. durvillei outward from glacial refugium was likely driven by ocean currents along the Andaman coast (see discussion below) [8,16,17,45].
However, the demographic estimates for H. durvillei (Figure 4) were much earlier than those reported in other macroalgae in Southeast Asia. For instance, the brackish-water red alga Gracilaria tenuistipitata was documented to expand its distribution range and population size during the middle Pleistocene [50]. The brown algae S. polycystum and S. plagiophyllum experienced demographic expansion from 0.015 Mya to 0.060 Mya, corresponding to the late Pleistocene [8]. These dissimilar results imply that marine macroalgae across the TMP may respond differently in magnitude to paleo-climate change and oceanographic fluctuations. The stable demographic phase (125–15 Mya) may ascribe to extensive, well-connected shallow-water habitats available in the Andaman Sea prior to 15 Mya. During this period, regional tectonic configuration was relatively quiescent, and the Alcock and Sewell Rises were still joined to the continental margin of Sundaland [20]. Such a habitat continuity likely favoured the long-term persistence of H. durvillei populations in the Andaman Sea. The sharp demographic contraction at c. 15 Mya coincides with a major tectonic re-organization in the Andaman Sea. During the early middle Miocene to the earliest late Miocene (c. 15–10 Mya), the previously conjoined Alcock and Sewell Rises began to rift away from the Sundaland margin, forming the east Andaman basin [20,21]. This rifting event fragmented the once continuous shallow-marine habitats, reducing the area and connectivity of suitable substrata for benthic macroalgae such as H. durvillei. The subsequent prolonged population size decline (15–2 Mya) likely reflects persistent habitat instability through the late Miocene and Pliocene. During this interval, regional stress field rotated from east–west extension to NNW–SSE transtension, accompanied by intensified strike-slip faulting along the South Sagaing Fault and other structures [21]. The demographic expansion at c. 2 Mya corresponds to the onset of the early Pleistocene. This period was characterized by high-amplitude glacial–interglacial sea-level fluctuations, which repeatedly exposed and flooded the Sunda Shelf and reshaped coastal marine habitats [1] to facilitate H. durvillei to expand its distribution range.
4.3. Ocean Circulation and Phylogeographic Homogenization
Genetic exchange during the northeast monsoon season show similar patterns to the whole years (Figure 3), indicating that the strong circulations produced driven by this seasonal monsoon considerably shaped the dispersal mode of H. durvillei populations along the Andaman coast of Thailand. The observed phylogeographic homogeneity in H. durvillei likely arises from interactions between ocean circulation and historical biogeographic barriers [8,16,17,45]. For example, the biogeographic break north of Phuket [17] may act as a partial filter, while the Andaman Sea’s dynamic currents (e.g. the North Indian Ocean and Malacca Strait currents) facilitate gene flow. These currents generate coastal upwelling and mixing [51], enabling both short-distance propagule dispersal and long-distance rafting of vegetative fragments [52]. Similar mechanisms have been proposed for Bostrychia tenella [17] and Gracilaria spp. [19], underscoring the role of oceanography in shaping genetic connectivity across the region.
5. Conclusions
The low genetic diversity and phylogeographic homogeneity of H. durvillei highlight vulnerabilities to climate change and anthropogenic pressures. Conservation strategies should prioritize in-situ protection of unique genotypes (e.g. cox1 haplotypes C6–C9) and critical populations (e.g. PHU25, PHA1), which exhibit high diversity and endemism. The gene flow patterns along the Andaman Sea driven by ocean current during the northeast monsoon season also highlight geographic areas where populations were bi-directionally and/or multi-directionally connected, providing additional information for marine spatial management. A network of marine protected areas (MPAs) could leverage the bidirectional gene flow patterns identified here to maintain connectivity. Future studies should integrate dispersal modeling (e.g. Lagrangian particle simulations [53] and multigenerational dispersal probabilities [54] to quantify how ocean currents and habitat continuity shape genetic structure, informing targeted management of this ecologically significant species.
Acknowledgments
This work was supported by National Natural Science Foundation of China (32371697 and 32411540227) and start-up funds from the Outstanding Talent Program at Yantai University and Thailand Research Fund (RDG6130002).
References
- Woodruff, D.S. Biogeography and conservation in Southeast Asia: how 2.7 million years of repeated environmental fluctuations affect today’s patterns and the future of the remaining refugial-phase biodiversity. Biodiver. Conserv. 2010, 19, 919–941. [Google Scholar] [CrossRef]
- Veron, J.E.N.; Devantier, L.M.; Turak, E.; Green, A.L.; Kininmonth, S.; Stafford-Smith, M.; Peterson, N. Delineating the Coral Triangle. Galaxea J. Coral Reef. Stu. 2009, 11, 91–100. [Google Scholar] [CrossRef]
- Carpenter, K.E.; Barber, P.H.; Crandall, E.D.; Ablan-Lagman, M.C.A.; Ambariyanto; Mahardika, G.N.; Manjaji-Matsumoto, B.M.; Juinio-Meñez, M.A.; Santos, M.D.S.; Starger, C.J.; Toha, A.H.A. Comparative phylogeography of the coral triangle and implications for marine management. J. Mar. Biol. 2011, 2011, 1–14. [Google Scholar] [CrossRef]
- Hu, Z.M.; Kantachumpoo, A.; Liu, R.Y.; Sun, Z.M.; Yao, J.T.; Komatsu, T.; Uwai, S.; Duan, D.L. A late Pleistocene marine glacial refugium in the south-west of Hainan Island, China: Phylogeographical insights from the brown alga Sargassum polycystum. J. Biogeogr. 2018, 45, 355–366. [Google Scholar] [CrossRef]
- Wee, A.K.S.; Noreen, A.M.E.; Ono, J.; Takayama, K.; Kumar, P.P.; Tan, H.T.W.; Saleh, M.N.; Kajita, T.; Webb, E.L. Genetic structures across a biogeographical barrier reflect dispersal potential of four Southeast Asian mangrove plant species. J. Biogeogr. 2020, 47, 1258–1271. [Google Scholar] [CrossRef]
- Wee, A.K.S.; Takayama, K.; Asakawa, T.; Thompson, B.; Onrizal; Sungkaew, S.; Tung, N.X.; Nazre, M.; Soe, K.K.; Tan, H.T.W.; Watano, Y.; Baba, S.; Kajita, T.; Webb, E.L. Oceanic currents, not land masses, maintain the genetic structure of the mangrove Rhizophora mucronate Lam. (Rhizophoraceae) in Southeast Asia. J. Biogeogr. 2014, 41, 954–964. [Google Scholar] [CrossRef]
- Chan, B.K.K.; Tsao, Y.F.; Wangkulangkul, K.; Amjud, K.; Sukparangsi, W. Biogeography and biodiversity of the intertidal barnacle Tetraclita species in the Gulf of Thailand and Andaman Sea influences of oceanographic currents and Pleistocene glaciations. Front. Mar. Sci. 2022, 8, 774041. [Google Scholar] [CrossRef]
- Zhang, T.Y.; Wang, Q.Q.; Sun, Z.M.; Draisma, S.G.A.; Hu, Z.M. Comparative phylogeographic patterns and processes of the incipient brown seaweeds Sargassum polycystum and S. plagiophyllum around the Thai-Malay Peninsula. Front. Plant Sci. 2025, 16, 1673650. [Google Scholar] [CrossRef] [PubMed]
- Macdonald, D.W.; Chiaverini, L.; Bothwell, H.M.; Kaszta, Z.; Ash, E.; Bolongon, G.; Can, O.E.; Campos-Arceiz, A.; Channa, P.; Clements, G.R.; Hearn, A.J.; Hedges, L.; Htun, S.; Kamler, J.F.; Macdonald, E.A.; Moore, J.; Naing, H.; Onuma, M.; Rasphone, A.; Rayan, D.M.; Ross, J.; Singh, P.; Tan, C.K.W.; Wadey, J.; Yadav, B.P.; Cushman, S.A. Predicting biodiversity richness in rapidly changing landscapes: climate, low human pressure or protection as salvation? Biodiver. Conserv. 2020, 29, 4035–4057. [Google Scholar] [CrossRef]
- Pfingstl, T.; Lienhard, A.; Shimano, S.; Yasin, Z.B.; Shau-Hwai, A.T.; Jantarit, S.; Petcharad, B. Systematics, genetics, and biogeography of intertidal mites (Acari, Oribatida) from the Andaman Sea and Strait of Malacca. J. Zool. Syst. Evol. Res. 2019, 57, 91–112. [Google Scholar] [CrossRef] [PubMed]
- Tanzil, J.T.I.; Lee, J.N.; Brown, B.E.; Quax, R.; Kaandorp, J.A.; Lough, J.M.; Todd, P.A. Luminescence and density banding patterns in massive Porites corals around the Thai-Malay Peninsula, Southeast Asia. Limnol. Oceanogr. 2016, 61, 2003–2026. [Google Scholar] [CrossRef]
- DeVantier, L.; Turak, E. Species richness and relative abundance of reef-building corals in the Indo-West Pacific. Diversity 2017, 9, 25. [Google Scholar] [CrossRef]
- Supmee, V.; Songrak, A.; Suppapan, J.; Sangthong, P. Population genetic structure of ornate threadfin bream (Nemipterus hexodon) in Thailand. Trop. Life Sci. Res. 2021, 32, 63–82. [Google Scholar] [CrossRef] [PubMed]
- Wichachucherd, B.; Prathep, A.; Zuccarello, G.C. Phylogeography of Padina boryana (Dictyotales, Phaeophyceae) around the Thai-Malay Peninsula. Eur. J. Phycol. 2014, 49, 313–323. [Google Scholar] [CrossRef]
- Pongparadon, S.; Zuccarello, G.C.; Phang, S.M.; Kawai, H.; Hanyuda, T.; Prathep, A. Diversity of Halimeda (Chlorophyta) from the Thai–Malay Peninsula. Phycologia 2015, 54, 349–366. [Google Scholar] [CrossRef]
- Wang, Q.Q.; Zhang, T.Y.; Liu, Y.J.; Nguyen, X.V.; Sun, Z.M.; Draisma, S.G.A.; Hu, Z.M. Low phylogeographic diversity in the calcified green macroalga Halimeda macroloba (Bryopsidales) in Southeast Asia. Algae 2025, 40, 1–10. [Google Scholar] [CrossRef]
- Bulan, J.; Maneekat, S.; Zuccarello, G.C.; Muangmai, N. Phylogeographic patterns in cryptic Bostrychia tenella species (Rhodomelaceae, Rhodophyta) across the Thai-Malay Peninsula. Algae 2022, 37, 123–133. [Google Scholar] [CrossRef]
- Muangmai, N.; Klomjit, A.; Maneekat, S.; Chirapart, A.; Zuccarello, G.C. Comparative phylogeography and genetic connectivity of cryptic Bostrychia binderi (Rhodomelaceae, Ceramiales) species across Southeast Asia. Phycologia 2026, 2026, 1–10. [Google Scholar]
- Muangmai, N.; Maneekat, S.; Chirapart, A.; Zuccarello, G.C. Contrasting patterns of genetic diversity and population discontinuity in the common red seaweed Gracilaria salicornia (Gracilariaceae) along the coasts of Thailand. Phycologia 2023, 62, 452–461. [Google Scholar] [CrossRef]
- Curray, J.R. Tectonics and history of the Andaman Sea region. J. Asian Earth Sci. 2005, 25, 187–232. [Google Scholar] [CrossRef]
- Morley, C.K. Cenozoic structural evolution of the Andaman Sea: evolution from an extensional to a sheared margin. Geol. Soc. Lond. Spec. Publ. 2015, 431, 39–61. [Google Scholar] [CrossRef]
- Diehl, T.; Waldhauser, F.; Cochran, J.R.; Kamesh Raju, K.A.; Seeber, L.; Schaff, D.; Engdahl, E.R. Back-arc extension in the Andaman Sea: Tectonic and magmatic processes imaged by high-precision teleseismic double-difference earthquake relocation. JGR Solid Earth 2013, 118, 2206–2224. [Google Scholar] [CrossRef]
- Wangkulangkul, K.; Meksuwan, P.; Stankovic, M. The role of monsoon-driven oceanographic variability in recruitment patterns of key intertidal space occupiers on tropical rocky shores on the west coast of Thailand, Indian Ocean. Hydrobiologia 2023, 850, 3565–3579. [Google Scholar] [CrossRef] [PubMed]
- Brewer, D.; Hayes, D.; Lyne, V.; Donovan, A.; Skewes, T.; Milton, D.; Murphy, N. An ecosystem characterisation of the Bay of Bengal. BOBLME-2015-Ecology-13 2015, xvii+287. [Google Scholar]
- Guiry, M.D.; Guiry, G.M. AlgaeBase. World-wide electronic publication, National University of Ireland, Galway. 2026. Available online: http://www.algaebase.org (accessed on 19 March 2026).
- Fantonalgo, R.N. Preliminary study on biogeography and diversity of red alga Halymenia in Manila Bay, Philippines. Ann. Geogr. Stud. 2018, 1, 1–10. [Google Scholar] [CrossRef]
- Kho, F.B.; Orbita, M.L.S.; Manting, M.E.M.; Orbita, R.R. Carrageenan and biochemical composition of three species of Halymenia (Halymenia durvillaea Bory de Saint-Vincent, Halymenia maculata J. Agardh and Halymenia dilatata Zanardini) in Initao, Misamis Oriental, Mindanao, Philippines. Int. J. Biosci. 2016, 8, 182–189. [Google Scholar]
- Sathuvan, M.; Sakthivel, M.; Babu, G.V.; Palani, P.; Rengasamy, R. Qualitative and quantitative determination of R-phycoerythrin from Halymenia floresia (Clemente) C. Agardh by polyacrylamide gel using electrophoretic elution technique. J. Chromatogr. A 2016, 1454, 120–126. [Google Scholar] [CrossRef] [PubMed]
- Tan, P.L.; Lim, P.E.; Lin, S.M.; Phang, S.M.; Draisma, S.G.A.; Liao, L.M. A genetic diversity assessment of Halymenia malaysiana (Halymeniaceae, Rhodophyta) from Malaysia and the Philippines based on COI-5P and rbcL sequences. J. Appl. Phycol. 2018, 30, 3445–3454. [Google Scholar] [CrossRef]
- Nguyen, X.-V.; Nguyen-Nhat, N.-T.; Nguyen, X.-T.; Nguyen, T.-H.; Truong, S.H.T.; Dao, V.-H.; Do, A.-D.; McDermid, K.J. New record of Halymenia malaysiana (Halymeniaceae, Rhodophyta) from Viet Nam, and its genetic diversity in the western Pacific. Bot. Mar. 2023, 66, 113–123. [Google Scholar] [CrossRef]
- Tan, P.L.; Lim, P.E.; Lin, S.M.; Phang, S.M.; Draisma, S.G.A.; Liao, L.M. Foliose Halymenia species (Halymeniaceae, Rhodophyta) from Southeast Asia, including a new species, Halymenia malaysiana sp. nov. Bot. Mar. 2015, 58, 203–217. [Google Scholar] [CrossRef]
- Hebert, P.D.N.; Cywinska, A.; Ball, S.L.; deWaard, J.R. Biological identifications through DNA barcodes. Proc. Roy. Soc. B Biol. Sci. 2003, 270, 313–321. [Google Scholar] [CrossRef] [PubMed]
- Hall, T.A. BioEdit: a user-friendly biological sequence alignment editor and analysis program for windows 95/98/NT. Nucleic Acid. Symp. Ser. 1999, 41, 95–98. [Google Scholar]
- Kumar, S.; Stecher, G.; Li, M.; Knyaz, C.; Tamura, K. MEGA11: Molecular Evolutionary Genetics Analysis version 11. Mol. Biol. Evol. 2021, 38, 3022–3027. [Google Scholar] [CrossRef] [PubMed]
- Librado, P.; Rozas, J. DnaSP v5: a software for comprehensive analysis of DNA polymorphism data. Bioinformatics 2009, 25, 1451–1452. [Google Scholar] [CrossRef] [PubMed]
- Excoffier, L.; Lischer, H.E.L. Arlequin suite ver 3.5: a new series of programs to perform population genetics analyses under Linux and Windows. Mol. Ecol. Res. 2010, 10, 564–567. [Google Scholar] [CrossRef] [PubMed]
- Bandelt, H.J.; Forster, P.; Röhl, A. Median-joining networks for inferring intraspecific phylogenies. Mol. Biol. Evol. 1999, 16, 37–48. [Google Scholar] [CrossRef] [PubMed]
- Pritchard, J.K.; Stephens, M.; Donnelly, P. Inference of population structure using multilocus genotype data. Genetics 2000, 155, 945–959. [Google Scholar] [CrossRef] [PubMed]
- Evanno, G.; Regnaut, S.; Goudet, J. Detecting the number of clusters of individuals using the software structure: a simulation study. Mol. Ecol. 2005, 14, 2611–2620. [Google Scholar] [CrossRef] [PubMed]
- Beerli, P.; Mashayekhi, S.; Sadeghi, M.; Khodaei, M.; Shaw, K. Population genetic inference with MIGRATE. Curr. Protoc. Bioinform. 2019, 68, e87. [Google Scholar] [CrossRef] [PubMed]
- Suchard, M.A.; Lemey, P.; Baele, G.; Ayres, D.L.; Drummond, A.J.; Rambaut, A. Bayesian phylogenetic and phylodynamic data integration using BEAST 1.10. Virus Evol. 2018, 4, vey016. [Google Scholar] [CrossRef] [PubMed]
- Zhang, D.; Gao, F.; Jakovlić, I.; Zou, H.; Zhang, J.; Li, W.X.; Wang, G.T. PhyloSuite: An integrated and scalable desktop platform for streamlined molecular sequence data management and evolutionary phylogenetics studies. Mol. Ecol. Res. 2020, 20, 348–355. [Google Scholar] [CrossRef] [PubMed]
- Yang, E.C.; Boo, S.M.; Bhattacharya, D.; Saunders, G.W.; Knoll, A.H.; Fredericq, S.; Graf, L.; Yoon, H.S. Divergence time estimates and the evolution of major lineages in the Florideophyte red algae. Sci. Rep. 2016, 6, 21361. [Google Scholar] [CrossRef] [PubMed]
- Rambaut, A.; Drummond, A.J.; Xie, D.; Baele, G.; Suchard, M.A. Posterior summarization in Bayesian phylogenetics using Tracer 1.7. Syst. Biol. 2018, 67, 901–904. [Google Scholar] [CrossRef] [PubMed]
- Lin, Y.D.; Zhang, J.; Du, Y.Q.; Zhang, S.S.; Liu, L.; Draisma, S.G. A.; Duan, D.L. Marine conditions in Andaman Sea shape the unique genetic structure of Sargassum plagiophyllum C. Agardh. J. Appl. Phycol. 2023, 36, 501–511. [Google Scholar] [CrossRef]
- Maggs, C.A.; Castilho, R.; Foltz, D.; Henzler, C.; Jolly, T.; Kelly, J.; Olsen, J.; Perez, K.E.; Stam, W.; Väinölä, R. Evaluating signatures of glacial refugia for North Atlantic marine organisms. Ecology 2008, 89, S108–S122. [Google Scholar] [CrossRef] [PubMed]
- Marko, P.B.; Hoffman, J.M.; Emme, S.A.; Mcgovern, T.M.; Keever, C.C.; Nicole Cox, L. The ‘Expansion–Contraction’ model of Pleistocene biogeography: rocky shores suffer a sea change? Mol. Ecol. 2010, 19, 146–169. [Google Scholar] [CrossRef] [PubMed]
- Hanebuth, T.J.J.; Voris, H. K.; Yokoyama, Y.; Saito, Y.; Okuno, J. Formation and fate of sedimentary depocentres on Southeast Asia’s Sunda Shelf over the past sea-level cycle and biogeographic implications. Earth-Sci. Rev. 2011, 104, 92–110. [Google Scholar] [CrossRef]
- Cannon, C.H.; Morley, R.J.; Bush, A.B.G. The current refugial rainforests of Sundaland are unrepresentative of their biogeographic past and highly vulnerable to disturbance. Proc. Nat. Acad. Sci. USA 2009, 106, 11188–11193. [Google Scholar] [CrossRef] [PubMed]
- Nguyen, T.V.; Boo, G.H. Genetic variability and phylogeography of the tropical brackish water species, Gracilaria tenuistipitata (Gracilariales, Rhodophyta). Algae 2025, 40, 15–27. [Google Scholar] [CrossRef]
- Rizal, S.; Damm, P.; Wahid, M.A.; Sundermann, J.; Ilham syah, Y.; Iskandar, T.; Muhammad. General circulation in the Malacca Strait and Andaman Sea: a numerical model study. Am. J. Environ. Sci. 2012, 8, 479–488. [Google Scholar] [CrossRef]
- Hoffmann, A.J. Dispersal in seaweeds. Bot. Mar. 1987, 30, 1–14. [Google Scholar]
- Buonomo, R.; Assis, J.; Fernandes, F.; Engelen, A.H.; Airoldi, L.; Serrao, E.A. Habitat continuity and stepping-stone oceanographic distances explain population genetic connectivity of the brown alga Cystoseira amentacea. Mol. Ecol. 2017, 26, 766–780. [Google Scholar] [CrossRef] [PubMed]
- Jahnke, M.; Jonsson, P.R.; Moksnes, P.O.; Loo, L.O.; Jacobi, M.N.; Olsen, J.L. Seascape genetics and biophysical modelling support conservation of the seagrass Zostera marina in the Skagerrak-Kattegat region of the eastern North Sea. Evol. Appl. 2018, 11, 645–661. [Google Scholar] [CrossRef] [PubMed]
Figure 2.
Bayesian genetic clustering of Halymenia durvillei based on mitochondrial cox1 and chloroplast rbcL haplotype datasets. ΔK values for the cox1 (a) and rbcL (b), with K values ranging from 1 to 5. Individual ancestry assignment of H. durvillei populations based on cox1 (c) and rbcL (d) at the optimal K=2.
Figure 2.
Bayesian genetic clustering of Halymenia durvillei based on mitochondrial cox1 and chloroplast rbcL haplotype datasets. ΔK values for the cox1 (a) and rbcL (b), with K values ranging from 1 to 5. Individual ancestry assignment of H. durvillei populations based on cox1 (c) and rbcL (d) at the optimal K=2.
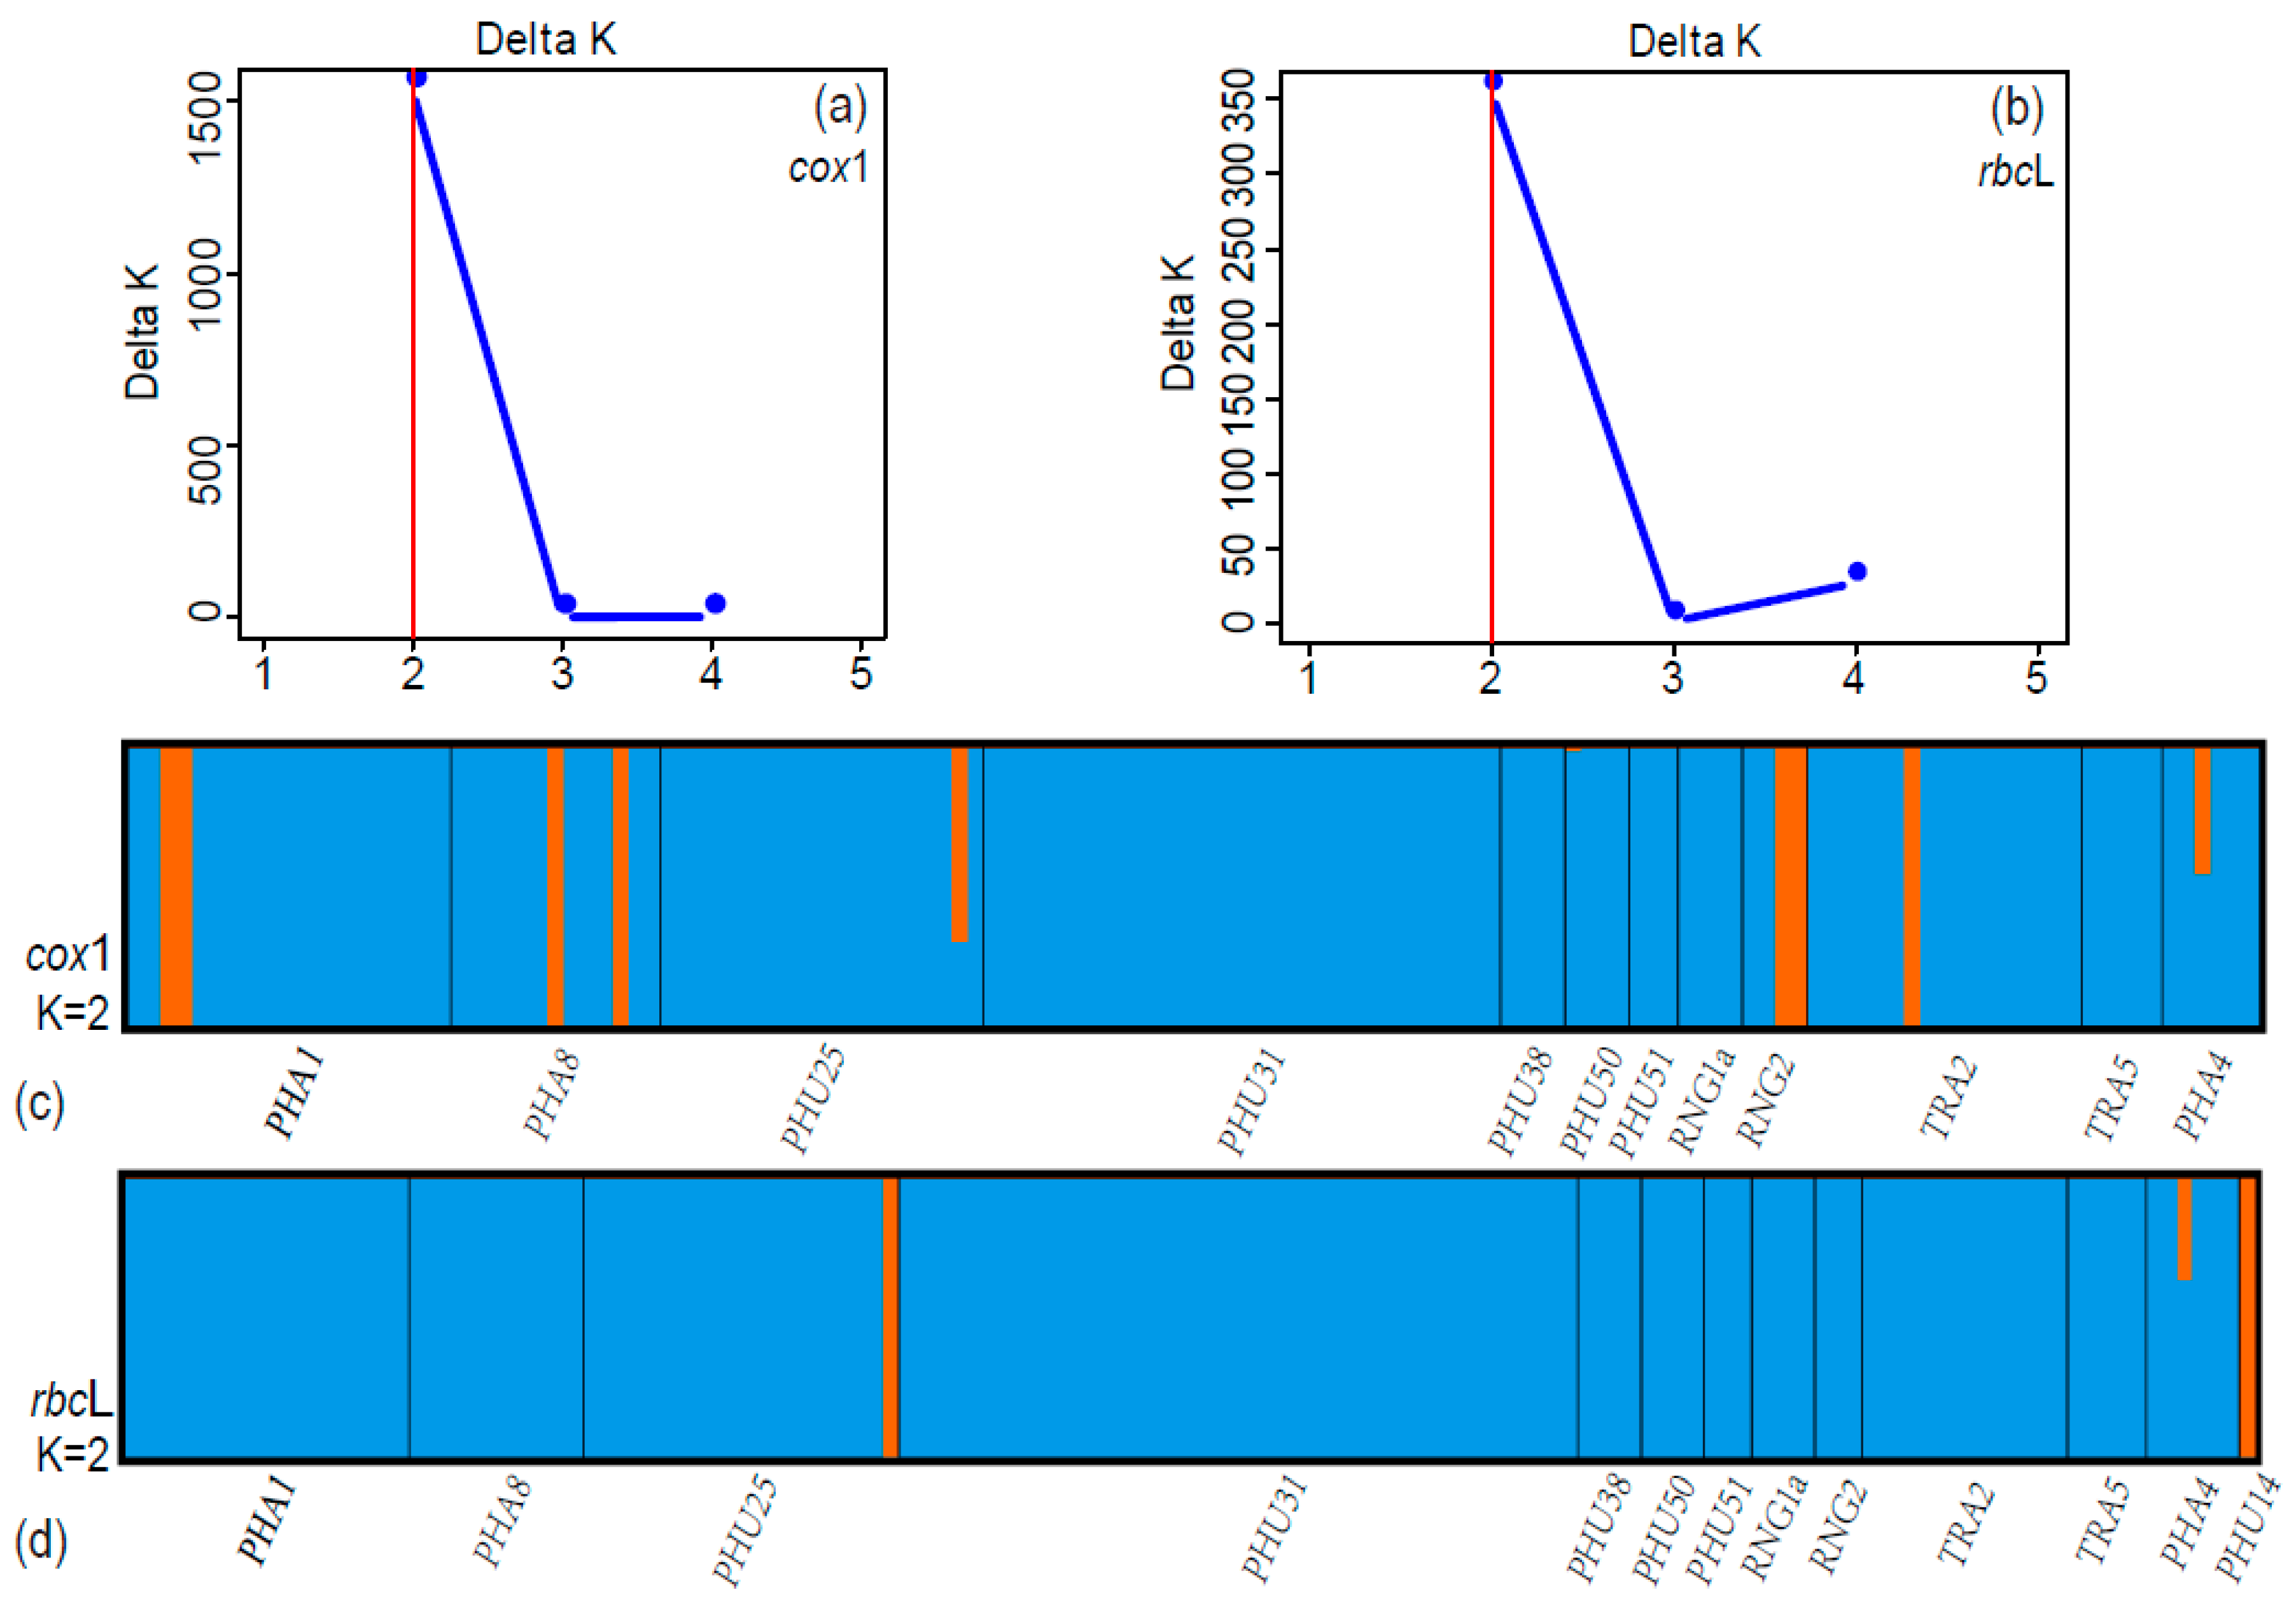
Figure 3.
Asymmetric gene flow patterns estimated among 12 H. durvillei populations along the Andaman coast of Thailand based on mitochondrial cox1 (a). Gene flow patterns were also specifically estimated among the northeast monsoon season (b). Arrows indicate the direction of migration between populations. Numerical values represent the number of effective migrants per generation (Nm). Population codes are the same as in Table 1.
Figure 3.
Asymmetric gene flow patterns estimated among 12 H. durvillei populations along the Andaman coast of Thailand based on mitochondrial cox1 (a). Gene flow patterns were also specifically estimated among the northeast monsoon season (b). Arrows indicate the direction of migration between populations. Numerical values represent the number of effective migrants per generation (Nm). Population codes are the same as in Table 1.
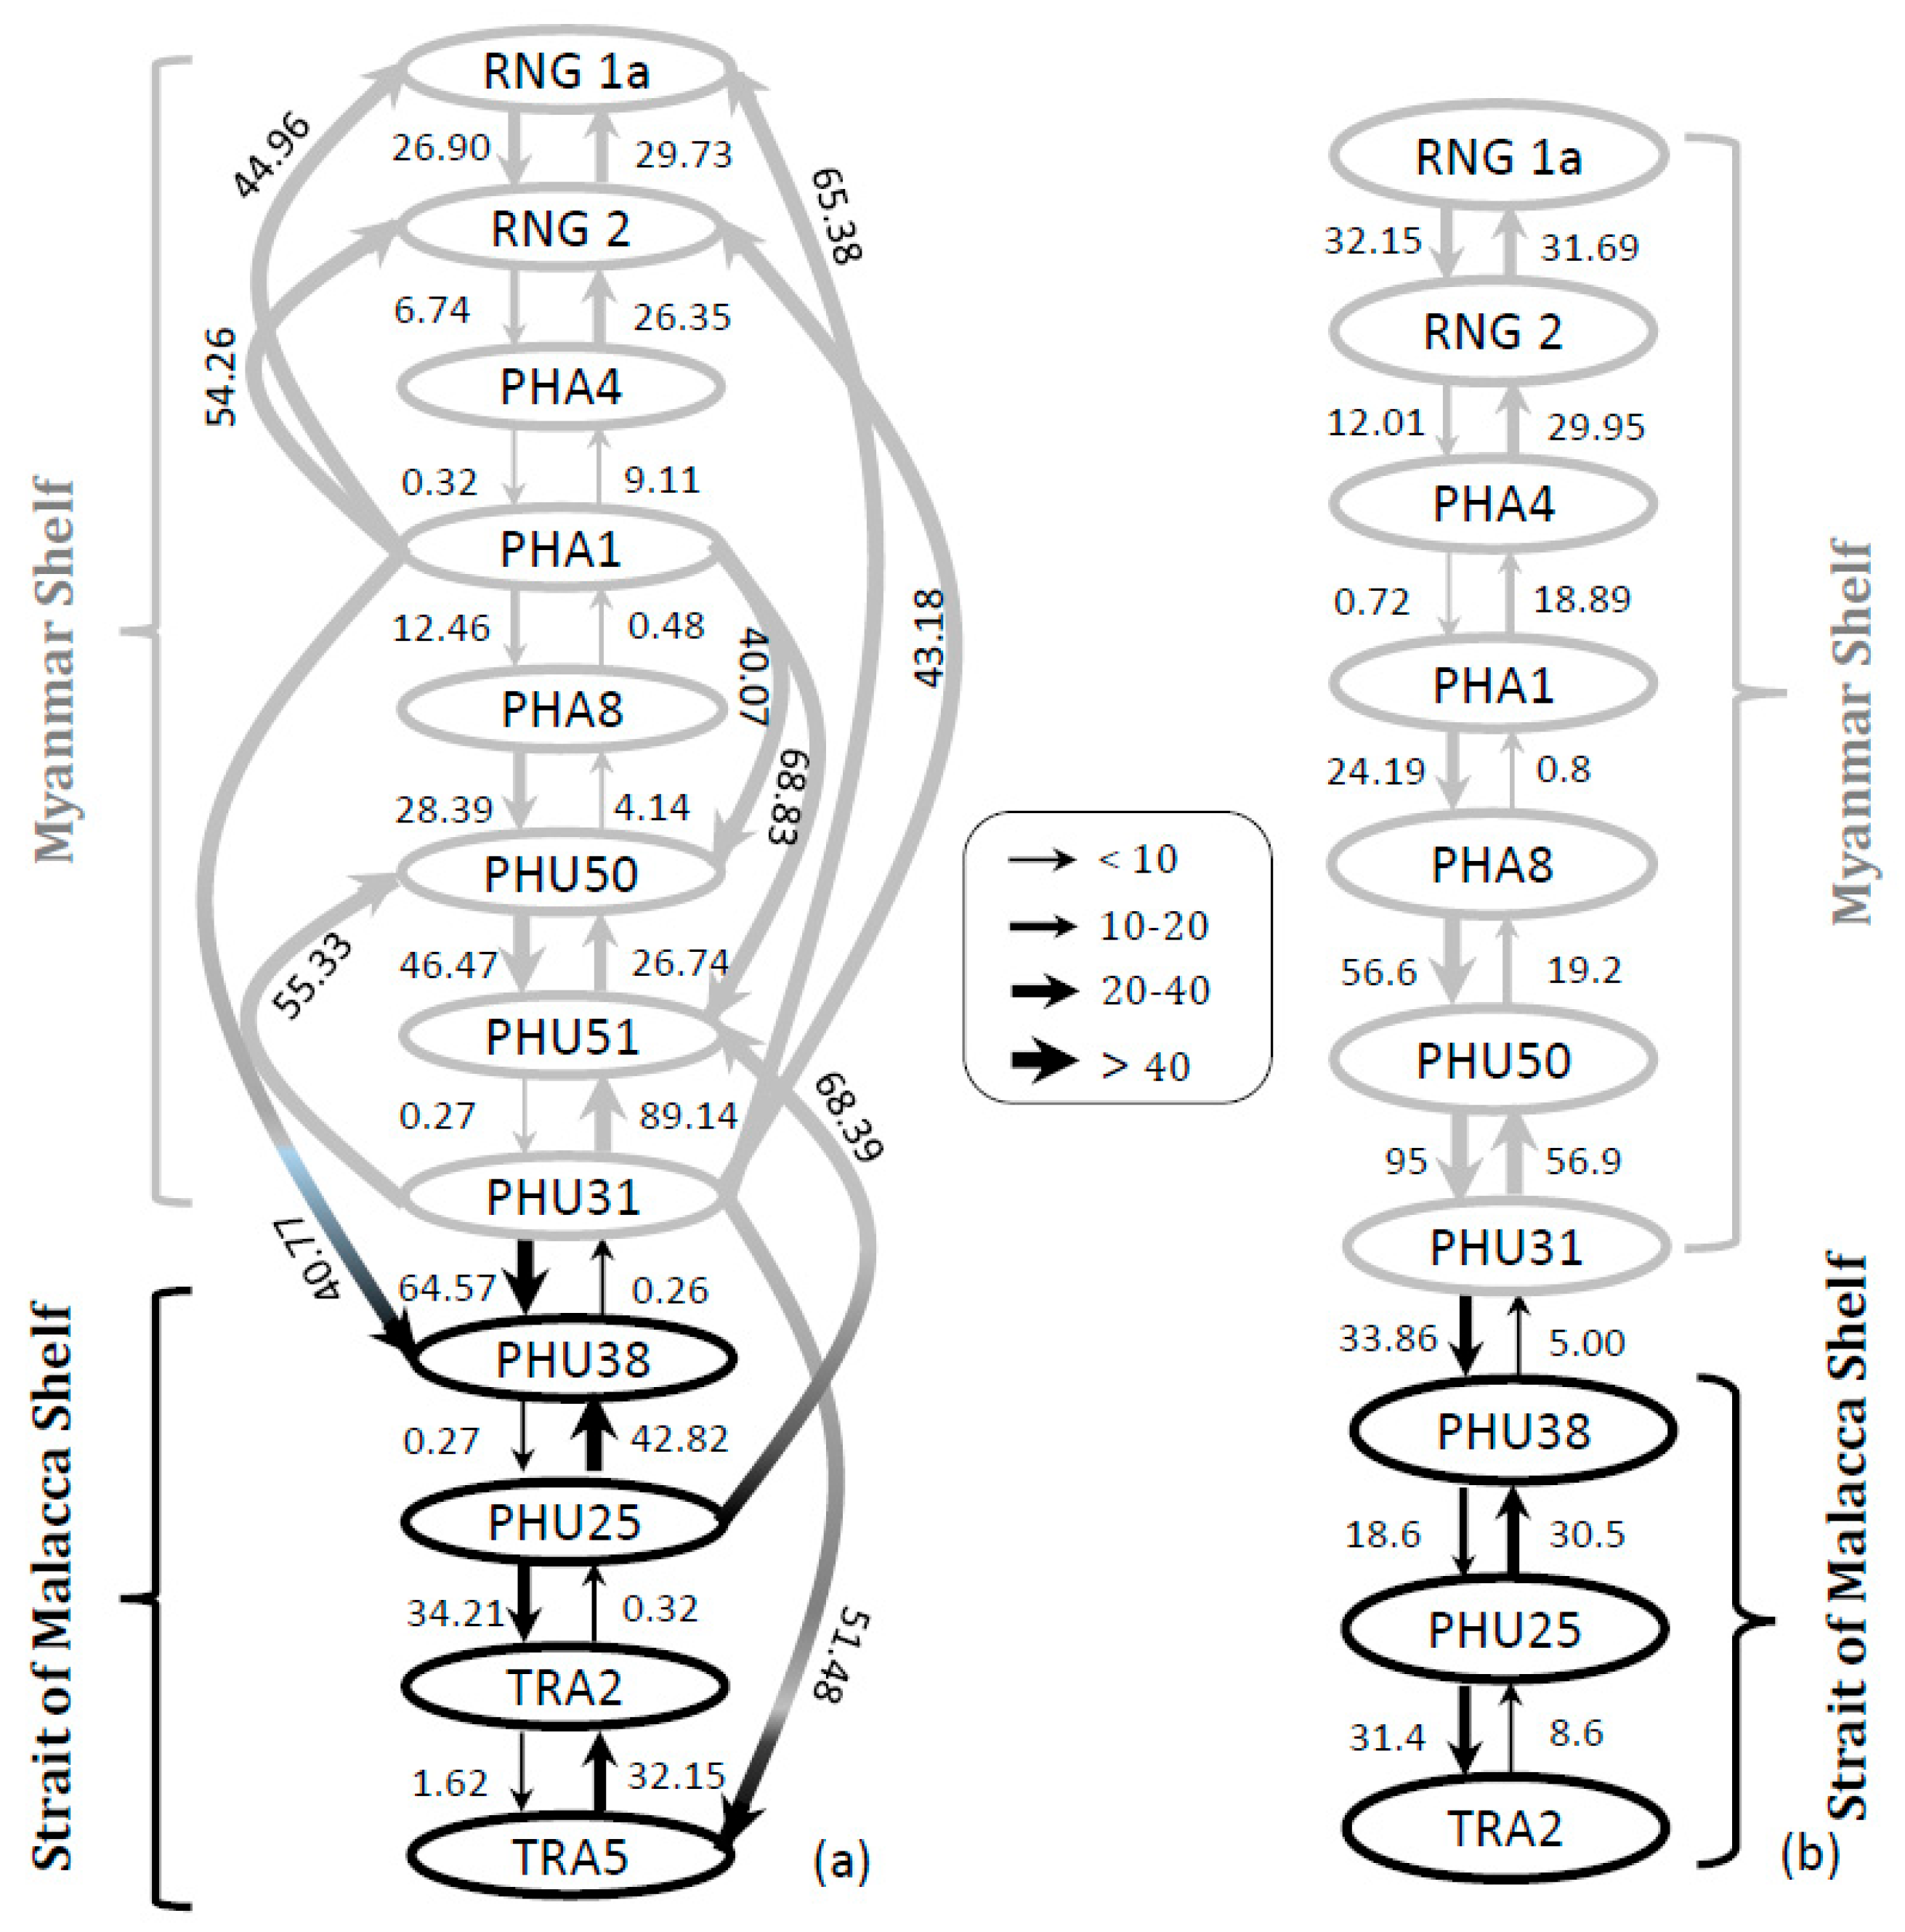
Figure 4.
Bayesian Skyline Plot (BSP) inferred for Halymenia durvillei along the Andaman coast of Thailand based on mitochondrial cox1. The x-axis represents time before present in million years ago (Mya). The y-axis indicates the effective population size (expressed as Ne × generation time). The solid line shows the median value of effective population size through time, and the shaded area represents the 95% highest posterior density (HPD) interval.
Figure 4.
Bayesian Skyline Plot (BSP) inferred for Halymenia durvillei along the Andaman coast of Thailand based on mitochondrial cox1. The x-axis represents time before present in million years ago (Mya). The y-axis indicates the effective population size (expressed as Ne × generation time). The solid line shows the median value of effective population size through time, and the shaded area represents the 95% highest posterior density (HPD) interval.
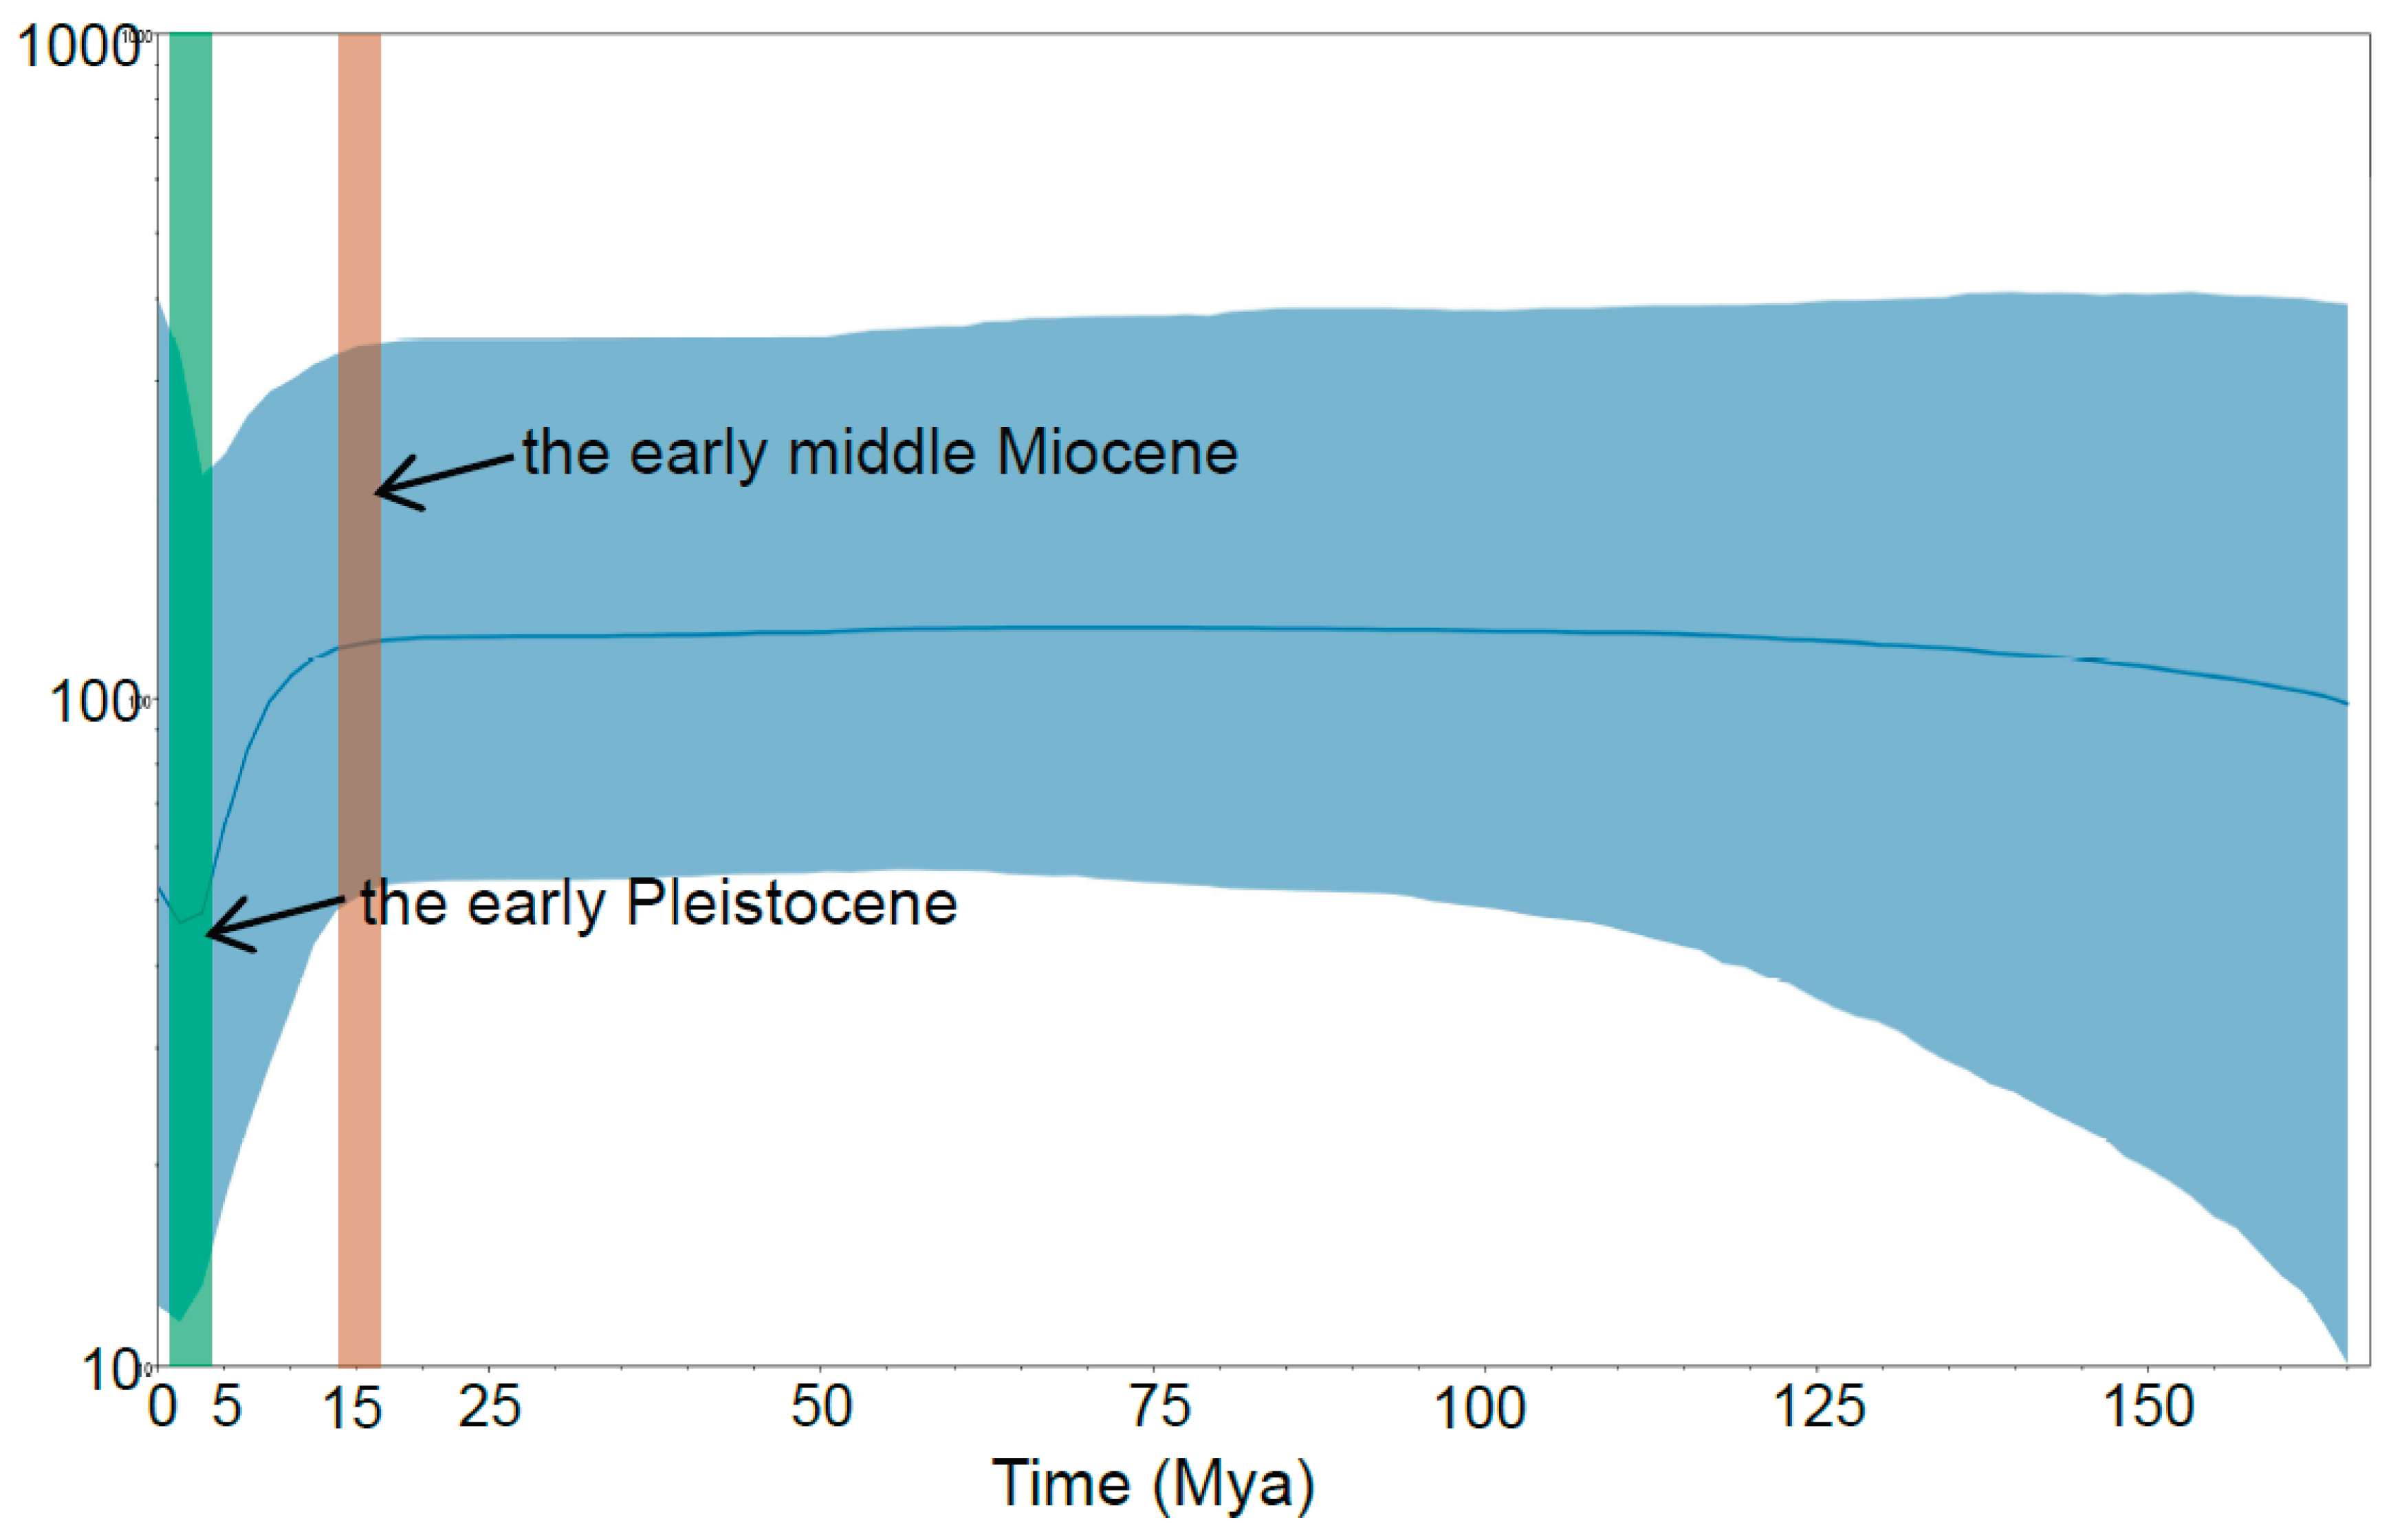

Table 1.
Population genetic diversity indices of Halymenia durvillei inferred from mtDNA cox1 and cpDNA rbcL.
Table 1.
Population genetic diversity indices of Halymenia durvillei inferred from mtDNA cox1 and cpDNA rbcL.
| No. | Code | Sampling locality (year-month) | Coordinates | cox1 | rbcL | ||||
| n/Nh | h | π(×10-2) | n/Nh | h | π(×10-2) | ||||
| The Myanmar Shelf | |||||||||
| 1 | RNG1a | Ao Khao Kwai (north side), Koh Phayam, Ranong, Thailand (2023-04) | 9°45’47”N,98°24’5”E | 4/C1 | 0 | 0 | 4/R1 | 0 | 0 |
| 2 | RNG2 | Koh Kham, Koh Phayam, Ranong, Thailand (2023-04) | 9°42’49”N,98°25’34”E | 4/C1,C5 | 0.6667 | 0.056322 | 3/R1 | 0 | 0 |
| 3 | PHA4 | Pakarang Cape, Phangnga, Thailand (2023-04) | 8°44’18”N,98°13’6”E | 6/C1,C9 | 0.3333 | 0.017241 | 6/R1,R3 | 0.3333 | 0.009125 |
| 4 | PHA1 | Lam Kaen beach, Phangnga, Thailand (2019-12) | 8°36’59”N,98°14’7”E | 30/C1,C3 | 0.0667 | 0.000115 | 30/R1 | 0 | 0 |
| Lam Kaen beach, Phangnga, Thailand (2021-10) | 8°36’59”N,98°14’7”E | 1/C1 | 1 | 0 | 1/R1 | 1 | 0 | ||
| Lam Kaen beach, Phangnga, Thailand (2022-04) | 8°36’59”N,98°14’7”E | 33/C1,C2,C3,C10 | 0.1742 | 0.010025 | 31/R1,R2 | 0.0645 | 0.000052 | ||
| Lam Kaen beach, Phangnga, Thailand (2023-04) | 8°36’59”N,98°14’7”E | 29/C1,C3 | 0.0690 | 0.000119 | 29/R1 | 0 | 0 | ||
| Lam Kaen beach, Phangnga, Thailand (2024-02) | 8°36’59”N,98°14’7”E | 30/C1,C3,C4,C11 | 0.1908 | 0.000337 | 29/R1,R4 | 0 | 0 | ||
| 5 | PHA8 | Poseidon beach, Lam Kaen, Phang-nga, Thailand (2023-04) | 8°36’2”N,98°14’19”E | 13/C1,C5 | 0.2821 | 0.023828 | 11/R1 | 0 | 0 |
| 6 | PHU23 | NaiYang beach (S. end), Phuket, Thailand | 8°5′14”N,98°17′3”E | 1/C1 | 1 | 0 | 1/R1 | 1 | 0 |
| 7 | PHU50 | Nakalay beach, Phuket, Thailand (2021-04) | 7°55’223”N,98°16’30”E | 4/C1,C6 | 0.5 | 0.000862 | 4/R1 | 0 | 0 |
| 8 | PHU51 | Karon Noi (Le Meridien), Phuket, Thailand (2021-10) | 7°51’49.5”N,98°16’43”E | 3/C1 | 0 | 0 | 3/R1 | 0 | 0 |
| 9 | PHU22 | Kata beach, Phuket, Thailand | 7°49′22″N, 98°17′23″E | 1/C1 | 1 | 0 | 1/R1 | 1 | 0 |
| 10 | PHU31 | Ao Sane beach, Phuket, Thailand (2021-04) | 7°46’37”N,98°17’47”E | 32/C1 | 0 | 0 | 43/R1 | 0 | 0 |
| 11 | PHU49 | Merlin beach (Marriot hotel), Phuket, Thailand | 7°52’51”N,98°16’15”E | 1/C1 | 1 | 0 | 1/R1 | 1 | 0 |
| The Strait of Malacca Shelf | |||||||||
| 12 | PHU37 | Koh Kaeo Noi (West), Phuket, Thailand | 7°44’10”N,98°17’44”E | 1/C1 | 1 | 0 | 2/R1 | 0 | 0 |
| 13 | PHU38 | Koh Kaeo Noi (East), Phuket, Thailand (2020-03) | 7°44’11”N,98°17’55”E | 4/C1 | 0 | 0 | 4/R1 | 0 | 0 |
| 14 | PHU14 | Koh He (South), Phuket, Thailand | 7°44’32”N,98°22’22”E | 1/C8 | 1 | 0 | 1/R2 | 1 | 0 |
| 15 | PHU19 | Koh Thanan (North), Phuket, Thailand | 7°48’9”N,98°22’41”E | 1/C1 | 1 | 0 | 1/R1 | 1 | 0 |
| 16 | PHU25 | Tankhen Bay, Phuket, Thailand (2018-12) | 7°48’45”N,98°24’27”E | 4/C1,C4 | 0.5000 | 0.046552 | 4/R1,R2 | 0.5000 | 0.033011 |
| Tankhen Bay, Phuket, Thailand (2019) | 7°48’45”N,98°24’27”E | 7/C1 | 0 | 0 | 7/R1 | 0 | 0 | ||
| Tankhen Bay, Phuket, Thailand (2022-04) | 7°48’45”N,98°24’27”E | 19/C1,C2 | 0.1053 | 0.000181 | 19/R1 | 0 | 0 | ||
| Tankhen Bay, Phuket, Thailand (2023-04) | 7°48’45”N,98°24’27”E | 22/C1 | 0 | 0 | 22/R1 | 0 | 0 | ||
| Tankhen Bay, Phuket, Thailand (2023-07) | 7°48’45”N,98°24’27”E | 31/C1,C2,C3 | 0.3398 | 0.000615 | 30/R1 | 0 | 0 | ||
| Tankhen Bay, Phuket, Thailand (2024-03) | 7°48’45”N,98°24’27”E | 27/C1 | 0 | 0 | 26/R1 | 0 | 0 | ||
| 17 | PHU9 | Koh Bida Nok, Krabi, Thailand | 7°44′23″N,98°46′5E | 1/C1 | 1 | 0 | 1/R1 | 1 | 0 |
| 18 | PHU54 | Southeast coast Bay, Racha Noi, Phuket, Thailand | 7°27’51”N,98°18’27”E | 1/C7 | 1 | 0 | 1/R1 | 1 | 0 |
| 19 | TRA2 | Koh Waen (West), Trang, Thailand (2020-01) | 7°22’46”N,99°14’46”E | 17/C1,C5 | 0.1176 | 0.009939 | 13/R1 | 0 | 0 |
| 20 | TRA5 | Koh Mook (NW), Trang, Thailand (2022-04) | 7°23’11”N,99°16’55”E | 5/C1 | 0 | 0 | 5/R1 | 0 | 0 |
n, number of sequences; Nh, number of haplotypes; h, haplotype diversity; π, nucleotide diversity.
Table 2.
Analysis of molecular variance (AMOVA) to partition genetic variance in Halymenia durvillei based on mtDNA cox1 and cpDNA rbcL under two different grouping criteria.
Table 2.
Analysis of molecular variance (AMOVA) to partition genetic variance in Halymenia durvillei based on mtDNA cox1 and cpDNA rbcL under two different grouping criteria.
| Among groups | Among populations within groups | Within populations | |||||||
| d.f. | Var(%) | ɸCT | d.f. | Var(%) | ɸSC | d.f. | Var(%) | ɸST | |
| cox1 (criterion 1) | 4 | -2.85 | -0.02851 | 7 | 12.57 | 0.12221*** | 156 | 90.28 | 0.09718*** |
| rbcL (criterion 1) | 4 | -10.12 | -0.10119 | 8 | 11.40 | 0.10353*** | 313 | 98.72 | 0.01282** |
| Among groups | Among populations within groups | Within populations | |||||||
| d.f. | Var(%) | ɸCT | d.f. | Var(%) | ɸSC | d.f. | Var(%) | ɸST | |
| cox1 (criterion 2) | 1 | -3.70 | -0.03704 | 10 | 12.24 | 0.11802*** | 156 | 91.46 | 0.08535*** |
| rbcL (criterion 2) | 1 | -1.85 | -0.01853 | 11 | 3.23 | 0.03167* | 313 | 98.63 | 0.01373** |
d.f.: degree of freedom, Var(%):percentage of variation, ***: P<0.001; **: P<0.01; *: P<0.05.
Disclaimer/Publisher’s Note: The statements, opinions and data contained in all publications are solely those of the individual author(s) and contributor(s) and not of MDPI and/or the editor(s). MDPI and/or the editor(s) disclaim responsibility for any injury to people or property resulting from any ideas, methods, instructions or products referred to in the content. |
© 2026 by the authors. Licensee MDPI, Basel, Switzerland. This article is an open access article distributed under the terms and conditions of the Creative Commons Attribution (CC BY) license (http://creativecommons.org/licenses/by/4.0/).
Copyright: This open access article is published under a Creative Commons CC BY 4.0 license, which permit the free download, distribution, and reuse, provided that the author and preprint are cited in any reuse.